Epigenetic memory independent of symmetric histone inheritance
- University of California, Berkeley, United States
Figures
Figure 1 with 5 supplements
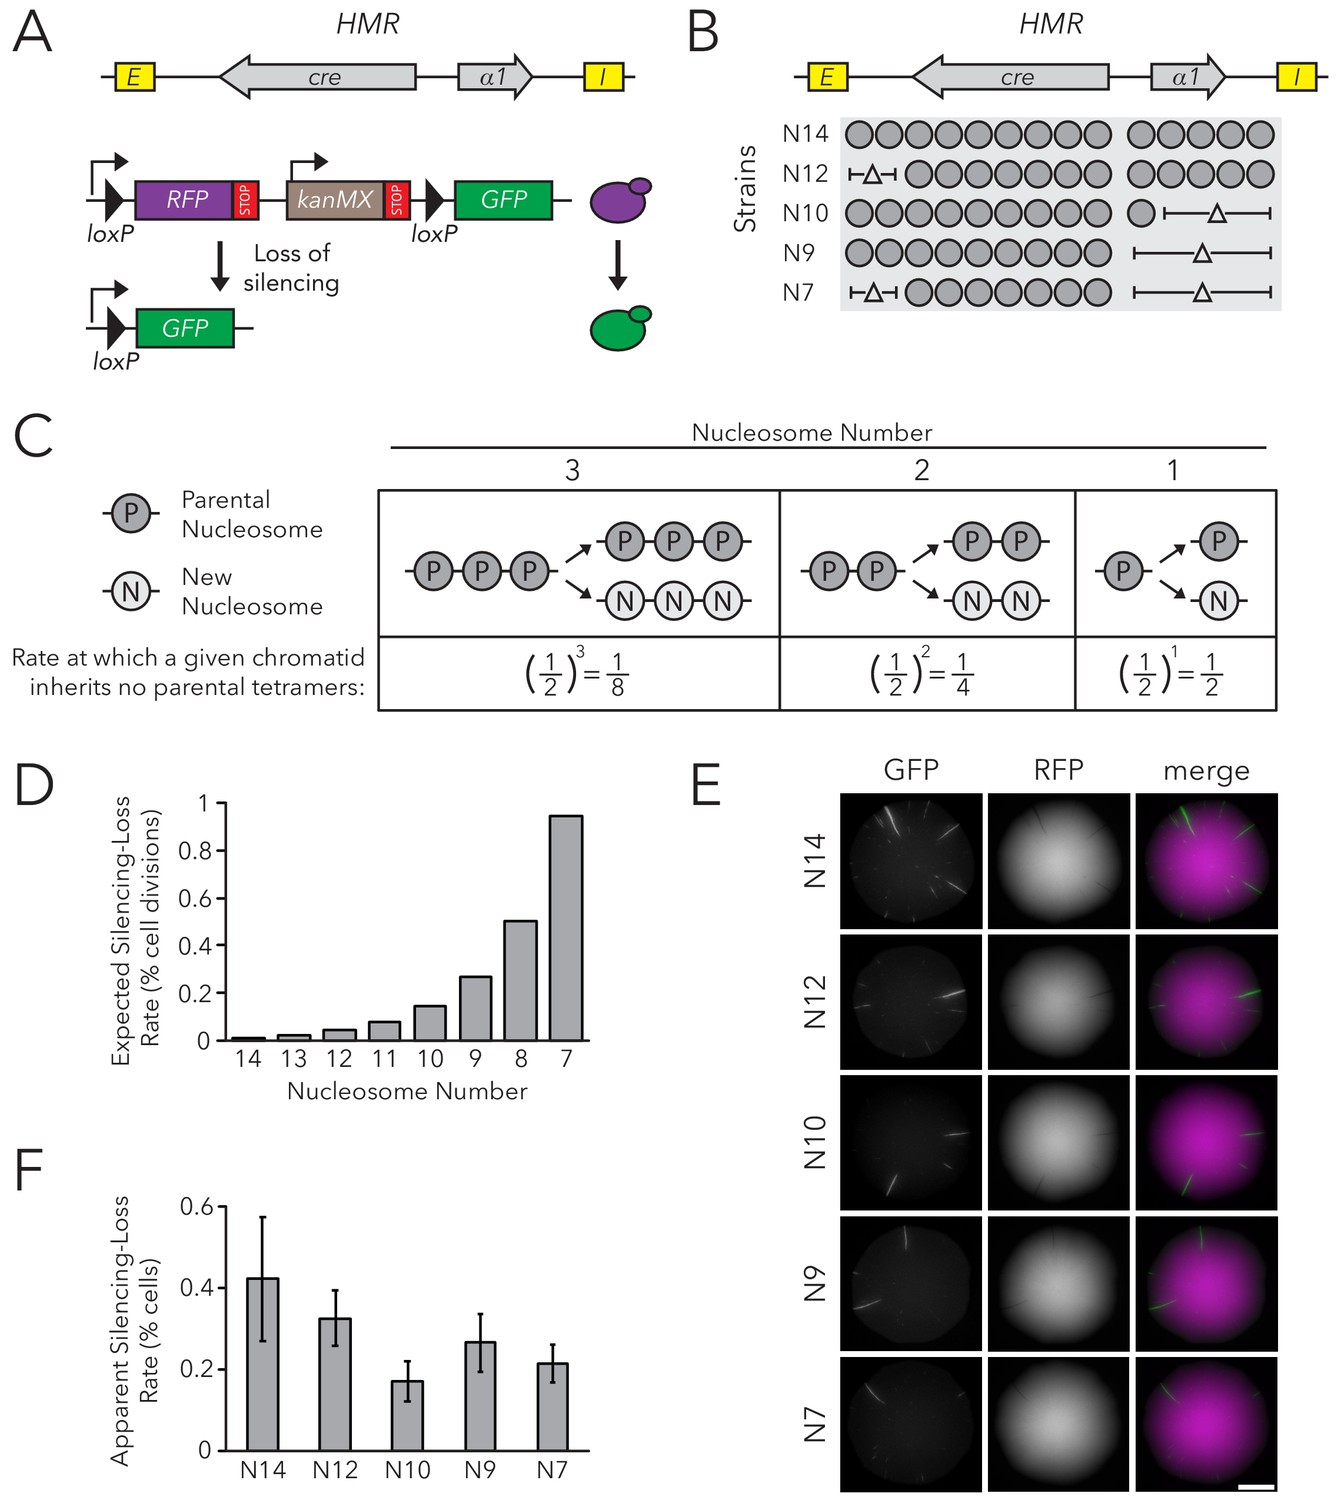
Chromatin Domain Size Did Not Affect Silencing-Loss Rates.
(A) Schematic of the Cre-Reported Altered States of Heterochromatin (CRASH) assay (Dodson and Rine, 2015). HMRα::cre contains the E and I silencers, the α1 gene, and a cre transgene. Transient loss of silencing at HMRα::cre causes Cre-mediated recombination of loxP sites in a RFP-GFP cassette. This process creates a permanent, heritable switch from RFP to GFP expression. (B) Diagram of nucleosomes in HMRα::cre. Fourteen nucleosomes were present in full-length HMRα::cre, which we term Strain N14 (JRY11471). Combinations of nucleosomal DNA were deleted to change the size of HMRα::cre; the smallest allele contained seven nucleosomes (Strain N7) (JRY11540). Nucleosome positions were determined by MNase-Seq as shown in Figure 1—figure supplement 1. (C) Schematic of how random segregation of parental H3-H4 tetramers to daughter chromatids could cause silencing loss. Under the model that inheritance of a single marked H3-H4 tetramer to a daughter chromatid would be sufficient to propagate the silenced state, the chance that a daughter chromatid inherits no parental tetramers and loses the silenced state would be 0.5 ^ (the number of nucleosomes in the chromatin domain). Parental nucleosomes contain inherited H3-H4 tetramers, whereas new nucleosomes contain newly synthesized H3-H4 tetramers. Hypothetical chromatin domains of different sizes are provided for comparison. (D) Expected loss-of-silencing rates for different sizes of HMRα::cre. (E) Representative CRASH colonies for Strains N14 through N7. Because loss of silencing leads to a heritable switch from RFP to GFP expression, progeny of a cell that loses silencing will form a GFP sector; the frequency of sectors in a colony represents the frequency at which that strain loses silencing. Scale bar, 2 mm. (F) Quantification of apparent silencing-loss rates, as described in Materials and methods. Data are means ± SD (n = 6 independent cultures). ANOVA and Tukey tests were used to test statistical significance. Only strains N10 and N7 were significantly different (p<0.05) than N14. Data are presented as a scatter plot in Figure 1—figure supplement 2.
Figure 1—figure supplement 1
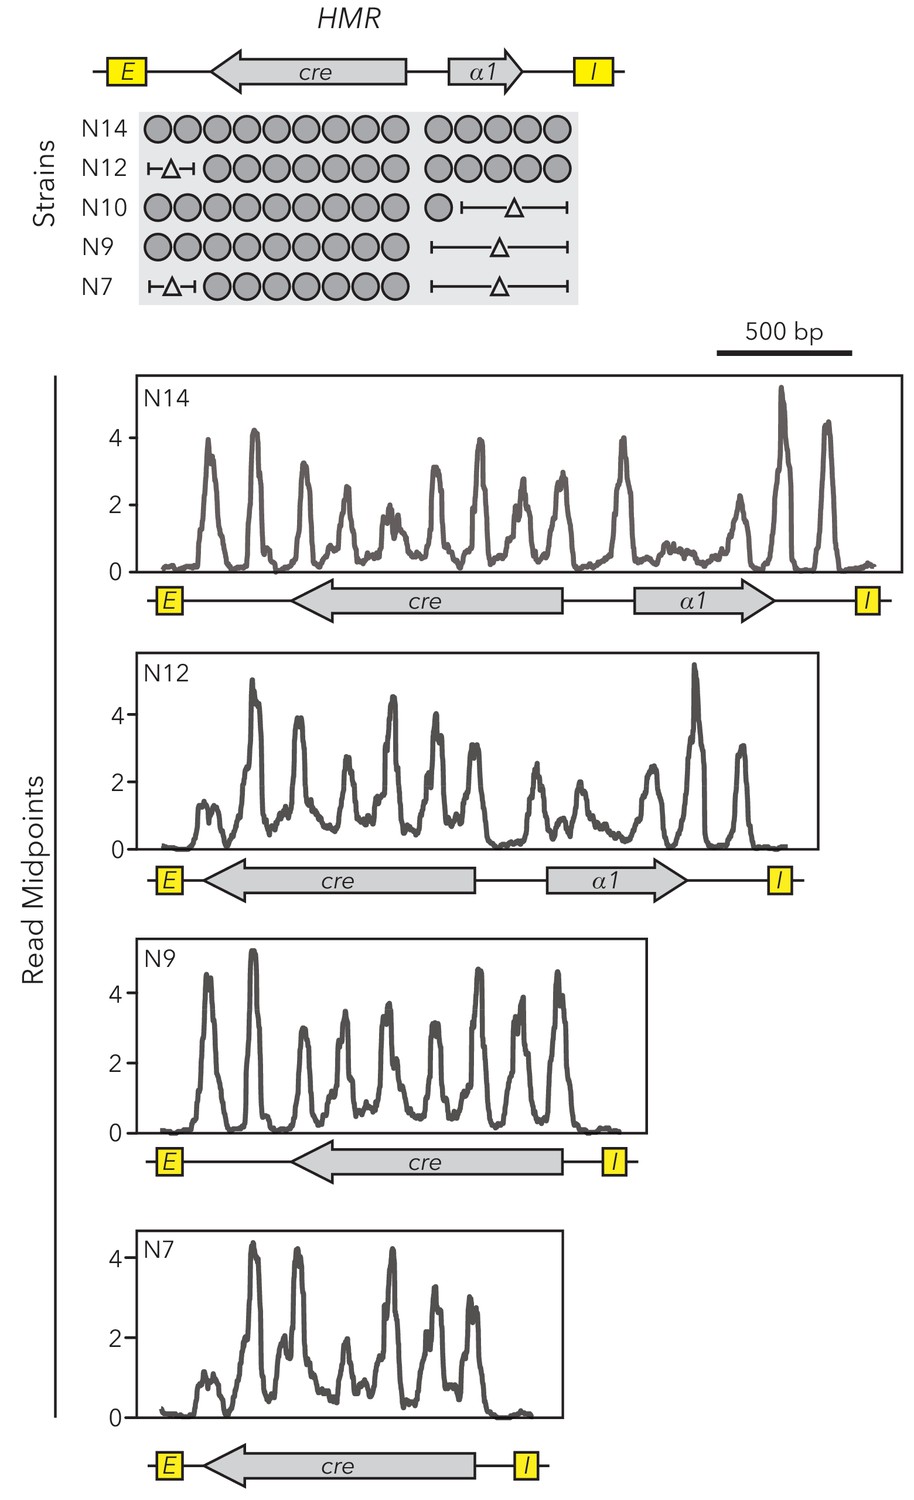
Nucleosome set deletions did not affect positions of remaining nucleosomes.
MNase-Seq was performed on strains with different sizes of HMRα::cre. Midpoints of nucleosome-sized fragments were calculated, plotted, and smoothed.
Figure 1—figure supplement 2

Chromatin domain-size of HMRα::cre had minimal effects on silencing.
Data represent means of apparent silencing-loss rates (n = 6 independent cultures) from Figure 1F, presented as a scatter plot.
Figure 1—figure supplement 3
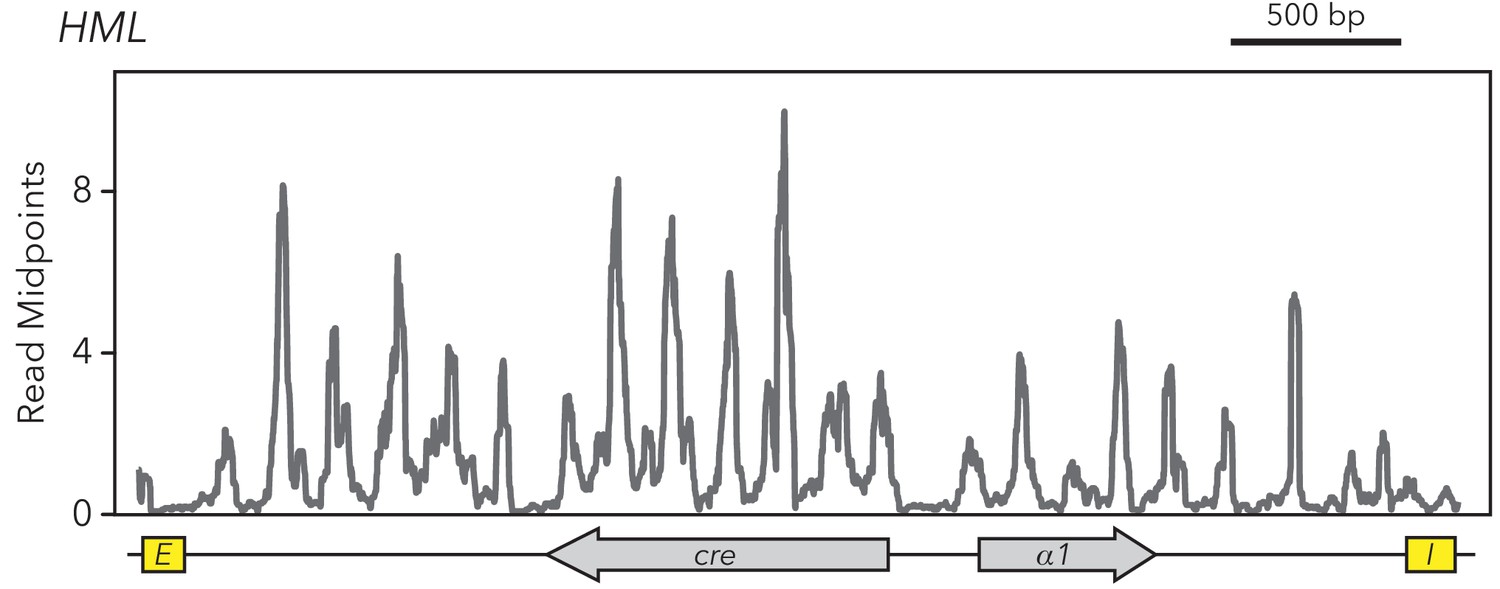
HMLα::cre contained 22 nucleosomes.
MNase-Seq was performed on the strain with full-length HMLα::cre (JRY11259). Midpoints of nucleosome-sized fragments were calculated, plotted, and smoothed.
Figure 1—figure supplement 4
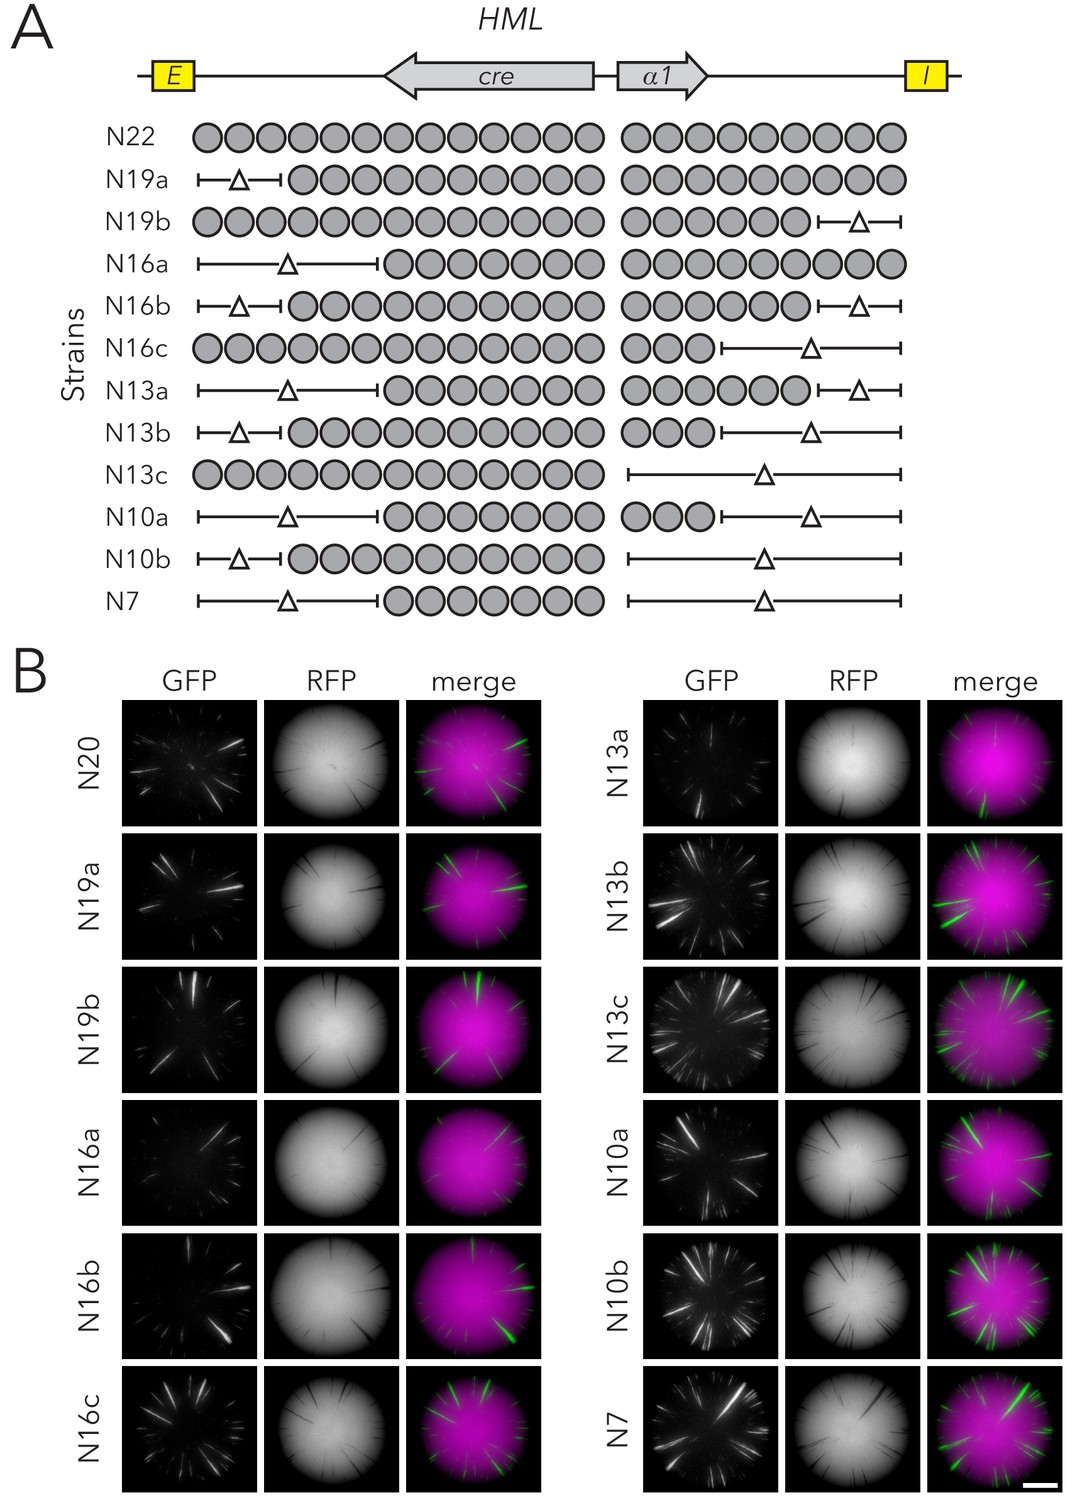
Chromatin domain size of HMLα::cre had minimal effects on silencing-loss rates.
(A) Diagram of nucleosomes in full-length HMLα::cre (N22) (JRY11259) and strains with deletions of nucleosomal DNA. The smallest allele of HMLα::cre had seven nucleosomes (N7) (JRY11292). (B) Representative CRASH colonies for Strains N22 (JRY11259) through N7 (JRY11292). Scale bar, 2 mm.
Figure 1—figure supplement 5

Chromatin domain size of HMLα::cre had minimal effects on silencing-loss rates measured by flow cytometry.
(A) Diagram of nucleosomes in HMLα::cre, as shown in Figure 1—figure supplement 3. (B) Quantification of apparent silencing-loss rates, as described in Materials and methods. Data are means ± SD (n = 6 independent cultures). ANOVA and Tukey tests were used to test for statistical significance. Only strains N13c and N7 were significantly different (p<0.05) than N22. (C) Data from (B), with means of apparent silencing-loss rates presented on a scatter plot.
Figure 2 with 4 supplements
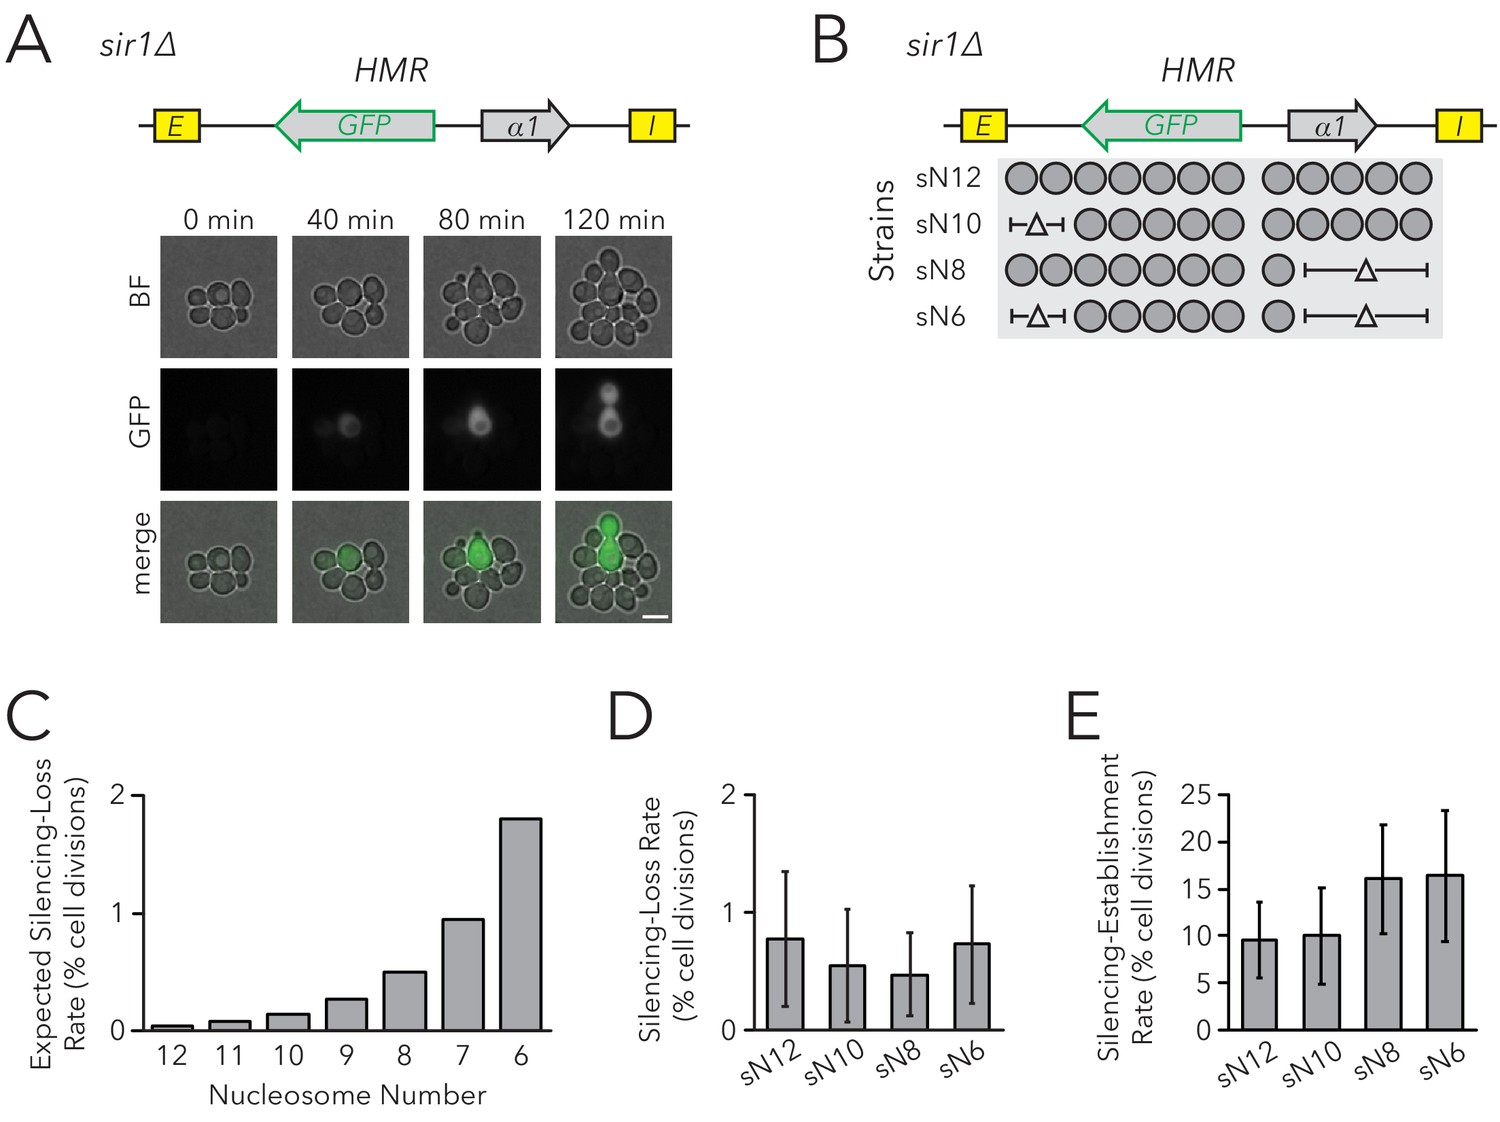
Chromatin Domain Size Did Not Affect Silencing-Loss Rates in sir1∆.
(A) Diagram of the FLuorescent Analysis of Metastable Expression (FLAME) assay. In a sir1∆ background, GFP replaced the α2 gene so that transcriptional activity of HMRα::GFP could be monitored at the single-cell level (JRY11478). Loss-of-silencing events were observed in dividing cells by using time-lapse microscopy. Scale bar, 5 µm. Establishment-of-silencing events were also observed (see Video 1). Silencing defects in different sir mutants are shown by microscopy in Figure 2—figure supplement 1 and by flow cytometry in Figure 2—figure supplement 2. (B) Diagram of nucleosomes in HMRα::GFP as defined by MNase-Seq (Figure 2—figure supplement 3). Twelve nucleosomes were present in full-length HMRα::GFP (Strain sN12) (JRY11478). Combinations of nucleosomal DNA were deleted to change the size of the HMRα::GFP locus; the smallest allele contained six nucleosomes (Strain sN6) (JRY11547). (C) Expected loss-of-silencing rate from random segregation of H3-H4 tetramers to daughter chromatids. See the legend of Figure 1 for a description of how these expected rates were calculated. (D) Observed loss-of-silencing rates using the FLAME assay. Cell divisions were monitored by time-lapse microscopy (n > 900 cell divisions per genotype). Silencing-loss rates were not significantly different (Yates chi-square test, p>0.05 for all pairwise comparisons). (E) Observed establishment-of-silencing rates using the FLAME assay (n > 110 cell divisions per genotype). Silencing establishment rates were not significantly different (Yates chi-square test, p>0.05 for all pairwise comparisons). These strains showed similar frequencies of silenced and expressed cells as measured by flow cytometry in Figure 2—figure supplement 4. Error bars represent 95% confidence intervals.
Figure 2—figure supplement 1
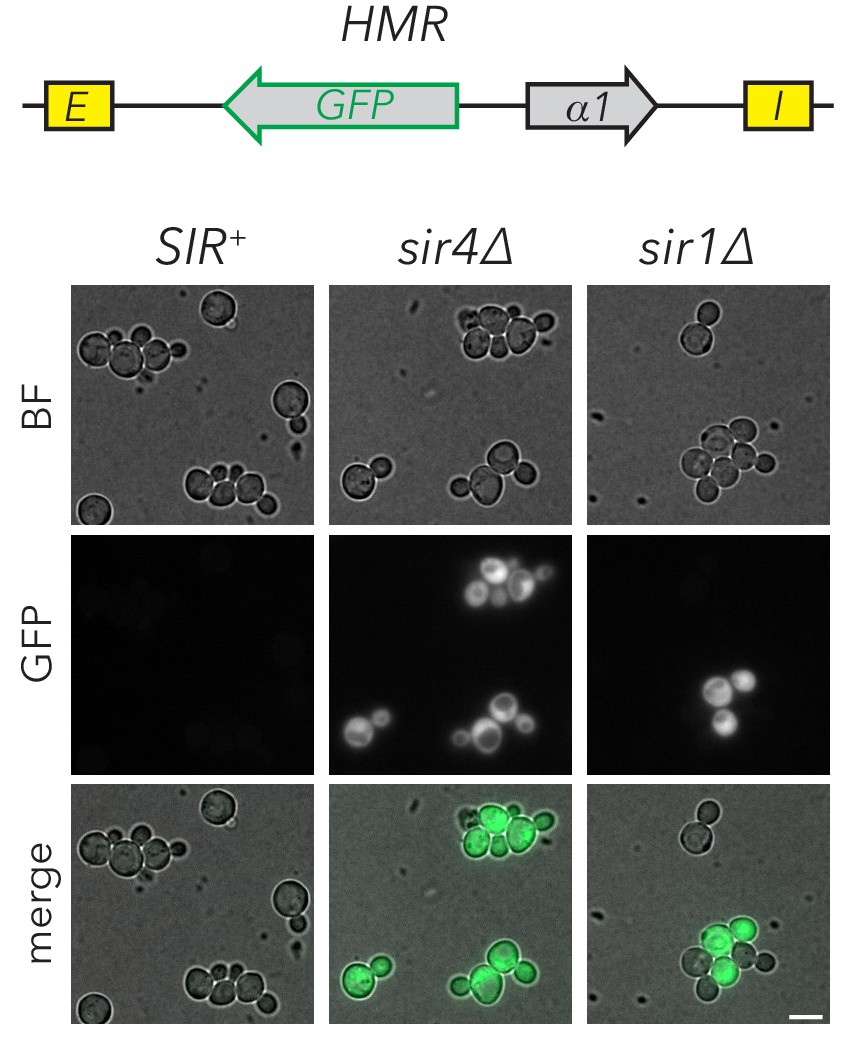
sir1∆ cells exhibited metastability at HMRα::GFP.
Fluorescence images of HMRα::GFP strains that were SIR+ (JRY11474), sir4∆ (JRY11496), or sir1∆ (JRY11478). Cells were grown to log-phase before imaging. Scale bar, 5 µm.
Figure 2—figure supplement 2
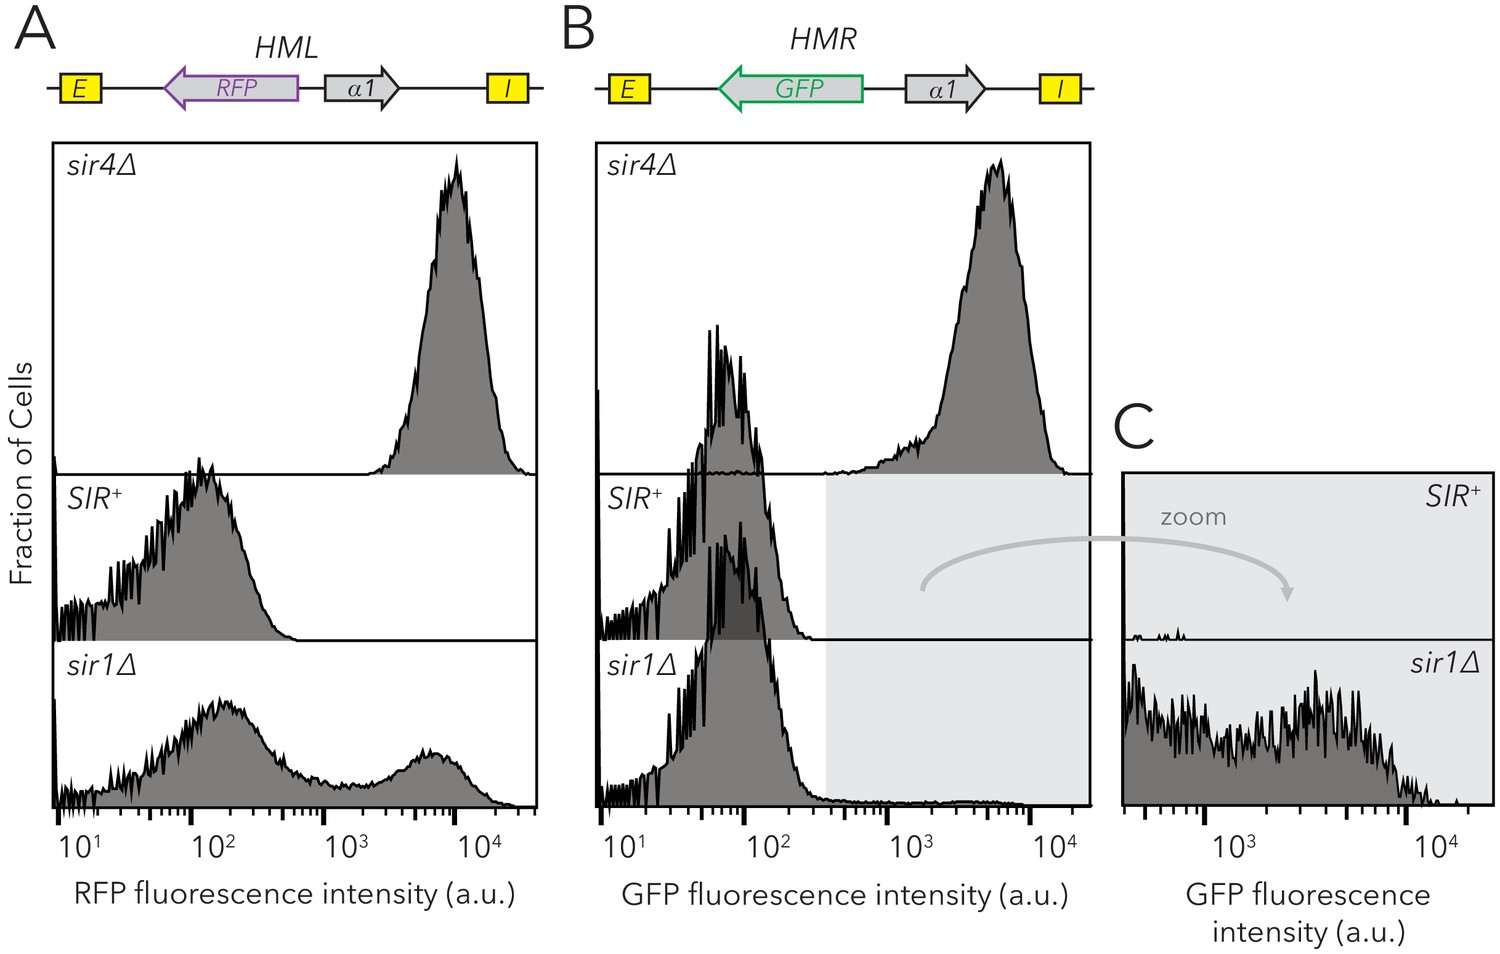
sir1∆ cells exhibited metastability at HMLα::RFP and HMRα::GFP.
Distribution of fluorescence intensity per cell as measured by flow cytometry after 24 hr of log-phase growth. (A) HMLα::RFP expression was measured in SIR+ (JRY11472), sir4∆ (JRY11494), or sir1∆ (JRY11476). (B) HMRα::GFP expression was measured in SIR+ (JRY11474), sir4∆ (JRY11496), or sir1∆ (JRY11478). Because very few cells expressed HMRα::GFP in sir1∆, zoomed profiles are provided in (C). At least 50,000 cells were analyzed for each strain.
Figure 2—figure supplement 3
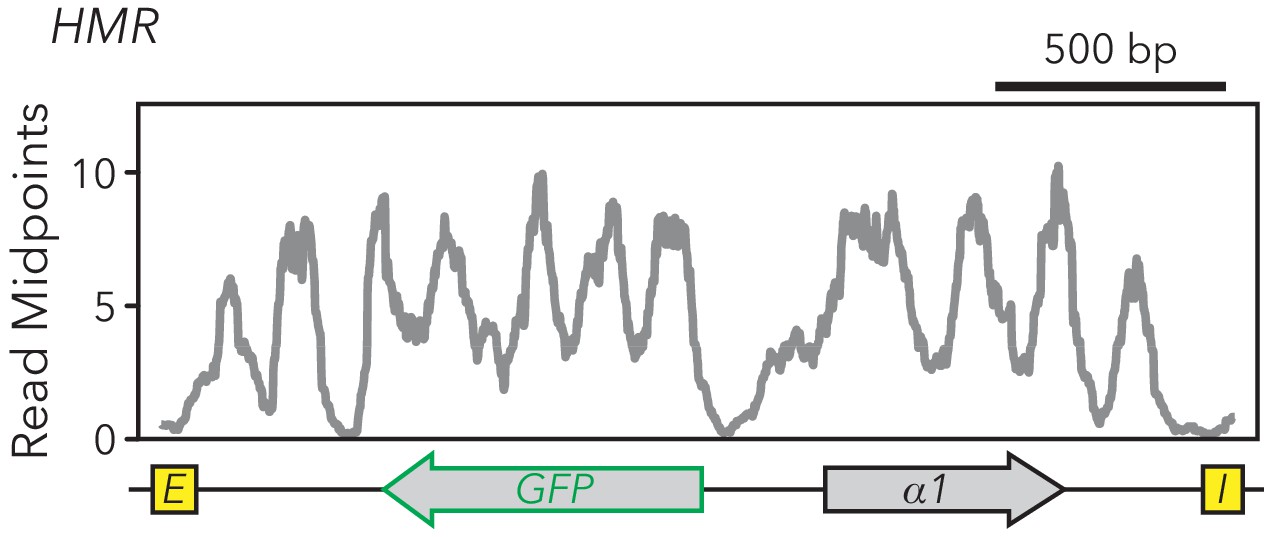
HMRα::GFP contained 12 nucleosomes.
MNase-Seq was performed on the strain with full-length HMRα::GFP in sir1∆ (JRY11478). Midpoints of nucleosome-sized fragments were calculated, plotted, and smoothed.
Figure 2—figure supplement 4
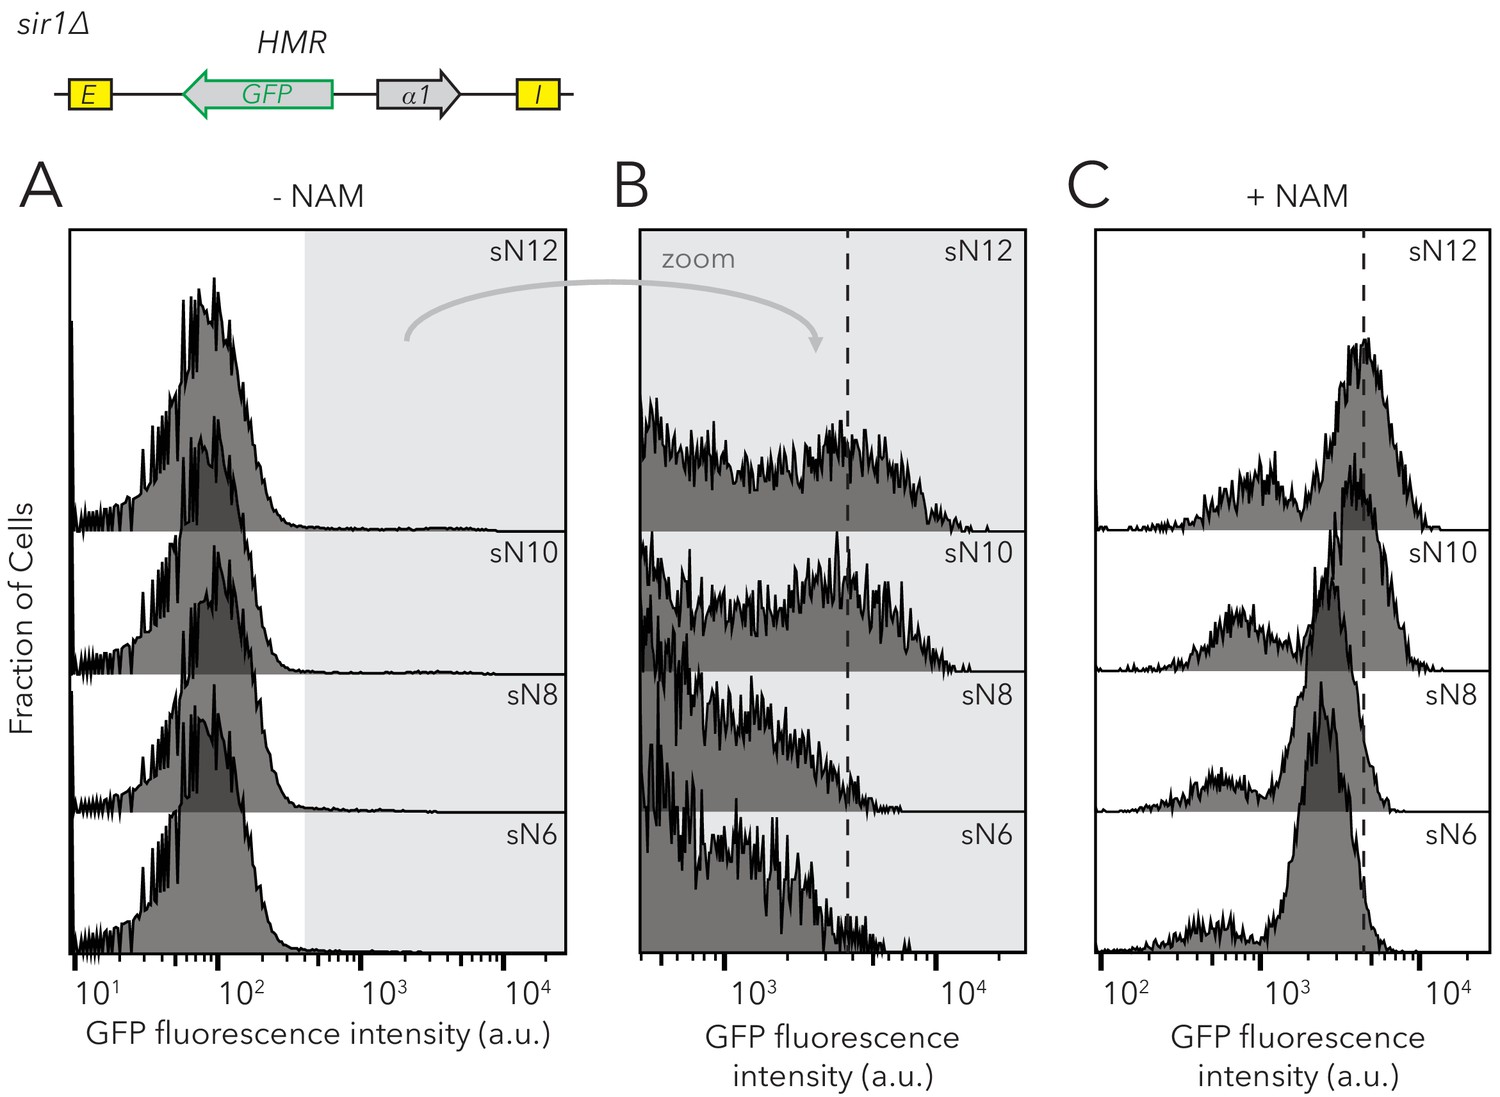
Chromatin domain size of HMRα::GFP in sir1∆ did not affect the frequencies of different epigenetic states but did affect GFP expression levels.
Distribution of fluorescence intensity per cell as measured by flow cytometry after 24 hr of log-phase growth. (A) HMRα::GFP expression was measured in Strains sN12 (JRY11478) through sN6 (JRY11547). (B) Zoomed profiles of flow cytometry profiles in (A). The dashed line indicates the mean fluorescence intensity of expressed cells in sN12, for comparison to the mean-fluorescence-intensity values of other strains. (C) Distribution of fluorescence intensity per cell for cells grown at log for 12 hr in 5 mM Nicotinamide (NAM). NAM inhibits Sir2 activity and causes cells to be fully expressed at HMR. Strains sN12 through sN6 were analyzed. The dashed line indicates the mean fluorescence intensity of expressed cells in sN12, for comparison to other strains. Because the smaller peaks at lower fluorescence intensities were not visible in sir4∆ (see Figure 2—figure supplement 2), we considered them an artifact of NAM treatment. At least 50,000 cells were analyzed for each strain.
Figure 3
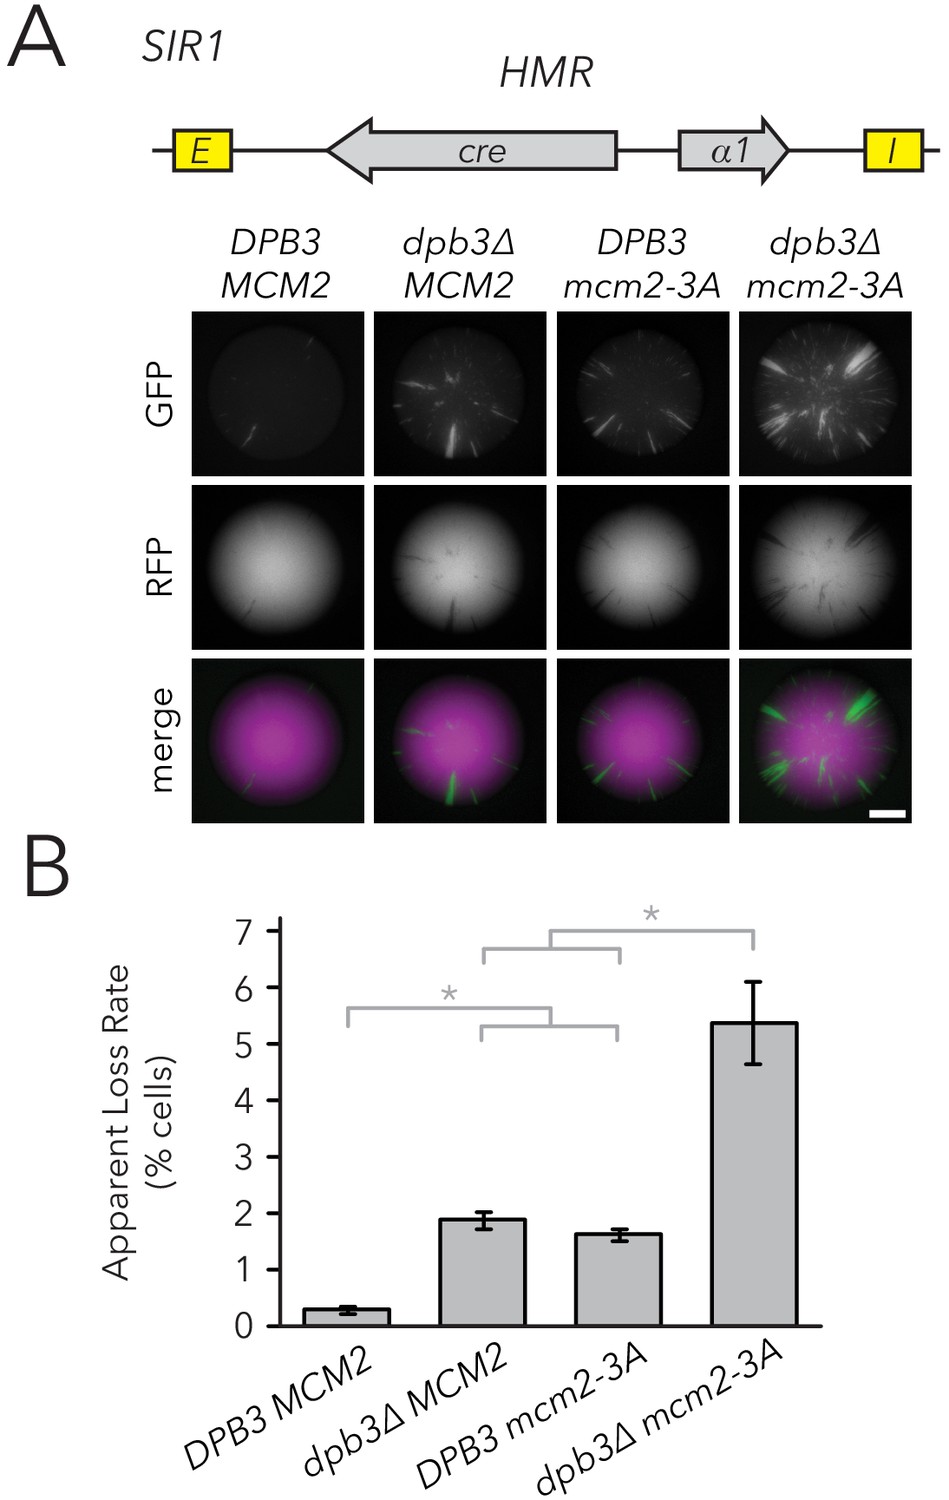
Replisome mutants exhibited higher silencing-loss rates in the CRASH assay.
(A) Representative CRASH colonies for DPB3 MCM2 (JRY11471), dpb3∆ MCM2 (JRY11562), DPB3 mcm2-3A (JRY11591), and dpb3∆ mcm2-3A (JRY11592). Scale bar, 1 mm. (B) Quantification of apparent silencing-loss rates of strains in (A), as described in Materials and methods. Data are means ± SD (n = 6 independent cultures). ANOVA and Tukey tests were used to test statistical significance. DPB3 MCM2 was significantly different than dpb3∆ MCM2 and DPB3 mcm2-3A (p<0.05 each), and dpb3∆ mcm2-3A was significantly different than dpb3∆ MCM2 and DPB3 mcm2-3A (p<0.05 each).
Figure 4 with 3 supplements
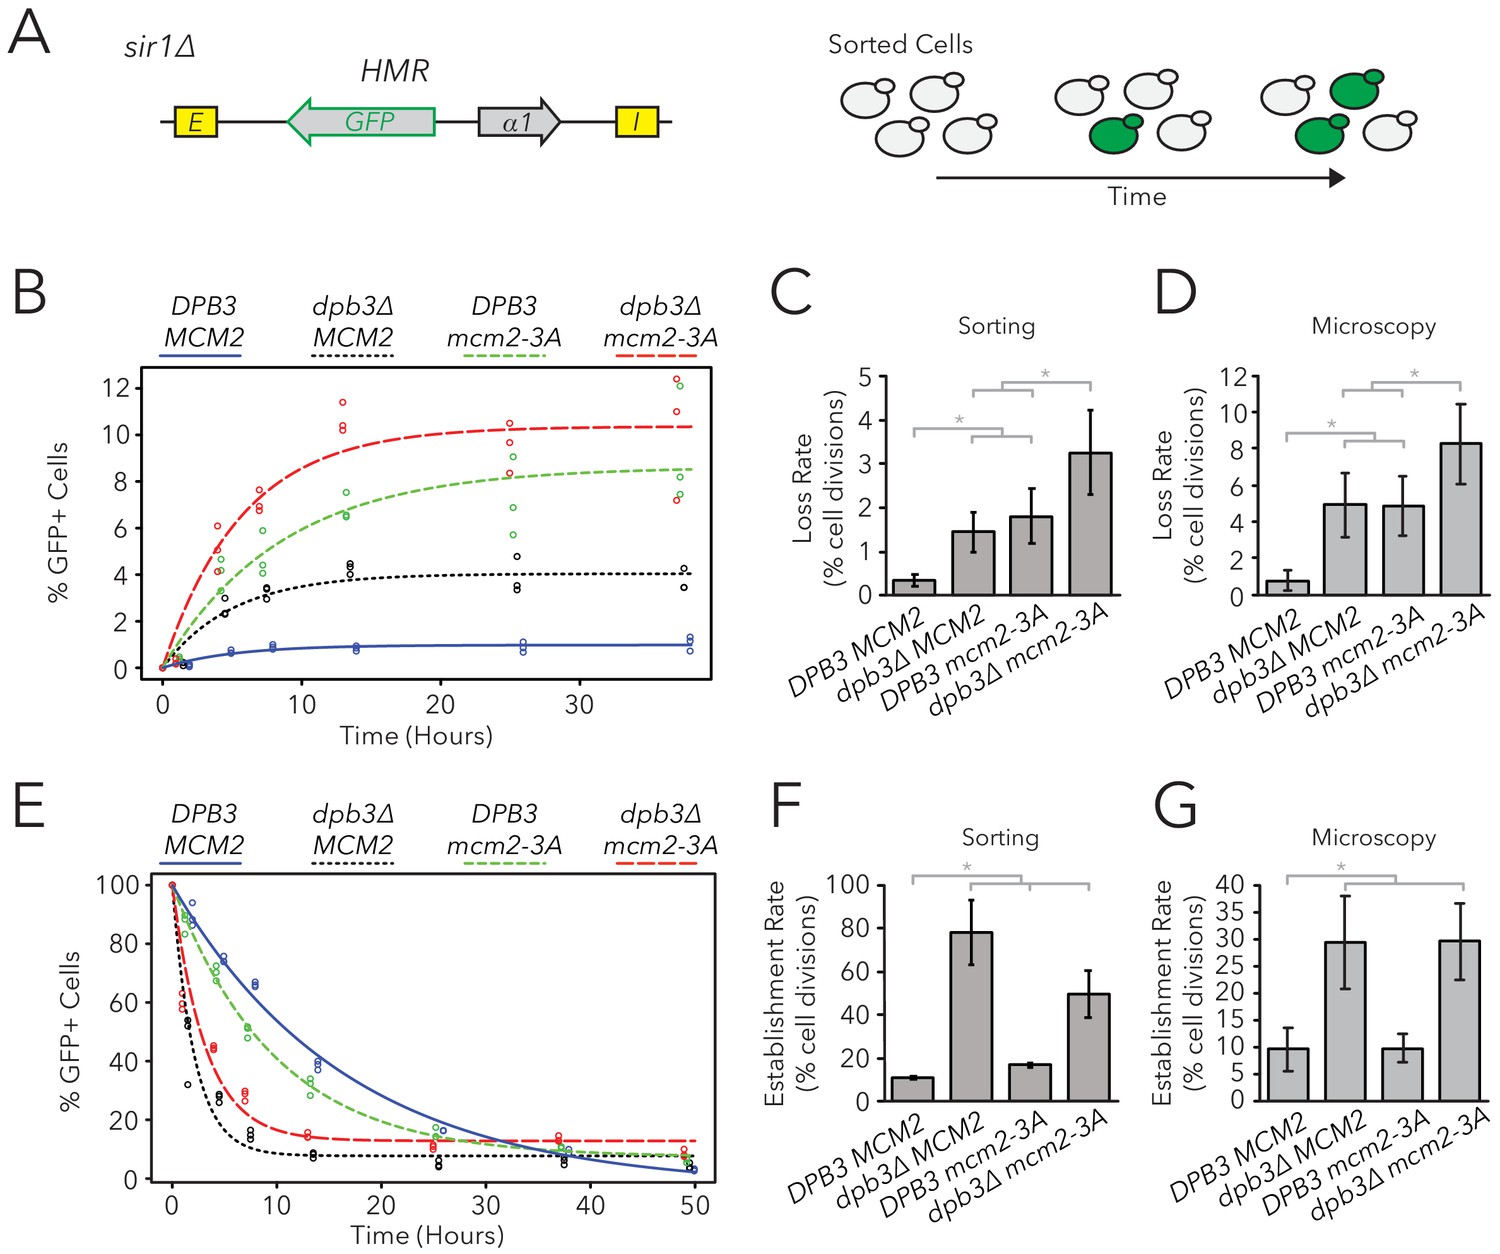
Replisome mutants exhibited defects in epigenetic inheritance in the FLAME assay.
(A) FACS-based approach to measure switching rates of HMRα::GFP in sir1∆. Populations of silenced cells were isolated and allowed to divide; as silencing loss occurred, the percentage of expressed cells in the population increased. The distributions of fluorescence intensity per cell at equilibrium are shown in Figure 4—figure supplement 1. (B) For DPB3 MCM2 (blue) (JRY11471), dpb3∆ MCM2 (black) (JRY11550), DPB3 mcm2-3A (green) (JRY11589), and dpb3∆ mcm2-3A (red) (JRY11590), silenced cells were isolated at t = 0 hr, allocated into three separate populations each, and monitored over time. At each time-point, the percentage of expressed cells in each population was determined by flow cytometry (for an example, see Figure 4—figure supplement 2). (C) Silencing-loss rates calculated from (B), as explained in Materials and methods. (D) Silencing-loss rates calculated by monitoring dividing cells with time-lapse microscopy (n > 550 cell divisions per genotype). (E) Similar to (B), except expressed cells were sorted and monitored over time. (F) Silencing-establishment rates calculated from (E), as explained in Materials and methods. (G) Silencing-establishment rates calculated by monitoring dividing cells with time-lapse microscopy (n > 100 cell divisions per genotype). GFP expression levels in expressed cells were calculated by flow cytometry and shown in Figure 4—figure supplement 3. Error bars represent 95% confidence intervals. Two-tailed t-tests were used in statistical analysis of switching rates by sorting, and Yates chi-square tests were used for microscopy (*p<0.05).
Figure 4—figure supplement 1

Replisome mutants exhibited different frequencies of silenced and expressed cells in sir1∆.
Distribution of fluorescence intensity per cell as measured by flow cytometry after 24 hr of log-phase growth. HMRα::GFP expression was measured in DPB3 MCM2 (JRY11471), dpb3∆ MCM2 (JRY11550), DPB3 mcm2-3A (JRY11589), and dpb3∆ mcm2-3A (JRY11590). At least 50,000 cells were analyzed for each strain.
Figure 4—figure supplement 2
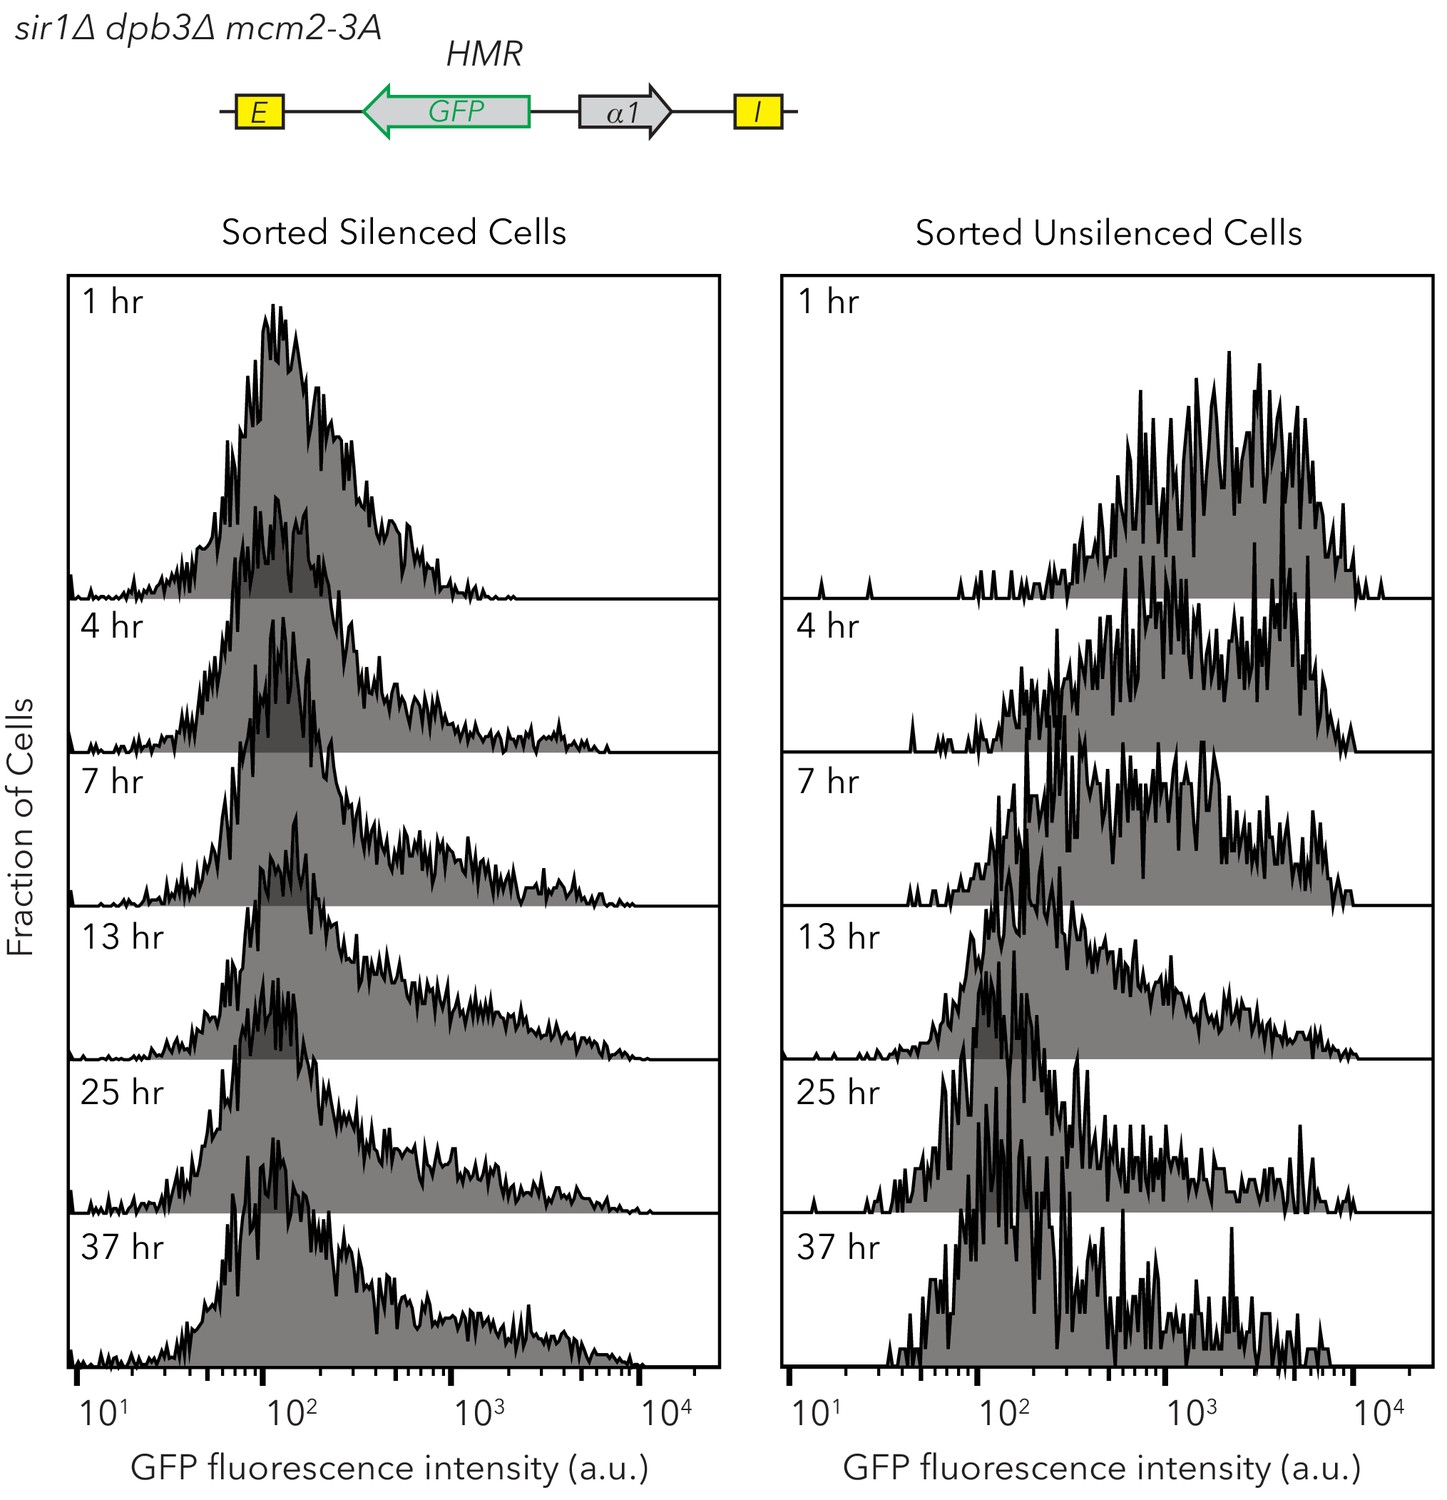
Flow cytometry profiles of sir1∆ dpb3∆ mcm2-3A HMRα::GFP after FACS sorting.
Silenced and expressed cells were sorted at t = 0 hr and allowed to divide at log-phase. Samples were taken at different time-points and analyzed by flow cytometry. These data correspond to experiments shown in Figure 4B and E. At least 700 cells were analyzed for each time-point.
Figure 4—figure supplement 3
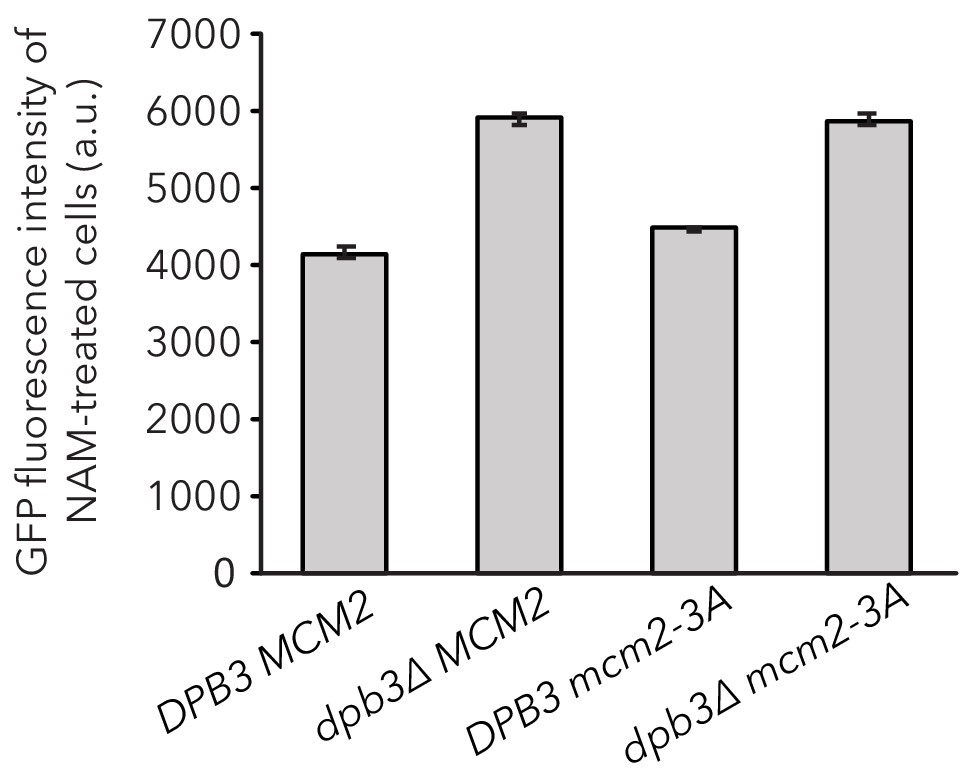
dpb3∆ exhibited a higher expression level of HMRα::GFP in expressed cells.
DPB3 MCM2 (JRY11478), dpb3∆ MCM2 (JRY11550), DPB3 mcm2-3A (JRY11589), and dpb3∆ mcm2-3A (JRY11590) were grown at log phase for 12 hr in 5 mM Nicotinamide (NAM) and HMRα::GFP expression was measured with flow cytometry. The geometric mean intensity of GFP for each strain was calculated using FlowJo software. Data are means ± SD (n = 3 independent cultures). ANOVA and Tukey tests showed GFP expression levels in DPB3 MCM2 were significantly different than those seen in dpb3∆ MCM2, DPB3 mcm2-3A, and dpb3∆ mcm2-3A (p<0.05 each). GFP expression in dpb3∆ MCM2 was not significantly different than dpb3∆ mcm2-3A (p>0.05).
Figure 5 with 1 supplement
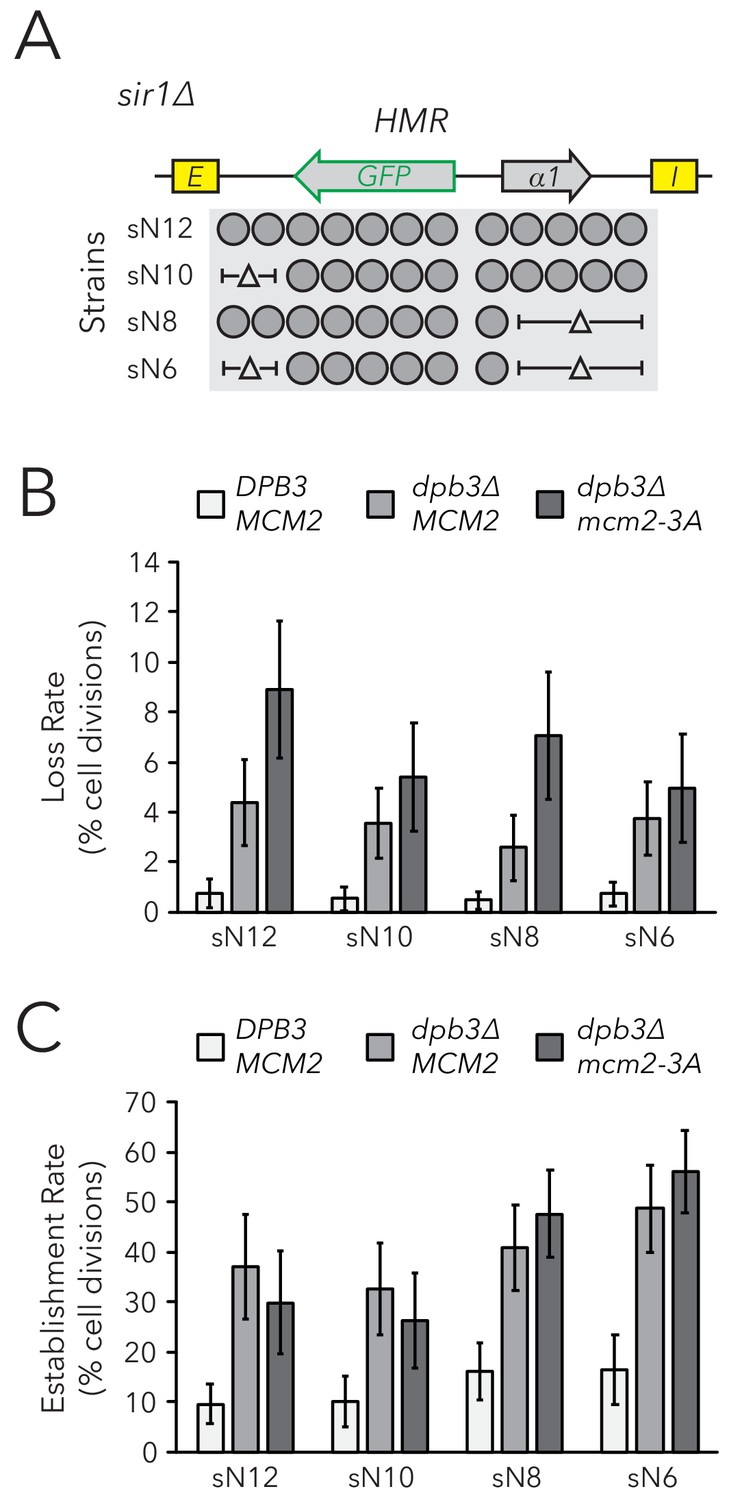
Chromatin domain size did not strongly affect epigenetic switching rates in replisome mutant backgrounds.
(A) Diagram of nucleosomes in HMRα::GFP, as seen in Figure 2B. As before, combinations of nucleosomal DNA were deleted to change the size of HMRα::GFP; the largest allele contained twelve nucleosomes (Strain sN12) (JRY11478) and the smallest allele contained six nucleosomes (Strain sN6) (JRY11547). Frequencies of silenced and expressed cells in these strains were measured by flow cytometry and shown in Figure 5—figure supplement 1. (B) Loss-of-silencing rates in the FLAME assay. Replisome mutant strains DPB3 MCM2 (JRY11478) (white), dpb3∆ MCM2 (JRY11550) (gray), and dpb3∆ mcm2-3A (JRY11590) (dark gray) with different numbers of nucleosomes at HMRα::GFP were analyzed by time-lapse microscopy (n > 300 cell divisions for each genotype). (C) Establishment-of-silencing rates for the same strains as in (B), calculated by time-lapse microscopy (n > 80 cell divisions per genotype). Loss and establishment rates of DPB3 MCM2 (JRY11478) are identical to those in Figure 2D,E and shown here for convenience. Error bars represent 95% confidence intervals.
Figure 5—figure supplement 1
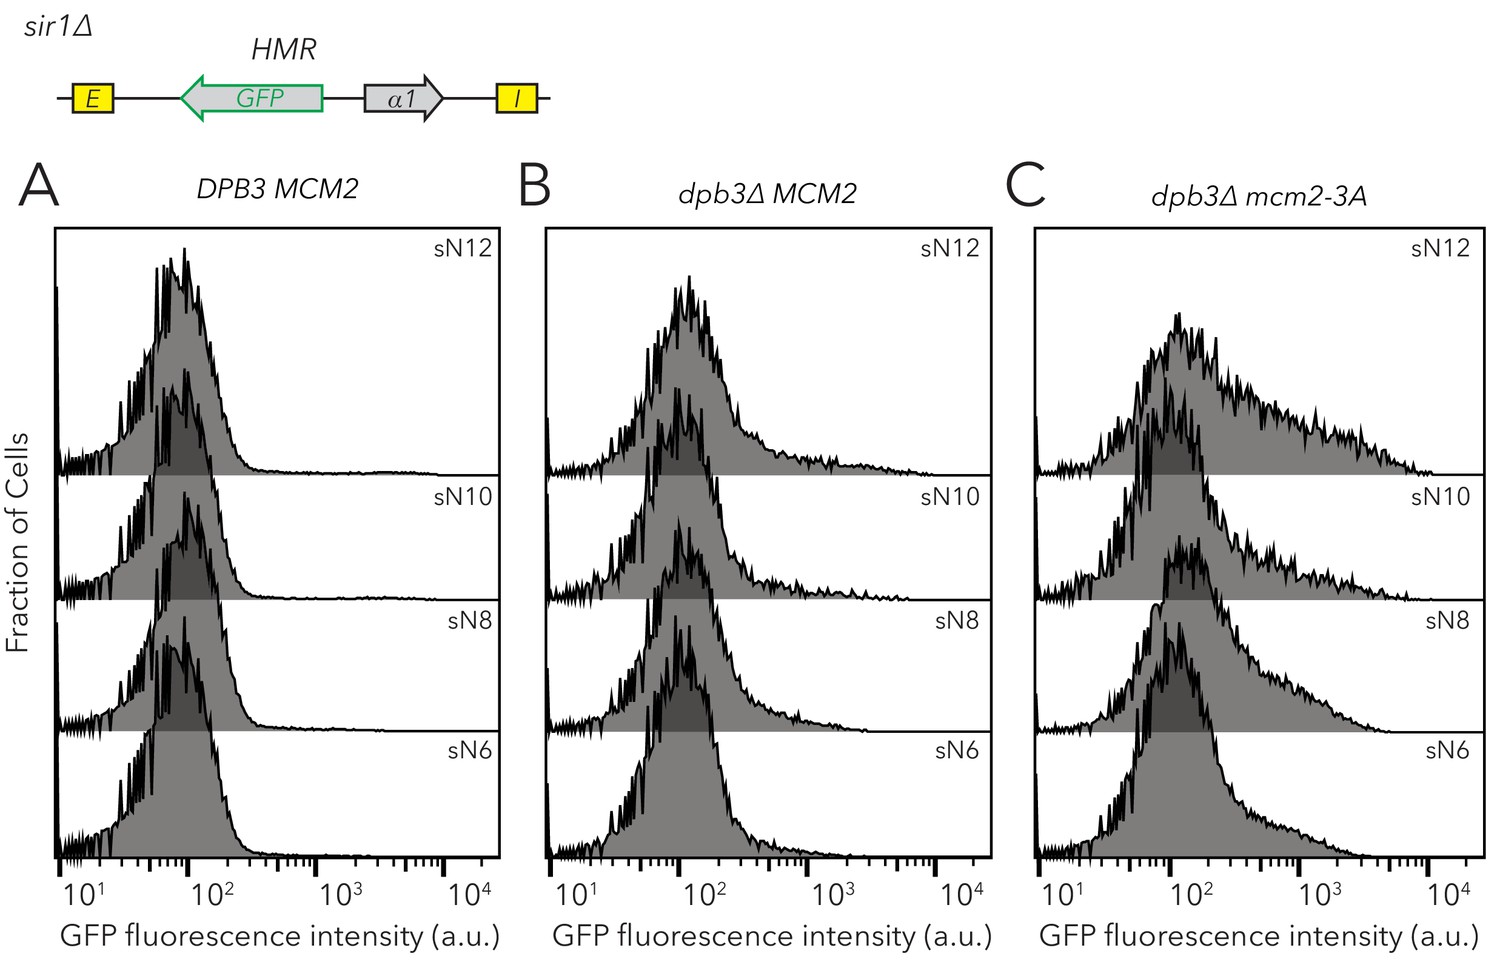
Chromatin domain size of HMRα::GFP did not strongly affect the frequencies of different epigenetic states in replisome mutant backgrounds.
Distribution of fluorescence intensity per cell as measured by flow cytometry after 24 hr of log-phase growth. This analysis was performed on DPB3 MCM2 (JRY11478) (A), dpb3∆ MCM2 (JRY11550) (B), and dpb3∆ mcm2-3A (JRY11590) (C) with different numbers of nucleosomes at HMRα::GFP. At least 50,000 cells were analyzed for each strain. Data in (A) corresponds to data in Figure 2—figure supplement 4A.
Videos
Video 1
Time-lapse video of inheritance of epigenetic states in the FLAME assay.
HMRα::GFP sir1∆ (JRY11478) cells were grown to log-phase in liquid medium and subsequently imaged by time-lapse microscopy. A loss-of-silencing event is visible near the center of the field of view at 4 hr, and an establishment-of-silencing event is visible near the upper-left corner at 5 hr.
Tables
Table 1
Comparison of epigenetic switching rates and proportion of silenced cells at equilibrium.
Data for DPB3 MCM2 (JRY11471), dpb3∆ MCM2 (JRY11550), DPB3 mcm2-3A (JRY11589), and dpb3∆ mcm2-3A (JRY11590) in the FLAME assay was extracted from Figure 4. The percentages of Silenced (S) and Expressed (E) cells at equilibrium were determined from Figure 4B. Silencing-loss rates (kon, gen−1) correspond to data from Figure 4C and silencing-establishment rates (koff, gen−1) correspond to data from Figure 4F. If kon and koff rates accurately predict the percentages of silenced and expressed cells at equilibrium, then E/S should be similar to kon/koff.
| Genotype | Silenced (S) | Expressed (E) | S → E (kon, gen−1) | E → S (koff, gen−1) | E/S | kon/koff |
|---|---|---|---|---|---|---|
| DPB3 MCM2 | 99 | 1 | 0.003 | 0.11 | 0.01 | 0.031 |
| dpb3∆ MCM2 | 96 | 4 | 0.014 | 0.78 | 0.042 | 0.019 |
| DPB3 mcm2-3A | 91 | 9 | 0.018 | 0.17 | 0.094 | 0.107 |
| dpb3∆ mcm2-3A | 90 | 10 | 0.033 | 0.5 | 0.115 | 0.066 |
Additional files
-
Supplementary file 1
Table of yeast strains used in this study.
- https://doi.org/10.7554/eLife.51421.023
-
Supplementary file 2
Table of oligonucleotides used in this study.
- https://doi.org/10.7554/eLife.51421.024
-
Transparent reporting form
- https://doi.org/10.7554/eLife.51421.025
Download links
A two-part list of links to download the article, or parts of the article, in various formats.
Downloads (link to download the article as PDF)
Open citations (links to open the citations from this article in various online reference manager services)
Cite this article (links to download the citations from this article in formats compatible with various reference manager tools)
Epigenetic memory independent of symmetric histone inheritance
eLife 8:e51421.
https://doi.org/10.7554/eLife.51421


