Agonist-specific voltage-dependent gating of lysosomal two-pore Na+ channels
- University of Michigan, United States
- Zhejiang University of Technology, China
- Medical Center Drive, United States
- The Fourth Hospital of Harbin Medical University, China
Figures
Figure 1 with 3 supplements
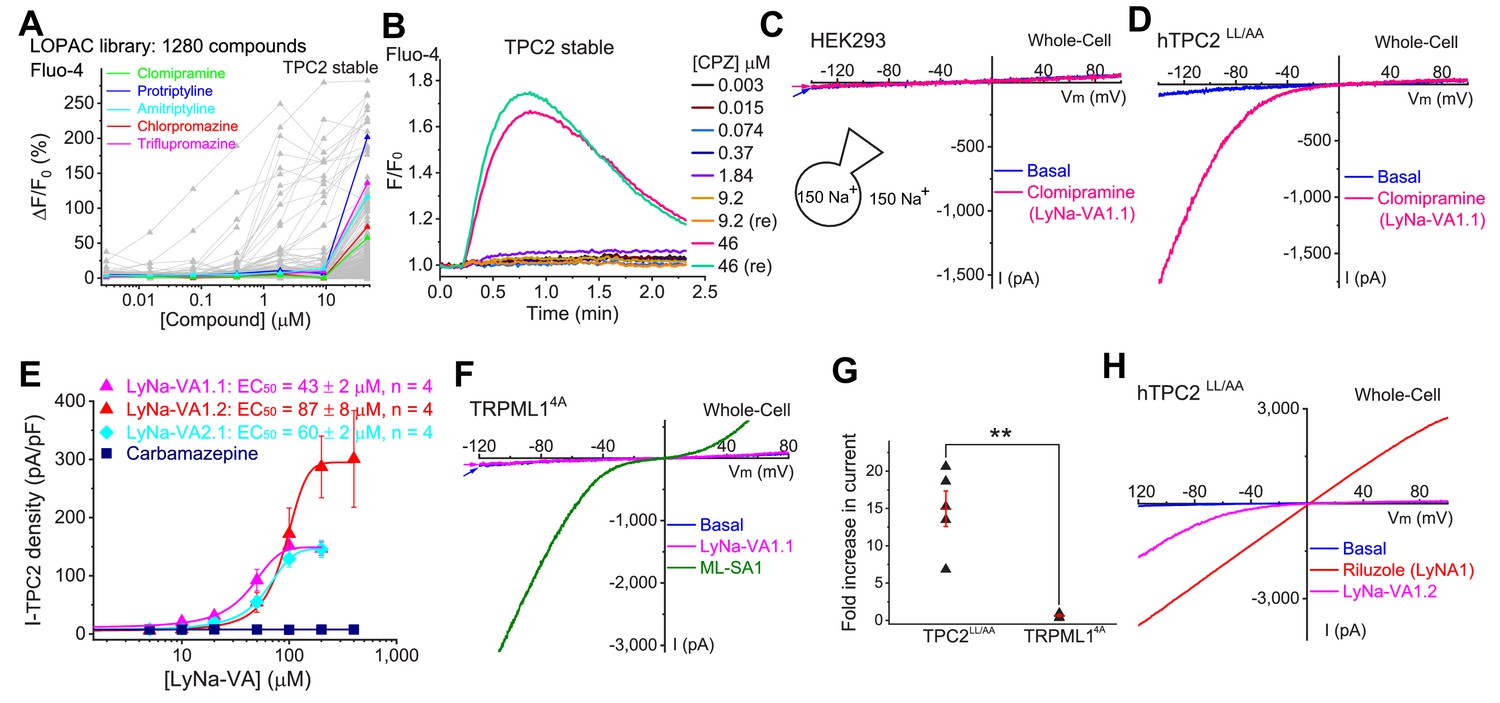
Screening of small-molecule agonists of TPC2.
(A) High-throughput screening of the LOPAC library with Fluo-4 Ca2+ imaging in HEK293 cells stably expressing hTPC2 (Dryad, http://doi.org/10.5061/dryad.s5f6j9h). Each trace represented the average Ca2+ response to individual LOPAC compound. Only positive hits confirmed with electrophysiology were color-coded. (B) An example of a positive responder (chlorpromazine, CPZ), which elevated intracellular Ca2+ levels at the concentration of 46 µM. Note a similar response was seen with a repeated (re) drug application. (C) Representative whole-cell currents in a HEK293 cell upon bath application of clomipramine (100 µM). Both pipette and bath solutions contained symmetric 150 mM Na+. Currents were elicited by repeated voltage ramps (−140 to +100 mV; 200 ms) with a 4 s inter-step interval. Holding potential (HP) = 0 mV. (D) Representative TPC2-mediated currents (ITPC2) activated by clomipramine (100 µM; LyNa-VA1.1) in a HEK293 cell transfected with a surface-expressing mutant TPC2 channel (EGFP-TPC2LL/AA; Wang et al., 2012). (E) Dose-dependent activation of TPC2 by Lysosomal Na+ channel Voltage-dependent Activators (LyNa-VAs). (F) The effect of clomipramine (100 µM) on surface-expressing mutant TRPML1 channels (TRPML14A; Shen et al., 2012). (G) Summary of clomipramine effects on whole-cell ITPC2-LL/AA and ITRPML1-4A. Individual data and Mean ± S.E.M are presented. **, p<0.01. (H) Activation of ITPC2 by LyNa-VA1.2 and Lysosomal Na+ channel Agonist 1 (LyNA1; see Figure 1—figure supplement 2). Individual data for (A), (E) and (G) are presented in Figure 1—source data 1.
-
Figure 1—source data 1
Screening of small-molecule agonists of TPC2.
- https://cdn.elifesciences.org/articles/51423/elife-51423-fig1-data1-v1.xlsx
Figure 1—figure supplement 1
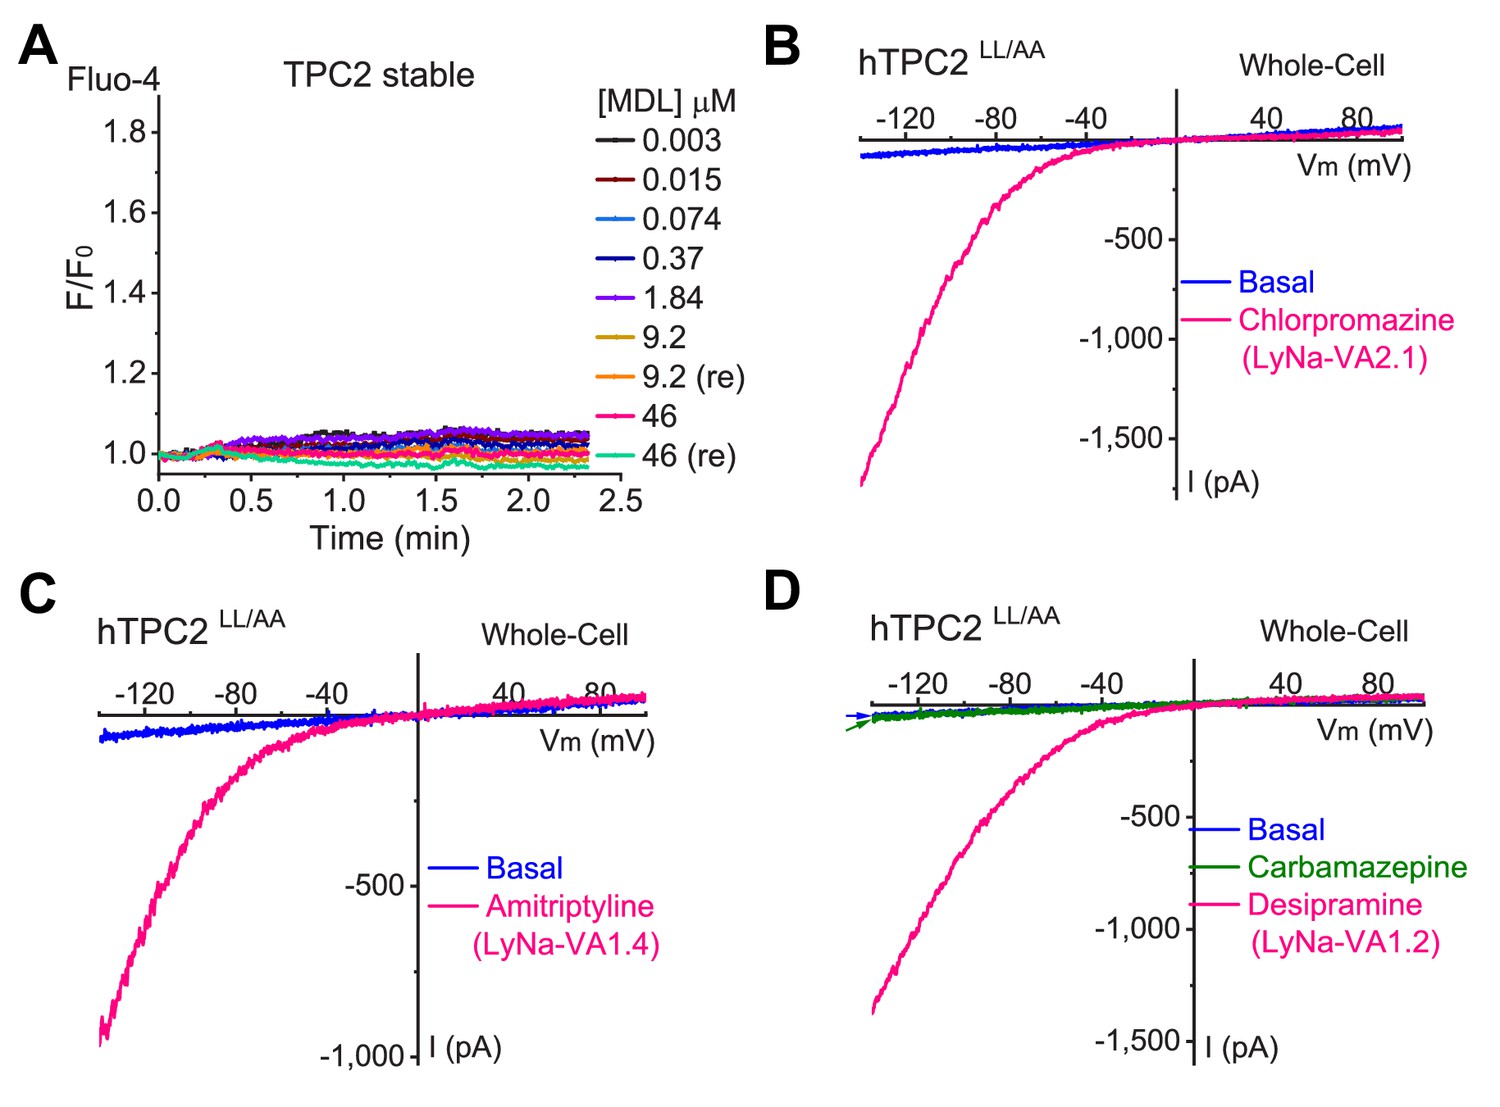
TCAs act as TPC agonists.
(A) An example of a negative responder (MDL) in high- throughput screening of the LOPAC library with Fluo-4 Ca2+ imaging in HEK293 cells stably expressing hTPC2. (B, C, D) Representative whole-cell ITPC2 was evoked by chlorpromazine (100 µM, (B), amitriptyline (100 µM, (C), and desipramine (100 µM, (D) and, but not by carbamazepine (100 µM, (D).
Figure 1—figure supplement 2

Time courses of LyNa-VA1.2-induced TPC2 activation under different recording configurations.
(A) Representative ITPC2 evoked by LyNa-VA1.2 (200 µM) in an inside-out patch from TPC2LL/AA-transfected cells. (B) Representative time course of LyNa-VA1.2- induced TPC2 activation under whole-cell (WC), inside-out (I/O), and whole-endolysosomal (EL) configurations. (C, D) Comparison of latency (C) and time constant (τ, D) of LyNa-VA1.2 (200 µM)-induced TPC2 activation in whole-cell (latency = 15 ± 2 s, τ = 43 ± 5 s, n = 4), inside-out (latency = 12 ± 1 s, τ = 17 ± 2 s, n = 4), and whole-endolysosome (latency = 7 ± 1 s, n = 5; τ = 8 ± 2 s, n = 4) recordings. Both individual data points and Mean ± S.E.M are presented. **, p<0.01; ***, p<0.001. Individual data for (B–D) are presented in Figure 1—figure supplement 2—source data 1.
-
Figure 1—figure supplement 2—source data 1
Time course of LyNa-VA1.2- induced ITPC2 .
- https://cdn.elifesciences.org/articles/51423/elife-51423-fig1-figsupp2-data1-v1.xlsx
Figure 1—figure supplement 3

LyNA1 activates TPC2 channels.
(A) Chemical structure of LyNA1. (B) The effects of LyNa-VA1.2 and LyNA1 on whole-cell ITPC2 under the recording conditions of extracellular 150 mM Na+ and cytosolic 150 mM K+.
Figure 2 with 2 supplements
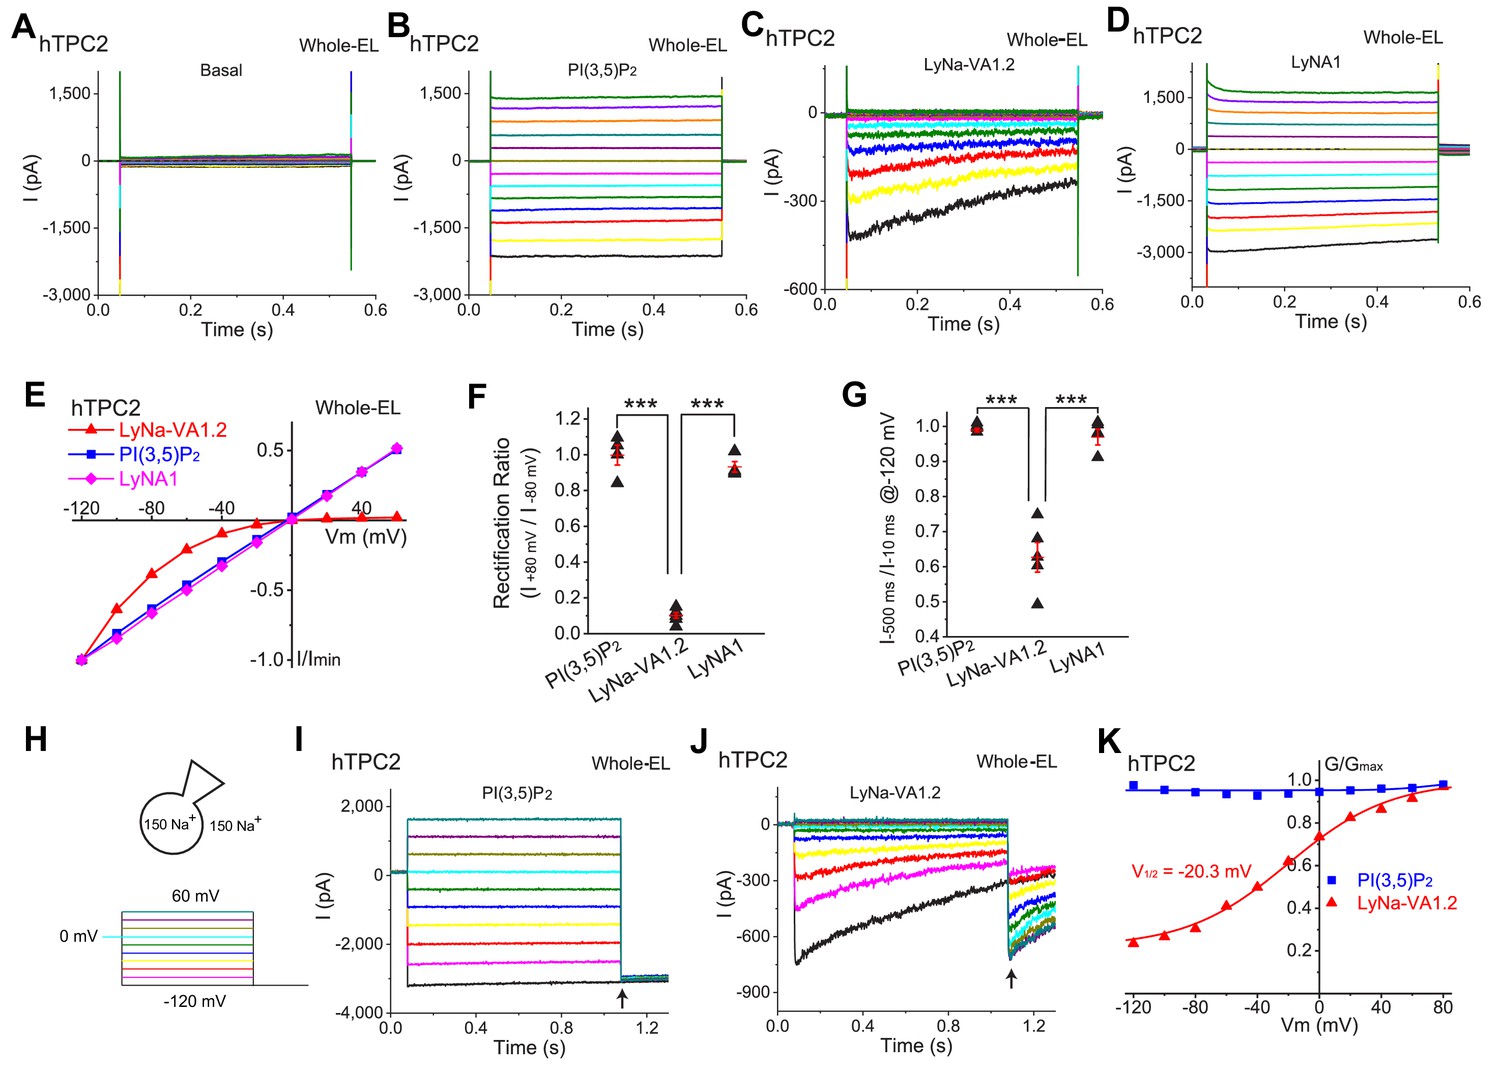
LyNa-VAs activate lysosomal TPC2 channels in a voltage-dependent manner.
(A) Representative basal ITPC2 step currents elicited by a voltage step protocol in the whole-endolysosome (EL) configuration. Voltage steps from −140 to 100 mV with a voltage increment (∆V) of 20 mV for 0.5 s were used to elicit ITPC2 in A-D. HP = 0 mV. Unless otherwise indicated, symmetric (bath/cytosol vs pipette/lumen) Na+ (150 mM) solutions were used for all whole-endolysosome recordings, and PI(3,5)P2 (0.3 µM), LyNa-VA1.2 (100 µM), and LyNA1 (300 µM) were bath- applied to induce ITPC2. (B–D) Representative ITPC2 step currents activated by PI(3,5)P2 (B), LyNa-VA1.2 (C), and LyNA1 (D). (E) Representative normalized I-V plots based on the instantaneous currents activated by various agonists. (F) Rectification index, calculated as the ratio of the current amplitudes between +80 and −80 mV, of PI(3,5)P2-, LyNa-VA1.2-, and LyNA1- activated ITPC2. (G) The inactivation of ITPC2 at −120 mV was quantified as the ratio of current amplitudes at 10 vs. 500 ms, based on step currents in B, (C) and D. (H) Voltage steps from −120 to 100 mV (∆V = 20 mV) for 1 s were used to elicit tail currents at −120 mV shown in (I) and (J). (I) The tail currents of PI(3,5)P2- evoked whole-endolysosome ITPC2. (J) The tail currents of LyNa-VA1.2- activated whole-endolysosome ITPC2. Arrows in (I) and (J) indicate where the currents were measured to calculate the channel conductance (G = I/V). (K) Normalized G-V curves of PI(3,5)P2- and LyNa-VA1.2- activated ITPC2. LyNa-VA1.2 activated ITPC2 in a voltage dependent manner with a V1/2 = −20.3 ± 3.5 mV (n = 5 patches). For panels F and G, individual data and Mean ± S.E.M. are presented. ***, p<0.001. Individual data for (F) and (G) are presented in Figure 2—source data 1.
-
Figure 2—source data 1
The inactivation of ITPC2 and rectification index of TPC2.
- https://cdn.elifesciences.org/articles/51423/elife-51423-fig2-data1-v1.xlsx
Figure 2—figure supplement 1
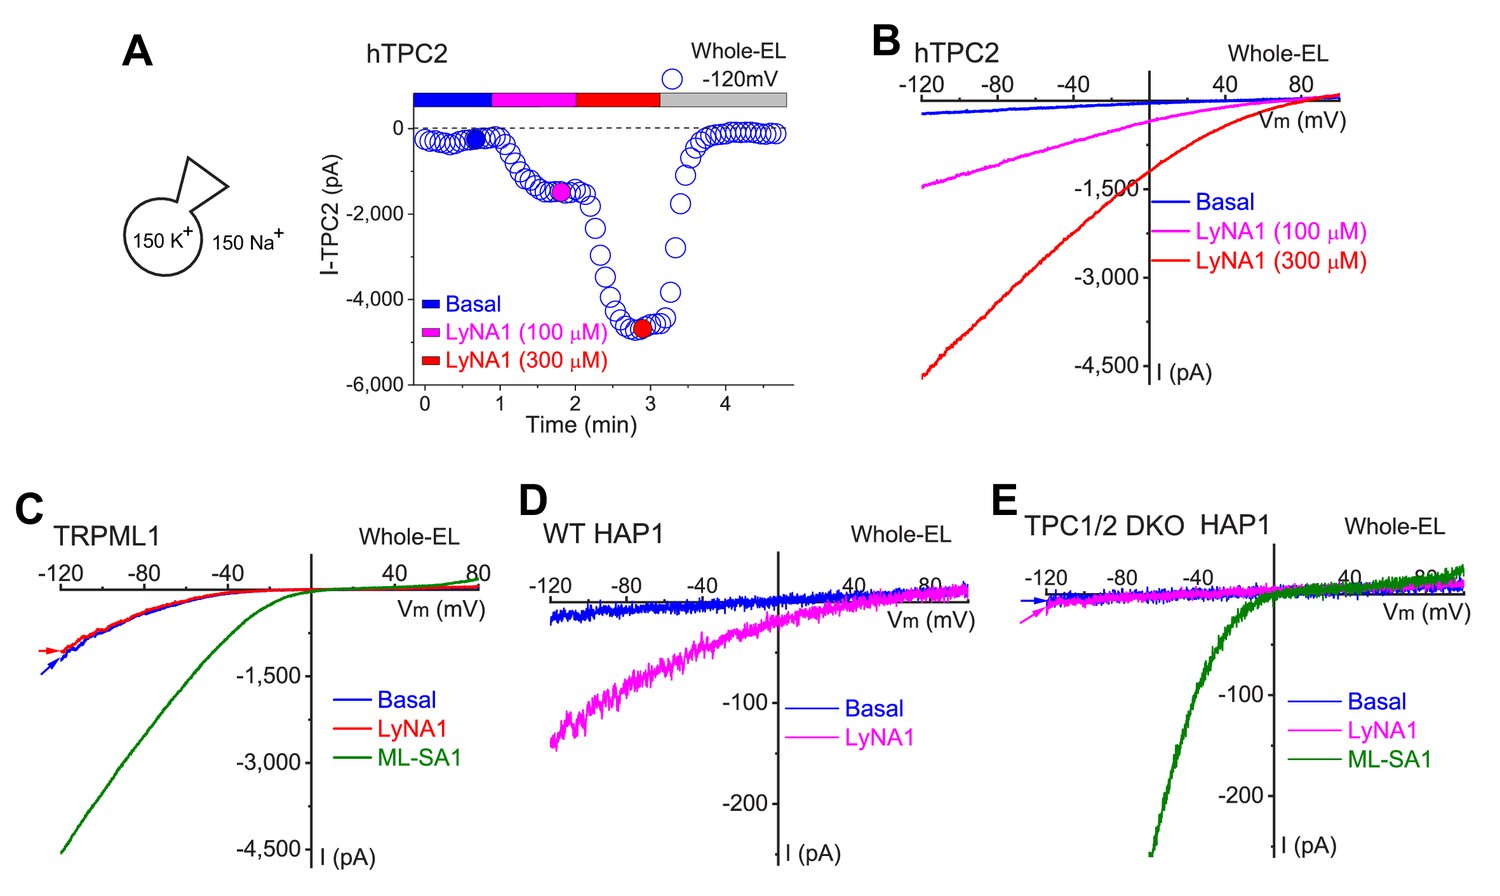
LyNA1 activates lysosomal TPC2 channels.
(A) Time course of dose-dependent activation of whole-endolysosome ITPC2 by LyNA1. (B) Representative traces of ITPC2 evoked by 100 µM and 300 µM LyNA1 at the time points indicated in (A). (C) The lack of the activation effects of LyNA1 on whole-endolysosome ITRPML1. (D, E) LyNA1 (300 µM) activated whole-endolysosome ITPC in WT (D) but not TPC1/2 double KO HAP1 cells (E). Instead, ML-SA1, a TRPML-specific synthetic agonist, readily activated ITRPML1 in TPC1/2 DKO cells.
Figure 2—figure supplement 2
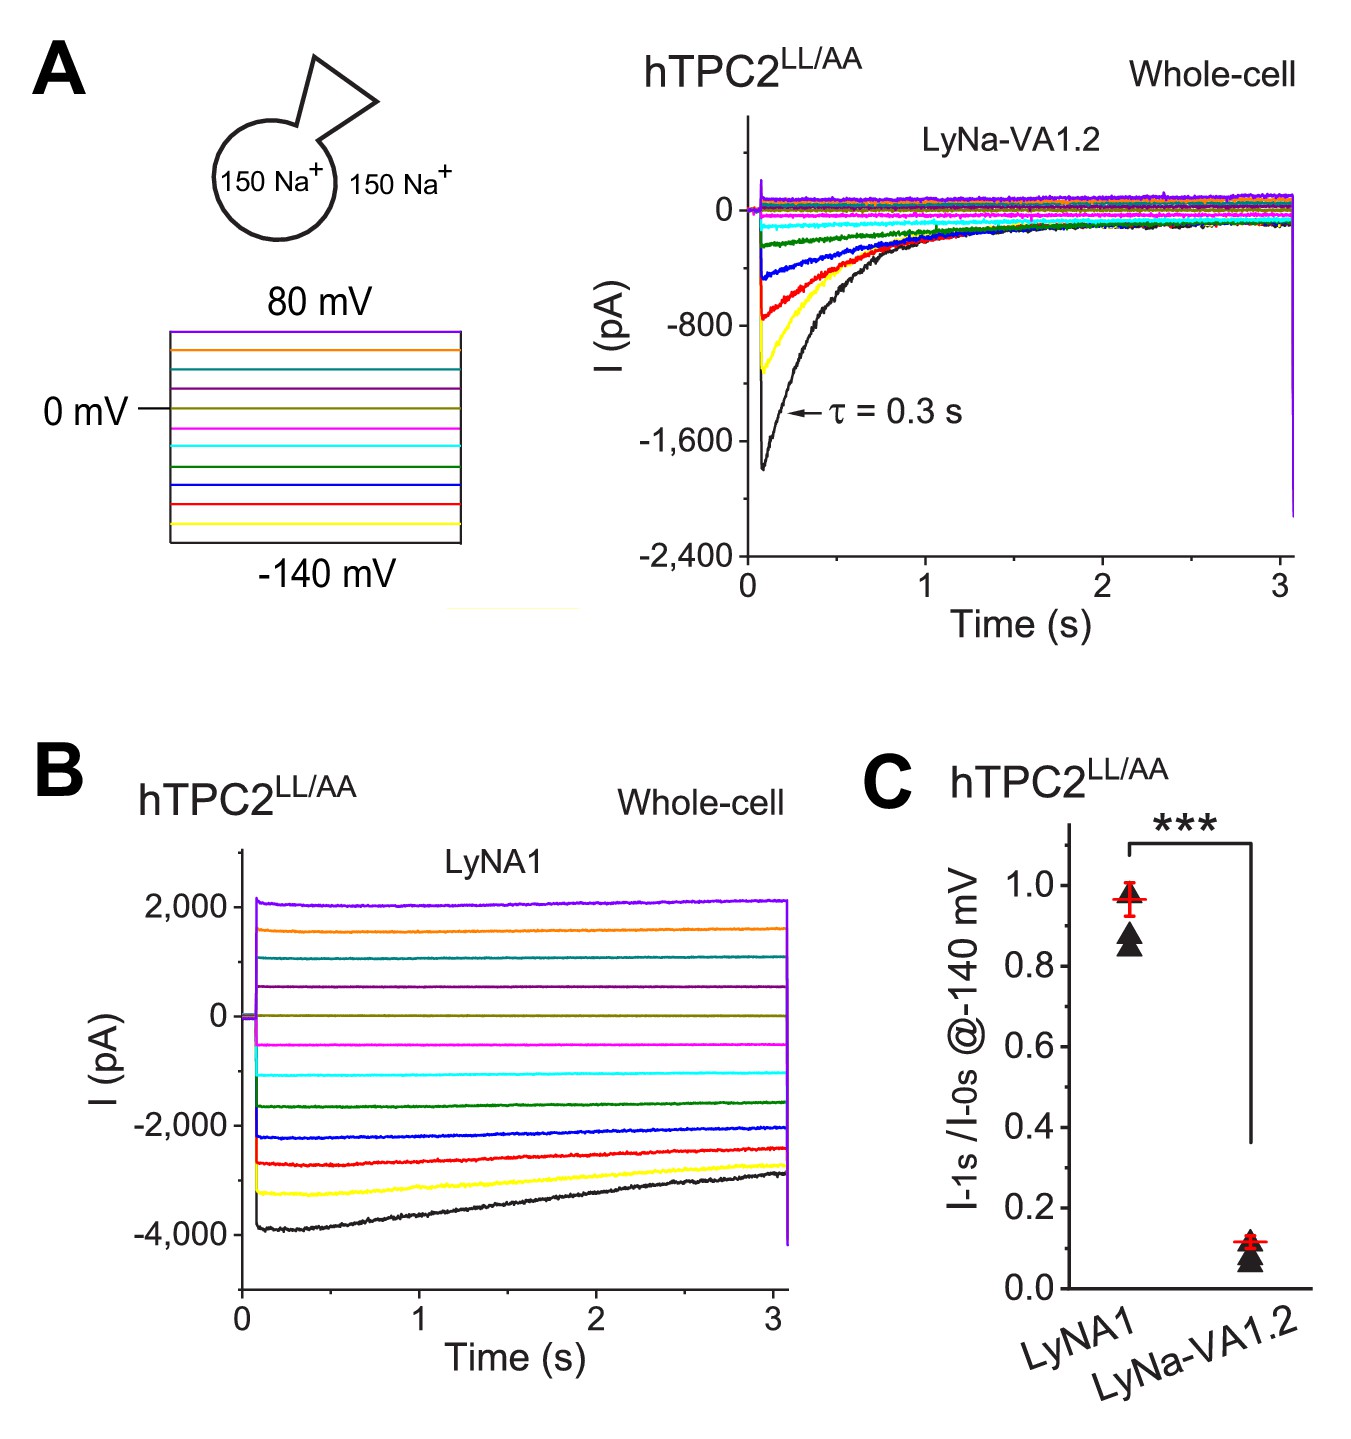
TCAs induce voltage-dependent activation and inactivation of TPC2 channels.
(A, B) Whole-cell ITPC2 elicited by voltage steps from −140 to 80 mV (∆V = 20 mV; see the voltage protocol in the left panel) in the presence of LyNa-VA1.2 (A) or LyNA1 (B). (C) Agonist-specific voltage-dependent inactivation of ITPC2 induced by LyNa-VA1.2 and LyNA1 (see individual data in Figure 2—figure supplement 2—source data 1). ***, p<0.001.
-
Figure 2—figure supplement 2—source data 1
Agonist-specific voltage-dependent inactivation of ITPC2 induced by LyNa-VA1.2 and LyNA1.
- https://cdn.elifesciences.org/articles/51423/elife-51423-fig2-figsupp2-data1-v1.xlsx
Figure 3 with 1 supplement

Synergistic activation of TPC2 channels by TCAs and PI(3,5)P2.
(A) The effects of PI(3,5)P2 (0.3 µM) and LyNa-VA1.2 (100 µM) on whole-endolysosome ITPC2-K204A in TPC2K204A-transfected HEK293 cells (She et al., 2019). (B) Comparison effects of LyNa-VA1.2 and PI(3,5)P2 on WT and PI(3,5)P2-insensitive K204A (She et al., 2019) mutant TPC2 channels (also see Figure 3—figure supplement 1). (C) The synergistic effects of PI(3,5)P2 (50 nM) and LyNa-VA1.1 on whole-endolysosome ITPC2 and ITPC2-K204A currents. Data are presented as Mean ± S.E.M (n = 3 patches). (D) The summary of EC50 of LyNa-VA1.1 with or without PI(3,5)P2 for WT and K204A mutant TPC2 channels. (E, F) Co-application of PI(3,5)P2 (0.3 µM) and LyNa-VA1.1 (50 µM) activated whole-endolysome ITPC in WT (E) but not TPC1/2 DKO (F) HAP1 cells. Note that the endogenous TPCs were more difficult to activate compared to overexpressed TPCs. (G) Summary of LyNa-VA1.1 effects on whole-endolysome ITPC in WT and TPC1/2 DKO cells. For panels B, D and F, individual data and Mean ± S.E.M are presented. *, p<0.05; **, p<0.01; ***, p<0.001; N.S., no significance. Individual data for (B–D) and (G) are presented in Figure 3—source data 1.
-
Figure 3—source data 1
Synergistic activation of TPC2 channels by TCAs and PI(3,5)P2.
- https://cdn.elifesciences.org/articles/51423/elife-51423-fig3-data1-v1.xlsx
Figure 3—figure supplement 1
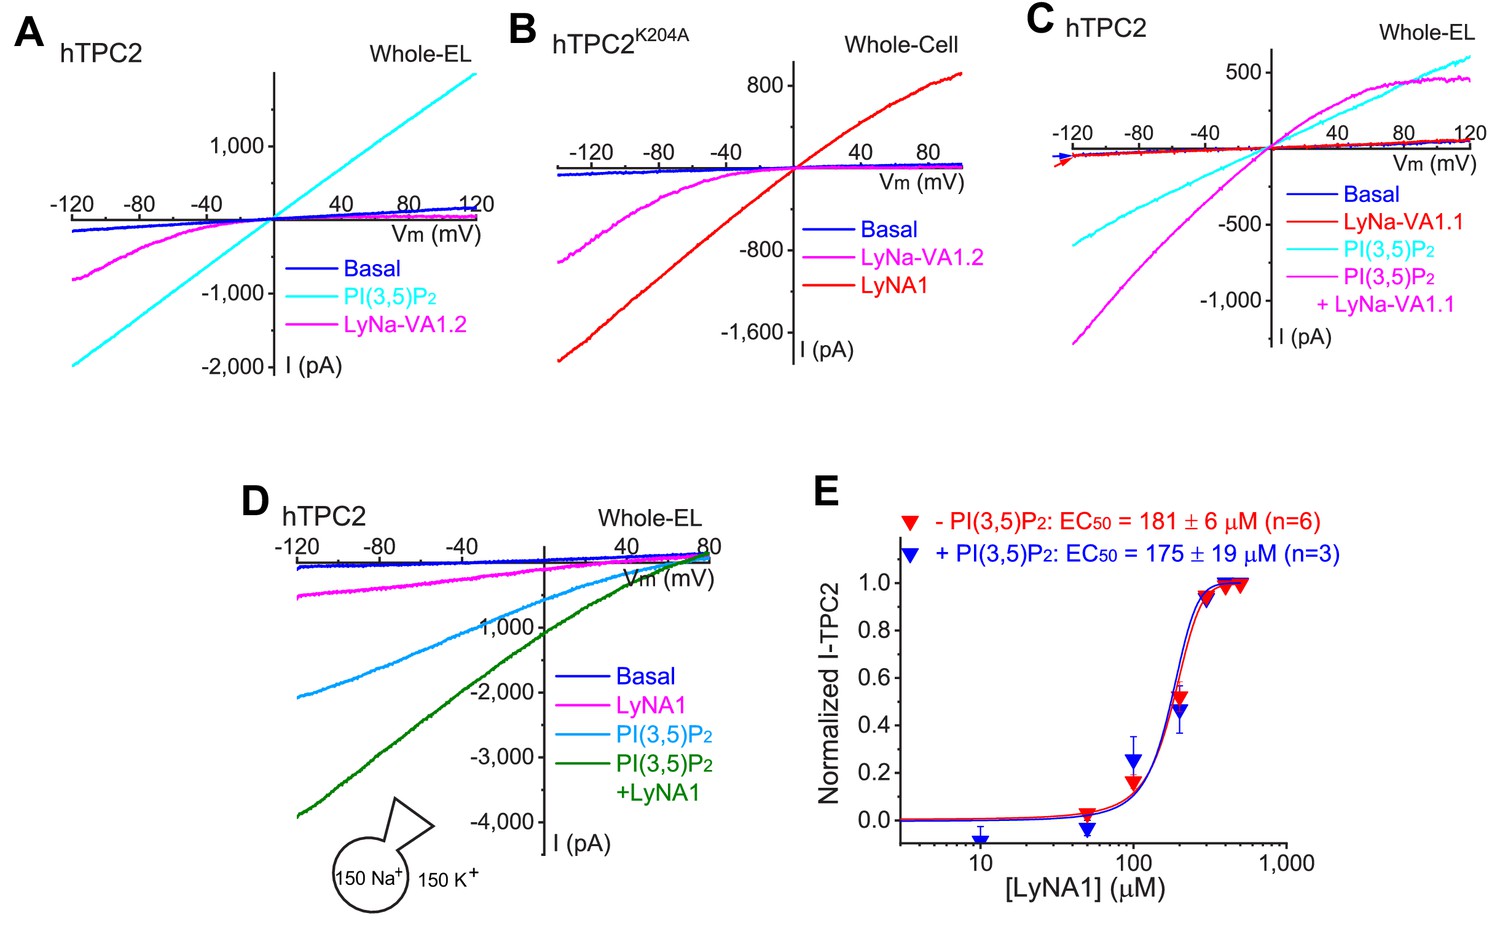
LyNa-VAs and LyNA1 activate TPCs independent of PI(3,5)P2.
(A) The effects of PI(3,5)P2 (0.3 µM) and LyNa-VA1.2 (100 µM) on whole-endolysosome ITPC2 in TPC2-transfected Cos1 cells. (B) Whole-cell ITPC2-K204A activated by LyNa-VA1.2 and LyNA1 in TPC2K204A-transfected HEK293 cells. (C) Synergetic effects of PI(3,5)P2 (50 nM) and LyNa-VA1.1 (30 µM) on whole-endolysosome ITPC2. (D) Additive effects of PI(3,5)P2 (50 nM) and LyNA1 (150 µM) on whole-endolysosome ITPC2. (E) Dose-dependent activation of TPC2 by LyNA1 in the presence or absence of PI(3,5)P2 (10 nM). Both individual data points and Mean ± S.E.M are presented (n ≥ 3 patches; also see individual data in Figure 3—figure supplement 1—source data 1).
-
Figure 3—figure supplement 1—source data 1
Dose-dependent activation of TPC2 by LyNA1 in the presence or absence of PI(3,5)P2.
- https://cdn.elifesciences.org/articles/51423/elife-51423-fig3-figsupp1-data1-v1.xlsx
Figure 4 with 2 supplements
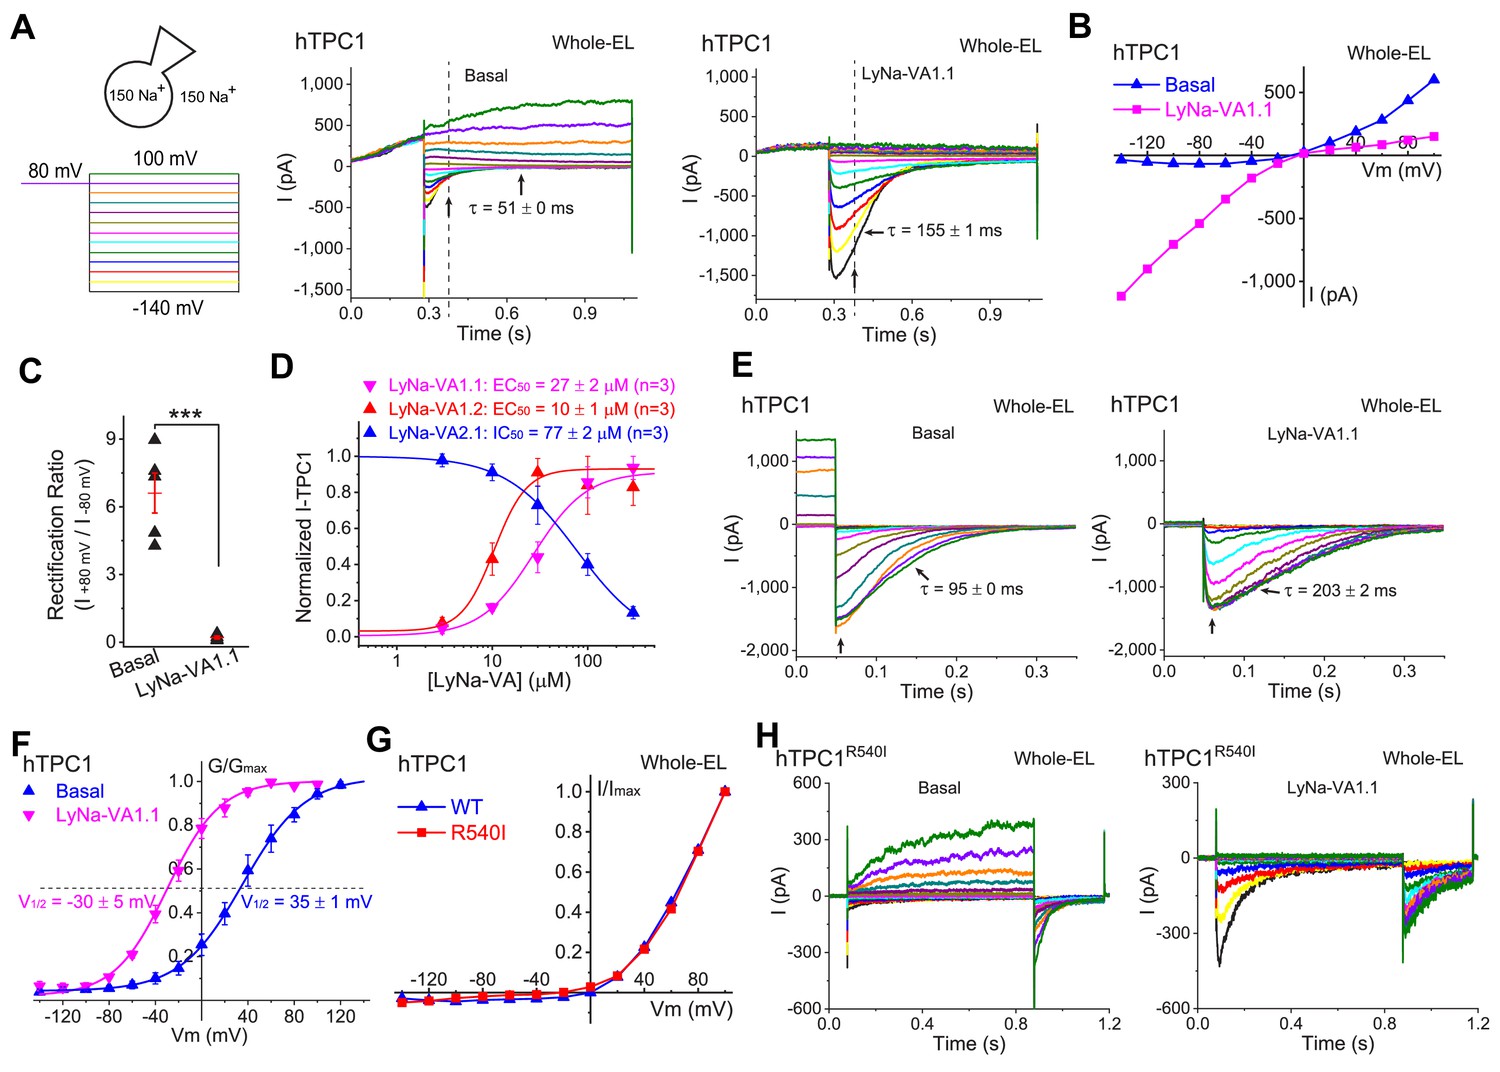
Activation of lysosomal TPC1 channels by LyNa-VAs.
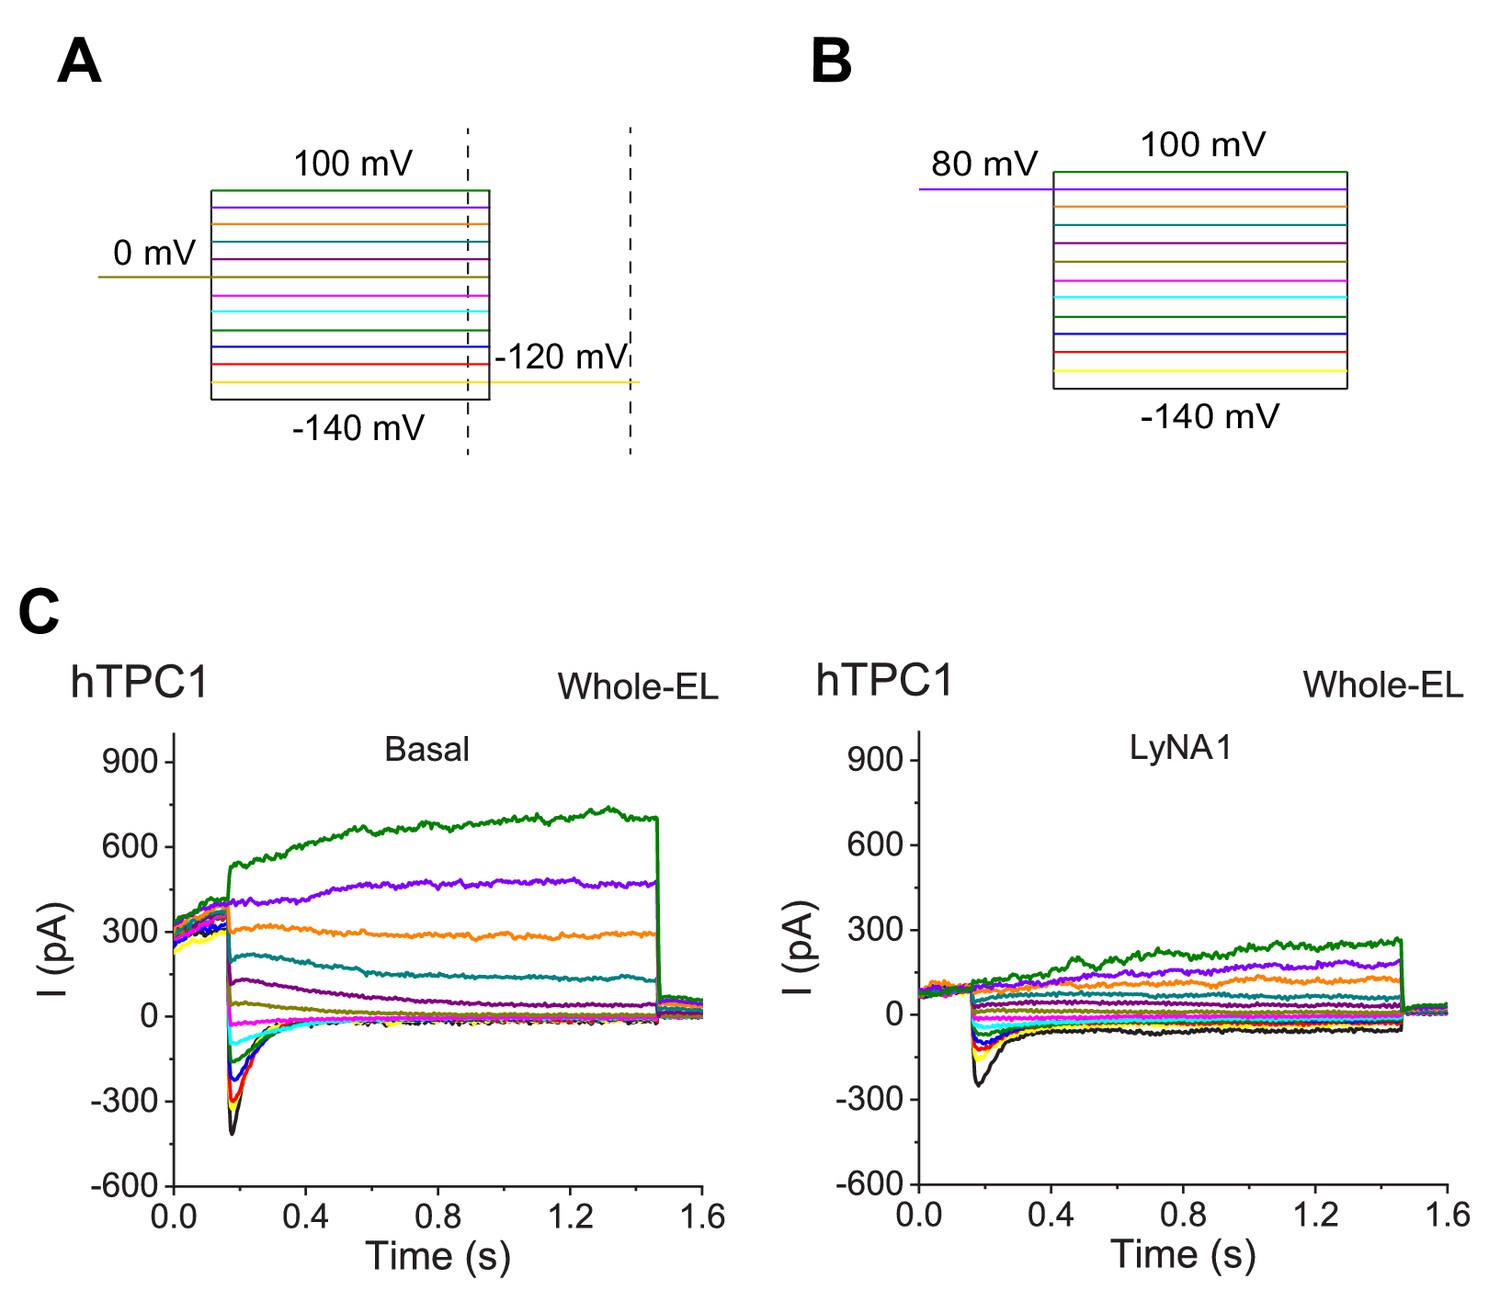
(A) Whole-endolysosome TPC1 current (ITPC1) was activated by LyNa-VA1.1 (right) and elicited by a voltage step protocol (left), in which a preconditioning voltage (80 mV, 0.3 s) was applied before voltage steps starting from −140 to 100 mV (0.8 s, ∆V = 20 mV). HP = 0 mV. Unless otherwise indicated, symmetric 150 mM Na+ solutions were used for all whole-endolysosome recordings, and LyNa-VA1.1 (100 µM) was bath-applied. (B) I-V plots of basal- and LyNa-VA1.1-induced ITPC1, which were recorded from the same vacuole. Dotted lines in A indicate where the currents were measured. (C) Summary of rectification index of basal and LyNa-VA1.1-induced ITPC1. Individual data and Mean ± S.E.M are presented. ***, p<0.001. (D) Does-dependent activation or inhibition of TPC1 by LyNa-VA1.1, LyNa-VA1.2, and LyNa-VA2.1. Data are presented as Mean ± S.E.M (n = 3 patches). (E) The effects of LyNa-VA1.1 on ITPC1 tail currents at −120 mV. The voltage protocol that elicited ITPC1 tail currents was shown in Figure 4—figure supplement 1A. (F) The effects of LyNa-VA1.1 on the G-V curves of ITPC1 (n = 4–5 patches). (G) Normalized I-V plots of basal voltage-dependent currents in WT TPC1- and TPC1R540I-transfected cells. (H) The basal and LyNa-VA1.1-activated ITPC1-R540I step currents, which were recorded from the same vacuole. Individual data for (C), (D) and (F) are also presented in Figure 4—source data 1.
-
Figure 4—source data 1
Activation of lysosomal TPC1 channels by LyNa-VAs.
- https://cdn.elifesciences.org/articles/51423/elife-51423-fig4-data1-v1.xlsx
Figure 4—figure supplement 1
Inhibition of lysosomal TPC1 channels by LyNA-1.
(A) A voltage protocol that elicited ITPC1 tail currents as shown in Figure 4E (from −140 to 100 mV with a ∆V = 20 mV, 1 s with a 10 s inter-step interval). Arrows indicate where tail currents were measured. (B) A voltage protocol that elicited ITPC1 tail currents as shown in C. A preconditioning voltage (+80 mV, 0.2 s) was applied before voltage steps starting from −140 to 100 mV (1.3 s, ∆V = 20 mV). HP = 0 mV. (C) In comparison to the basal ITPC1 (right), LyNA1 (150 µM) inhibited (left) ITPC1.
Figure 4—figure supplement 2
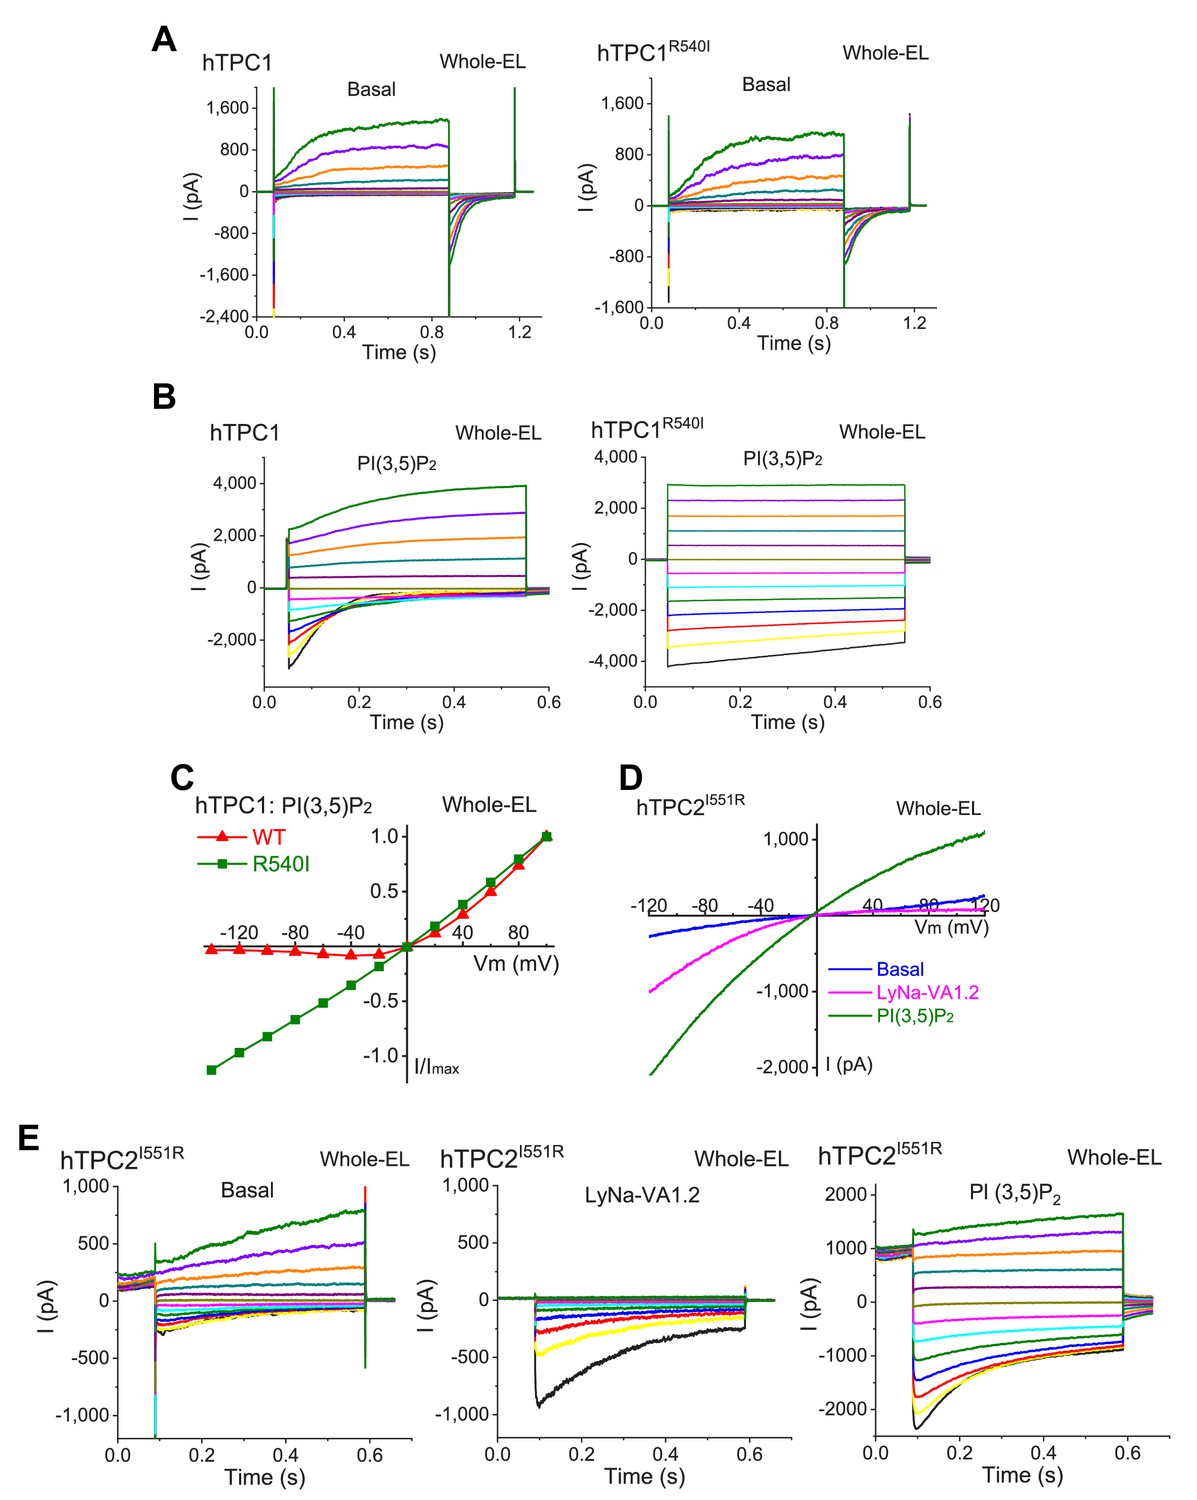
Voltage-dependence and PI(3,5)P2-sensitivity of R540I mutant TPC1 channels.
(A) Basal whole-endolysosome ITPC1 (left) or ITPC1-R540I (right) was elicited by voltage steps (−140 to +100 mV with ΔV = 20 mV) in the absence of PI(3,5)P2 in TPC1-transfected Cos1 cells (She et al., 2019). Tail currents were elicited at −120 mV. (B) The effects of PI(3,5)P2 (0.3 µM) on ITPC1 (left) and ITPC1-R540I (right) step currents. (C) I-V plots of steady-state ITPC1 and ITPC1-R540I step currents shown in B. (D) LyNa-VA1.2-induced whole-endolysosome ITPC2-I551R was evoked by a voltage ramp from −120 to +120 mV (duration = 200 ms). (E) The basal (right), LyNa-VA1.2 (200 µM)- (middle) and PI(3,5)P2 (0.3 µM)- (left) activated lysosomal ITPC1-I551R were recorded from the same vacuole. A preconditioning voltage (+80 mV, 0.1 s) was applied before voltage steps starting from −140 to 100 mV (0.5 s, ∆V = 20 mV). HP = 0 mV.
Figure 5 with 1 supplement

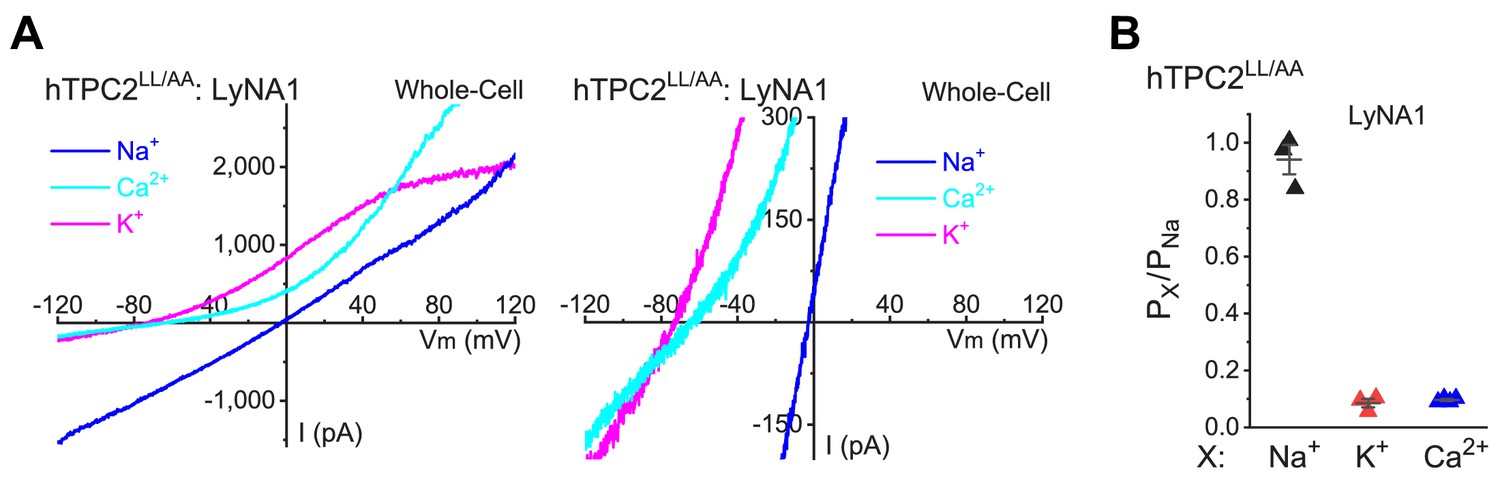
LyNa-VAs do not change the cationic selectivity of TPC2 channels.
(A) Representative PI(3,5)P2-evoked whole-endolysosome ITPC2 elicited by a voltage ramp from −120 to 120 mV. The recordings were performed under a bi-ionic condition with 150 (in mM) Na+ in the pipette solution and 150 Na+ or 150 K+ in the bath solution. PI(3,5)P2 (0.3 µM) was bath-applied. (B, C) Representative PI(3,5)P2- evoked ITPC2 elicited with voltage steps (−140 mV to 100 mV with a ∆V = 20 mV, 0.5 s) with 150 mM Na+ (B) or K+(C) in the bath solution. (D, E) Representative LyNa-VA1.2-activated ITPC2 step currents. (F) Representative I-V plots of LyNa-VA1.2- activated ITPC2 measured from the instantaneous currents in (D) and (E). Note the reversal potentials (Erev) of LyNa-VA1.2- activated ITPC2 in the presence of Na+ or K+ bath solution. (G) LyNa-VA1.2- activated ITPC2 under the bi-ionic conditions of bath/cytosolic Na+ and pipette/luminal Ca2+. 150 Na+ solution contained (in mM) 145 NaCl, 5 NaOH, 20 HEPES, (pH 7.2); isotonic (105 mM) Ca2+ solution contained (in mM) 100 CaCl2, 5 Ca(OH)2, 20 HEPES (pH 7.2). Right panel zoom-in micrograph shows the Erev of LyNa-VA1.2- activated ITPC2. (H–J) Representative I-V plots of LyNa-VA1.2- evoked ITPC2-N653G (J) measured from Na+ (H) and K+ (I) bath solution. (K) Summary of Na+ vs. K+ /Ca2+ selectivity of WT TPC2 and TPC2N653G channels. Individual data and Mean ± S.E.M are presented (also see Figure 5—source data 1). N.S., no significance.
-
Figure 5—source data 1
Ionic selectivity of WT TPC2 and N653G mutant channels.
- https://cdn.elifesciences.org/articles/51423/elife-51423-fig5-data1-v1.xlsx
Figure 5—figure supplement 1
LyNA1 does not change the Na+ selectivity of TPC2 channels.
(A) LyNA1 (300 µM)- activated whole-cell ITPC2-LL/AA under the bi-ionic conditions (in mM), that is pipette/cytosolic 150 Na+ and bath/extracellular 150 Na+, 150 K+ or 105 Ca2+. Right panel: zoom-in micrograph shows the Erev changes of ITPC2 with different bath solutions. (B) Summary of cationic selectivity values for LyNA1-induced ITPC2. Both individual data points and Mean ± S.E.M are presented (see individual data in Figure 5—figure supplement 1—source data 1).
-
Figure 5—figure supplement 1—source data 1
LyNA1 does not change ionic selectivity of TPC2 channels.
- https://cdn.elifesciences.org/articles/51423/elife-51423-fig5-figsupp1-data1-v1.xlsx
Author response image 1
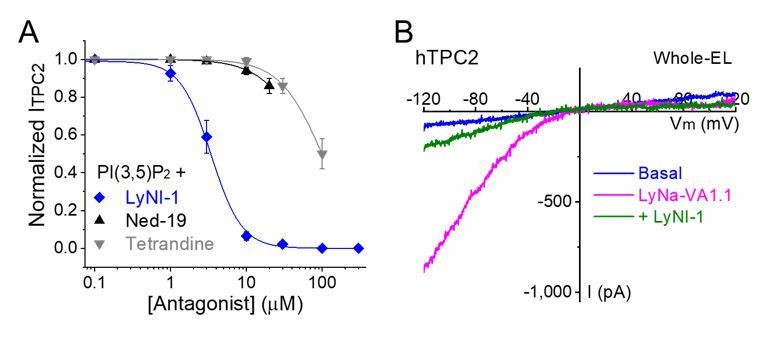
LyNa-VA-induced currents are inhibited by LyNI-1, a small-molecule TPC2 inhibitor.
(A) Dose-dependent inhibition of LyNI-1 on PI(3,5)P2 (0.1 µM)-induced whole-endolysosome ITPC2 (IC50 = 3 ± 1 µM, n=3 patches). (B) Co-application of LyNI-1(100 µM) inhibited LyNa-VA1.1 (50 µM)-evoked whole-endolysosome ITPC2.
Tables
Table 1
Summary of electrophysiology-based screening of TPC agonists.
Based on chemical structures, LyNa-VAs were divided into two groups: LyNa-VA1.x and LyNa-VA2.x. EC50 and the average TPC2 currents (ITPC2) were calculated based on 3–5 whole-cell or whole-endolysosome recordings (see individual data in Table 1—source data 1) for each LyNa-VA, respectively.
| LyNa-VAs | Chemical name | Structure | EC50 (μM)* | ITPC2 (pA)** |
|---|---|---|---|---|
| LyNa-VA1.1 | Clomipramine | 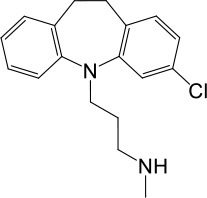 | 43 ± 2 | 945 ± 111 |
| LyNa-VA1.2 | Desipramine | 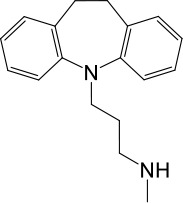 | 87 ± 8 | 1120 ± 94 |
| LyNa-VA1.3 | Imipramine | 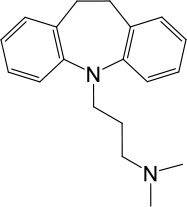 | 112 ± 1 | 433 ± 94 |
| LyNa-VA1.4 | Amitriptyline | 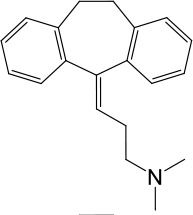 | 102 ± 3 | 876 ± 196 |
| LyNa-VA1.5 | Nortriptyline | 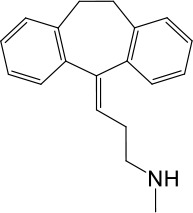 | 52 ± 10 | 1916 ± 361 |
| Carbamazepine | 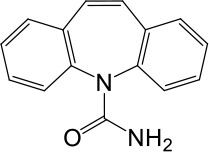 | No activation | No activation | |
| LyNa-VA2.1 | Chlorpromazine | 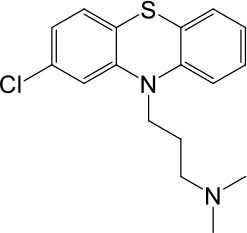 | 60 ± 2 | 1101 ± 508 |
| LyNa-VA2.2 | Triflupromazine | 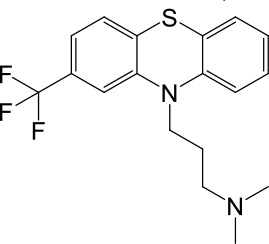 | 63 ± 2 | 984 ± 294 |
| Phenothiazine | 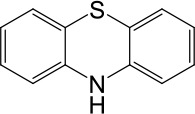 | No activation | No activation |
-
*Data were obtained from whole-cell recordings at −140 mV.
**Data were obtained from whole endolysosome recordings with 100 µM of LyNa-VAs at −120 mV.
-
Table 1—source data 1
Electrophysiology-based screening of TPC agonists.
- https://cdn.elifesciences.org/articles/51423/elife-51423-table1-data1-v1.xlsx
Key resources table
| Reagent type (species) or resource | Designation | Source or reference | Identifiers | Additional information |
|---|---|---|---|---|
| Cell line (Homo sapiens) | HEK293 | ATCC | RRID:CVCL_0045 | |
| Cell line (Homo sapiens) | HAP1 | Horizon Discovery | Cat. #: C631 | |
| Cell line (Chlorocebus aethiops) | Cos1 | ATCC | RRID:CVCL_0223 | |
| Recombinant DNA reagent | pEGFP-C2-TPC2 (plasmid) | Wang et al., 2012 | ||
| Recombinant DNA reagent | pEGFP-C2-TPC1 (plasmid) | Wang et al., 2012 | ||
| Sequence-based reagent | TPC1-sgRNA | This paper | sgRNA | CTTGCAGTACTTCAGCACCC |
| Sequence-based reagent | TPC2-sgRNA | This paper | sgRNA | CCCCAGCGTCGGGCTGCTGC |
| Sequence-based reagent | TPC1-fw | This paper | PCR primers | ATGGCCCAGACATGTGACTC |
| Sequence-based reagent | TPC1-re | This paper | PCR primers | TGCCTGTCTCCATCCTCTCA |
| Sequence-based reagent | TPC2-fw | This paper | PCR primers | TGAGCTGAGCATGAGGCAAG |
| Sequence-based reagent | TPC2-re | This paper | PCR primers | AAAGGACAAGTGGCCCTGAG |
| Chemical compound, drug | Desipramin hydrochloride | Sigma | Cat. #: D3900 | |
| Chemical compound, drug | Carbamazepine | Sigma | Cat. #: C4024 | |
| Chemical compound, drug | monensin | Sigma | Cat. #: M5273 | |
| Chemical compound, drug | ionomycin | Sigma | Cat. #: I0634 | |
| Chemical compound, drug | Clomipramine | Cayman Chemical | Cat. #: 15884 | |
| Chemical compound, drug | Imipramine | Cayman Chemical | Cat. #: 15890 | |
| Chemical compound, drug | Amitriptyline | Cayman Chemical | Cat. #: 15881 | |
| Chemical compound, drug | Nortriptyline | Cayman Chemical | Cat. #: 15904 | |
| Chemical compound, drug | Phenothiazine | NCATS | CAS: 92-84-2 | |
| Chemical compound, drug | Triflupromazine | NCATS | CAS: 146-54-3 | |
| Chemical compound, drug | Chlorpromazine | Cayman Chemical | Cat. #: 16129 | |
| Chemical compound, drug | ML-SA1 | Princeton BioMolecular Research Inc | Cat. #: OSSK_389119 | |
| Chemical compound, drug | PI(3,5)P2 | Echelon Biosciences | Cat. #: P-3508 | |
| Chemical compound, drug | vacuolin-1 | Calbiochem | Cat. #: 673000 | |
| Software, algorithm | pClamp | pClamp | RRID:SCR_011323 |
Additional files
Download links
A two-part list of links to download the article, or parts of the article, in various formats.
Downloads (link to download the article as PDF)
Open citations (links to open the citations from this article in various online reference manager services)
Cite this article (links to download the citations from this article in formats compatible with various reference manager tools)
Agonist-specific voltage-dependent gating of lysosomal two-pore Na+ channels
eLife 8:e51423.
https://doi.org/10.7554/eLife.51423


