Longitudinal trajectories, correlations and mortality associations of nine biological ages across 20-years follow-up
- Karolinska Institutet, Sweden
- University of California, Riverside, United States
- Indiana University Southeast, United States
- Jönköping University, Sweden
Figures
Figure 1 with 1 supplement

Longitudinal trajectories of BAs in 845 individuals (3973 measurements) with information on at least one BA.
A total of 3973 repeated measurements assessed from 845 individuals were included to estimate the longitudinal trajectories of BAs. For each BA estimation, the numbers of available individuals and measurements varied and were specified in the heading of each panel. Longitudinal changes in BAs were modeled as functions of CA (as a natural spline with three degrees of freedom) and sex, with random effects at the individual and twin-pair levels (mixed models). Both individual-level BAs and population BA means over CA in men and women are presented in Panel (A-I). BA measurements were presented as orange dots, lines or broken lines when one, two, or more than two measurements were assessed for a given individual. Average changes of BAs with age in the study population were indicated by smooth lines (blue for men and pink for women). The longitudinal growth of the three functional BAs (cognitive function, FAI, and FI) show an accelerated rate of change around the age of 70 (Panel J-I), whereas the other BAs exhibit relatively linear trajecotries over the age span (Panel A-F). BA, biological age; DNAmAge, DNA methylation age estimator; FAI, functional aging index; FI, frailty index.
Figure 1—figure supplement 1
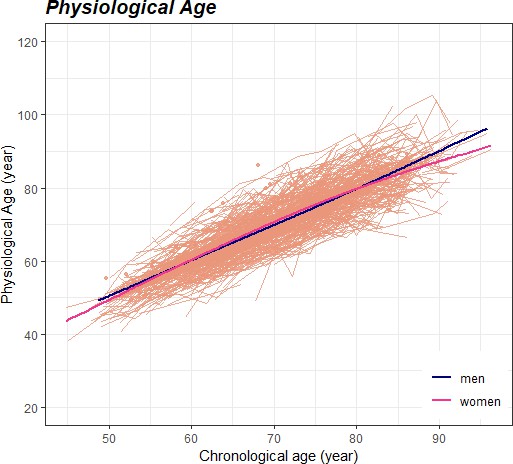
Longitudinal trajectory of physiological age with sex interaction term introduced to the mixed model.
A total of 3175 repeated measurements assessed from 802 individuals were included to estimate the longitudinal trajectory of physiological age. Longitudinal changes in BAs were modeled as functions of CA (as a natural spline with three degrees of freedom), sex, and a multiplicative interaction term of CA and sex, with random effects at the individual and twin-pair levels (mixed models). Both individual-level BA and population BA means over CA in men and women are presented. Measurements of physiological age were presented as orange dots, lines or broken lines when one, two, or more than two measurements were assessed for a given individual. Average changes of BA with age in the study population were indicated by smooth lines (blue for men and pink for women). The shape of the physiological age curve differed between men and women (p<0.001 for sex interaction). However, the difference was mainly observed at the end of the CA spectrum (i.e., before the age of 50 and after the age of 85).
Figure 2 with 1 supplement
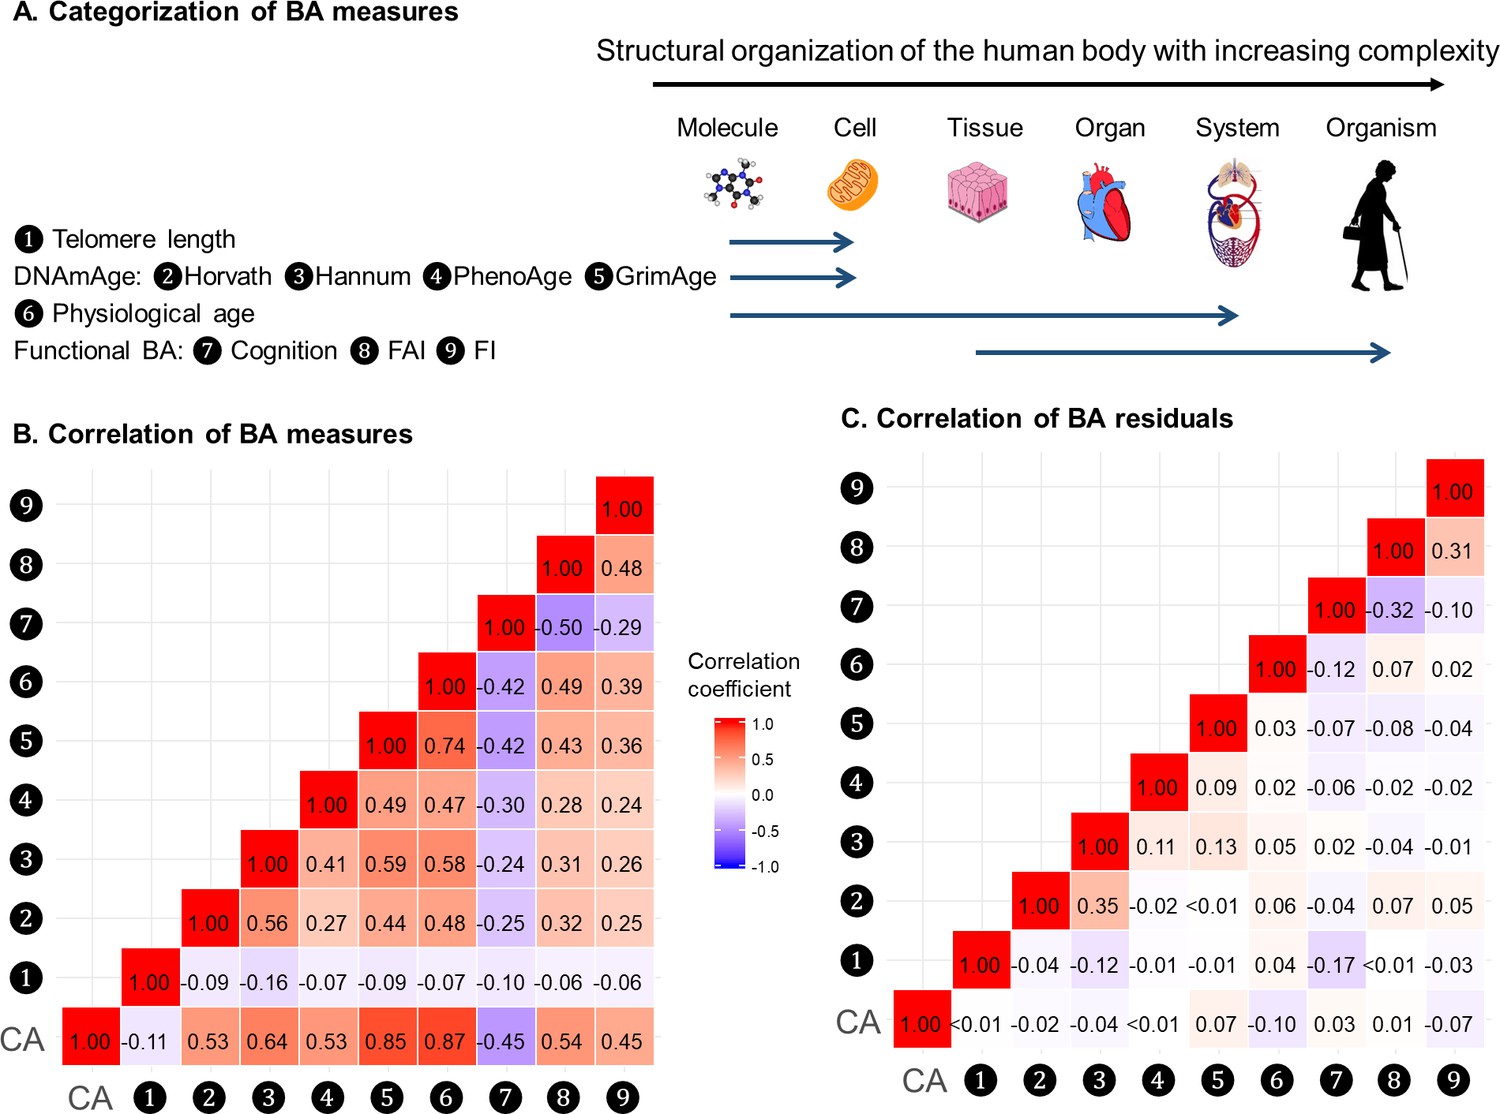
Correlations of BAs in 288 individuals (612 complete measurements).
A total of 612 complete measurements assessed from 288 individuals were included to estimate the correlations of BAs. BAs were broadly categorized into four groups according to the main biological structural levels where the BA measurements were implemented (Panel A). We estimated the repeated-measure correlation coefficients between BAs and between BA residuals and illustrated the correlation coefficients in heat maps (Panel B-C). Red and blue tiles represented positive and negative correlations, respectively; color density indicated the magnitude of correlation coefficients. All BAs were correlated to varying degrees (Panel B). After regressing out CA from BAs, most of the original correlations were attenuated (Panel C). BA, biological age; DNAmAge, DNA methylation age estimator; FAI, functional aging index; FI, frailty index; CA, chronological age.
Figure 2—figure supplement 1
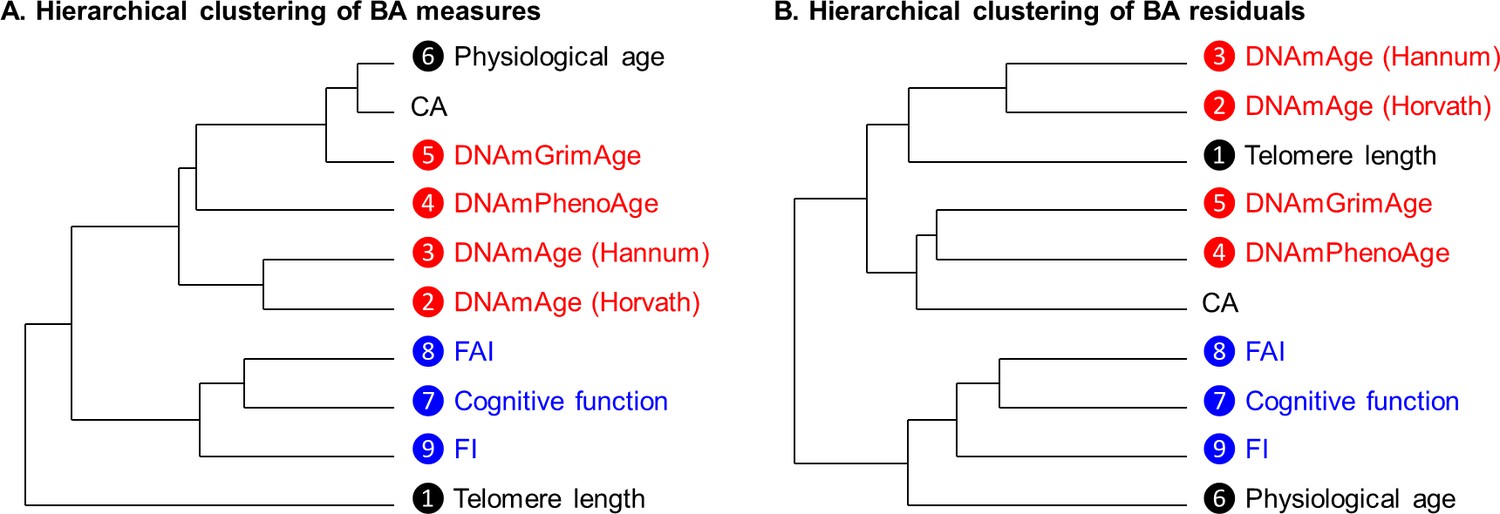
Hierarchical clustering of BA in 288 individuals (612 complete measurements).
A total of 612 complete measurements assessed from 288 individuals were included. We transformed correlation coefficients into Euclidean distances and then performed hierarchical cluster analysis, illustrated in the dendrograms. Four types of DNAmAges and three types of functional BAs were presented in the color of red and blue, respectively. The same types of BAs, that is methylation BAs and functional BAs, tended to be more closely related. GrimAge and PhenoAge, however, were somewhat separated from the other two DNAmAges, especially using BA residuals.
Figure 3
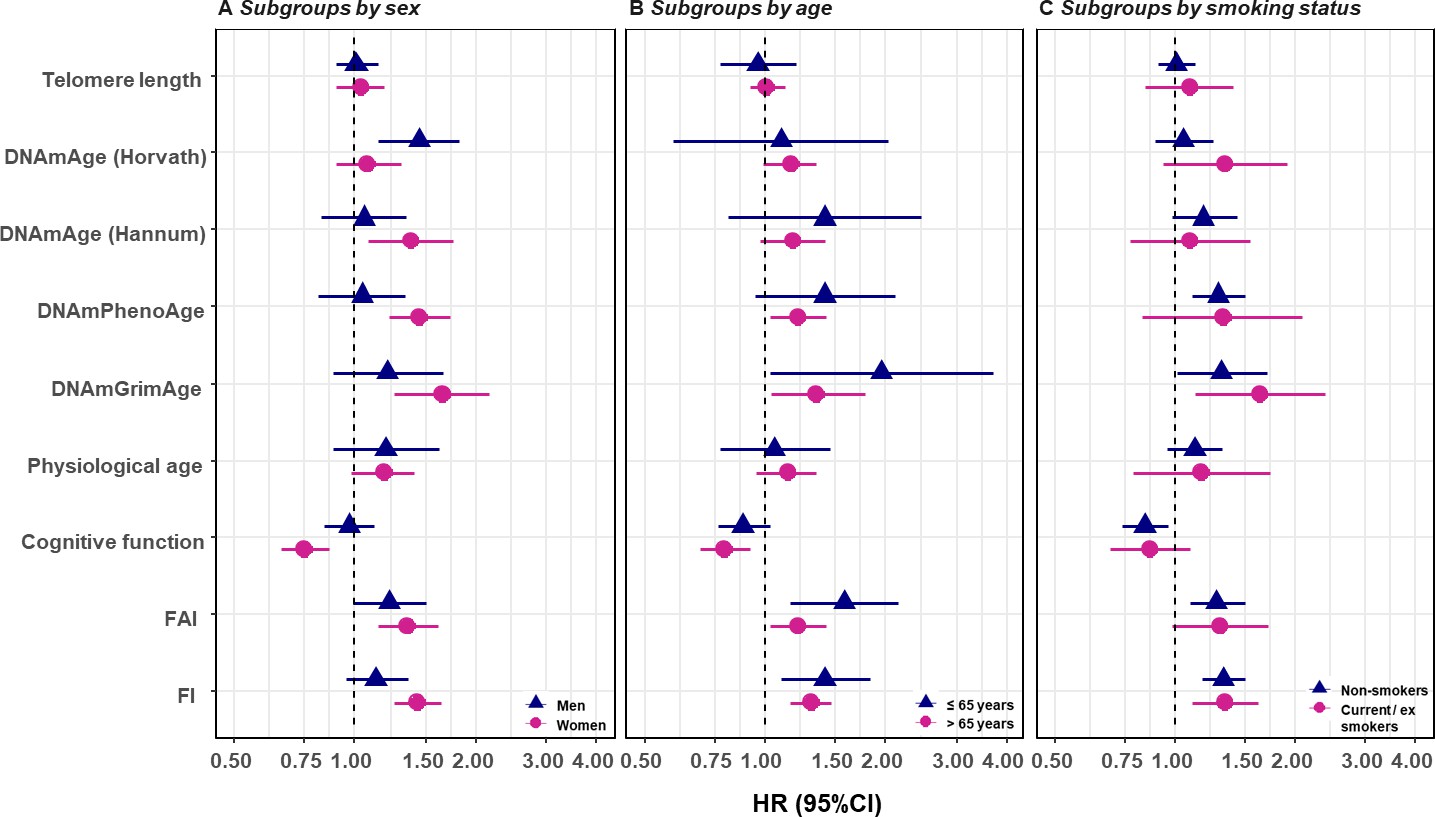
Survival analyses of baseline BAs with the risk of all-cause mortality in subgroups classified by sex, baseline smoking status, and baseline age (one-BA models).
A total of 845 individuals were included to estimate the mortality associations of BAs in subgroups. The numbers of individuals in each subgroups were specified in the Supplementary file 1G–I. We used Cox regression models to estimate the change in mortality risk associated with a one-SD increment of the respective BA at baseline assessment (one-BA models). All models controlled for sex, educational attainment, smoking status, and BMI, stratified by participants’ birth year, and accounted for left truncation and right censoring. Attained age was used as the time-scale and thus age was inherently adjusted for. BA-mortality associations by were illustrated in the forest plot (Panel A-C), in which points and horizontal lines denoted HRs (95%CIs) and point shapes and colors represented subgroups. The associations of BAs with mortality risk were generally stronger in women (except for Horvath DNAmAge and physiological age), more pronounced in the younger individuals (except for Horvath DNAmAge, physiological age and cognitive function), and a bit stronger in current or ex- smokers (for Horvath DNAmAge and DNAmGrimAge). BA, biological age; DNAmAge, DNA methylation age estimator; FAI, functional aging index; FI, frailty index; CA, chronological age; HRs (95%CIs), hazard Ratio (95% Confidence Interval).
Author response image 1
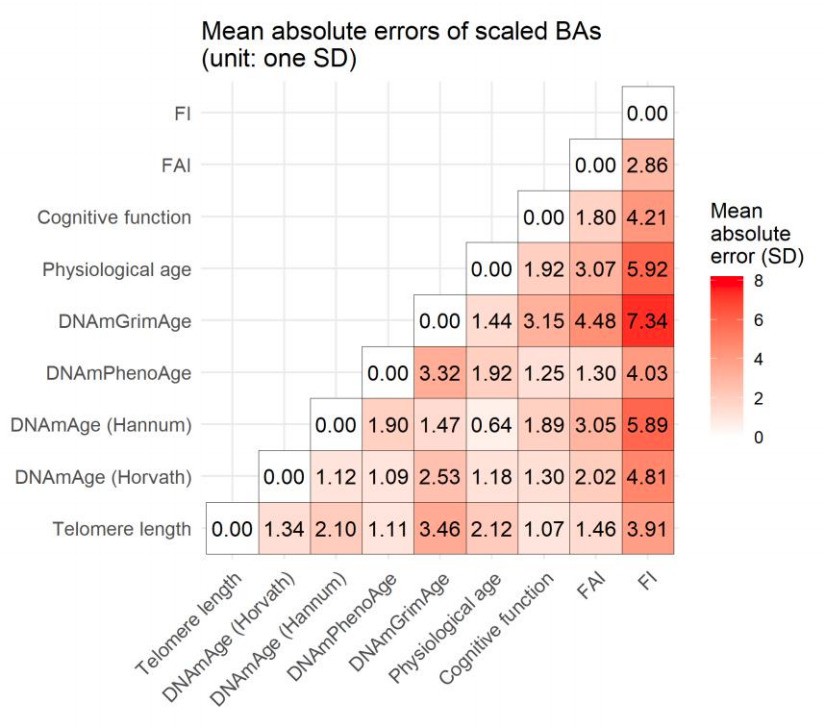
Mean absolute errors of BA pairs.
Tables
Table 1
Number of individuals and measurements with information on BAs.
| Individuals | Measurements | Included IPTs | |
|---|---|---|---|
| Telomere length | 636 | 1599 | 3, 5, 6, 8, 9 |
| DNAmAge (four types) | 387 | 1028 | 3, 5, 6, 8, 9 |
| Physiological age | 802 | 3175 | 1, 2, 3, 5, 6, 7, 8, 9, 10 |
| Cognitive function | 829 | 3045 | 1, 2, 3, 5, 6, 7, 8, 9 |
| FAI | 739 | 2922 | 2, 3, 5, 6, 7, 8, 9, 10 |
| FI | 756 | 3162 | 2, 3, 5, 6, 7, 8, 9, 10 |
| At least one BA | 845 | 3973 | 1, 2, 3, 5, 6, 7, 8, 9, 10 |
| Complete nine BAs | 288 | 612 | 3, 5, 6, 8, 9 |
-
One measurement refers to one in-person testing occasion with at least one BA assessed in a given individual.
DNAmAges include four different types: Horvath, Hannum, PhenoAge, GrimAge.
-
BA, biological age; IPT, in-person testing; DNAmAge, DNA methylation age estimator; FAI, functional aging index; FI, frailty index.
Table 2
The construction of BAs.
| Component elements | Measurement | Statistical methods | |
|---|---|---|---|
| Telomere length (Berglund et al., 2016) | Leukocyte telomere length | qPCR | Ratio of measured telomere length to a reference length |
| DNAmAges: | Leukocyte DNA Methylation levels of: | Infinium HumanMethylation 450K BeadChip | Established clock algorithms, developed by: |
| Horvath (Horvath, 2013) | 353 age-associated CpGs | Elastic net regression (regressing CA on CpGs) | |
| Hannum (Hannum et al., 2013) | 71 age-associated CpGs | Elastic net regression (regressing CA on CpGs) | |
| PhenoAge (Levine et al., 2018) | 513 PhenoAge-associated CpGs | Step 1: Penalized proportional hazard regression (regressing time-to-death on clinical markers and CA to create PhenoAge); Step 2: Elastic net regression (regressing PhenoAge on CpGs) | |
| GrimAge (Lu et al., 2019) | Smoking pack-years- and seven plasma proteins-associated CpGs (1030 unique sites) | Step 1: Elastic net regression (regressing biomarkers on CpGs to develop DNAm-based biomarkers); Step 2: Elastic net Cox regression (regressing time-to-death on DNAm-based biomarkers and CA) | |
| Physiological age | Age-related biomarkers, including: Blood biomarkers: hemoglobin, glucose, cholesterol, Apolipoprotein B, triglyceride; Clinical markers: BMI, waist hip rate, weight, waist circumference, hip circumference, systolic BP, diastolic BP | Blood test and physical examination | Principal component analysis and the Klemera and Doubal methods (Klemera and Doubal, 2006) |
| Cognitive function (Reynolds et al., 2005) | Verbal (crystallized) ability, spatial (fluid) ability, memory, and perceptual speed | In-person cognitive testing | Principal component analysis |
| FAI (Finkel et al., 2019) | Sensory (vision and hearing), pulmonary, strength (grip strength), and movement/balance (gait speed) | Self-reported questionnaire and physical examination | Sum of standardized scores |
| FI (Jiang et al., 2017) | 42 health deficits | Self-reported questionnaire | Ratio of the number of deficit presented to the total number of deficit considered |
-
BA, biological age; IPT, in-person testing; DNAmAge, DNA methylation age estimator; FAI, functional aging index; FI, frailty index; BMI, body mass index; qPCR, quantitative polymerase chain reaction; CpG, cytosine nucleotide being followed by a guanine nucleotide; BP, blood pressure.
Table 3
Characteristics of baseline (first available) measurements in 845 individuals with information on at least one BA.
| Baseline measurements in all individuals | Baseline measurements in individuals with corresponding BAs | ||||||
|---|---|---|---|---|---|---|---|
| Telomere length (T/S ratio) | DNAmAge (year) | Physiological age (year) | Cognitive function | FAI | FI | ||
| Number of participants | 845 | 636 | 387 | 802 | 829 | 739 | 756 |
| Women (%) | 59.5 | 58.5 | 59.9 | 58.9 | 59.6 | 59 | 59.4 |
| Above primary education (%) | 42.2 | 45.4 | 45.5 | 41.8 | 42.6 | 43.7 | 43.3 |
| BMI (kg/m2) | 25.7 (3.9) | 26.3 (4.1) | 26.3 (4.3) | 25.6 (3.9) | 25.7 (3.9) | 25.8 (4) | 25.8 (4.1) |
| Current and ex-smokers (%) | 25.0 | 22.2 | 21.7 | 24.1 | 25.5 | 24.1 | 23.7 |
| Age (year) | 63.6 (8.6) | 68.8 (9.6) | 69 (9.6) | 64.5 (8.9) | 63.7 (8.3) | 65.3 (9.2) | 65.5 (9.4) |
| BA | 0.73 (0.17) | 60.4 (11.0) 65.2 (10.1) 63.8 (13.61) 69.4 (8.5) | 64.7 (10.3) | 51.5 (10.4) | 48.3 (11.4) | 0.10 (0.08) | |
| Number of measurements | 2.5 (1.3) | 2.7 (1.3) | 4.0 (2.2) | 3.7 (2.1) | 4.0 (2.4) | 4.2 (2.5) | |
-
Values are means (standard deviations; SDs) unless stated otherwise.
Values of ‘BA’ in the ‘DNAmAge’ column refer to four different types of DNAmAge: Horvath, Hannum, PhenoAge, and GrimAge, respectively.
-
BA, biological age; IPT, In-person testing; DNAmAge, DNA methylation age estimator; FAI, functional aging index; FI, frailty index; BMI, body mass index.
Table 4
Survival analyses of baseline (first available) BAs with the risk of all-cause mortality in 845 individuals (one-BA models).
| BAs | Number of individuals | Number of deaths | Median follow-up time (year) | Model 1 | Model 2 |
|---|---|---|---|---|---|
| Telomere length | 636 | 389 | 15.8 | 0.96 (0.87, 1.06) | 1.01 (0.92, 1.11) |
| DNAmAge (Horvath) | 387 | 240 | 16.1 | 1.14 (1.00, 1.32) | 1.17 (1.01, 1.36) |
| DNAmAge (Hannum) | 387 | 240 | 16.1 | 1.24 (1.05, 1.46) | 1.17 (0.98, 1.40) |
| DNAmPhenoAge | 387 | 240 | 16.1 | 1.22 (1.06, 1.40) | 1.26 (1.08, 1.47) |
| DNAmGrimAge | 387 | 240 | 16.1 | 1.49 (1.18, 1.89) | 1.39 (1.11, 1.75) |
| Physiological age | 802 | 543 | 18.7 | 1.12 (0.98, 1.29) | 1.13 (0.97, 1.31) |
| Cognitive function | 829 | 570 | 19.2 | 0.83 (0.75, 0.91) | 0.85 (0.76, 0.94) |
| FAI | 739 | 481 | 17.9 | 1.21 (1.06, 1.38) | 1.27 (1.10, 1.47) |
| FI | 756 | 498 | 17.7 | 1.28 (1.15, 1.43) | 1.32 (1.18, 1.48) |
-
Values are Hazard Ratios (95% Confidence Interval) [HR (95% CI)] unless stated otherwise.
HRs (95%CIs) in each column refer to the relative risks associated with one-SD increase in the level of BA of nine different models with one corresponding BA being the predictor of the mortality risk. Model 1 is the uni-variate survival model with only one BA taken into account. Model 2 is the multi-variate survival model, in which common risk factors (sex, education attainment, smoking status, and BMI) were additionally adjusted for on the basis of Model 1. All models were stratified by participants’ birth year (in 10-year interval). Attained age was used as the time-scale and thus age was inherently adjusted for.
-
BA, biological age; DNAmAge, DNA methylation age estimator; FAI, functional aging index; FI, frailty index.
Table 5
Survival analyses of baseline (first available) BA residuals with the risk of all-cause mortality in 288 individuals with complete measurements (nine-BA models).
| BA residuals | Model 1 | Model 2 |
|---|---|---|
| Telomere length | 0.98 (0.86, 1.12) | 1.03 (0.89, 1.19) |
| DNAmAge (Horvath) | 1.22 (1.01, 1.48) | 1.31 (1.08, 1.58) |
| DNAmAge (Hannum) | 1.05 (0.88, 1.26) | 1.03 (0.83, 1.28) |
| DNAmPhenoAge | 1.08 (0.87, 1.33) | 1.13 (0.91, 1.40) |
| DNAmGrimAge | 1.44 (1.19, 1.74) | 1.43 (1.11, 1.84) |
| Physiological age | 0.99 (0.88, 1.12) | 1.01 (0.87, 1.18) |
| Cognitive function | 0.92 (0.76, 1.12) | 1.01 (0.85, 1.20) |
| FAI | 1.08 (0.90, 1.29) | 1.04 (0.86, 1.27) |
| FI | 1.46 (1.24, 1.72) | 1.58 (1.32, 1.89) |
-
During a median follow-up time of 16.5 years, 151 deaths were documented among 288 individuals.
Values are Hazard Ratios (95% Confidence Interval) [HR (95% CI)] unless stated otherwise.
-
HRs (95%CIs) in each column refer to relative risks associated with one-SD increase in the level of BA residual from one multi-variate model with all BA residuals being the predictors of the risk of mortality simultaneously. Model one took eight BA residuals into account. Model two additionally adjusted for common risk factors (sex, education attainment, smoking status, and BMI) on the basis of Model 1. All models were stratified by participants’ birth year (in 10 year interval). Attained age was used as the time-scale and thus age was inherently adjusted for.
BA, biological age; DNAmAge, DNA methylation age estimator; FAI, functional aging index; FI, frailty index.
Additional files
-
Supplementary file 1
Additional information with respect to methods and results in detail.
(A) Number of individuals with information on BAs by IPTs. (B) CA-biomarker correlations in the development of physiological age. (C) List of the 42 items included in the FI and their scoring. (D) Characteristics of baseline (first available) complete measurements in 288 individuals. (E) Repeated measures correlation coefficients of BAs in 288 individuals. (F) Survival analyses of baseline (first available) BA residuals with the risk of all-cause mortality in 845 individuals (one-BA models). (G) Survival analyses of baseline BAs with the risk of all-cause mortality in 845 individuals stratified by sex (one-BA models). (H) Survival analyses of baseline BAs with the risk of all-cause mortality in 845 individuals stratified by age group (one-BA models). (I) Survival analyses of baseline BAs with the risk of all-cause mortality in 845 individuals stratified by smoking status (one-BA models). (J) Survival analyses of baseline BAs with the risk of all-cause mortality in 288 individuals with complete measurements (one-BA models). (K) Survival analysis with additional adjustment for previous diseases.
- https://cdn.elifesciences.org/articles/51507/elife-51507-supp1-v1.docx
-
Supplementary file 2
14 variables related to the current analysis, including anonymized personal- and twin-pair IDs, measurement number, sex, CA at measurement, and levels of nine BAs.
- https://cdn.elifesciences.org/articles/51507/elife-51507-supp2-v1.xlsx
-
Transparent reporting form
- https://cdn.elifesciences.org/articles/51507/elife-51507-transrepform-v1.docx
-
Reporting standard 1
STROBE Statement—checklist of items that should be included in reports of observational studies.
- https://cdn.elifesciences.org/articles/51507/elife-51507-repstand1-v1.docx
Download links
A two-part list of links to download the article, or parts of the article, in various formats.
Downloads (link to download the article as PDF)
Open citations (links to open the citations from this article in various online reference manager services)
Cite this article (links to download the citations from this article in formats compatible with various reference manager tools)
Longitudinal trajectories, correlations and mortality associations of nine biological ages across 20-years follow-up
eLife 9:e51507.
https://doi.org/10.7554/eLife.51507


