LIS1 determines cleavage plane positioning by regulating actomyosin-mediated cell membrane contractility
- Department of Pediatrics, Institute for Human Genetics, Eli and Edythe Broad Center of Regenerative Medicine and Stem Cell Research, University of California, San Francisco, United States
- Howard Hughes Medical Institute and Department of Biology, Stanford University, United States
- Department of Genetics and Genome Sciences, Case Western Reserve University, School of Medicine, United States
Figures
Figure 1

Cleavage plane formation and positioning in the neocortical neural progenitor cells (NPCs) in WT-MADM and Pafah1b1-MADM embryos.
(A) Wild-type (WT) NPCs displayed recruitment of Anillin to the basal equatorial cortex and ultimately the Anillin-ring moved to the apical surface of the ventricular zone, forming a ‘U’-like shape. (B) Schematic representation of Pafah1b1-MADM mating scheme and three types of neocortical NPCs with different LIS1 expression levels. Immunoreactivity (IR) from immunohistochemistry experiment with anti-GFP and anti-tdT-c-Myc antibodies was indicated. (C) (e) Midbody-associated Anillin localization in WT (Pafah1b1+/+) NPCs, (f,g) Midbody-associated Anillin distribution was not detected in Pafah1b1 heterozygous (Pafah1b1ko/+) NPCs. (h) Complete knock-out (KO) of Pafah1b1 (Pafah1b1ko/ko) in NPCs results in mitotic arrest at the prometaphase- or metaphase-like time-points. (D) (i,j). WT NPCs displayed apical membrane-associated RhoA during cytokinesis. (k,l). RhoA was also co-localized with the midbody, at the future cleavage furrow. (E) (m,n). The cytosol from only one daughter cell retained RhoA-positive puncta in WT NPCs. (o) Complete KO of Pafah1b1 (Pafah1b1ko/ko) resulted in detachment of NPCs away from the RhoA-positive apical membrane. Gray arrowheads: ventricular surface (apical). Scale bars: 5 μm. Quantitative data were included in Figure 1—source data 1.
-
Figure 1—source data 1
Quantification of apical NPCs (RGs).
- https://cdn.elifesciences.org/articles/51512/elife-51512-fig1-data1-v2.docx
Figure 2

Localization of Anillin-ring in neocortical NPCs from controls and GFAP-Cre-induced Pafah1b1 mutant mouse embryos.
(A) Normal Anillin-ring distribution during cytokinesis of Pafah1b1 control (Pafah1b1hc/+) NPCs. hc: hypomorphic conditional allele, (a) Early anaphase, (b) Mid-anaphase with a basally located Anillin-ring, (c) ‘U’-like shape Anillin-ring at the cleavage furrow, (d) Midzone-specific Anillin localization. (a,b,c) Vertical cleavage plane (60°< α < 90°), α: spindle angle compared to the ventricular surface, (d) Oblique and horizontal cleavage plane (0°< α < 60°). (B) Abnormal Anillin-ring localization during cytokinesis of Pafah1b1-deficient mutant NPCs (GFAP-Cre; Pafah1b1hc/+). (e) Basal and apical Anillin-rings at the equator of NPCs, (f,g) Moderately skewed Anillin-ring localization in only one daughter cell. (h) The equator-associated Anillin-ring was detected with tilted spindle angle in Pafah1b1-deficient NPCs. (i) Pafah1b1-deficient mutant NPCs displayed horizontal cleavage plane with apical memrbrane-associated Anillin puncta. Gray arrowheads: ventricular surface (apical). Scale bars: 5 μm. Quantitative data were included in Figure 2—source data 1.
-
Figure 2—source data 1
Quantification of apical NPCs (RGs).
- https://cdn.elifesciences.org/articles/51512/elife-51512-fig2-data1-v2.docx
Figure 3
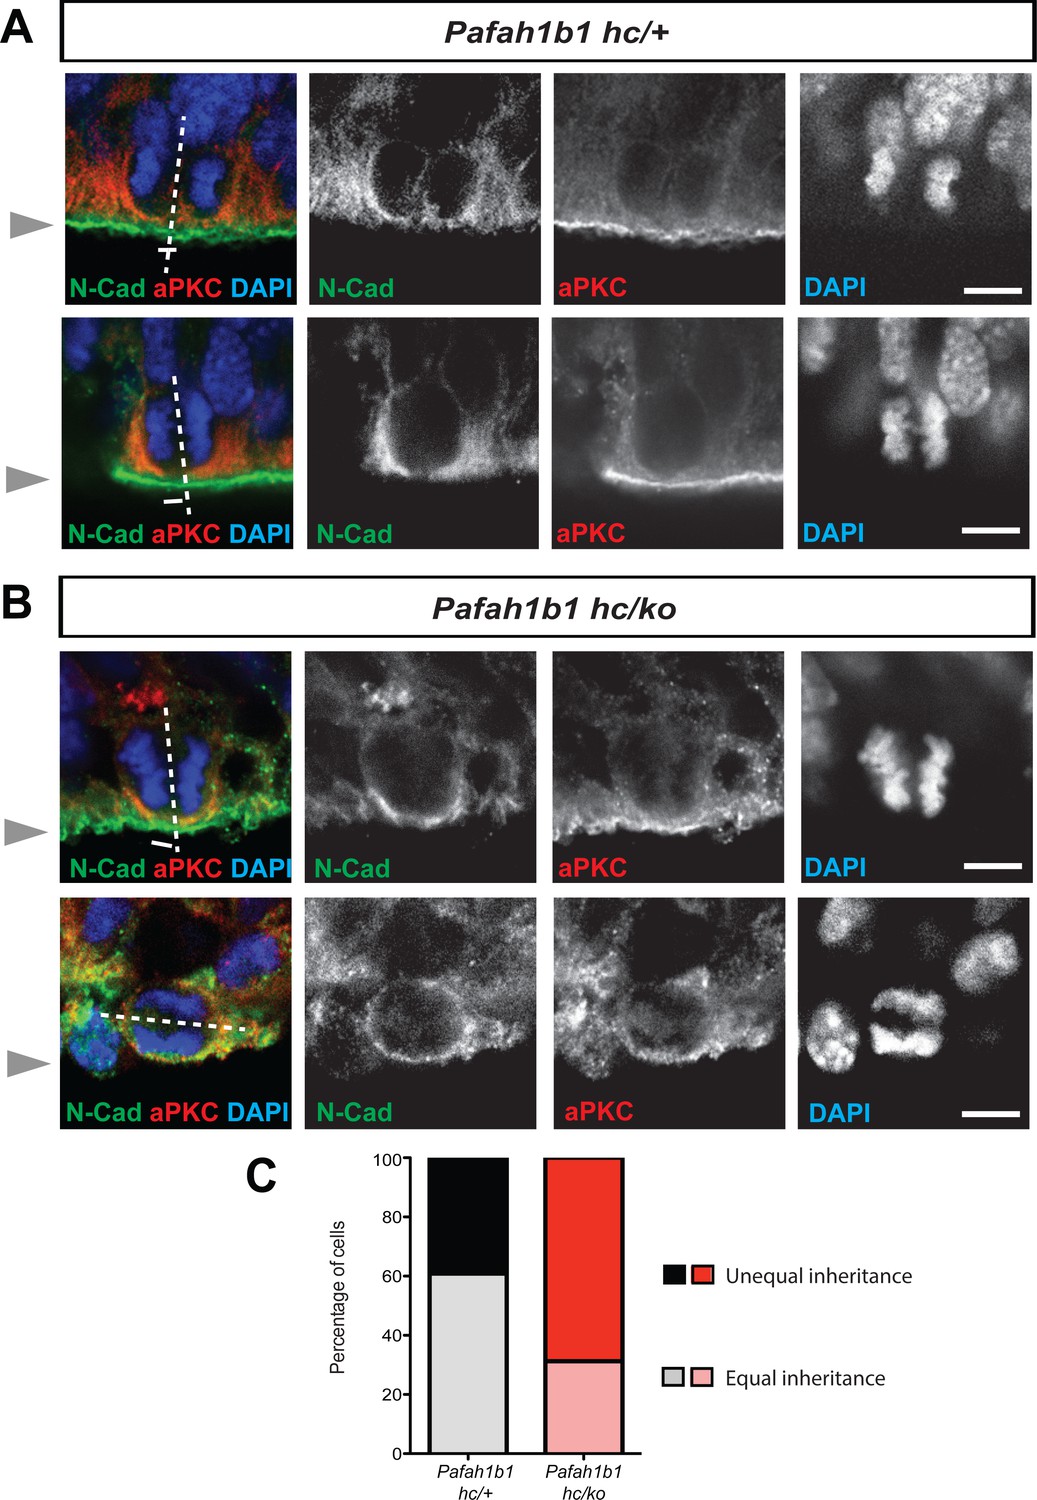
Alterations in symmetric and asymmetric divisions determined by equal vs. unequal inheritance of atypical PKC (aPKC, PKCζ) and Cadherin holes.
(A) Normal cytokinesis in neocortical NPCs from Pafah1b1 controls (Pafah1b1hc/+). Upper panel: Control NPCs displayed vertical cleavage with equal inheritance of aPKC and Cadherin hole. Lower panel: Control NPCs displayed vertical cleavage with unequal inheritance of aPKC and Cadherin hole – presumably reflecting an asymmetric neurogenic division. (B) Upper panel: Pafah1b1-deficient NPCs (Pafah1b1hc/ko) displayed vertical cleavage with unequal inheritance of aPKC and Cadherin hole. Lower panel: Pafah1b1-deficient NPCs displayed horizontal cleavage with unequal and very skewed inheritance of aPKC and Cadherin hole. This Pafah1b1-deficient NPC retained less polarized aPKC/N-Cadherin protein distribution (less apical enrichment of aPKC and N-Cadherin) along the apical-basal axis. (C) Disturbances in the frequencies of equal vs. unequal inheritance of cell fate determinants in Pafah1b1-deficient NPCs. Gray arrowheads: ventricular surface (apical). Scale bars: 5 μm. Quantitative data were included in Figure 3—source data 1.
-
Figure 3—source data 1
Quantification of aPKCζ inheritance in apical NPCs (RGs).
- https://cdn.elifesciences.org/articles/51512/elife-51512-fig3-data1-v2.docx
Figure 4
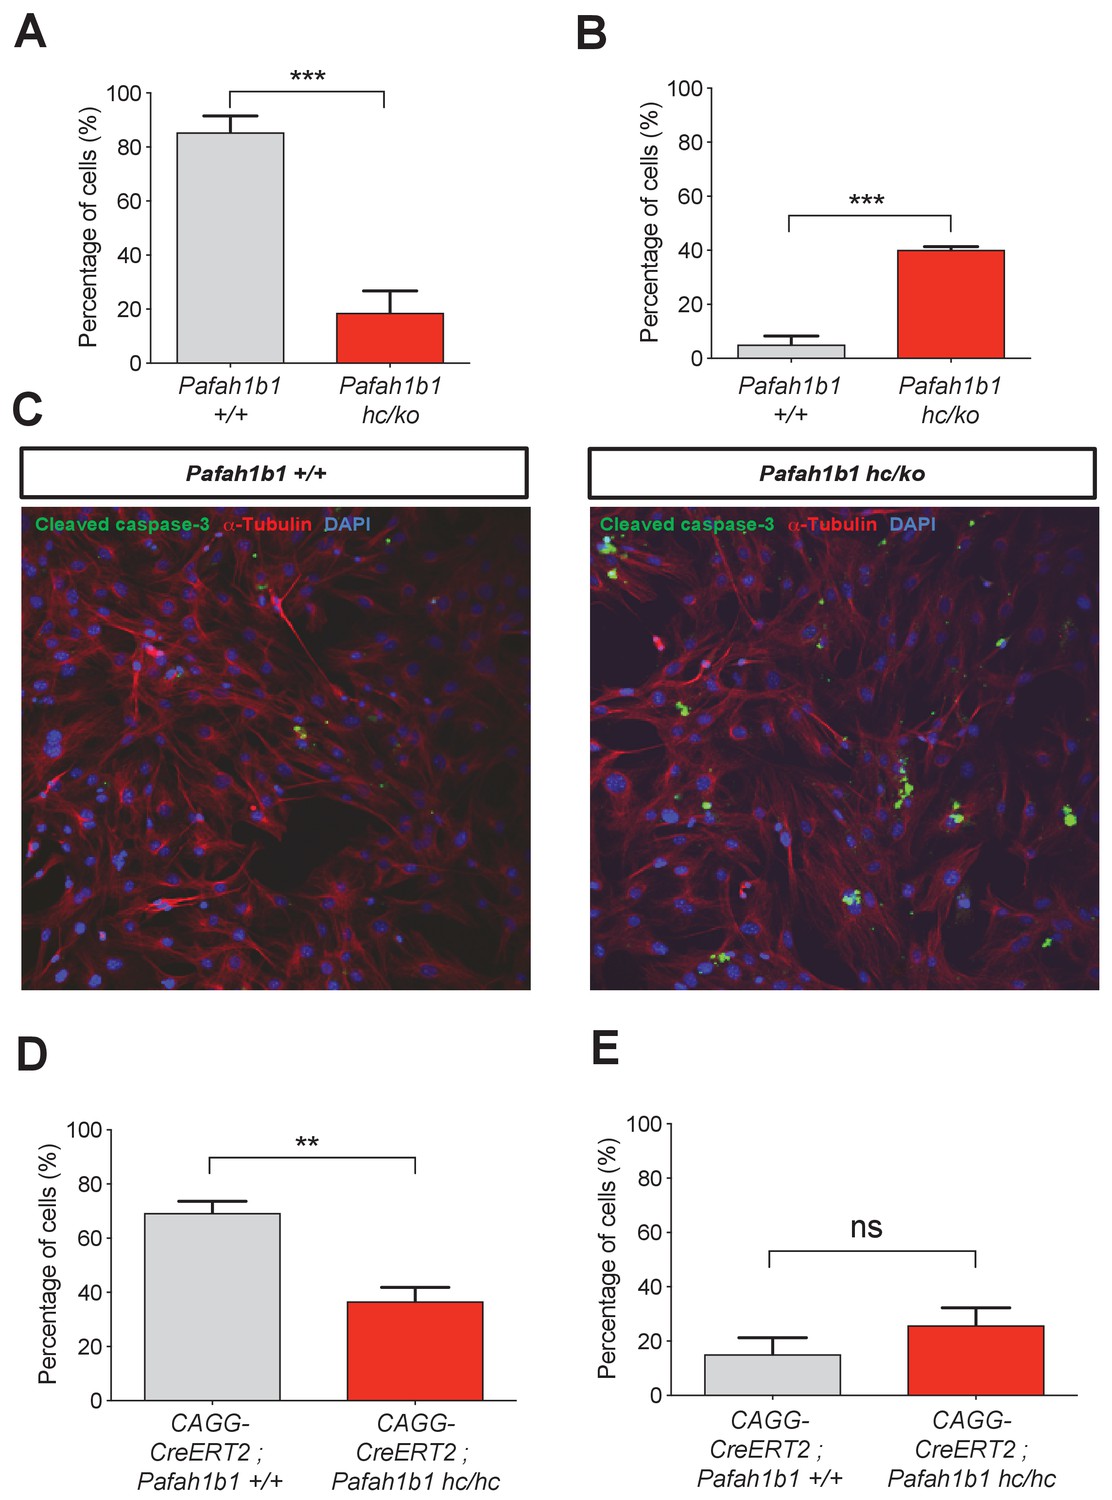
Loss of Pafah1b1 in mouse embryonic fibroblasts (MEFs) impairs normal cytokinesis and leads to binucleation of the daughter cells.
(A) Pafah1b1 mutant mouse embryonic fibroblasts (MEFs) (Pafah1b1hc/ko) displayed failure of cytokinesis, daughter cell separation, compared with WT MEFs, analyzed by time-lapse live-cell imaging. (B) Increased binucleation by fused daughter cells from MEFs with acutely deleted Pafah1b1 (CAGG-CreERT2; Pafah1b1hc/hc). (C) Increased apoptotic cell death from Pafah1b1hc/ko MEFs compared with WT MEFs (green: cleaved caspase-3, red: α-Tubulin, blue: DAPI). (D) Acutely induced Pafah1b1 conditional knock-out (CKO) mutant MEFs (CAGG-CreERT2; Pafah1b1hc/hc + TM12h) also displayed less frequency of normal daughter cell separation compared with control MEFs (CAGG-CreERT2; Pafah1b1+/+ + TM12h). (E) An increased trend in binucleation was found in Pafah1b1 CKO mutant MEFs relative to control MEFs. However, it did not reach significant. Scale bars: 50 μm. Quantitative data were included in Figure 4—source data 1.
-
Figure 4—source data 1
Quantification of MEFs.
- https://cdn.elifesciences.org/articles/51512/elife-51512-fig4-data1-v2.docx
Figure 5
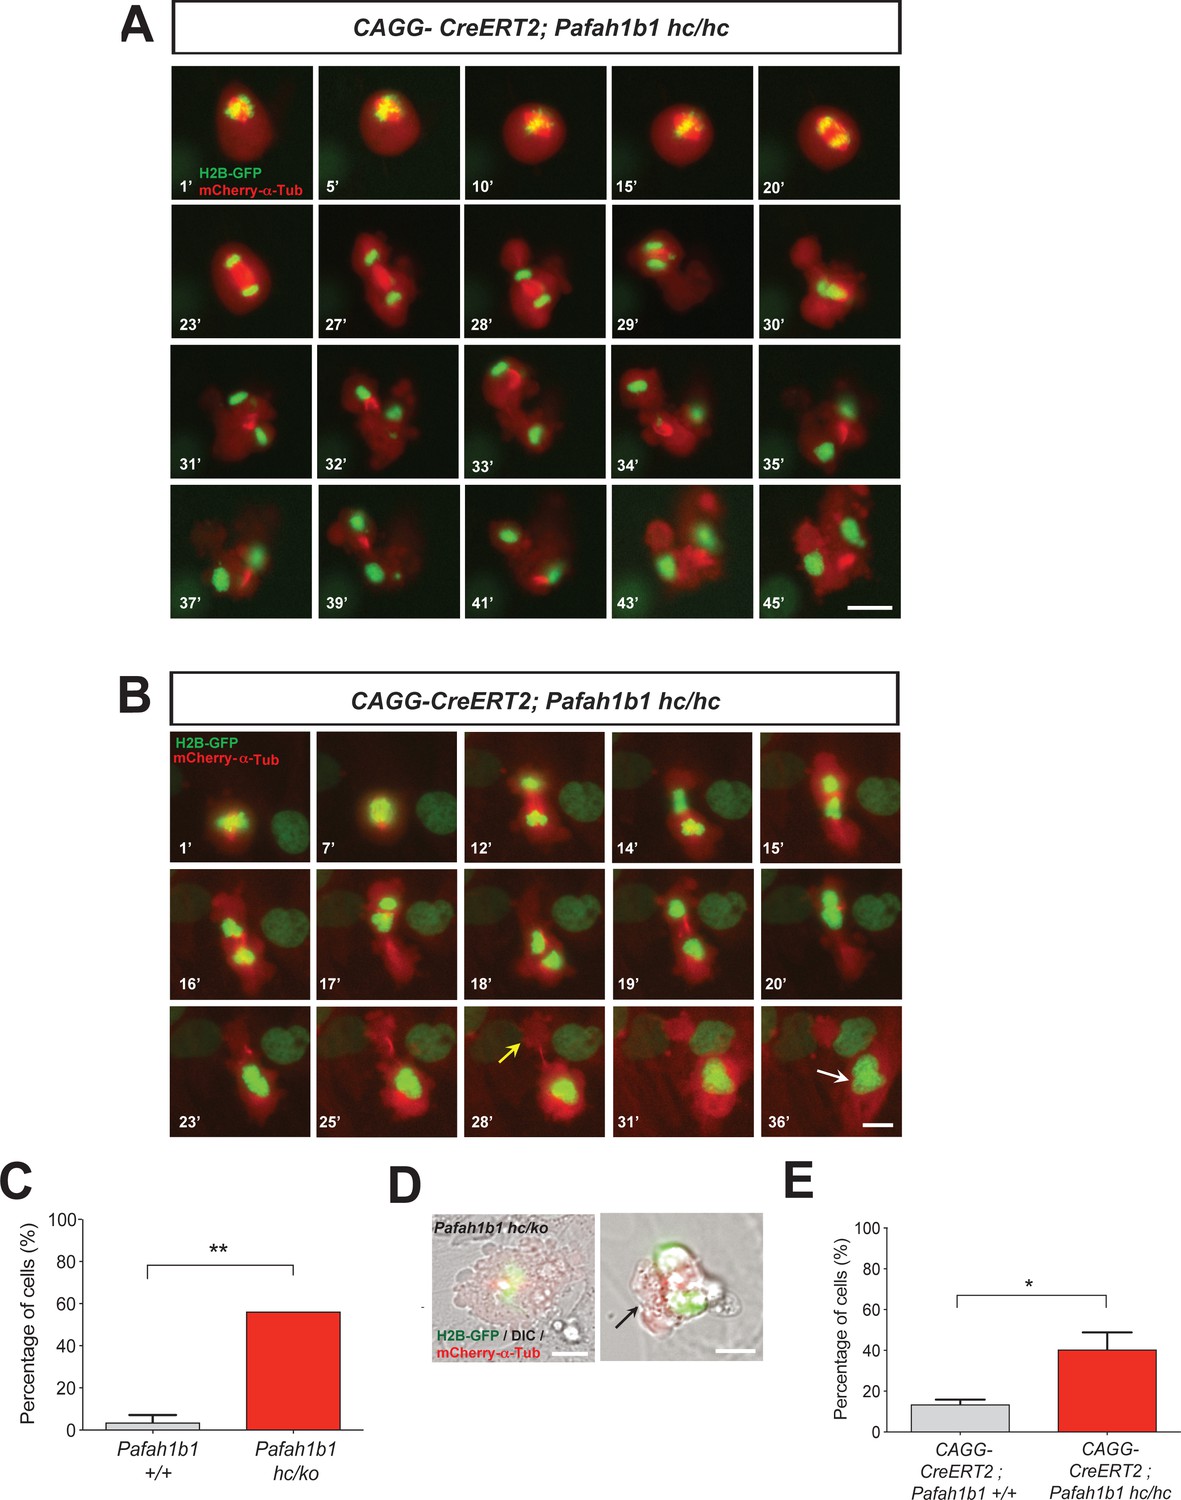
Loss of Pafah1b1 results in vigorous cell shape oscillation and mitotic spindle rocking that ultimately leads to cytokinetic failure with aberrant cleavage plane positioning.
(A) Acutely deleted Pafah1b1 mutant MEFs (CAGG-CreERT2; Pafah1b1hc/hc + TM12h) displayed severe cleavage plane defects during cytokinesis. There was instability of the midbody (highly concentrated with red fluorescence: mCherry-α-Tubulin) accompanied by cell shape oscillation and spindle rocking (green: H2B-GFP). Scale bar: 20 μm. (B) The MEFs with acutely deleted Pafah1b1 displayed abnormal cell shape and chromosome oscillation between two daughter cells. Yellow arrow (28’): anucleated one daughter cell, White arrow (36’): binucleated and bi-lobed daughter cell. Scale bar: 10 μm. (C) An increase in the frequency of hyper-contractility phenotype in Pafah1b1hc/ko MEFs. (D) Single snapshots from the merged images with DIC (differential interference contrast) and fluorescence images (green: H2B-GFP, red: mCherry-α-Tubulin, gray: DIC) from time-lapse movies (black arrows: aberrant formation of huge polar blebs). (E) Hyper-contractility quantification indicates that Pafah1b1 CKO mutant MEFs have increases in cell membrane blebbing phenotypes than control MEFs. Scale bars: 10 μm. Quantitative data were included in Figure 5—source data 1.
-
Figure 5—source data 1
Quantification of MEFs.
- https://cdn.elifesciences.org/articles/51512/elife-51512-fig5-data1-v2.docx
Figure 6

Pafah1b1 mutant MEFs display mislocalization of RhoA and Anillin, an important contractile ring component.
(A) WT MEFs displayed normal cleavage furrow positioning labeled with TCA-fixed RhoA and Anillin co-staining at the equatorial cortex from early anaphase to telophase. (B) Pafah1b1hc/ko MEFs displayed mislocalization of RhoA and Anillin. Upper panel: asymmetric cleavage furrow formation. Lower panel: binucleated cells with RhoA-positive aberrant membrane blebs (A,B) (green: RhoA, red: Anillin, blue: DAPI). (C) WT MEFs displayed an Anillin-positive zone in the cell equator. The polar-cortex-associated cortical P150glued dynactin staining pattern was excluded from and did not overlap with the Anillin-ring. (D) Pafah1b1hc/ko MEFs exhibited reduced cortical P150glued dynactin at the polar cortex and also have decreased and dispersed Anillin distribution to the equatorial cortex. (C,D) (green: P150glued dynactin, red: Anillin, blue: DAPI). (E) Quantification of normal, asymmetric, dispersed, and central MR-associated Anillin distribution in MEFs. Scale bars: 10 μm. Quantitative data were included in Figure 6—source data 1.
-
Figure 6—source data 1
Quantification of MEFs.
- https://cdn.elifesciences.org/articles/51512/elife-51512-fig6-data1-v2.docx
Figure 7

Cellular localization of LIS1 and Anillin in MEFs during cytokinesis.
(A) Wild-type (WT) MEFs were analyzed for immunocytochemistry with Rabbit anti-LIS1 and Rat anti-α-Tubulin. (B) With Rabbit anti-Anillin and Rat anti-α-Tubulin. Scale bars = 10 μm.
Figure 8

Pafah1b1 mutant MEFs show alterations in F-actin focus zone and Myosin II motor localization during the late stages of mitosis.
(A) WT MEFs with accumulation of non-muscle myosin heavy chain II-A (NMHCIIA) at the cell equator. Colocalization of staining of NMHCIIA and F-actin (phalloidin)-focusing zone (green: NMHCIIA, red: F-actin, blue: DAPI). (B) Pafah1b1hc/ko MEFs displayed dispersed and less-focused actomyosin at the cell equator. (green: NMHCIIA, red: F-actin, blue: DAPI). (C) Quantification of normal and dispersed NMHCIIA and F-actin distribution in MEFs. Scale bars: 10 μm. Quantitative data were included in Figure 8—source data 1.
-
Figure 8—source data 1
Quantification of MEFs.
- https://cdn.elifesciences.org/articles/51512/elife-51512-fig8-data1-v2.docx
Figure 9
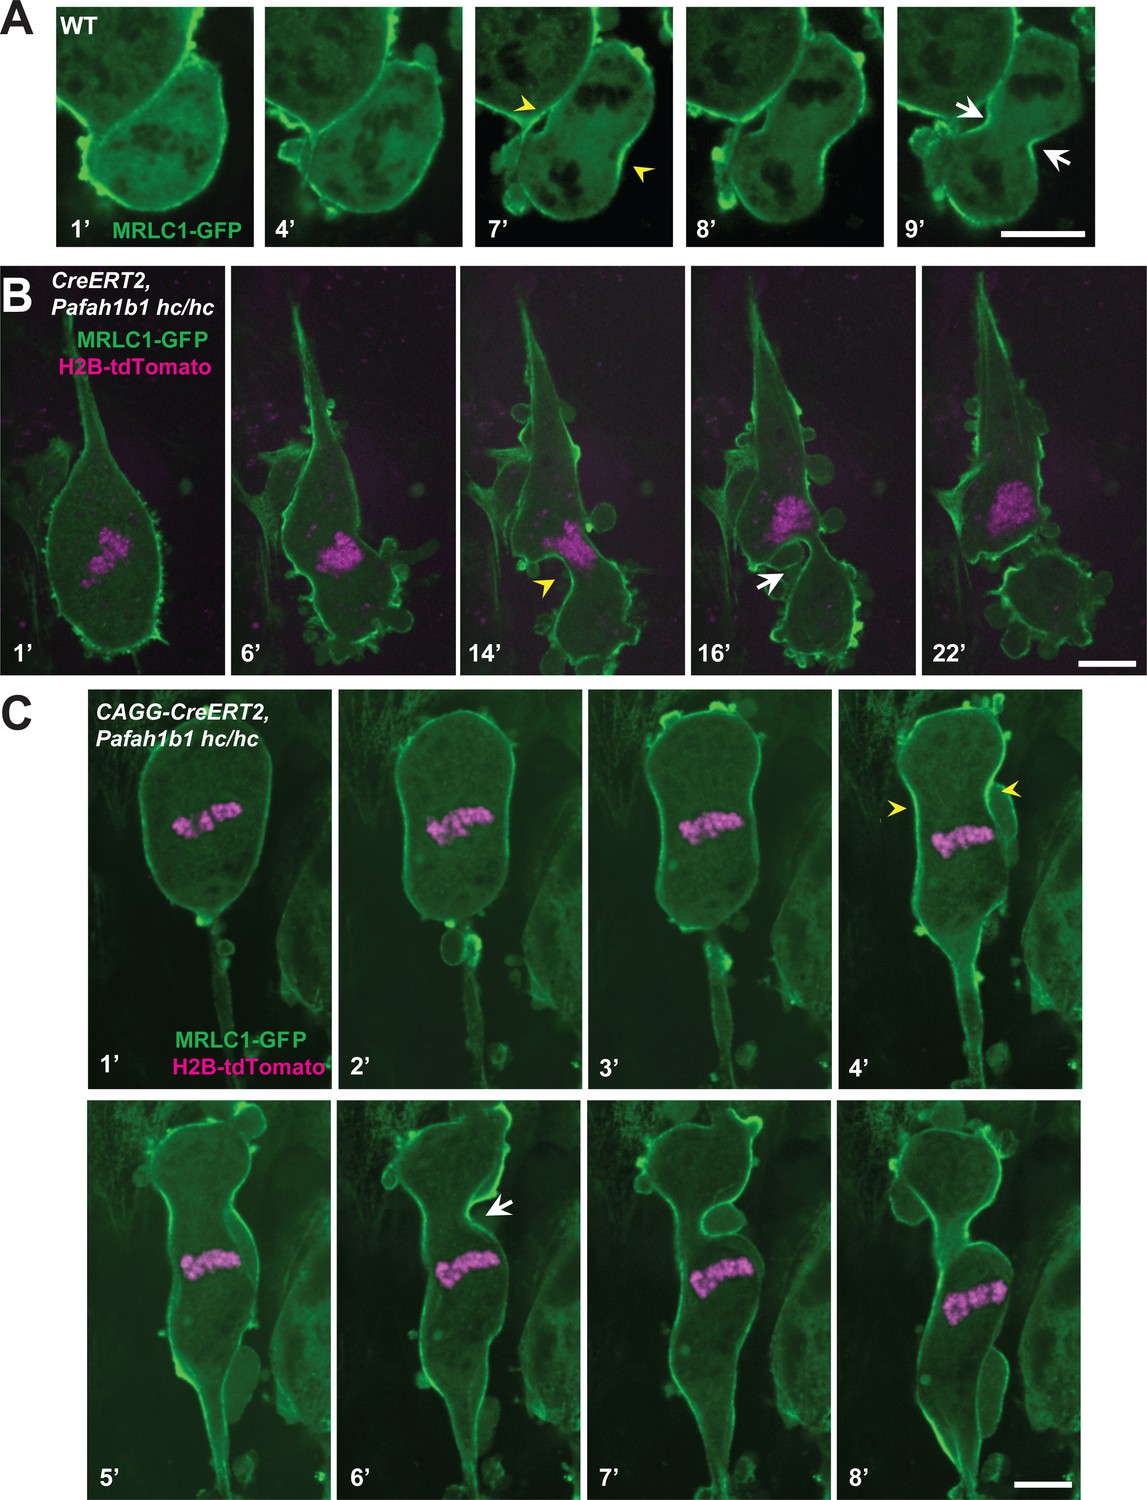
Myosin-II is abnormally distributed in Pafah1b1 mutant MEFs during late stages of mitosis.
(A) WT MEFs displayed normal recruitment of the myosin regulatory light chain 1 (MRLC, green) of Myosin-II subunit at the equatorial cortex during cytokinesis. Dark black spots inside of the cells indicate chromosome sets. (B) Pafah1b1 mutant MEFs (CAGG-CreERT2; Pafah1b1hc/hc + TM24h) infected with MRLC1-GFP (green) and H2B-tdTomato (magenta), displayed cytokinesis failure with an asymmetrically mispositioned cleavage furrow. (C) Pafah1b1 mutant MEFs clearly displayed uncoupling between chromosome separation (usually before cytokinesis onset) and cleavage furrow ingression. Pafah1b1 mutant MEFs (4’) still maintained unsegregated tetraploid chromosomes to initiate furrow contraction from the actomyosin ring. (Yellow arrowheads: initial accumulation of MRLC1, White arrows: final cleavage furrow positioning). Scale bars: 5 μm.
Figure 10
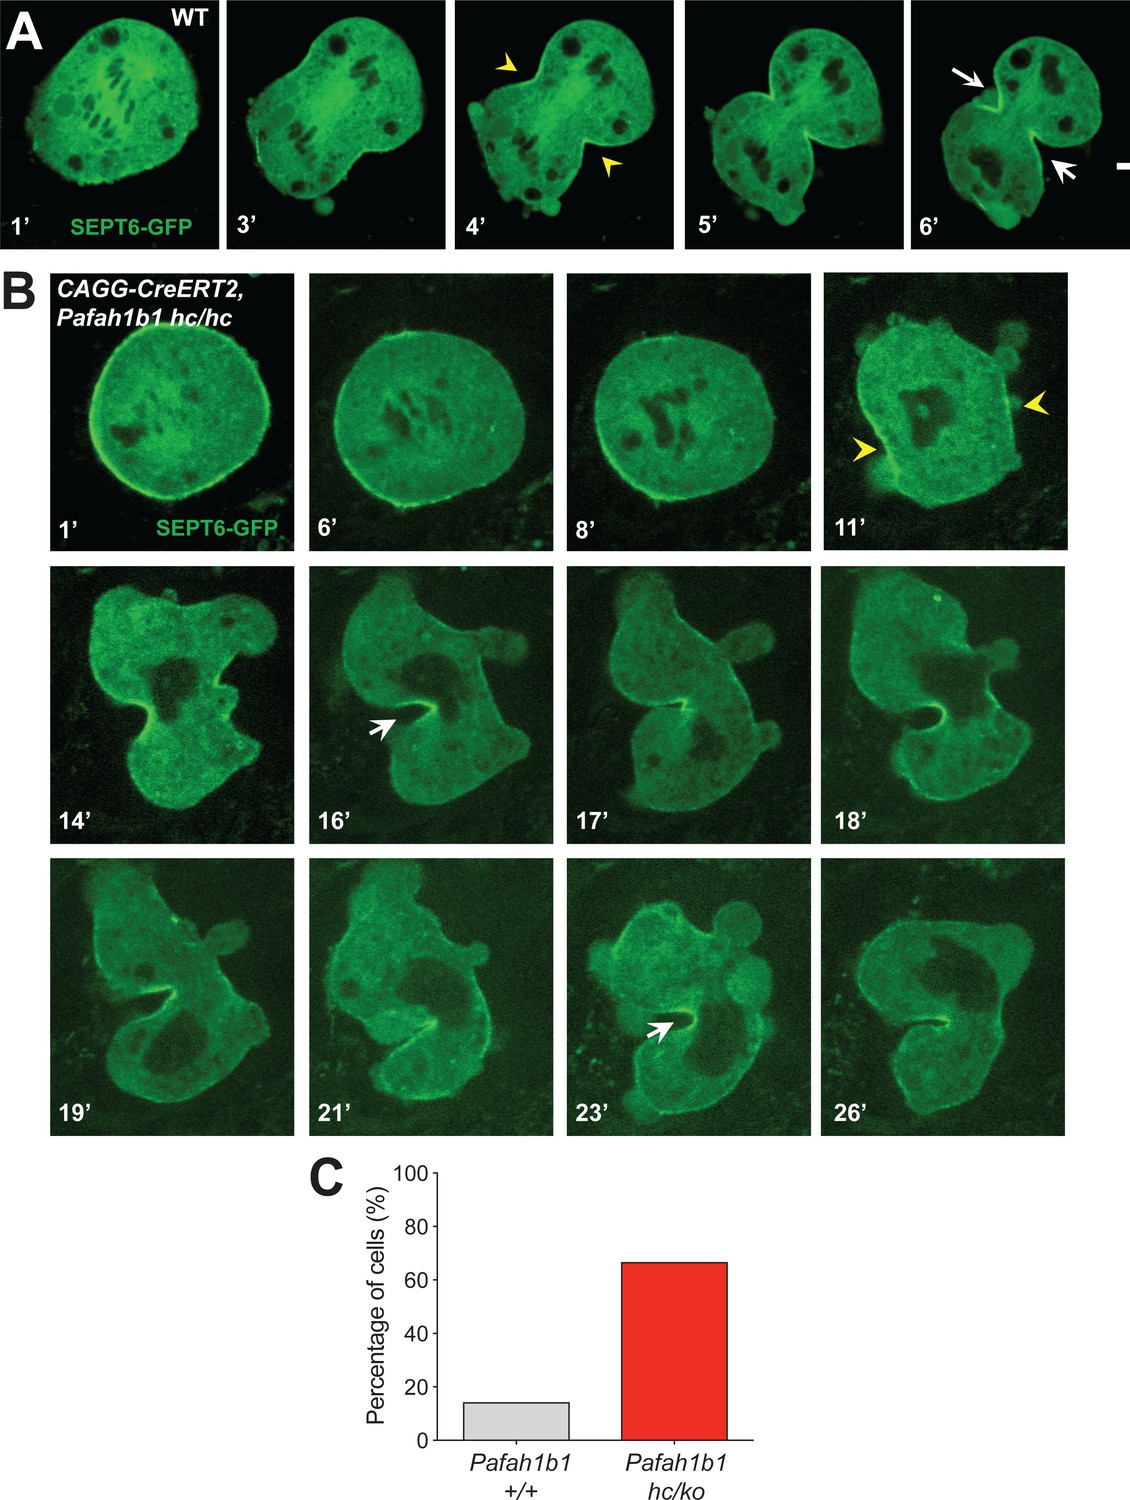
The contractile ring component SEPT6 is not properly maintained at the equatorial cortex in Pafah1b1 mutant MEFs.
(A) WT MEFs displayed normal recruitment of Septin 6 (SEPT6-GFP, in green), an actomyosin-fiber crosslinking protein composed of contractile ring, to the equatorial cortex. (B) Pafah1b1 mutant MEFs (CAGG-CreERT2; Pafah1b1hc/hc + TM24h) displayed cell shape oscillation with spindle/chromosome rocking. Pafah1b1 mutant MEFs displayed chromosome missegregation and failure to maintain proper contractile ring contraction sites. Dark black spots inside of the cells indicate the chromosome sets. (Yellow arrowheads: initial accumulation of SEPT6, White arrows: final cleavage furrow positioning). (C) Quantification of cytokinetic failure with abnormal SEPT6-GFP distribution indicates that binucleation events and incomplete cytokinesis occur more frequently in Pafah1b1-deficient mutant MEFs than WT control MEFs. Scale bars: 10 μm. Quantitative data was included in Figure 10—source data 1.
-
Figure 10—source data 1
Quantification of MEFs.
- https://cdn.elifesciences.org/articles/51512/elife-51512-fig10-data1-v2.docx
Figure 11
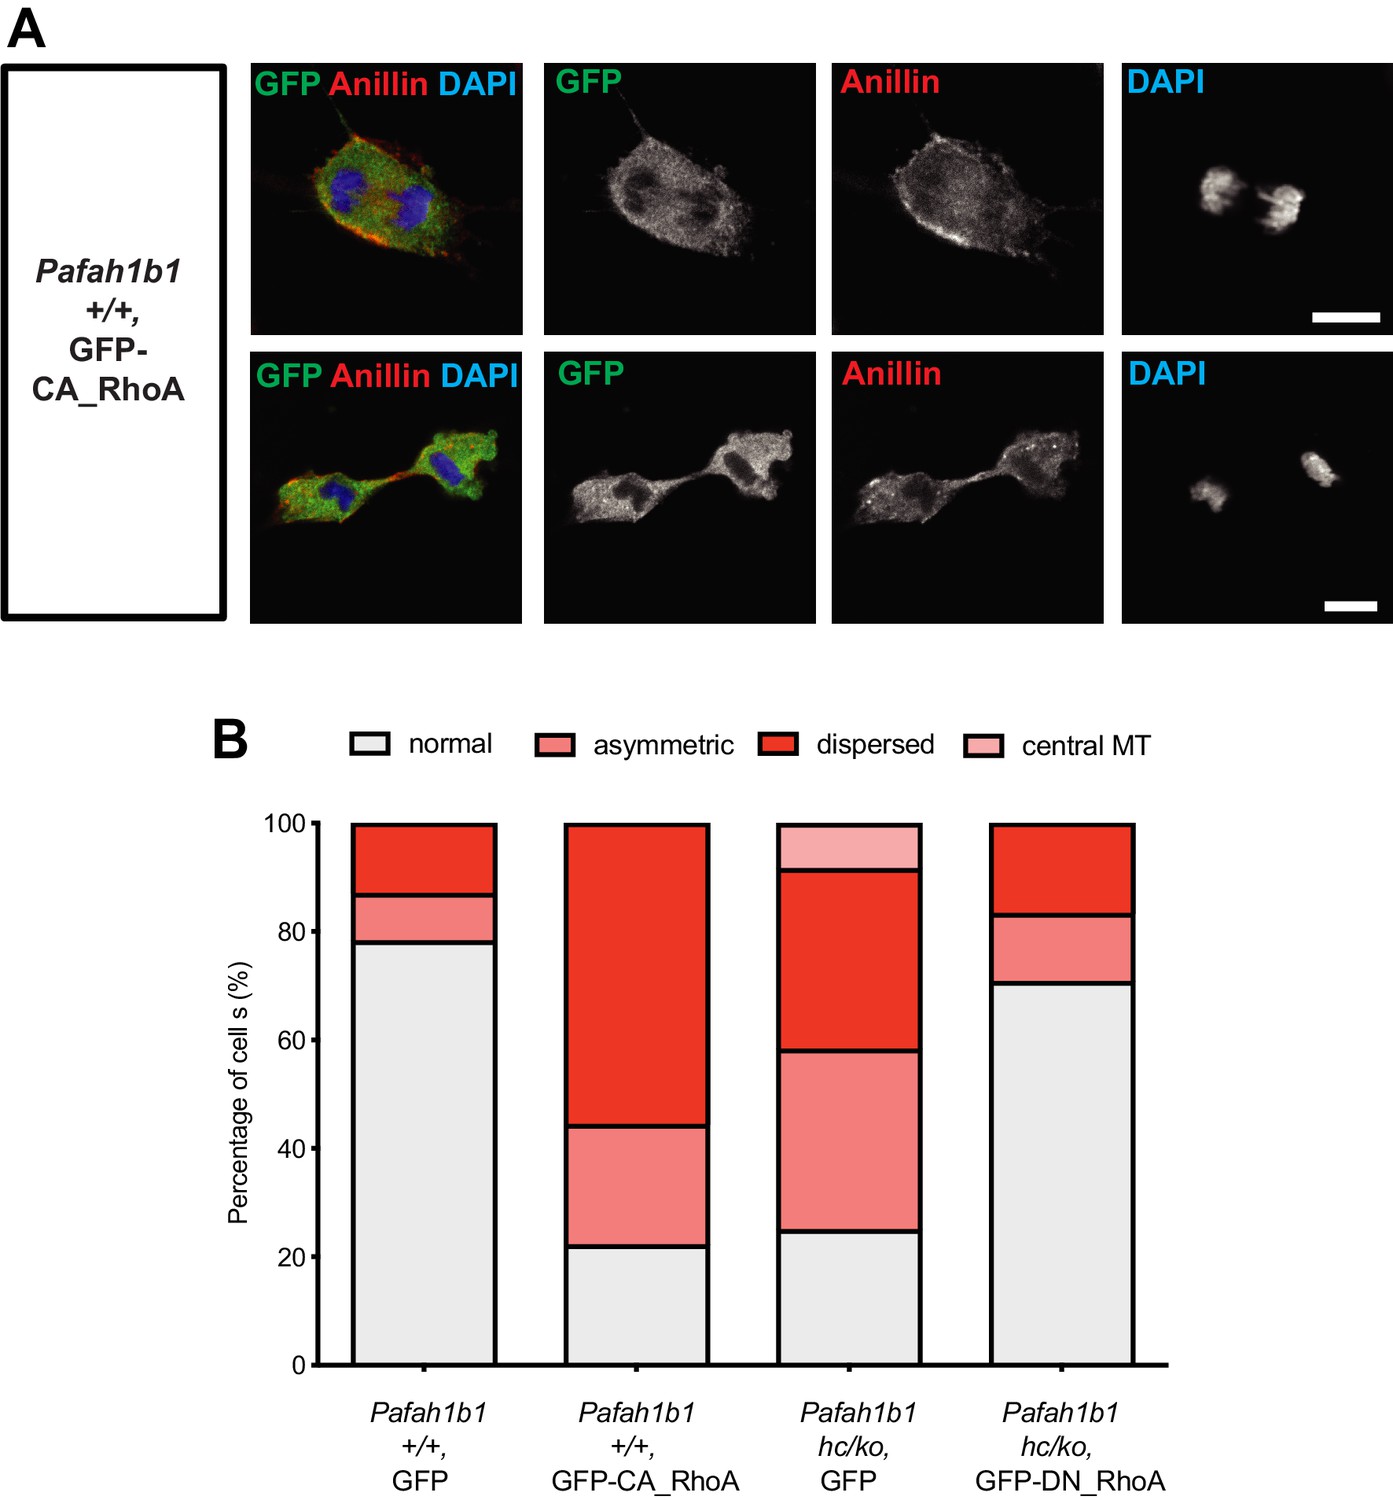
Overexpression of a constitutively active form of RhoA recapitulates cytokinetic failure similar to those are seen Pafah1b1 mutant MEF and a dominant negative form or RhoA rescues hyper-activity of RhoA observed in Pafah1b1 mutant MEFs.
(A) WT MEFs expressing a constitutively active form of RhoA (CA-RhoA) displayed abnormal Anillin distribution during cytokinesis consistent with cytokinesis defects seen in Pafah1b1hc/ko MEFs. (B) The Pafah1b1hc/ko MEFs expressing a dominant negative form of RhoA (DN-RhoA) displayed partially rescued cytokinesis phenotypes similar to WT control MEFs. Scale bars: 10 μm. Quantitative data were included in Figure 11—source data 1.
-
Figure 11—source data 1
Quantification of MEFs.
- https://cdn.elifesciences.org/articles/51512/elife-51512-fig11-data1-v2.docx
Videos
Video 1
Cytokinesis defects in Pafah1b1 mutant MEFs.
Time-lapse live cell imaging of mitotic cell division from Pafah1b1 mutant MEFs (CAGG-CreERT2; Pafah1b1hc/hc +TM12 h) treated with 4-hydroxy tamoxifen (TM). H2B-GFP and mCherry-α-Tubulin labeled fluorescence signals were acquired with a 1 min interval by Nikon Ti epifluorescence microscope. During cytokinesis of Pafah1b1-deficient MEFs, severe cytokinesis defects were observed such as vigorous cell shape oscillation and spindle rocking.
Video 2
Formation of binucleated daughter cells by cytokinesis failure in Pafah1b1 mutant MEFs.
Time-lapse live cell imaging of mitotic cell division from Lis1 mutant MEFs (CAGG-CreERT2; Pafah1b1hc/hc +TM12 h) treated with 4-hydroxy TM. H2B-GFP and mCherry-α-Tubulin labeled fluorescence signals were acquired with a 30 s interval by Nikon Ti epifluorescence microscope. The Pafah1b1-deficient MEFs underwent abnormal cytokinesis and resulted in formation of binucleated daughter cells.
Video 3
Myosin II localization during cytokinesis of wild-type (WT) MEFs.
Time-lapse live cell imaging of mitotic cell division from wild-type (WT) MEFs. Myosin regulatory light chain 1 (MRLC1)-GFP and H2B-tdTomato labeled fluorescence signals were acquired with a 30 s interval by Nikon Ti spinning disk confocal microscope. In normal cytokinesis, MRLC1 was recruited to the equatorial cortex and formed the cleavage furrow.
Video 4
Abnormal Myosin II movements during cytokinesis of Pafah1b1 mutant MEFs.
Time-lapse live cell imaging of mitotic cell division from Pafah1b1 mutant MEFs (CAGG-CreERT2;Pafah1b1hc/hc +TM24 h). Myosin regulatory light chain 1 (MRLC1)-GFP and H2B-tdTomato labeled fluorescence signals were acquired with a 30 s interval by Nikon Ti spinning disk confocal microscope. In Pafah1b1 mutant MEFs, MRLC1 was first recruited to the equatorial cortex. However, we found failure to properly restrict the cleavage furrow at the equatorial cortex.
Video 5
Uncoupling between chromosome segregation and cytokinesis in Pafah1b1 mutant MEFs.
Time-lapse live cell imaging of mitotic cell division from Pafah1b1 mutant MEFs (CAGG-CreERT2; Pafah1b1hc/hc +TM24 h). Myosin regulatory light chain 1 (MRLC1)-GFP and H2B-tdTomato labeled fluorescence signals were acquired with a 30 s interval by Nikon Ti spinning disk confocal microscope. We observed frequent uncoupling between chromosome segregation and cytokinesis in Pafah1b1 mutant MEFs.
Video 6
Septin localization during cytokinesis of wild-type (WT) MEFs.
Time-lapse live cell imaging of mitotic cell division from wild-type (WT) MEFs. Septin 6 (SEPT6)-GFP labeled fluorescence signals were acquired with a 30 s interval by Nikon Ti spinning disk confocal microscope. In normal cytokinesis, Septin-associated contractile ring complex was recruited to the equatorial cortex and formed the cleavage furrow.
Video 7
Abnormal Septin localization during cytokinesis of Pafah1b1 mutant MEFs.
Time-lapse live cell imaging of mitotic cell division from Lis1 mutant MEFs (CAGG-CreERT2; Pafah1b1hc/hc +TM24 h). Septin 6 (SEPT6)-GFP labeled fluorescence signals were acquired with a 30 s interval by Nikon Ti spinning disk confocal microscope. We observed SEPT signals at the equatorial cortex initially but then it regressed with vigorous cortical deformation and chromosome oscillation/rocking.
Tables
Key resources table
| Reagent type (species) or resource | Designation | Source or reference | Identifiers | Additional information | |
|---|---|---|---|---|---|
| Strain, strain background Mus musculus | CAGG-CreERT2 | Hayashi and McMahon, 2002 | |||
| Strain, strain background Mus musculus | Pafah1b1hc/+ Pafah1b1hc/hc Pafah1b1hc/ko | Yingling et al., 2008; Moon et al., 2014 | |||
| Strain, strain background Mus musculus | GFAP-Cre | Zhuo et al., 2001 | |||
| Strain, strain Background Mus musculus | MADM-11GT/TG; Emx1Cre+ | Hippenmeyer et al., 2010 | |||
| Cell line (Homo sapiens) | HEK293T (kidney, embryonic) | ATCC | CRL-3216 | Negative for Mycoplasma contamination | |
| Antibody | Anti-Cleaved caspase3 (Rabbit polyclonal) | Cell Signaling | Cat# 9661 (RRID:AB_2341188) | ICC (1:500) | |
| Antibody | Anti-α-Tubulin (Rat monoclonal) | AbD Serotec | Cat# MCA77G (RRID:AB_325003) | ICC (1:1,000) | |
| Antibody | Anti-RhoA (Mouse monoclonal) | Santa Cruz | Cat# sc-418 (RRID:AB_628218) | ICC, IHC (1:500) | |
| Antibody | Anti-Anillin (Rabbit polyclonal) | Santa Cruz | Cat# sc-67327 (RRID:AB_2058302) | ICC, IHC (1:250) | |
| Antibody | Anti-LIS1 (Rabbit polycloncal) | Abcam | Cat# ab2607 (RRID:AB_2299251) | ICC (1:250) | |
| Antibody | Anti-P150glued (Mouse monoclonal) | BD bioscience | Cat# 610473 (RRID:AB_397845) | ICC (1:200) | |
| Antibody | Anti-DIC 74.1 (Mouse monoclonal) | Millipore | Cat# MAB1618 (RRID:AB_2246059) | ICC (1:100) | |
| Antibody | Anti-NMHCIIA (Rabbit polyclonal) | Covance | Cat# PRB-440P (RRID:AB_291638) | ICC (1:1,000) | |
| Antibody | Anti-GFP (Mouse monoclonal) | Invitrogen | Cat# A-11120 (Clone 3E6) (RRID:AB_221568) | ICC (1:500) | |
| Antibody | Anti-MPM2 (Mouse monoclonal) | Millipore | Cat# 05–368 (RRID:AB_309698) | IHC (1:200) | |
| Antibody | Anti-N-Cadherin (Mouse monoclonal) | BD bioscience | Cat# 610920 (RRID:AB_2077527) | IHC (1:100) | |
| Antibody | Anti-aPKC (PKCζ) (Rabbit polyclonal) | Santa Cruz | Cat# sc-216 (Clone C-20) (RRID:AB_2300359) | IHC (1:100) | |
| Antibody | Anti-GFP (Chicken polyclonal) | Aves | Cat# GFP1010 (RRID:AB_2307313) | IHC (1:500) | |
| Antibody | Anti-c-Myc (Goat polyclonal) (detecting tdTomato-c-Myc) | Novus biologicals | Cat# NB-600–335 (RRID:AB_10002720) | IHC (1:150) | |
| Recombinant DNA reagent | pCX-mCherry-αTub | Previously generated. Moon et al., 2014 | |||
| Recombinant DNA reagent | pCX-MRLC1-GFP | Tom Egelhoff (Cleveland Clinic, Cleveland, OH, USA) | Addgene plasmid #35680 | ||
| Recombinant DNA reagent | pCX-SEPT6-GFP | Matthew Krummel (UCSF, San Francisco, CA, USA) | Described in Gilden et al. (2012) | ||
| Recombinant DNA reagent | pCX-H2B-tdTomato | Geoffrey Wahl (Salk Institute, San Diego, CA, USA) Roger Tsien (UCSD, San Diego, CA, USA) | Addgene plasmid #17735 | ||
| Recombinant DNA reagent | pCX-DN-RhoA, pCX-CA-RhoA | Kozo Kaibuchi (Nagoya University, Nagoya, Japan) |
Additional files
Download links
A two-part list of links to download the article, or parts of the article, in various formats.
Downloads (link to download the article as PDF)
Open citations (links to open the citations from this article in various online reference manager services)
Cite this article (links to download the citations from this article in formats compatible with various reference manager tools)
LIS1 determines cleavage plane positioning by regulating actomyosin-mediated cell membrane contractility
eLife 9:e51512.
https://doi.org/10.7554/eLife.51512


