Diminished responses to bodily threat and blunted interoception in suicide attempters
- Laureate Institute for Brain Research, United States
- Department of Psychology, The University of Tulsa, United States
- Oxley College of Health Sciences, The University of Tulsa, United States
Figures
Figure 1 with 1 supplement

Suicide attempters held their breath significantly longer than non-attempters during the inspiratory breath-hold challenge (approximately 10 s on average).
They also exhibited greater increases in carbon dioxide (CO2) and decreases in oxygen (O2). The mean breath-hold duration across the two trials is displayed below. Error bars indicate + / - 1 standard error, *p < 0.05.
-
Figure 1—source data 1
Processed breath-hold task data.
- https://cdn.elifesciences.org/articles/51593/elife-51593-fig1-data1-v2.csv
Figure 1—figure supplement 1
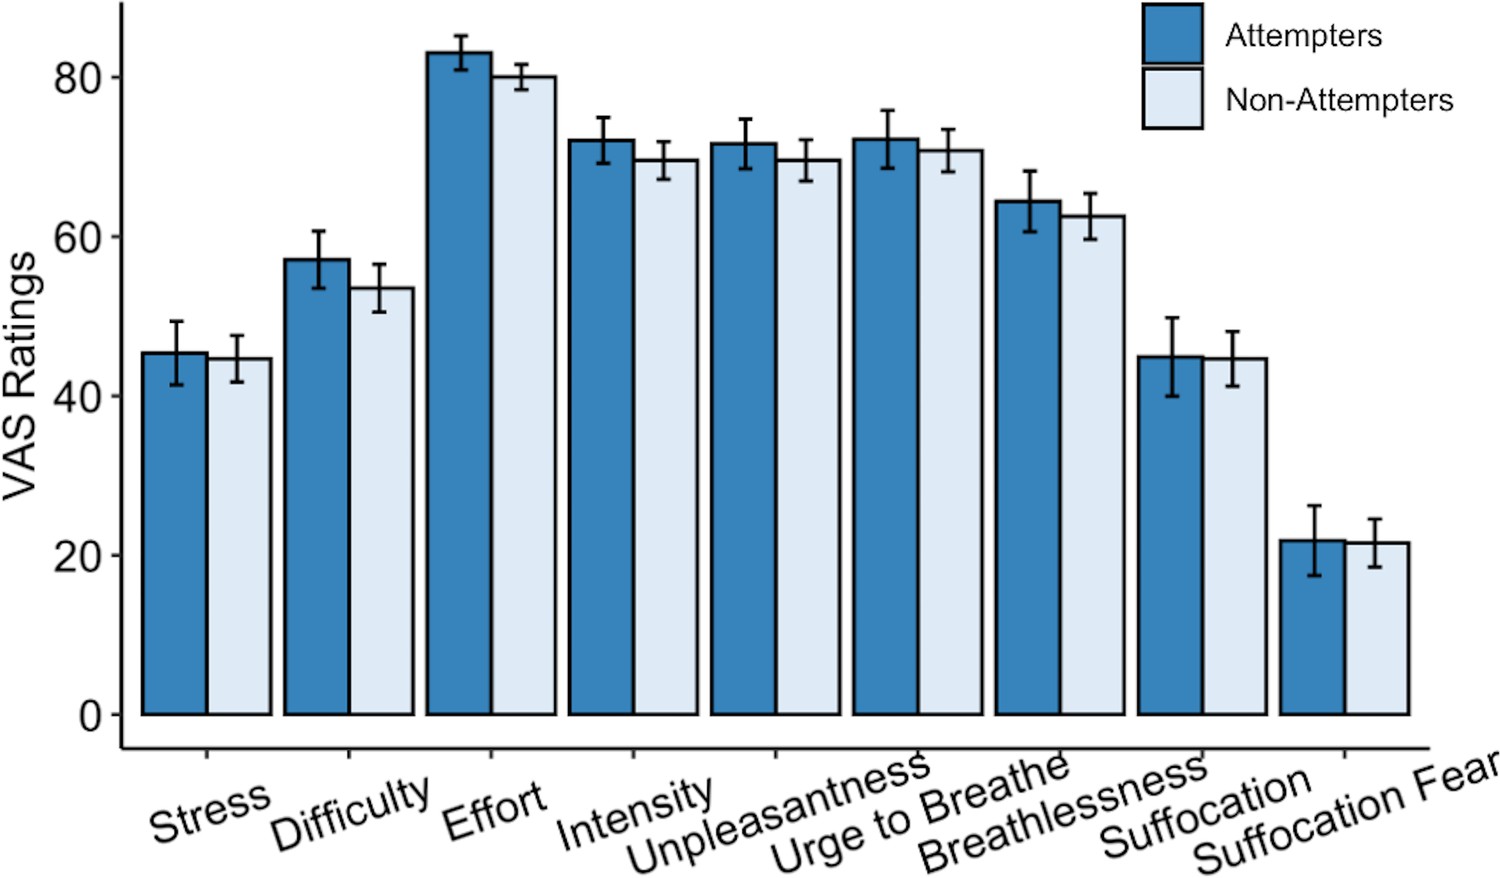
Suicide attempters and non-attempters exhibited no differences in symptom ratings following the breath hold task.
Figure 2
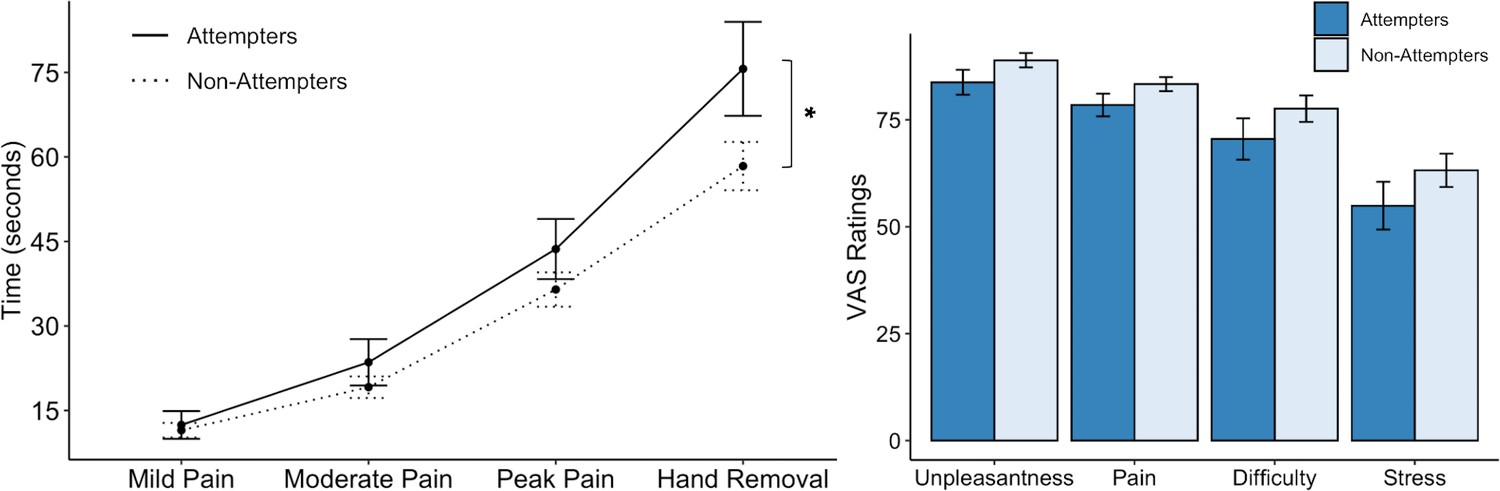
Suicide attempters exhibited significantly greater pain tolerance than non-attempters during the cold-pressor challenge.
However, they did not significantly differ in their retrospective ratings of overall pain, unpleasantness, difficulty, or stress experienced during the task. Error bars indicate + / - 1 standard error; *p < 0.05.
-
Figure 2—source data 1
Processed cold-pressor challenge data.
- https://cdn.elifesciences.org/articles/51593/elife-51593-fig2-data1-v2.csv
Figure 3
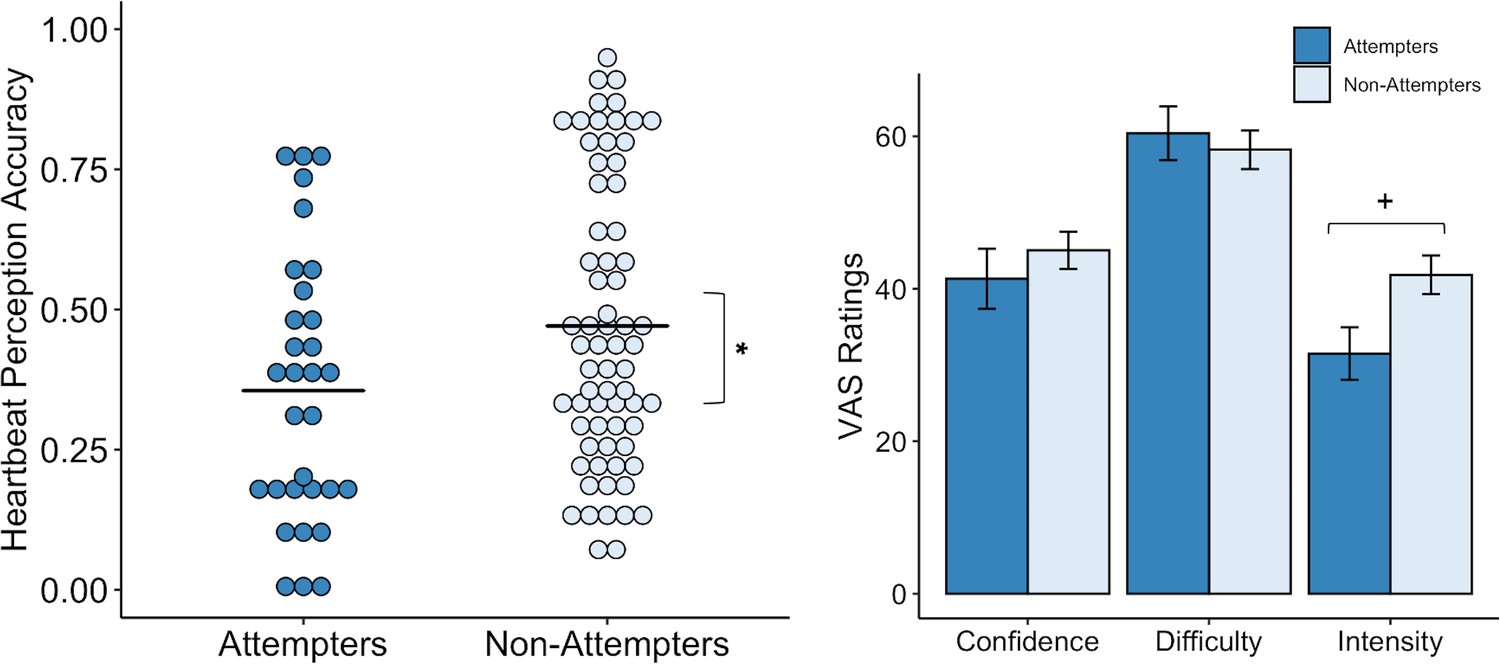
Suicide attempters exhibited significantly lower heartbeat perception accuracy than non-attempters during the no-guess and breath-hold perturbation conditions.
There were no perceived differences in reported in task difficulty or confidence in performance across the no-guess and perturbation conditions. Suicide attempters also provided lower ratings of heartbeat intensity across these conditions, although this was no longer significant after correction for multiple comparisons. Error bars indicate + / - 1 standard error; *p < 0.05, +p < 0.10.
-
Figure 3—source data 1
Processed heartbeat perception task data.
- https://cdn.elifesciences.org/articles/51593/elife-51593-fig3-data1-v2.csv
Figure 4
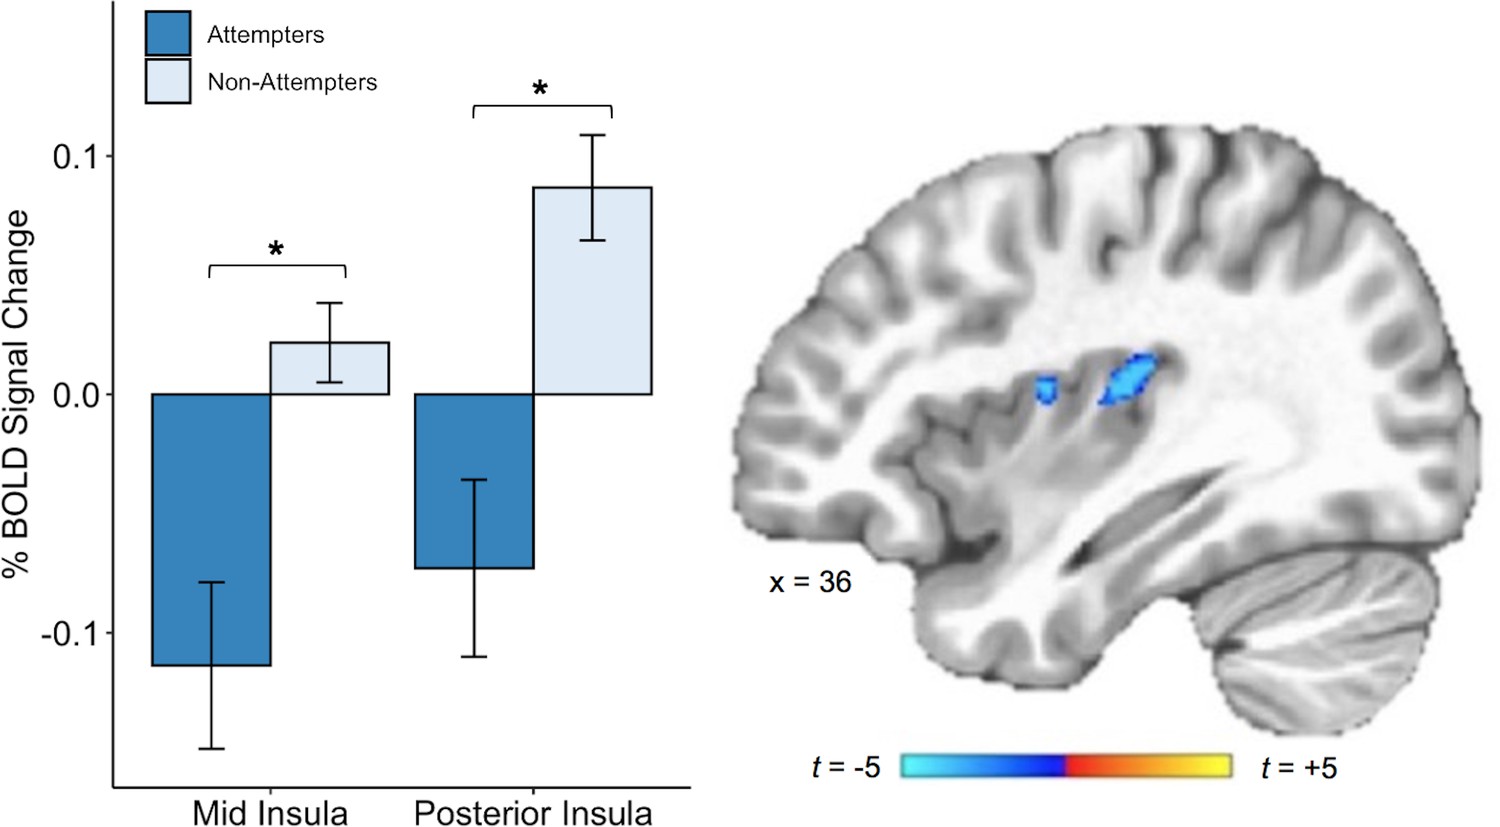
Suicide attempters exhibited lower blood oxygen level-dependent (BOLD) signal in the right posterior and mid insula than non-attempters during attention to heartbeat sensations (relative to the exteroceptive condition; p < 0.005, ACF corrected at α < 0.05).
Error bars indicate + / - 1 standard error.
-
Figure 4—source data 1
Subject-level beta values from mid and posterior insula cluster activation during interoceptive (relative to exteroceptive) conditions.
- https://cdn.elifesciences.org/articles/51593/elife-51593-fig4-data1-v2.csv
Appendix 1—figure 1
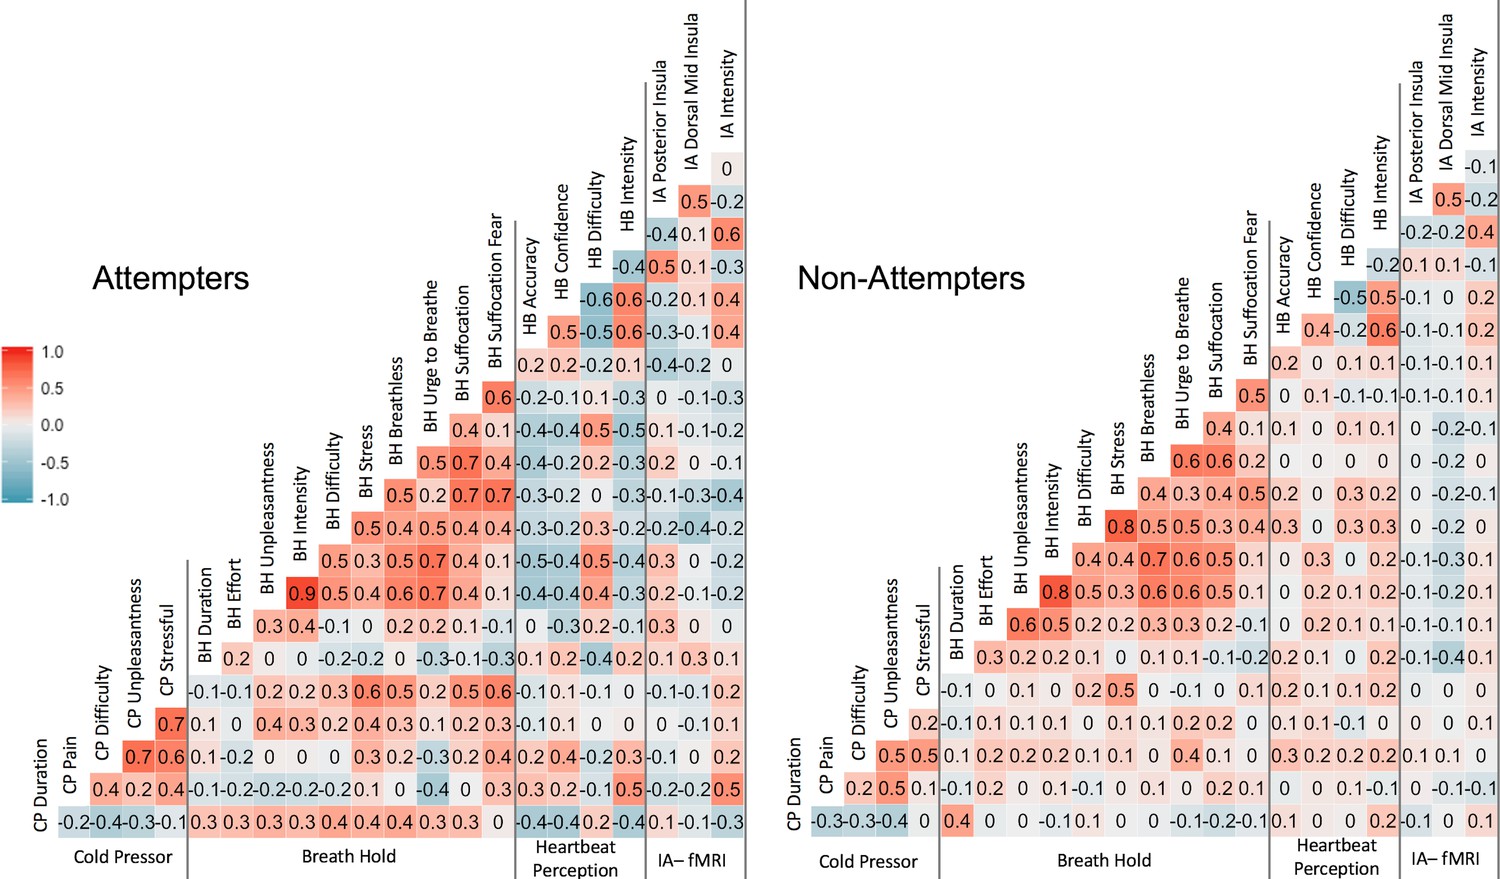
Pearson correlation coefficients across measures.
‘CP’ = cold-pressor, ‘BH’ = breath-hold (computed using participants’ mean duration and VAS ratings across trial 1 and trial 2, ‘HB’ = heartbeat perception task (computed using the mean of the no-guess and perturbation conditions). IA-fMRI = interoceptive attention to heartbeat sensations during fMRI.
Appendix 2—figure 1

Performance on interoceptive measures across three groups: suicide attempters, suicide ideators, and non-ideators.
(A) During attention to interoceptive sensations (vs. exteroceptive sensations) suicide attempters exhibited lower blood oxygen level-dependent (BOLD) signal in the right dorsal mid insula compared to ideators (p = 0.004) and non-ideators (p < 0.001). Suicide attempters also exhibited lower BOLD activation in the posterior insula relative to ideators (p = 0.001) and non-ideators (p = 0.002) during interoceptive attention. (B) Suicide attempters exhibited lower levels of heartbeat perception accuracy relative to that of ideators (p = 0.012) and non-ideators (p = 0.007) during the no-guess and perturbation trials of the heartbeat perception task. The mean of the no-guess and perturbation trials is illustrated. (C) There was no significant difference between attempters and ideators (p = 0.062), nor between attempters and non-ideators (p = 0.110) in breath hold duration across trials. (D) Relative to ideators, suicide attempters sustained the cold pressor longer after reaching peak pain (p = 0.001); no significant differences were observed between attempters and non-ideators (p = 0.074). Error bars indicate + / - 1 standard error.
Tables
Table 1
Participant demographics and clinical characteristics.
| Suicide attempters (n = 34) | Non-attempters (n = 68) | p | |
|---|---|---|---|
| Demographics | |||
| Age, years | 31 (11) | 33 (10) | 0.40 |
| BMI | 27.1 (6.3) | 28.6 (5.0) | 0.20 |
| % Female | 56 (n = 19) | 70 (n = 47) | 0.27 |
| Clinical Features | |||
| PHQ-9 | 12.1 (5.4) | 11.2 (5.7) | 0.42 |
| PHQ-9 SI question | 0.5 (0.8) | 0.3 (0.5) | 0.12 |
| OASIS | 9.2 (4.6) | 8.5 (4.2) | 0.47 |
| DAST | 3.7 (4.2) | 3.5 (4.0) | 0.89 |
| SCOFF | 1.7 (1.6) | 1.3 (1.4) | 0.16 |
| % Medicated | 85 (n = 29) | 59 (n = 40) | 0.01 |
-
Note: All values reported are in the format of Mean (SD) unless otherwise indicated.
BMI = Body Mass Index; PHQ-9 = Patient Health Questionnaire; SI = Suicidal Ideation; OASIS = Overall Anxiety Severity and Impairment Scale; DAST = Drug Abuse Screening Test; SCOFF = Eating Disorders Screening Tool. All scores on clinical measures reflect total scores unless otherwise specified. For all clinical measures, higher numbers indicate greater endorsement of the construct assessed.
Table 2
Brain regions exhibiting significantly decreased blood oxygen level-dependent (BOLD) signal during attention to heartbeat sensations relative to exteroceptive sensations in suicide attempters relative to non-attempters
| Location | MNI Coordinates | Peak t | Volume (mm3) | ||
|---|---|---|---|---|---|
| x | y | z | |||
| Right Dorsal Posterior Insula | 31 | −19 | 15 | −3.7 | 469 |
| Right Dorsal Mid-Insula | 39 | -1 | 13 | −3.4 | 352 |
| Right Precuneus and Posterior Cingulate | 5 | −61 | 27 | −4.8 | 1568 |
| Right Superior Temporal Gyrus | 65 | −29 | 5 | −5.2 | 784 |
| Right Middle Cingulate Cortex | 11 | -7 | 45 | −5.0 | 712 |
| Right Superior Medial Gyrus | 1 | 57 | 17 | −5.2 | 544 |
-
Note: A voxel-wise threshold of p < 0.005 was set for the insula, and a voxel-wise threshold of p < 0.0005 for the rest of the brain; all significant activations passed a cluster-size correction for multiple comparisons of α < . 05.
Appendix 1—table 1
Percent of individuals meeting diagnostic criteria for psychiatric disorders per the Mini International Neuropsychiatric Interview (MINI) at the time of data collection.
| Suicide attempters (n = 34) | Non-attempters (n = 68) | |
|---|---|---|
| Major depressive disorder | 74% (n = 25) | 74% (n = 50) |
| Anxiety disorders | 62% (n = 21) | 65% (n = 44) |
| Post-traumatic stress disorder | 32% (n = 11) | 28% (n = 19) |
| Substance use disorder (excluding alcohol) | 35% (n = 11) | 41% (n = 28) |
| Alcohol use disorder | 26% (n = 9) | 24% (n = 16) |
| Eating disorders | 9% (n = 3) | 3% (n = 2) |
| Mean (SD) number of diagnoses per individual | 3.2 (1.9) | 3.1 (1.9) |
-
Note: There were no significant differences in the proportion of diagnoses between suicide attempter and non-attempter groups. ‘Anxiety disorder’ includes any of the following: social anxiety disorder, general anxiety disorder, and/or panic disorder with or without agoraphobia. ‘Eating disorder’ includes a diagnosis of anorexia nervosa, bulimia nervosa, or binge eating disorder. Total percentages will not add up to 100% as several patients met criteria for more than one disorder.
Appendix 1—table 2
Percent of individuals taking psychotropic medications by drug class.
| Suicide attempters (n = 34) | Non-attempters (n = 68) | |
|---|---|---|
| SSRIs | 38% (n = 13) | 29% (n = 20) |
| SNRIs | 14.7% (n = 5) | 7.4% (n = 5) |
| Bupropion | 17.6% (n = 6) | 8.8% (n = 6) |
| Tricyclic Antidepressants | 8.8% (n = 3) | 0 |
| Tetracyclic Antidepressants | 14.7% (n = 5) | 1.5% (n = 1) |
| Atypical antipsychotics | 23.5% (n = 8) | 7.4% (n = 5) |
| Anticonvulsants | 26.5% (n = 9) | 10.3% (n = 7) |
| Benzodiazepines | 26.5% (n = 9) | 13.2% (n = 9) |
| Stimulants | 5.8% (n = 2) | 13% (n = 9) |
| Narcotics (e.g., Suboxone) | 11.8% (n = 4) | 11.8% (n = 8) |
| Opioid Antagonists | 5.8% (n = 2) | 1.5% (n = 1) |
| Lithium | 5.8% (n = 2) | 0 |
-
Note: ‘SSRI’=selective serotonin reuptake inhibitor; ‘SNRI’=serotonin and norepinephrine reuptake inhibitor
Appendix 1—table 3
Self-report measures by group.
| Attempter (n = 34) | Non-attempter (n = 68) | |||
|---|---|---|---|---|
| Mean (SD) | p | Adjusted p | ||
| Multidimensional Assessment of Interoceptive Awareness (MAIA) | ||||
| Attention Regulation | 2.7 (1.2) | 2.9 (1.0) | 0.23 | 0.37 |
| Body Listening | 2.0 (1.3) | 2.4 (1.1) | 0.10 | 0.37 |
| Emotional Awareness | 3.4 (1.2) | 3.7 (0.9) | 0.21 | 0.37 |
| Not Distracting | 1.8 (0.9) | 1.5 (0.9) | 0.23 | 0.37 |
| Noticing | 3.5 (0.8) | 3.6 (1.0) | 0.76 | 0.87 |
| Not Worrying | 2.7 (1.0) | 2.5 (1.1) | 0.44 | 0.59 |
| Self-Regulation | 2.4 (1.2) | 2.8 (1.1) | 0.90 | 0.90 |
| Body Trust | 2.7 (1.3) | 3.2 (1.0) | 0.02 | 0.16 |
| Anxiety Sensitivity Index (ASI) | ||||
| Cognitive Concerns | 6.9 (6.7) | 6.1 (6.7) | 0.52 | 0.88 |
| Physical Concerns | 5.8 (5.7) | 6.3 (5.7) | 0.65 | 0.88 |
| Social Concerns | 11.6 (6.8) | 11.4 (6.8) | 0.88 | 0.88 |
| Total ASI | 24.3 (17.1) | 23.8 (12.9) | 0.86 | 0.88 |
| Toronto Alexithymia Index (TAS-20) | ||||
| Difficulty Identifying Feelings | 18.8 (6.5) | 18.1 (5.0) | 0.54 | 0.72 |
| Difficulty Describing Feelings | 14.7 (3.2) | 14.7 (3.2) | 0.65 | 0.72 |
| Externally Oriented Thinking | 25.3 (3.2) | 26.4 (3.0) | 0.09 | 0.36 |
| Total TAS | 58.8 (10.2) | 59.5 (8.2) | 0.72 | 0.72 |
-
Note: The adjusted p-values are corrected using the Benjamini-Hochberg adjustment.
Additional files
-
Source code 1
- https://cdn.elifesciences.org/articles/51593/elife-51593-code1-v2.zip
-
Supplementary file 1
Output of linear mixed effects models for breath hold duration, CO2, and O2.
- https://cdn.elifesciences.org/articles/51593/elife-51593-supp1-v2.docx
-
Supplementary file 2
Output of linear mixed effects model for cold pressor challenge.
- https://cdn.elifesciences.org/articles/51593/elife-51593-supp2-v2.docx
-
Supplementary file 3
Output of linear mixed effects model for heartbeat perception models.
- https://cdn.elifesciences.org/articles/51593/elife-51593-supp3-v2.docx
-
Transparent reporting form
- https://cdn.elifesciences.org/articles/51593/elife-51593-transrepform-v2.pdf
Download links
A two-part list of links to download the article, or parts of the article, in various formats.
Downloads (link to download the article as PDF)
Open citations (links to open the citations from this article in various online reference manager services)
Cite this article (links to download the citations from this article in formats compatible with various reference manager tools)
Diminished responses to bodily threat and blunted interoception in suicide attempters
eLife 9:e51593.
https://doi.org/10.7554/eLife.51593


