Cardiac ryanodine receptor distribution is dynamic and changed by auxiliary proteins and post-translational modification
- University of British Columbia, Canada
Figures
Figure 1
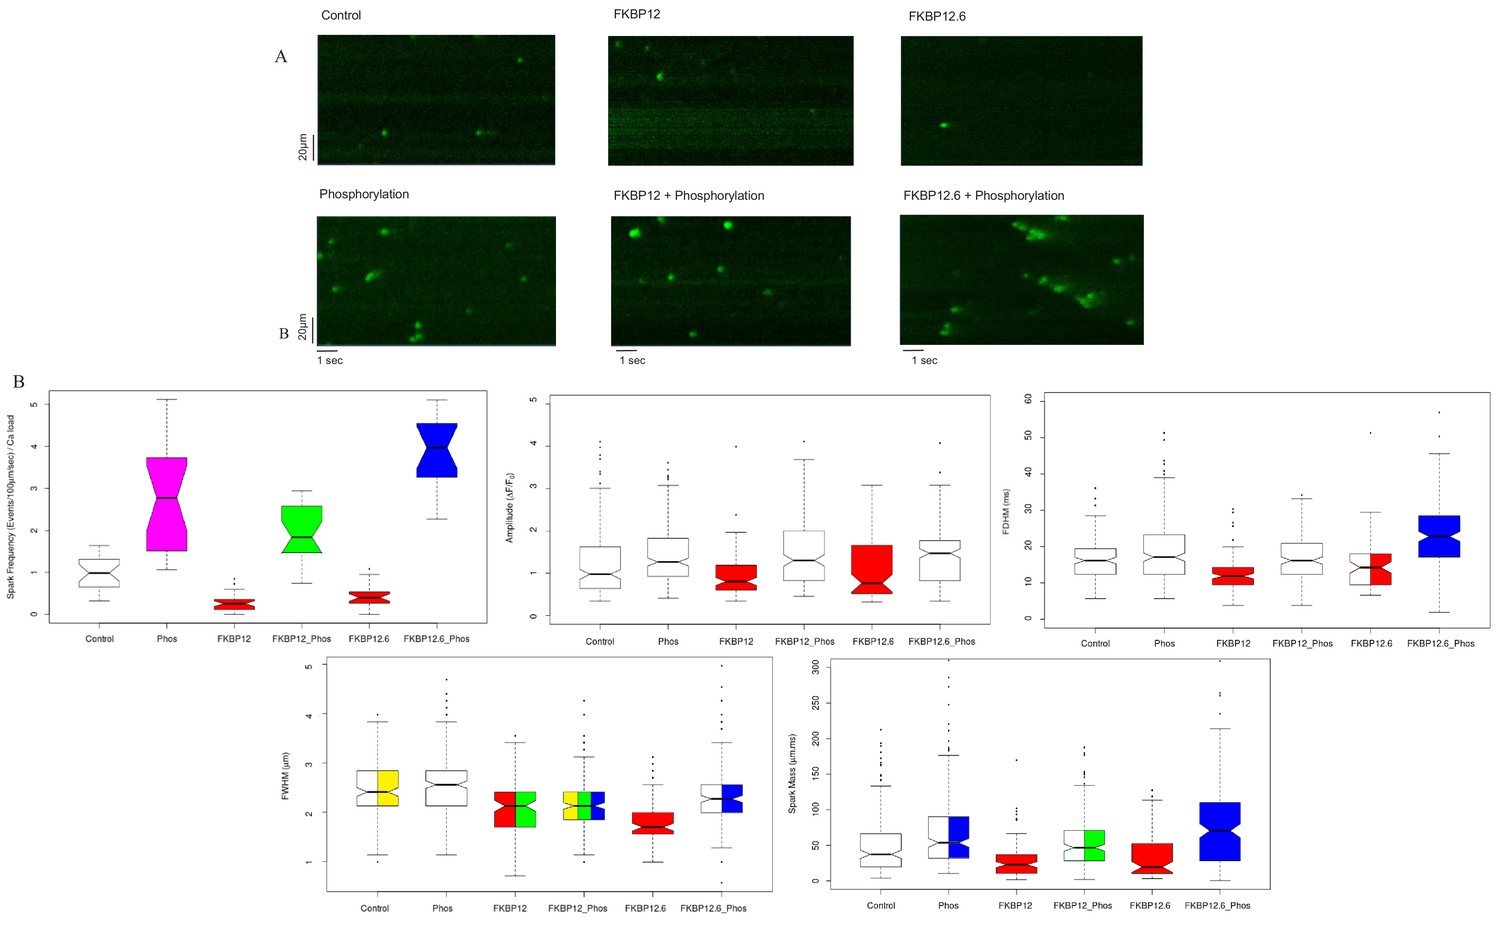
Calcium Sparks.
(A) Representative line-scan images of Ca2+ sparks recorded from permeabilized rat ventricular cardiomyocytes under the indicated conditions. (B) Box and whisker plots of the aggregated Ca2+ spark data under the indicated experimental condition (i) Frequency, normalized to SR content. (ii) Amplitude, (iii) FDHM (ms) (iv) FWHM (μm) (v) Spark mass (amplitude x FDHM x FWHM). The bottom and top of the boxes are the first and third quartiles of the data, and the central line is the median. The data are presented with a color code: those treatments that were significantly different from each other (p<0.05) have different colors, while those that were not have the same color. Quartiles of the box and whisker plots as well as a full statistical analysis is available in Figure 1—source data 1. The number of rats and cells used, and the number of sparks analysed, for each of the experimental groups is in Figure 1—source data 2.
-
Figure 1—source data 1
Statistical analysis of calcium spark data.
- https://cdn.elifesciences.org/articles/51602/elife-51602-fig1-data1-v2.pdf
-
Figure 1—source data 2
Number of sparks, cells and rats examined.
- https://cdn.elifesciences.org/articles/51602/elife-51602-fig1-data2-v2.docx
Figure 2 with 1 supplement
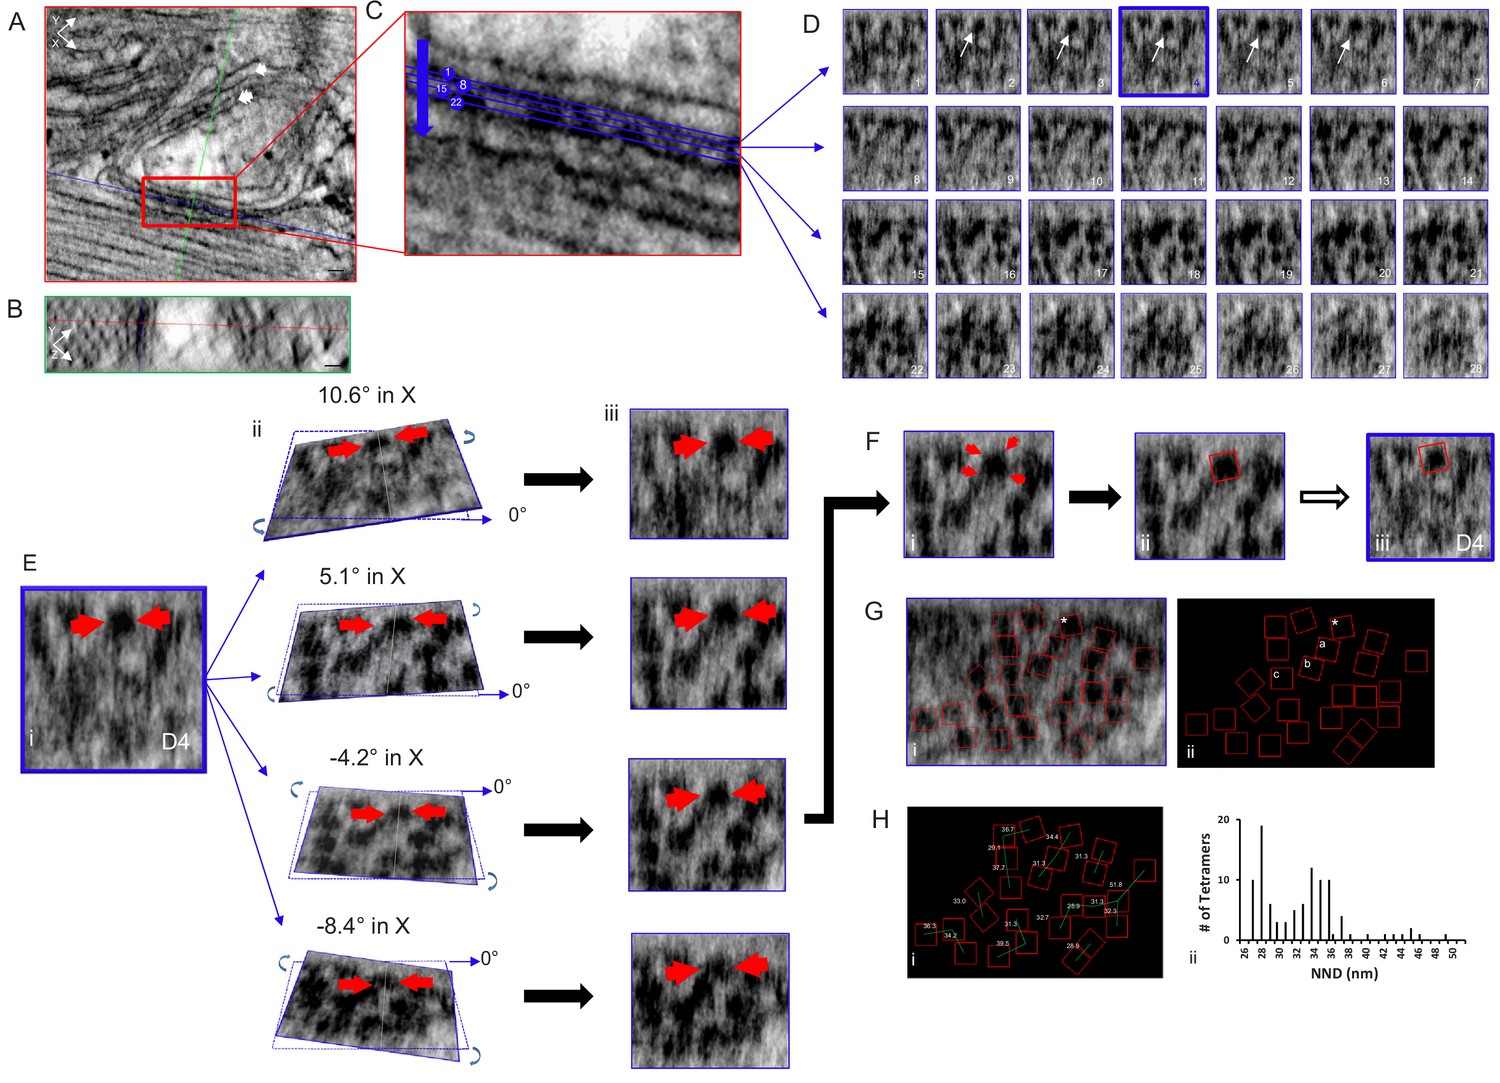
Tomogram of a Rat Ventricular Myocyte Dyad.
Orthogonal views, (A) XY and (B) YZ, 1nm-thick, through a dyad, with the intersecting planes (red line – XY plane, blue line - XZ plane, green line - YZ plane) positioned over a single RyR2. Single arrow – jSR, double arrow – t-tubule. Scale bars, 30 nm. (C) Magnified view of the boxed area in (A), 4 of the 28 XZ planes from which images were acquired are highlighted. (D) Sections of all 28 image (XZ planes) acquired through the width of this dyadic cleft. A single tetramer was identified for mapping (arrows, planes 2–6). Plane D4 (blue) was selected. (E) (i) Magnification of image plane D4; arrows indicate the selected tetramer. ii Rotations about the X axis, at the indicated angles, through the middle of the tetramer. iii XZ views of the images in ii. (F) (i) The tetramer’s four corners were visible with a 5.1° rotation in X and 0° in Y. (ii) A red box 27 nm on a side was placed over the tetramer, then transferred to the original image (iii). (G) Image of a single XZ plane of the tomogram (i) and a black background (ii) onto which the position and orientation of all of the tetramers has been superimposed. *the tetramer identified in (E and F). Mapping the position and orientation of the tetramers labelled a, b and c is in Figure 2—figure supplement 1. (H) (i) NND between the tetramers. (ii) Histogram of the NND of all of the tetramers examined in the control group (98 tetramers, five tomograms, Table 1). C++ code for RyR_fit program is available in Source code 1.
Figure 2—figure supplement 1
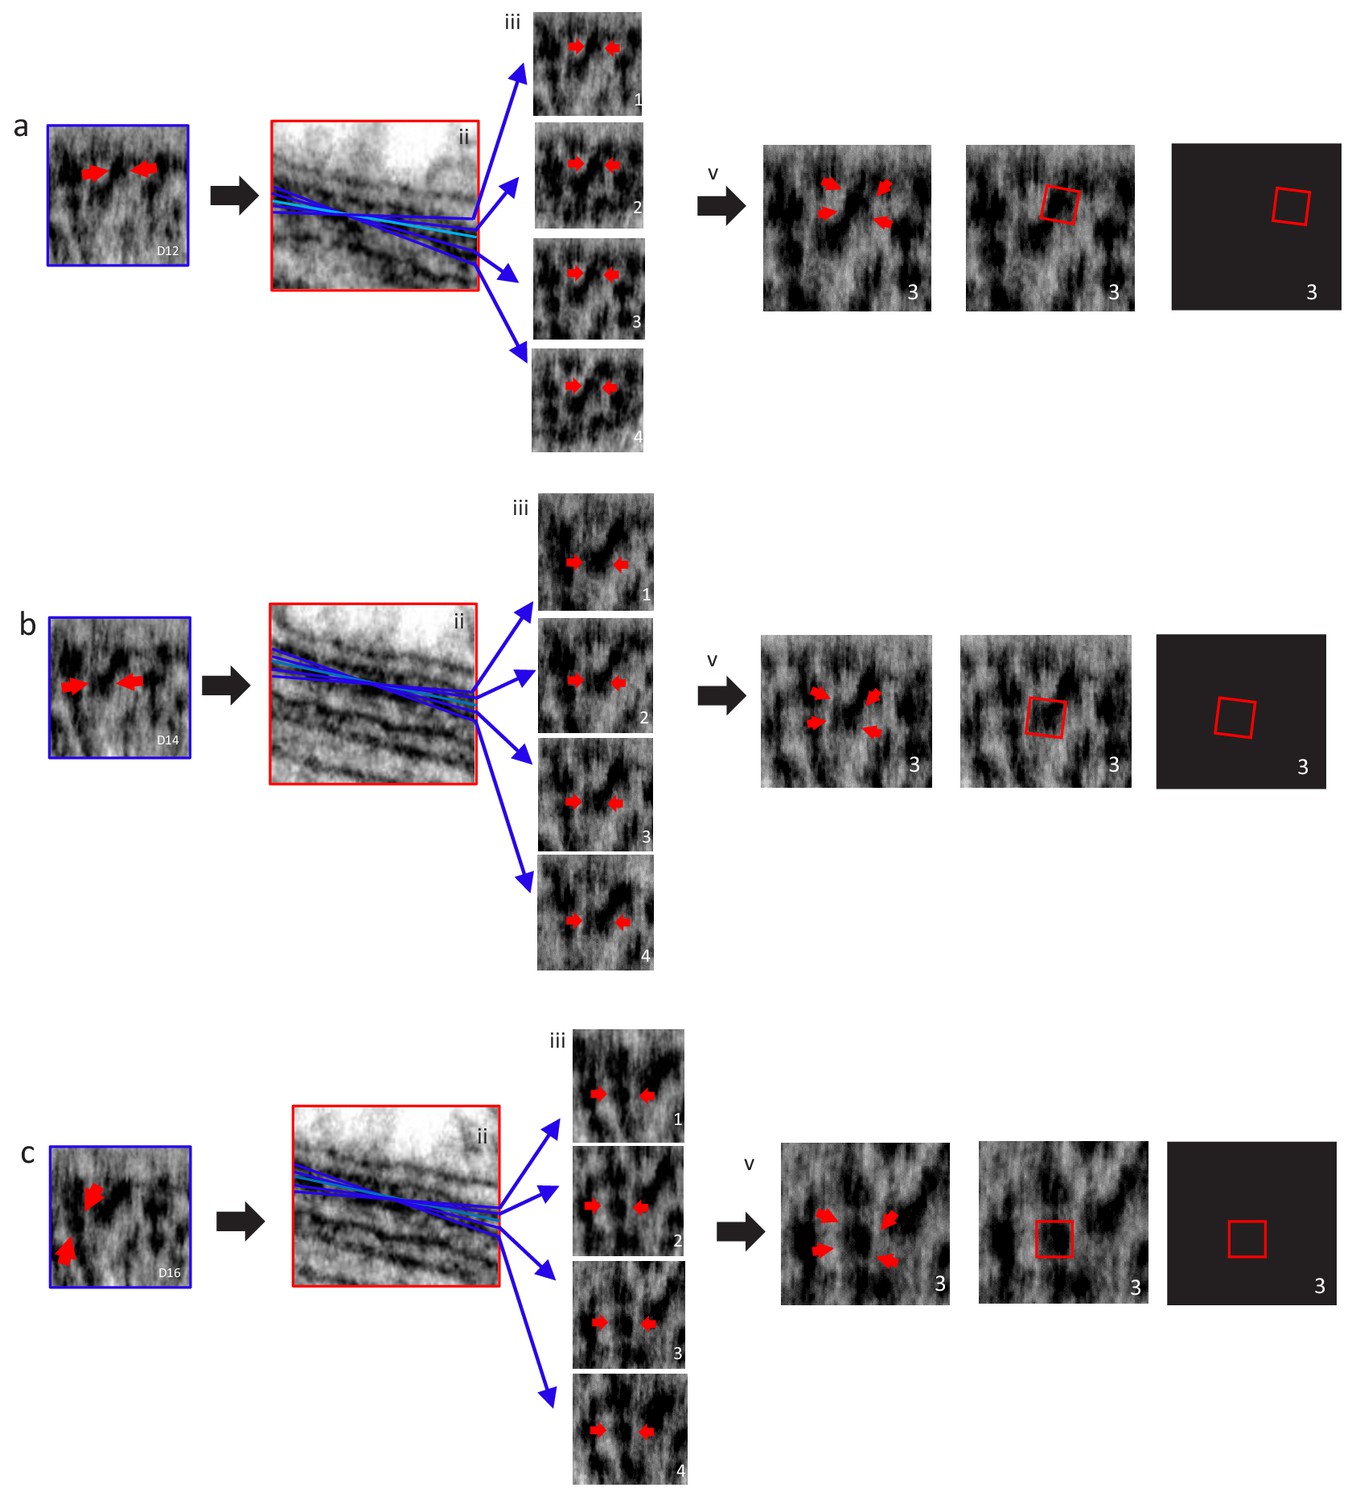
Localization and Distribution of 3 RyR2 Tetramers Identified in Figure 2 (a,b and c) on the Surface of the jSR.
(a) (i) The RyR2 shown in Figure 2D, (D12); the red arrows point at the identified RyR throughout the panel. (ii) Tilt rotation in X (blue lines), centred on the identified tetramer. (iii) The tetramer changed appearance as a function of tilt angle. iv, a red box, 27 nm (Van Petegem, 2015), was placed on the tetramer when its four corners (red arrows) could be clearly identified. Placement and orientation of tetramers in (b and c) are similar to a.
Figure 3
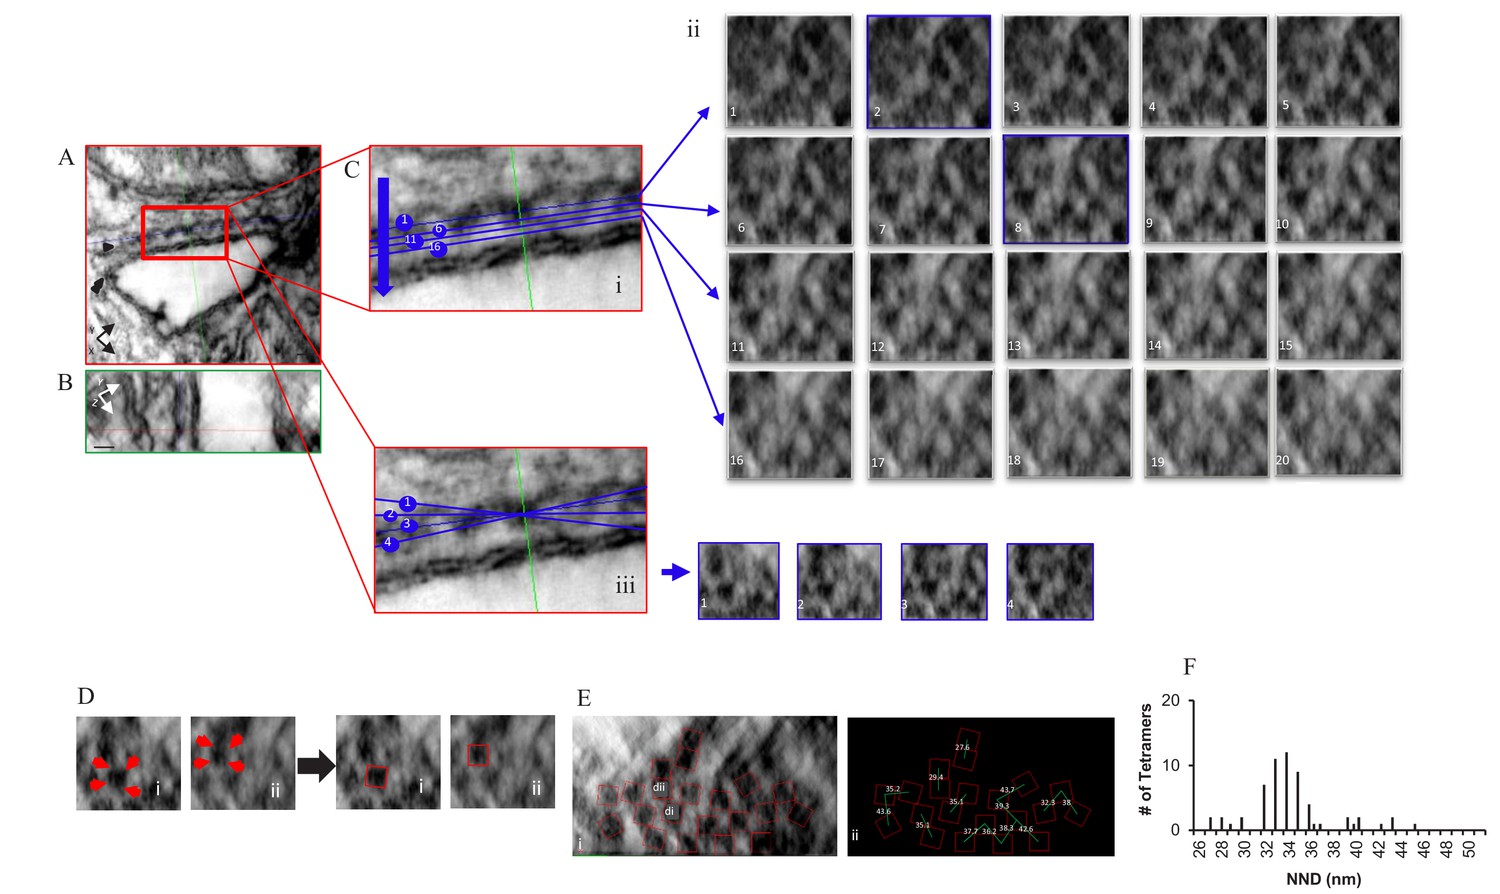
Localization, Distribution and NND Measurements of RyR2 on the Surface of the jSR in a Permeabilized Rat Ventricular Myocyte Exposed to the Phosphorylation Cocktail.
Orthogonal planes within the tomogram are outlined in different colors; XY in red, YZ in green and XZ in blue. (A) A single XY plane extracted from the dual-tilt tomogram. Single arrow points to the jSR, and the double arrow points to the t-tubule. (B) YZ view. (C) (i) An enlarged area of the junction in A. (C) (ii) Multiple XZ planes, at 0.5 nm intervals, were positioned within the cleft to bisect the ryanodine receptors. The planes paralleled, as nearly as possible, the jSR membrane; two of which (planes 2 and 8) are highlighted in blue. (C) (iii) Demonstration of how the tilt in X changed the appearance of the tetramers in Cii8. (D) Identification of RyR2 in Cii8. Each required a different rotation to identify the tetramers’ corners (red arrows). (E) Final distribution and orientation of all of the tetramers. The tetramers identified in Di and Dii are highlighted. (F) Histogram of the NND of 61 tetramers in four junctions.
Figure 4
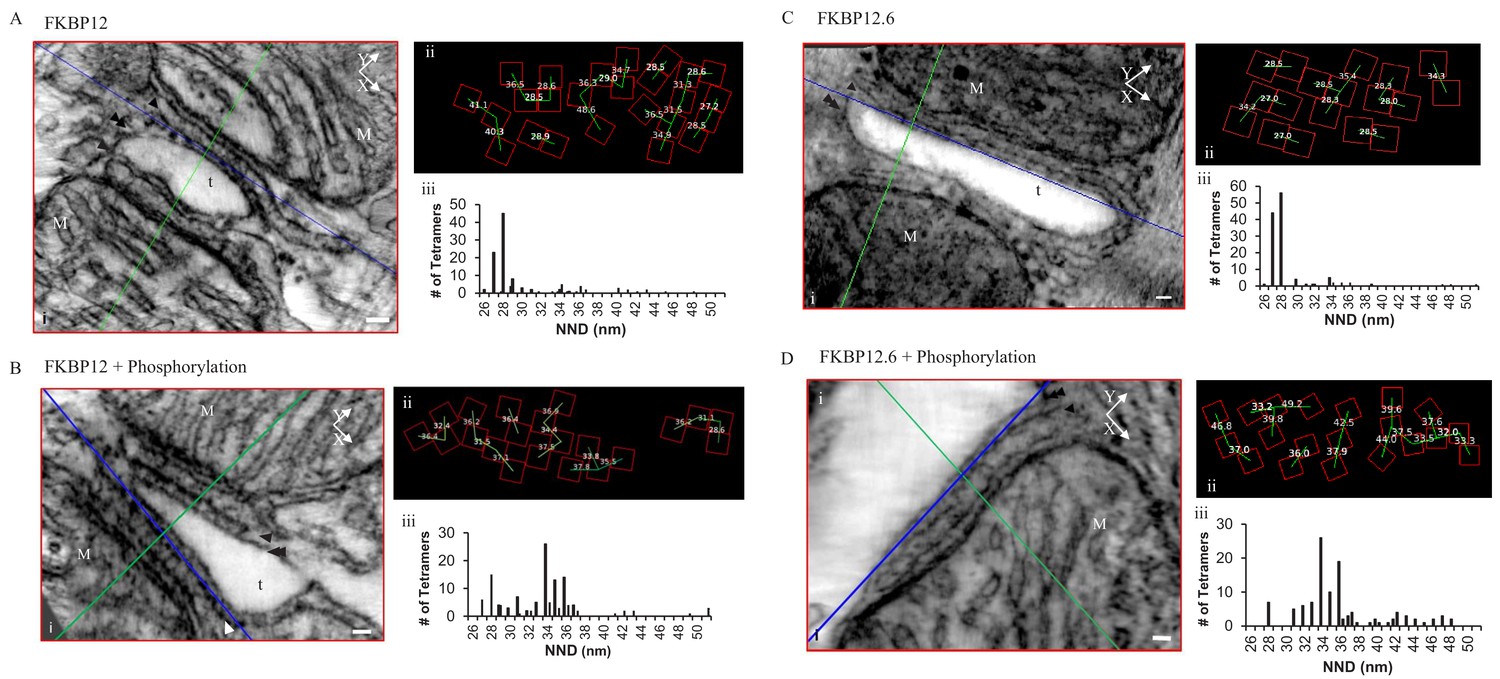
Permeabilized Rat Cardiomyocytes Treated with 10 µM Exogenous, Purified, FKBP12 or FKBP12.6 Either Without (A and C) or With (B and D) the Phosphorylation Cocktail.
(i) A single XY plane (red) through the dyad with the YZ (green) and XZ (blue) planes intersecting a single tetramer. M – mitochondria, t- t tubule, scale bars 30 nm. (ii) Position, orientation and centre-to-centre NND of the tetramers. (iii) Histograms of the centre-to-centre NND of all of the tetramers in the given experimental group (Table 1).
Figure 5
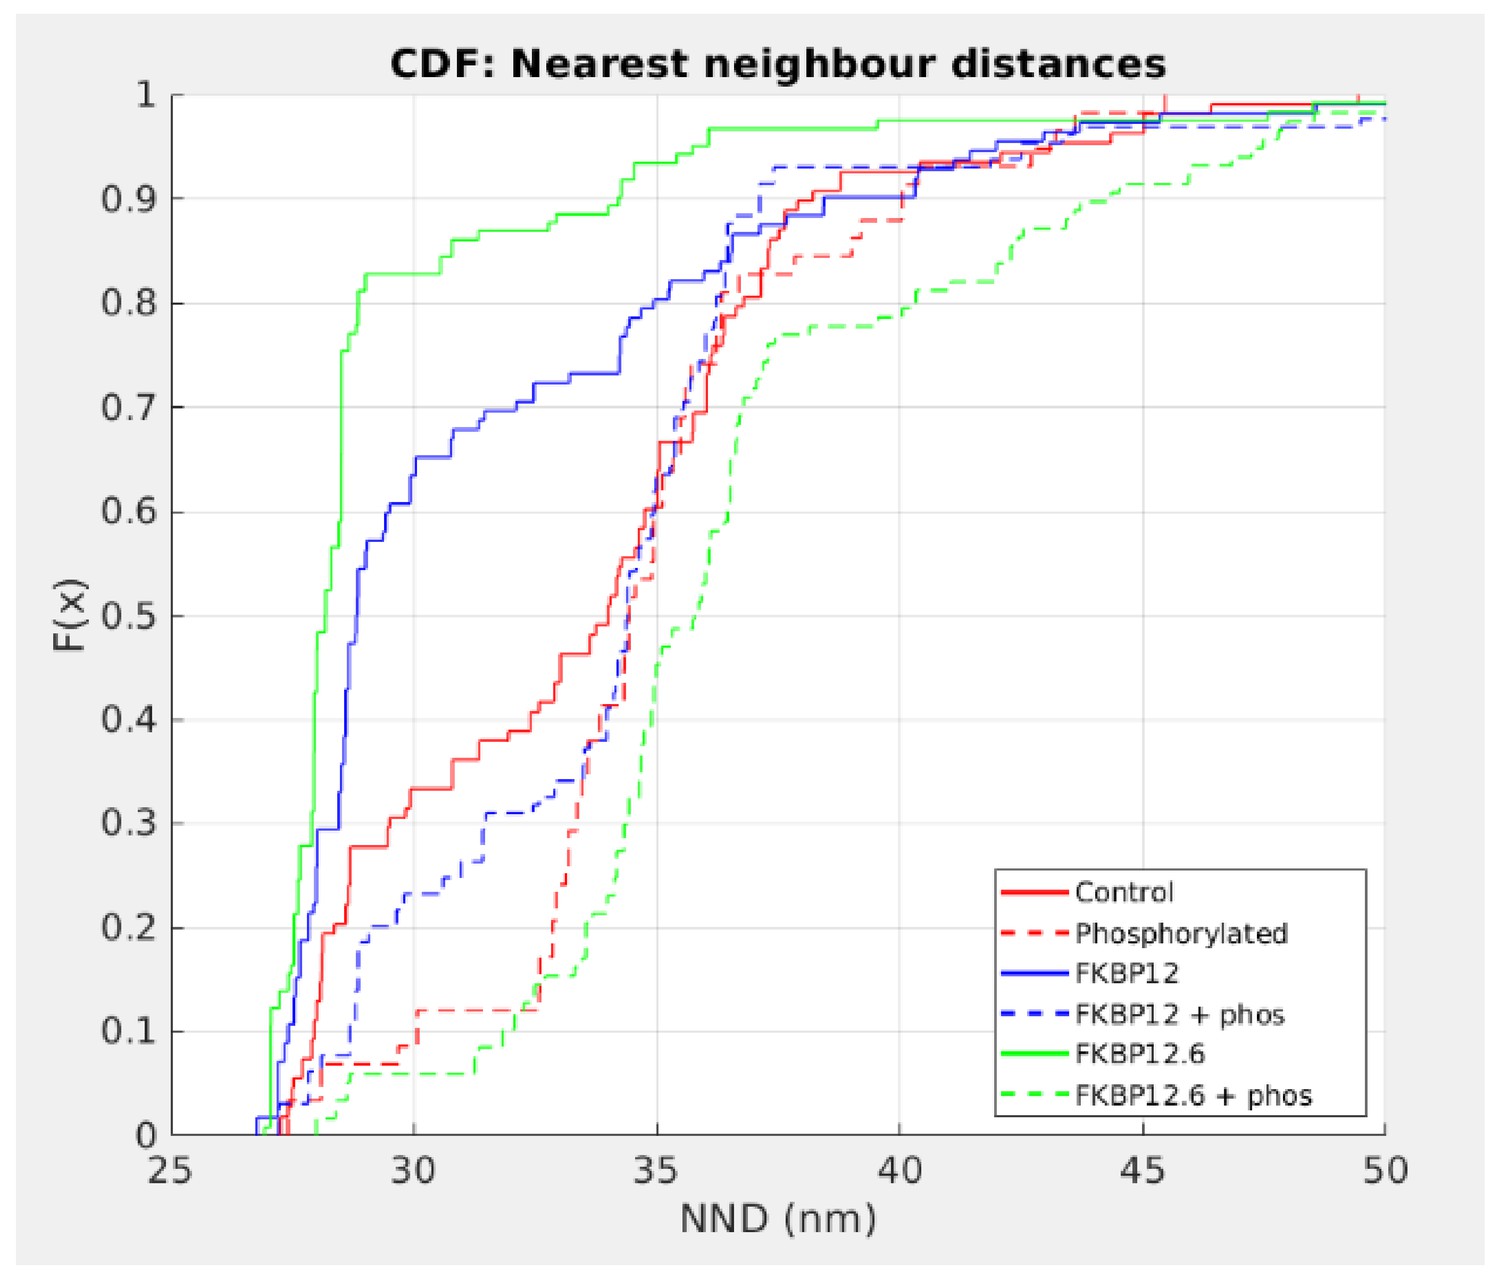
Cumulative Distribution Functions of the C-to-C NND.
Each treatment group is associated with a different color and all are significantly different from each other (p<0.01). Left shifted lines have significantly smaller NND than control while those that are right shifted have NND that are significantly larger. Full statistics and the Matlab code are available in Figure 5—source data 1 and Source code 2 respectively.
-
Figure 5—source data 1
Statistical Analysis of the Cumulative Distribution Functions.
- https://cdn.elifesciences.org/articles/51602/elife-51602-fig5-data1-v2.pdf
Figure 6 with 1 supplement
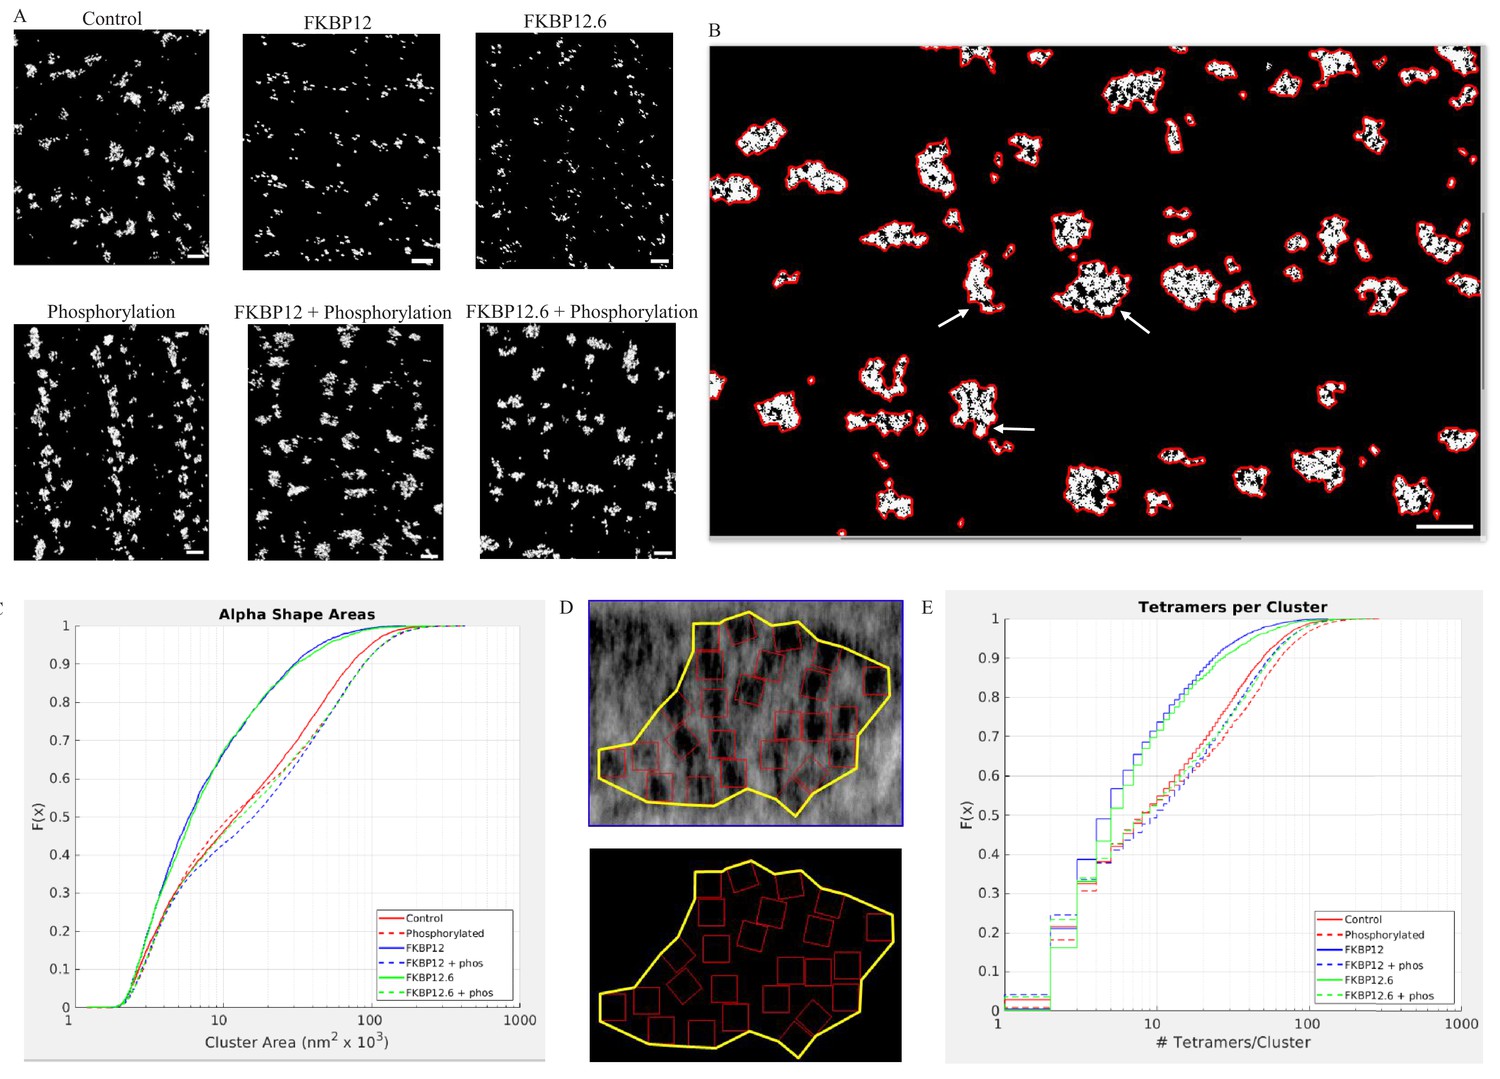
Superresolution Images of the Distribnution of RyR2 on the Myocyte Surface.
(A) Superresolution images of the surface of isolated cardiomyocytes labeled for the ryanodine receptor under the indicated conditions. Scale bars are 500 nm. (B) Alpha shapes identify individual clusters. Arrows point to examples of subgroups within a cluster. Scalebar is 500 nm. (C) Cumulative distribution functions of the RyR2 cluster sizes. Each treatment group is associated with a different color. (D) Alpha shape drawn around a tetramer array, the tomographic images are from a control myocyte. (E) Cumulative distribution functions of the number of RyR2 within a cluster under the different experimental conditions. Full statistics and the Matlab code are available in Figure 6—source datas 1 and 2 and Source code 2.
-
Figure 6—source data 1
Statistical Analysis of the Cumulative Distribution Functions for the Alpha Shape Areas.
- https://cdn.elifesciences.org/articles/51602/elife-51602-fig6-data1-v2.pdf
-
Figure 6—source data 2
Statistical Analysis of the Cumulative Distribution Functions for the Tetramers per Cluster.
- https://cdn.elifesciences.org/articles/51602/elife-51602-fig6-data2-v2.pdf
Figure 6—figure supplement 1
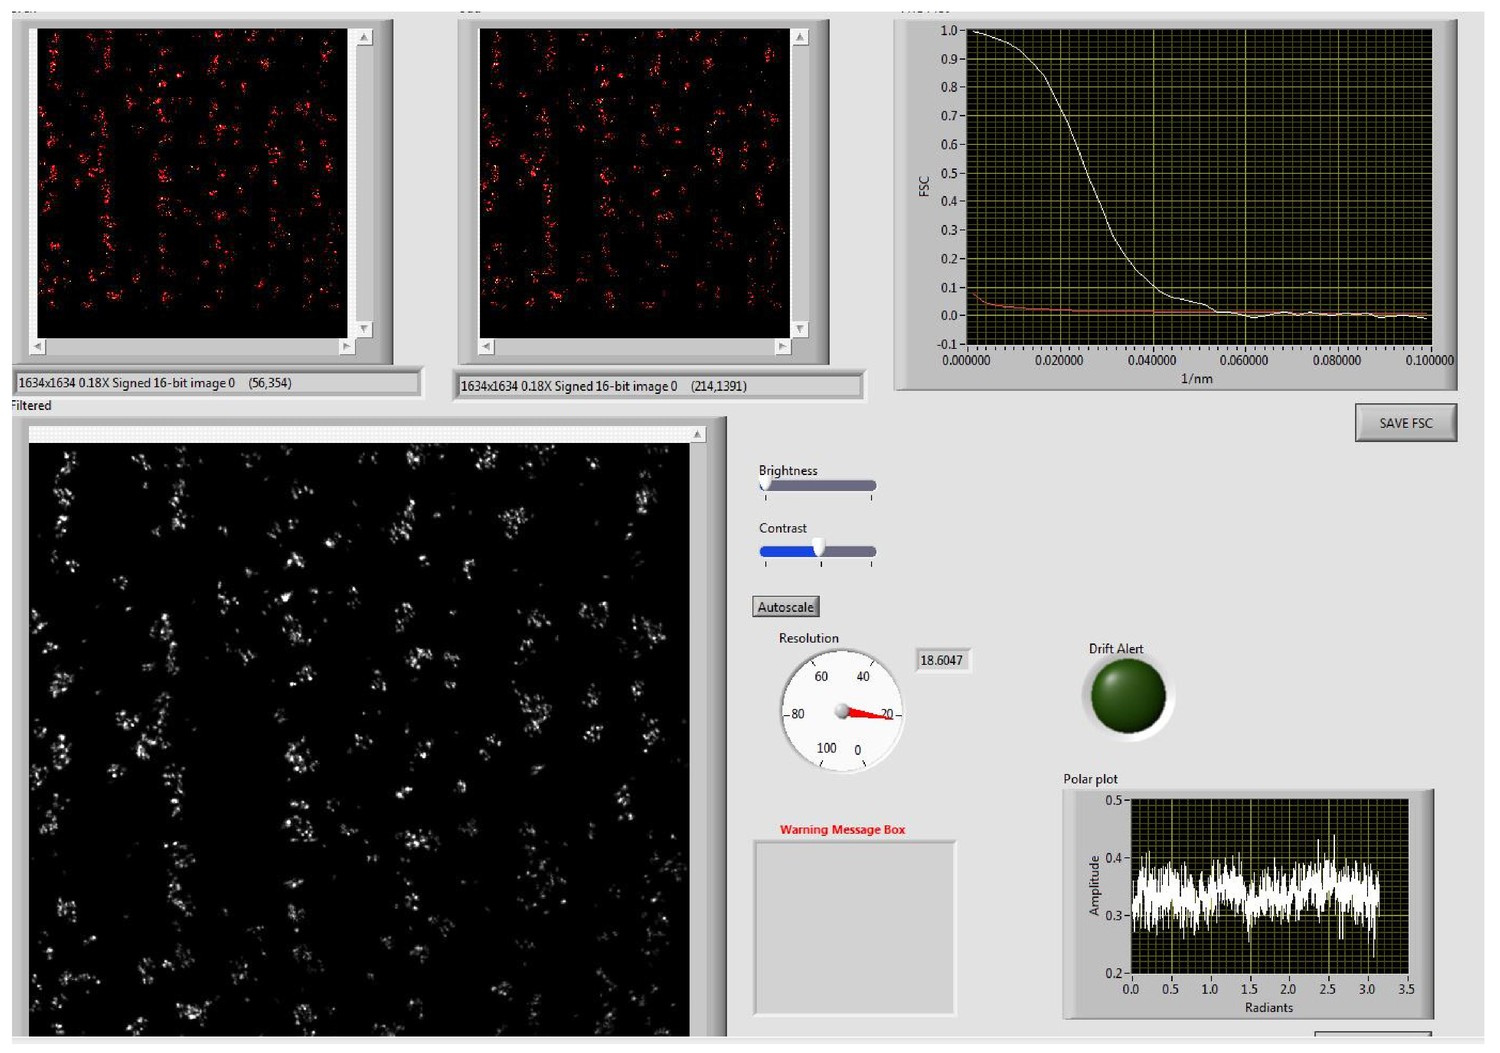
Screen Shot of the Output from the Fourier Ring Correlation Program: Resolution = 18.6 nm.
The image is from the Control experimental group. The original image (white) was split into two (red) which were correlated with each other. For further details, see Banterle et al, J. Struct. Vol 183, pp 363–367, 2013. The contrast of all of the cell images was enhanced for display.
Figure 7
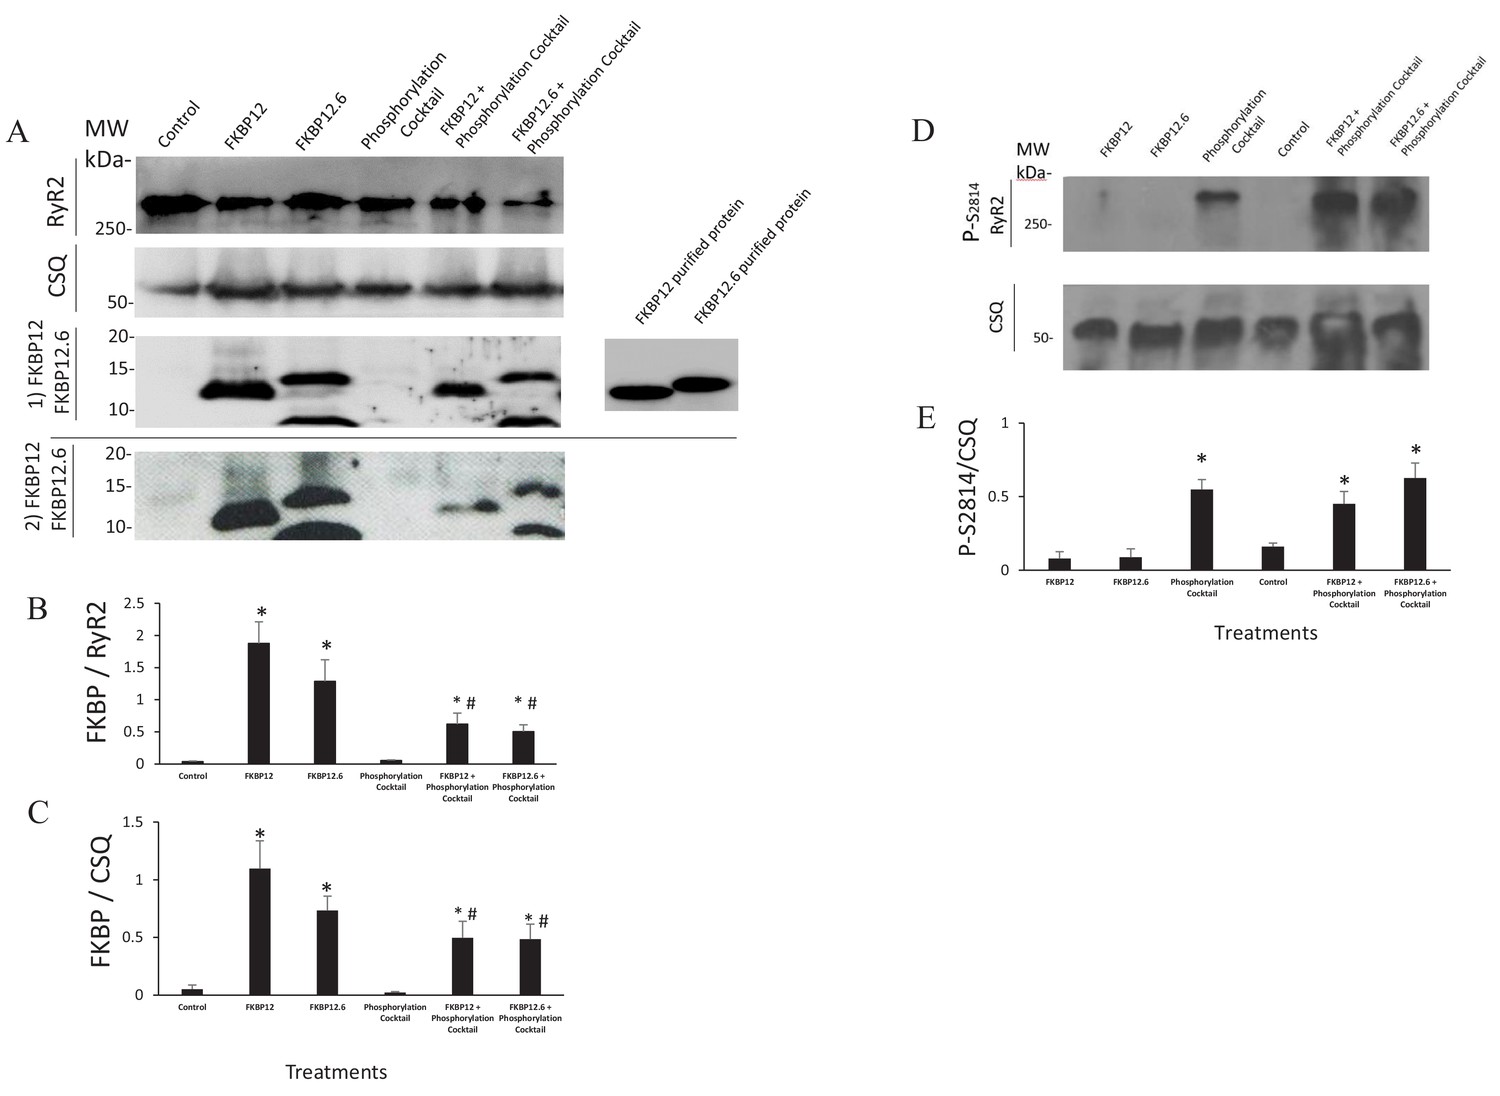
Western Blots.
(A) Western blots probed with anti FKBP12 (two blots displayed, the bottom blot shows a visible band in control lane) and the proteins selected as loading controls, calsequestrin and RyR. (B and C) An average of the western blots demonstrated that FKBP12 and FKBP12.6 purified peptides produced a significant increase in FKBPs association with RyR2 in treated cells. (D) Western blots probed with anti p-S2814, a phosphorylation site on RyR2, and the loading control, calsequestrin (CSQ). (E) An average of the blots demonstrated that the phosphorylation cocktail produced a significant increase in phosphorylation of S2814. Band densities were measured using ImageJ and were expressed as mean ± SEM. n = 7 blots of 4 hearts in B and C. n = 4 blots of 4 hearts in E. Data were analyzed using student t-test. *p<0.05 vs control. #p<0.05 vs Phosphorylation cocktail.
-
Figure 7—source data 1
Statistical Analysis of the Western Blots.
- https://cdn.elifesciences.org/articles/51602/elife-51602-fig7-data1-v2.pdf
Figure 8 with 2 supplements
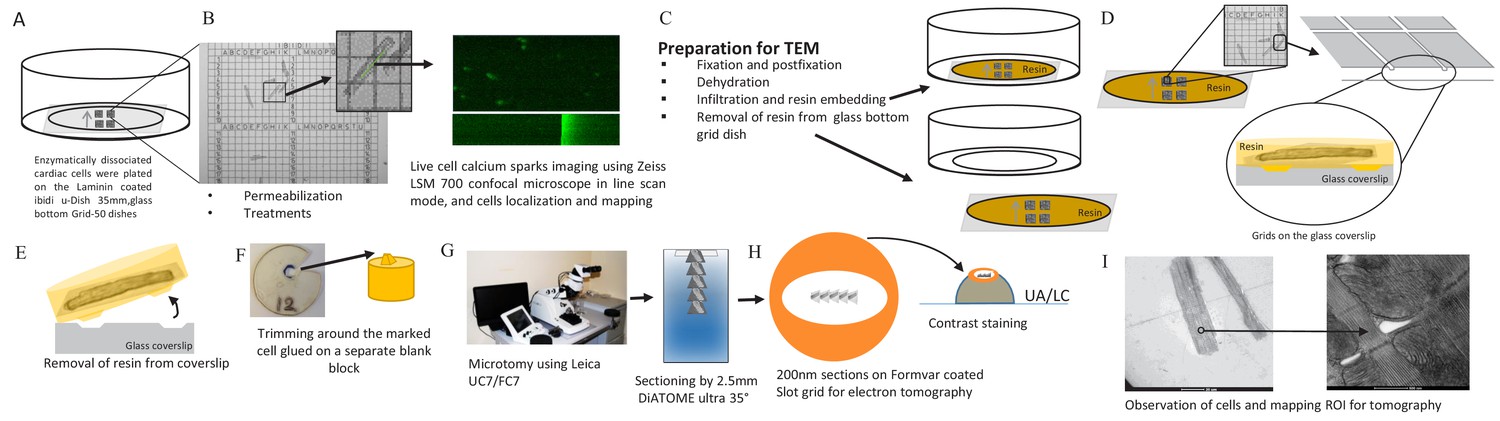
Calcium Spark and TEM Correlation Microscopy Pipeline.
(A) Enzymatically dissociated cardiac cells were plated on laminin coated ibidi u-Dish 35 mm, glass bottom Grid-50 dishes (Laminin, Roche). (B) Permeabilized cardiac myocytes were exposed to fluorescent Ca2+ indicators (30 µmol/L Fluo-4) and to intracellular solution (IS) or to IS plus the phosphorylation cocktail for 10 min. Calcium sparks were recorded on a Zeiss LSM 700 confocal microscope in line scan mode (63/1.4 Plan Apochromat objective). Cells were chosen for calcium spark imaging and their location on the gridded dish was recorded. (C) Cells were prepared (fixed, dehydrated and resin embedded) for TEM in the grid dish. (D) The glass mesh coverslip was removed from the petri dish. (E) Resin was peeled off the glass coverslip using liquid nitrogen (details are in the Materials and methods). (F) The resin was trimmed and glued onto a separate blank resin block. (G) Using a Leica UC7/FC7 microtome, the blocks were sectioned on Fomvar coated Slot grids using a 2.5 mm DiATOME ultra 35° knife. (H) Contrast staining was done using the classic contrast method; slot grids were placed on a drop of uranyl acetate and then lead citrate. (I) The cells were observed by TEM and ROI were mapped for tomography.
Figure 8—figure supplement 1
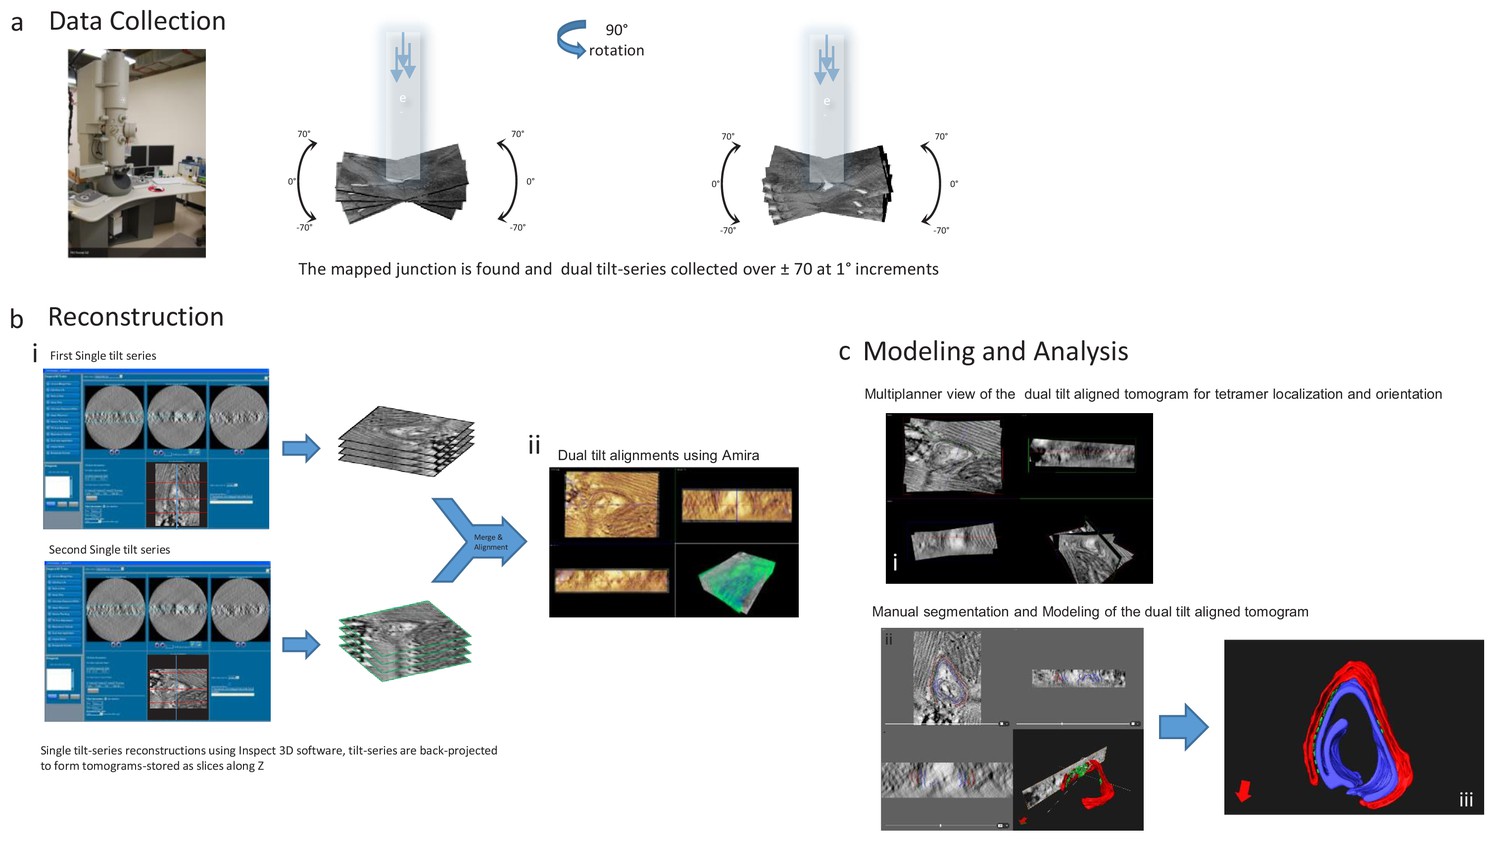
Dual Tilt Electron Tomography; Imaging and Data Processing Pipeline.
(a) A slot grid holding a 200–300 nm thick section of the same cell used for imaging calcium sparks was placed in the rotating, dual tilt stage and observed in the 200 kV Tecnai G2 transmission electron microscope (FEI, Hillsboro, OR). A suitable junction was imaged twice, from orthogonal directions, with serial tilt views ranging from +70° to −70° at 1° increments in low tilts and 2° increments in tilts over 50° using Tia (FEI), an automated acquisition program. (b) The images in every tilt series were computationally aligned to their common axis and reconstructed into the 3D tomogram using weighted back-projection implemented in Inspect 3D (FEI). Dual-tilt alignment and visualization was done using Amira 5.4 and 6.4 (FEI). (c) Dual data sets were examined using the Multi Planner Viewer. Manual segmentations and modeling were done using Amira.
Figure 8—figure supplement 2
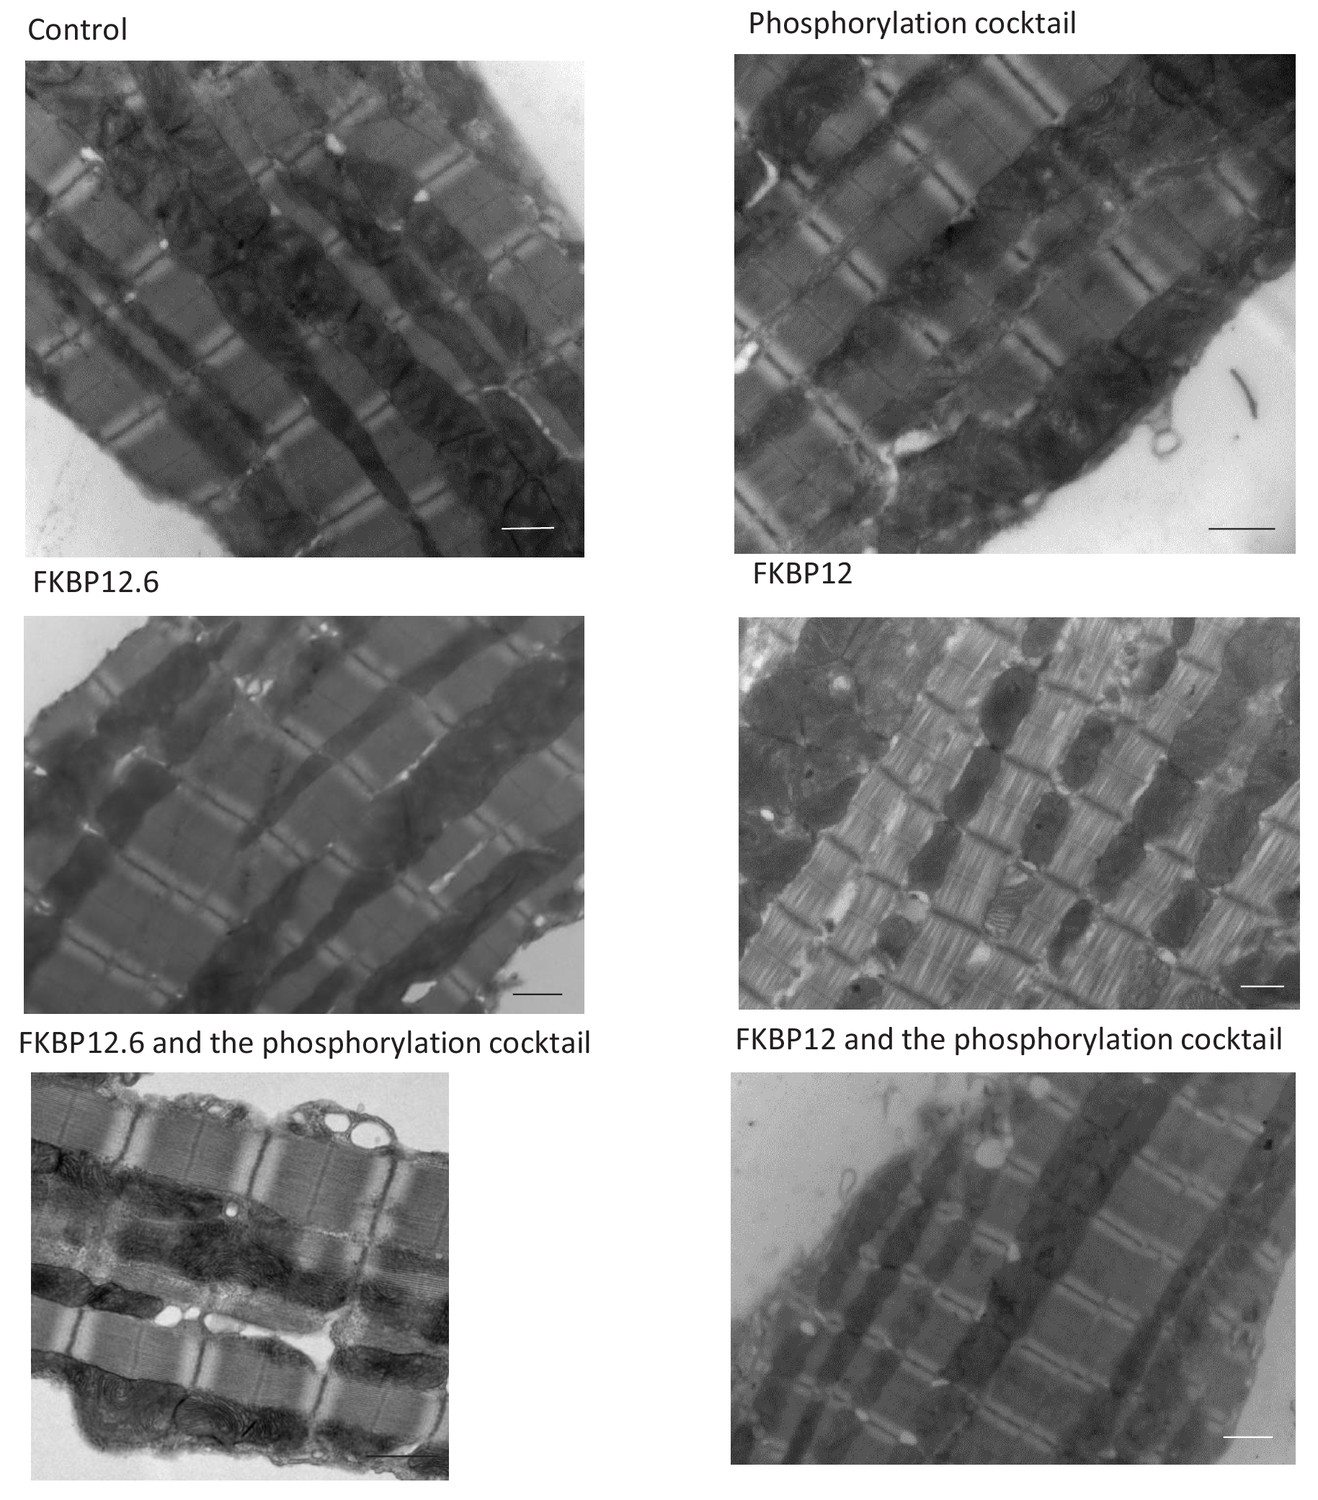
2D Electron Micrographs of Treated Isolated Cells.
Scale bars are 1 μm.
Videos
Video 1
Dyad of a control myocyte:tomogram and model.
Video 2
Dyad from a Myocyte Treated with the Phosphorylation Cocktail: Tomogram and Model.
Video 3
Dyad of a Myocyte Treated with FKBP12: Tomogram and Model.
Video 4
Dyad of a Myocyte treeated with FKBP12.6: Tomogram and Model.
Video 5
Dyad of a Myocyte treated with FKBP12 and the Phosphorylation Cocktail: Tomogram and Model.
Video 6
Dyad of a Myocyte treated with FKBP12.6 and the Phosphorylation Cocktail: Tomogram and Model.
Tables
Table 1
Tetramer Arrangements.
| Checkerboard | Side-by-Side | Isolated | Both | Tomograms | Tetramers | Rats | |
|---|---|---|---|---|---|---|---|
| FKBP12 | 8.4% | 57.1% | 18.5% | 16.0% | 5 | 119 | 3 |
| FKBP12+Phos | 60.5% | 13.2% | 19.4% | 7.0% | 7 | 129 | 3 |
| FKBP12.6 | 8.2% | 82.8% | 7.4% | 1.6% | 7 | 122 | 3 |
| FKBP12.6+Phos | 71.3% | 5.2% | 22.6% | 0.9% | 8 | 115 | 3 |
| Control | 50.0% | 27.6% | 14.3% | 8.2% | 5 | 98 | 3 |
| Phosphorylation | 75.0% | 6.3% | 14.1% | 4.7% | 4 | 64 | 3 |
Table 2
dSTORM Images: Cluster Areas.
| Median Cluster Area (nm2 x 103) | Mean Cluster Area (nm2 x 103) | Number of Clusters Examined | |
|---|---|---|---|
| Control (10) | 12.2 | 27.3 | 5582 |
| Phosphorylated (12) | 11.1 | 32.2 | 4997 |
| FKBP12 (13) | 5.9 | 12.4 | 3615 |
| FKBP12.6 (7) | 6.1 | 13.2 | 2444 |
| FKBP12 + Phos (10) | 16.0 | 33.3 | 7761 |
| FKBP12.6 + Phos (9) | 13.1 | 32.3 | 4248 |
Table 3
Tetramer Density per Cluster.
| Tomograms | dSTORM Images | |||
|---|---|---|---|---|
| Median Tetramer Coverage/Cluster | No. of Tomograms Examined | Median No. of Tetramers/Cluster | Mean No. of Tetramers/Cluster | |
| Control | 49.5% | 13 | 8 | 18.5 |
| Phosphorylated | 52.8% | 9 | 8 | 23.3 |
| FKBP12 | 57.1% | 12 | 5 | 9.7 |
| FKBP12.6 | 62.5% | 9 | 5 | 11.3 |
| FKBP12 + Phos | 44.9% | 7 | 10 | 20.5 |
| FKBP12.6 + Phos | 46.2% | 8 | 8 | 20.5 |
Table 4
Nearest Neighbour Centre-to-Centre Distances.
| Checkerboard | Side-by-Side | ||||
|---|---|---|---|---|---|
| Mean ± SD | Median | Mean ± SD | Median | ||
| FKBP12 | 34.8 ± 2.0 | 35.0 | 28.4 ± 0.9 | 28.5 | |
| FKBP12 + Phos | 34.3 ± 1.9 | 34.6 | 28.6 ± 0.9 | 28.8 | |
| FKBP12.6 | 33.3 ± 2.8 | 33.6 | 28.0 ± 0.8 | 28.0 | |
| FKBP12.6 + Phos | 35.1 ± 2.1 | 34.9 | 28.4 ± 0.2 | 28.4 | |
| Control | 34.2 ± 1.6 | 34.6 | 28.3 ± 0.8 | 28.1 | |
| Phosphorylation | 34.2 ± 1.9 | 34.3 | 27.7 ± 0.3 | 27.7 | |
Key resources table
| Reagent type (species) or resource | Designation | Source or reference | Identifiers | Additional information |
|---|---|---|---|---|
| Biological sample (Rat) | Primary left ventricular myocytes | Charles River Canada | RRID:RGD_11040548 | Wistar Male rat (150–200 gr) |
| Antibody | Anti FKBP12 (Rabbit polyclonal) | Abcam | RRID:AB_303413 | WB (1:2500) |
| Antibody | Anti Calsequestrin (Rabbit polyclonal) | Abcam | RRID:AB_303865 | WB (1:75000) |
| Antibody | RYR2 Phospho Serine 2814 Anti-Serum antibody (Rabbit polyclonal) | Badrilla | RRID:AB_2617055 | WB (1:2000) |
| Antibody | Ryanodine Receptor Monoclonal Antibody (C3-33) | Thermo Fisher Scientific | RRID:AB_2183054 | Super-res IF(1:100), WB (1:1000) |
| Antibody | Goat anti-Mouse IgG (H+L) Highly Cross-Adsorbed Secondary Antibody, Alexa Fluor 647 | Thermo Fisher Scientific | RRID:AB_2535805 | Super-res IF (1:50) |
| Antibody | Anti-Rabbit IgG (H+L) Polyclonal Antibody, Horseradish Peroxidase Conjugated | Innovative Research (Invitrogen/Zymed) | RRID:AB_88349 | WB (1:10000) |
| Antibody | Goat anti-Mouse IgG (H+L) Secondary Antibody, HRP | Thermo Fisher Scientific | RRID:AB_2533947 | WB (1:10000) |
| Other | Immobilon-P PVDF membrane | Sigma Millipore | Cat# IPVH00010 | WB (0.45 µm pore size) |
| Other | FluoSpheres Carboxylate-Modified Microspheres, 0.1 µm, infrared fluorescent | Thermo Fisher Scientific | Cat# F8799 | Microspheres used in Super-res IF (Image stabilization) |
| Other | SuperSignal West Femto Chemiluminescent Substrate kit | Thermo Fisher Scientific | Cat# 34095 | Horseradish peroxidase (HRP) substrates- WB |
| Other (Calcium Indicator) | Fluo-4, Pentapotassium Salt | Thermo Fisher Scientific | Cat# F14200 | Concentration: 30 µmol/L |
| Chemical compound, drug | Protease Inhibitor Cocktail | Sigma | Cat#P-8340 | WB- lysis buffer |
| Chemical compound, drug | IBMX (3-isobutyl-1-methylxanthine/) | Sigma | Cat# 15879 | In phosphorylation cocktail as a phosphodiesterase (PDE) inhibitor (10 µmol/L) |
| Chemical compound, drug | Calyculin A from Discodermia calyx | Sigma | Cat# C5552 | In phosphorylation cocktail as an inhibitor of serine-threonine protein phosphatase 2A |
| Chemical compound, drug | Okadaic acid ammonium salt from Prorocentrum concavum | Sigma | Cat#O8010 | In phosphorylation cocktail- Inhibitor of type 1 and type 2A protein phosphatases |
| Chemical compound, drug | 2-mercaptoethanol | Sigma | Cat#M3148 | Super-res IF (140 mmol/L) |
| Chemical compound, drug | Glucose Oxidase from Aspergillus niger | Sigma | Cat#G0543 | Super-res IF (0.5 mg/ml) |
| Chemical compound, drug | Catalase from bovine liver | Sigma | Cat#C3155 | Super-res IF (40 µg/ml) |
| Software, algorithm | Hierarchical statistical data analysis | Sikkel et al., 2017 | PMID: 29016722 | Used for statistical analysis of calcium spark parameters |
| Software, algorithm | Amira for Life Sciences | Thermo Fisher Scientific (FEI) | RRID:SCR_007353 | Tomography 3D visualization and analysis software |
| Software, algorithm | ImageJ | NIH Image | RRID:SCR_003070 | Used in WB analysis |
| Software, algorithm | Fiji | NIH Image | RRID:SCR_002285 | Spark Master plugin, used in calcium spark analysis |
| Transfected construct (include species here) | E. coli RosettaTM (DE3) cells | Novagen | Cat#70954 | Expression and purification of human FKBP12 and FKBP12.6 |
| Other | Superdex 200 16/60 column | GE Healthcare | Cat#GE28-9893-35 | Expression and purification of human FKBP12 and FKBP12 |
| Other | PorosMC column | Thermofisher Scientific | Cat#1542226 | Expression and purification of human FKBP12 and FKBP12 |
| Chemical compound, drug | lysozyme | Thermofisher Scientific | Cat#89833 | 25 μg/ml (Expression and purification of human FKBP12 and FKBP12) |
| Chemical compound, drug | TEV protease | NEB | Cat#P8112S | Expression and purification of human FKBP12 and FKBP12 |
| Chemical compound, drug | imidazole | Sigma | Cat#792527 | 300 mmol/L (Expression and purification of human FKBP12 and FKBP12) |
| Chemical compound, drug | isopropyl-β-D-thiogalactoside (IPTG) | Thermofisher Scientific | Cat#BP-1755 | 0.4 mmol/L (Expression and purification of human FKBP12 and FKBP12) |
| Chemical compound, drug | PMSF | Sigma Millipore | Cat#7110 | 100 μM (Expression and purification of human FKBP12 and FKBP12) |
| Chemical compound, drug | DNase I | Sigma | Cat#11284932001 | 25 μg/ml (Expression and purification of human FKBP12 and FKBP12) |
Additional files
-
Source code 1
Program to fit RyR2 tetramers to tomographic images.
- https://cdn.elifesciences.org/articles/51602/elife-51602-code1-v2.pdf
-
Source code 2
Program to analyse the significance between cumultative distribution functions.
- https://cdn.elifesciences.org/articles/51602/elife-51602-code2-v2.pdf
-
Transparent reporting form
- https://cdn.elifesciences.org/articles/51602/elife-51602-transrepform-v2.docx
Download links
A two-part list of links to download the article, or parts of the article, in various formats.
Downloads (link to download the article as PDF)
Open citations (links to open the citations from this article in various online reference manager services)
Cite this article (links to download the citations from this article in formats compatible with various reference manager tools)
Cardiac ryanodine receptor distribution is dynamic and changed by auxiliary proteins and post-translational modification
eLife 9:e51602.
https://doi.org/10.7554/eLife.51602


