An atypical DYRK kinase connects quorum-sensing with posttranscriptional gene regulation in Trypanosoma brucei
- Institute for Immunology and Infection Research, School of Biological Sciences, Charlotte Auerbach Road, University of Edinburgh, United Kingdom
Figures
Figure 1 with 2 supplements
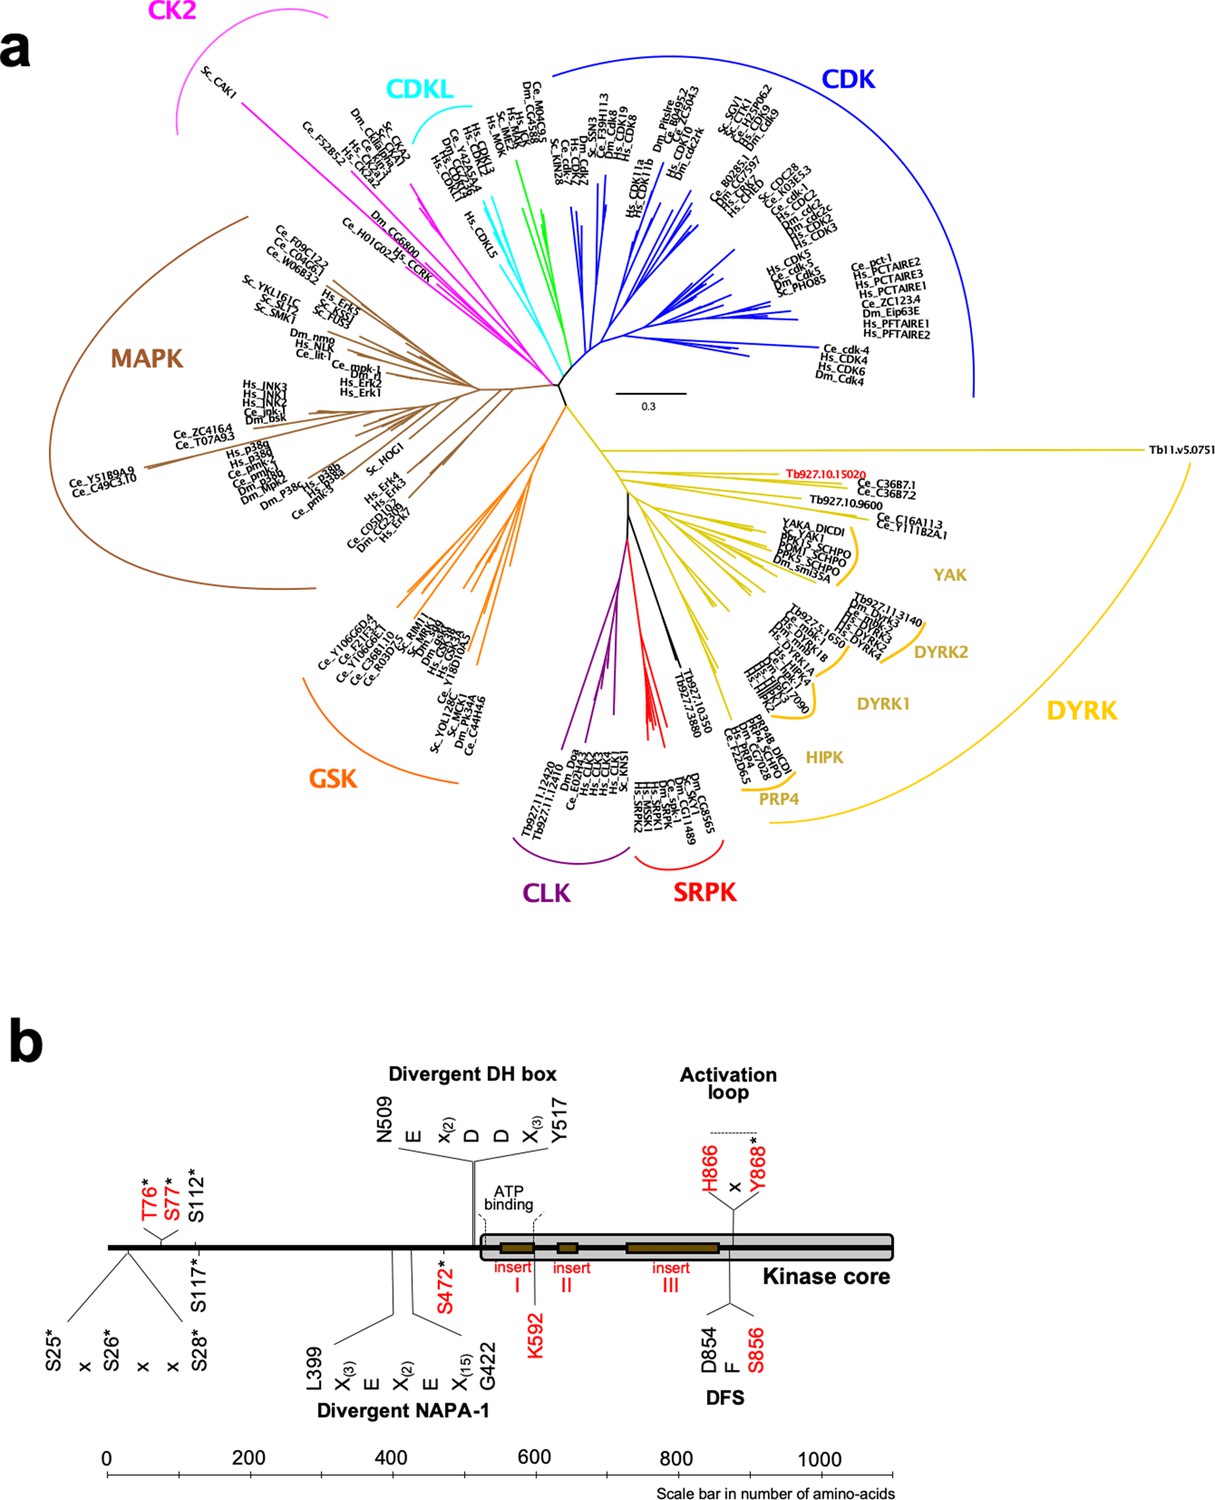
Phylogenetic analysis of the CMGC protein kinase family.
(a) The evolutionary history was inferred by using the Maximum Likelihood method based on the Whelan And Goldman + Freq. model (Whelan and Goldman, 2001). Initial tree(s) for the heuristic search were obtained by applying the Neighbour-Joining method to a matrix of pairwise distances estimated using a JTT model. The tree is drawn to scale, with branch lengths measured in the number of substitutions per site. All positions with less than 95% site coverage were eliminated. That is, fewer than 5% alignment gaps, missing data, and ambiguous bases were allowed at any position. Hs = Homo sapiens, Ce = Caenorhabditis elegans, Dm = Drosophila melanogaster, Sc = Saccharomyces cerevisiae, DICDI = Dictyostelium discoideum, Tb927 = Trypanosoma brucei. The early divergent TbDYRK is highlighted in red. (b) Schematic representation of linear protein sequence of TbDYRK, highlighting particular characteristics of its sequence. Identified phosphosites are represented by an *. Insertions I, II and III are presented with the brown boxes. All residues or inserts mutated or deleted in this study are represented in red.
Figure 1—figure supplement 1
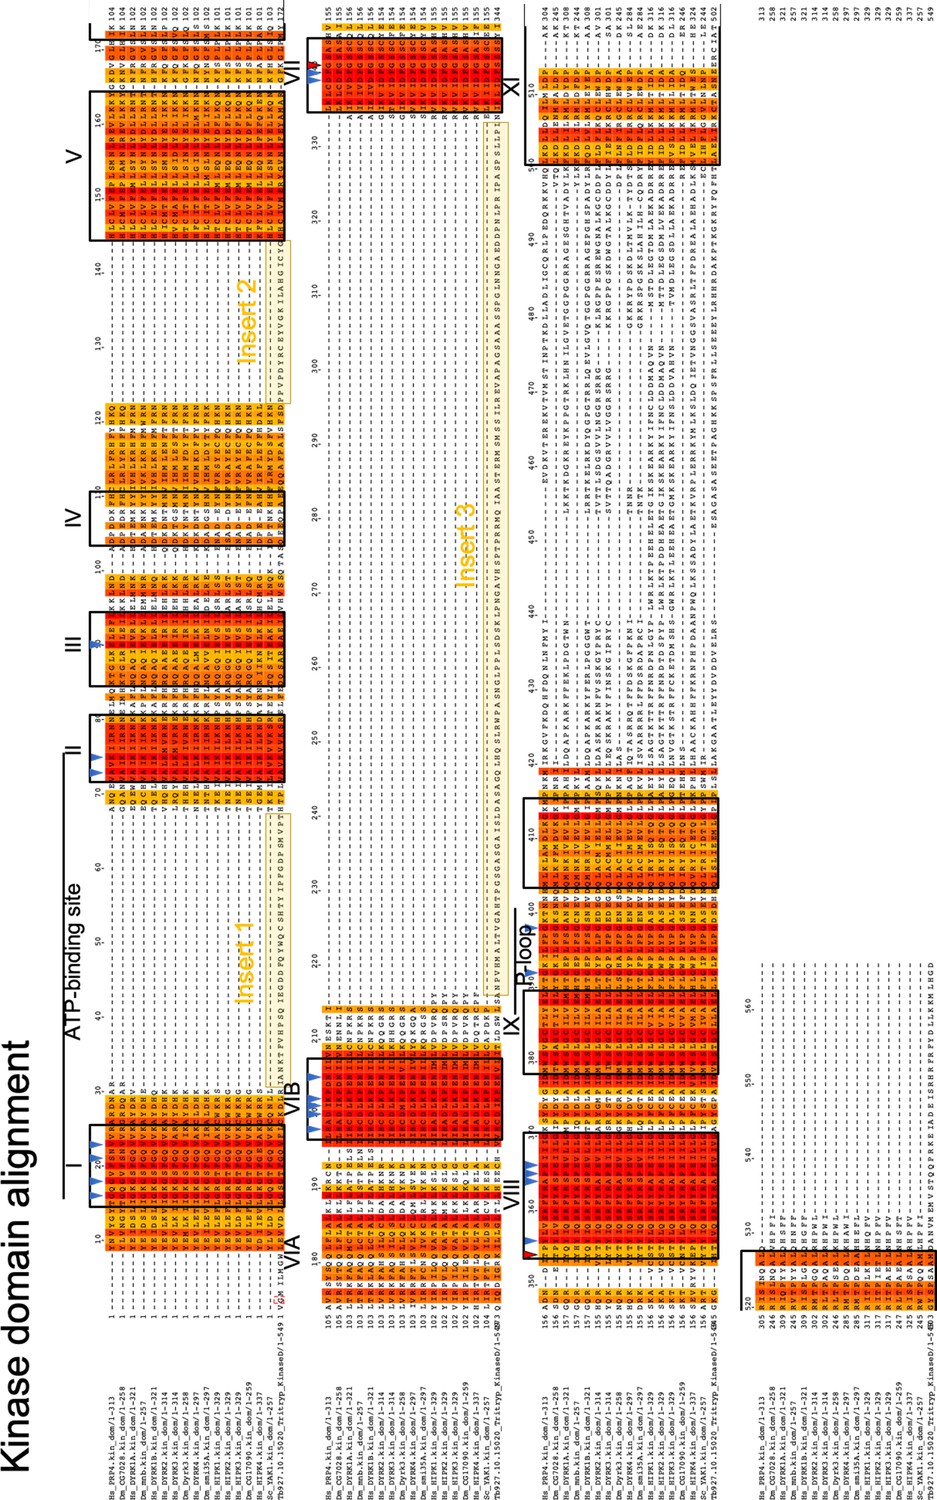
Multiple sequence alignment of the kinase core of TbDYRK (lower sequence) with other DYRKs from other species.
Gradient colours indicate percentage of similarity, Latin numbering indicate the XII characteristic kinase domains, blue arrow heads indicate highly conserved residues, red arrow heads indicates usually highly conserved residues that are different in TbDYRK, yellow boxes highlight the three inserts.
Figure 1—figure supplement 2
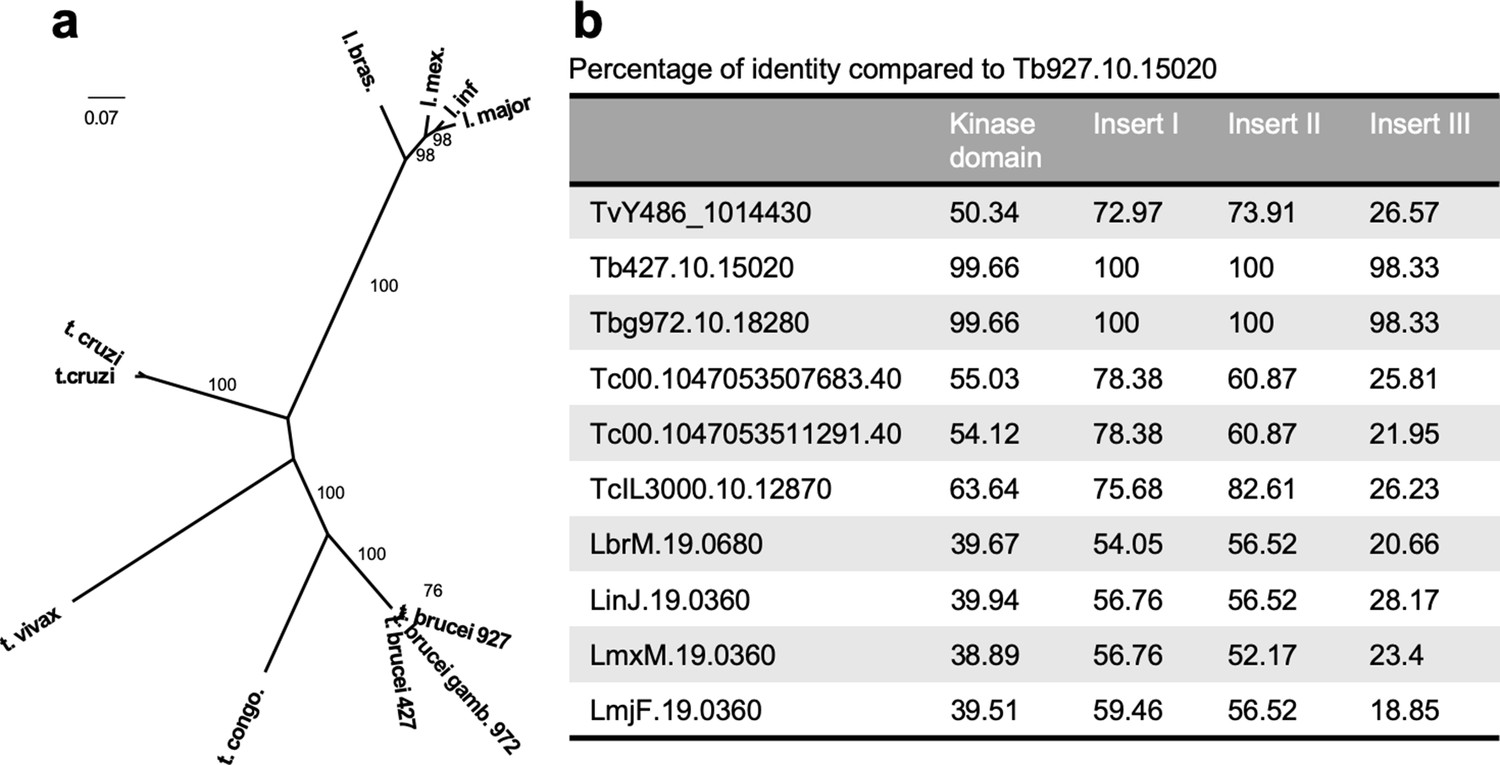
Phylogenetic analysis and conservation of DYRK orthologues in other kinetoplastids.
(a) Molecular Phylogenetic analysis by the Maximum Likelihood method. The evolutionary history was inferred by using the Maximum Likelihood method based on the Whelan And Goldman + Freq. model (Whelan and Goldman, 2001). The tree with the highest log likelihood (−6239.9546) is shown. The percentage of trees in which the associated taxa clustered together is shown next to the branches. Initial tree(s) for the heuristic search were obtained by applying the Neighbour-Joining method to a matrix of pairwise distances estimated using a JTT model. The tree is drawn to scale, with branch lengths measured in the number of substitutions per site. The analysis involved 11 amino acid sequences. All positions with less than 95% site coverage were eliminated. That is, fewer than 5% alignment gaps, missing data, and ambiguous bases were allowed at any position. There were a total of 542 positions in the final analysis. Evolutionary analyses were conducted in MEGA7 (Kumar et al., 2016). Bootstrap proportions higher than 70% are shown at internal nodes. (b) Percentage of identity of different domains of the orthologues of the TbDYRK from other kinetoplastid species.
Figure 2 with 1 supplement
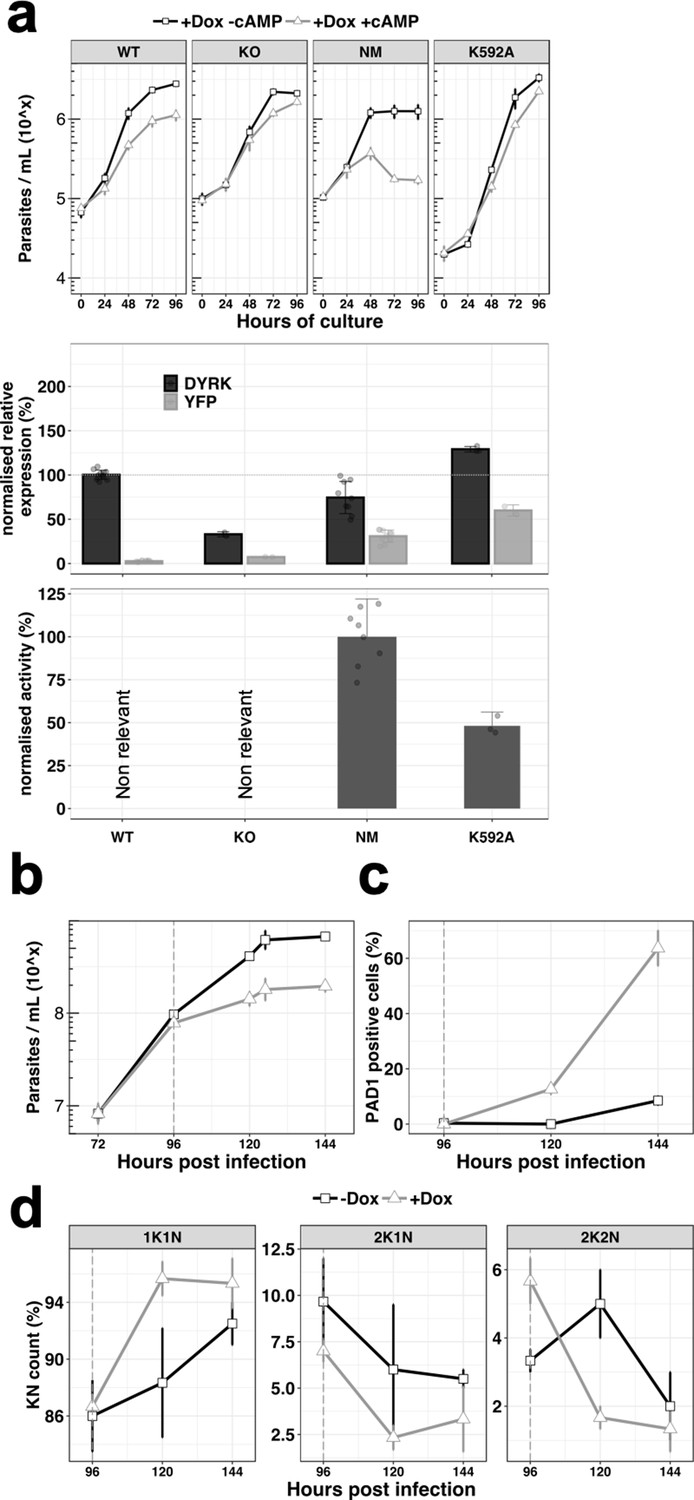
Ectopic expression of the TbDYRK drives stumpy differentiation.
(a) The top panel shows the in vitro phenotype analysis after expression of TbDYRK in different strains treated with doxycycline in the presence (grey) or absence (black) of 8-pCPT-cAMP (n = at least two experiments in three replicates, error bars = SEM). WT = Parental cell line, KO = Knock out cell line for the gene TbDYRK, NM = Ectopic expression of the non-mutated version of TbDYRK, K592A = Ectopic expression of TbDYRK carrying the mutation K592A. The middle panel represents the mRNA level of expression of TbDYRK (in black), including the endogenous and the ectopic gene when present, and of the YFP tag of the ectopic fusion gene (in grey) (n = 1 experiment in three replicates; error bars = SEM; individual datapoints are also presented). The dotted horizontal grey line represents 100% of expression (mean), obtained from the expression of TbDYRK in the WT cell line after 24 hr of incubation with doxycycline and no 8-pCPT-cAMP. Note that background signal by RT-qPCR is retained with the TbDYRK KO cell line; independent northern blotting has confirmed absence of the transcript. The lower panel represents the activity of the purified kinase against the generic substrate Casp9 as measured by radioactive kinase assay. The mean level of activity of different experiments of NM has been set at 100% of activity (n = at least two experiments in three replicates; error bars = SEM; individual datapoints are also presented). Statistical p-values are provided in Supplementary file 5 for the kinase activity and mRNA level expression. (b) Parasitaemia measured in the bloodstream of mice infected (n = 3, error bars = SEM) with the NM strain and treated (+Dox, grey) or not (-Dox, black) after 96 hr post infection. (c) Percentage of PAD1 positive cells in the same blood smears as in panel b. (d) K(inetoplast) N(uclear) scoring from DAPI staining of blood smears of the mice infected as previously described. n = 250 cells, error bars = SEM.
Figure 2—figure supplement 1
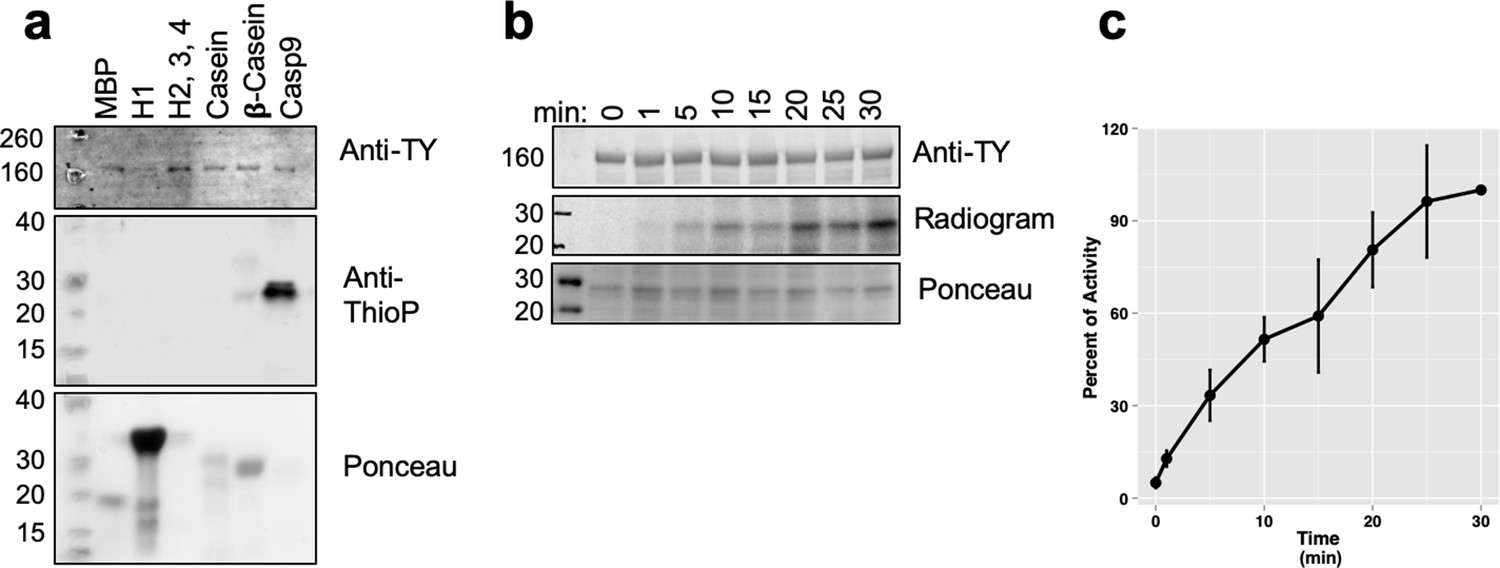
Kinase activity assays for TbDYRK.
(a) In vitro ‘cold’ kinase assay using the indicated proteins as potential generic substrates of the active kinase NM purified from insect cells. The kinase assay was revealed by western blotting using the antibody anti-TY (revealing the loading of the kinase), the antibody anti-thiophosphate (anti-ThioP, revealing the phosphorylated substrates) and the ponceau staining to reveal the loading of the substrates. (b) Kinetic analysis of the phosphorylation of the generic substrate Casp9 revealed by hot kinase assay. The radiogram presented in B is representative of three independent experiments. (c) Quantification of the Cherenkov radiation signal of three independent experiments of the kinetic analysis presented in b. error bars = SEM.
Figure 3 with 2 supplements
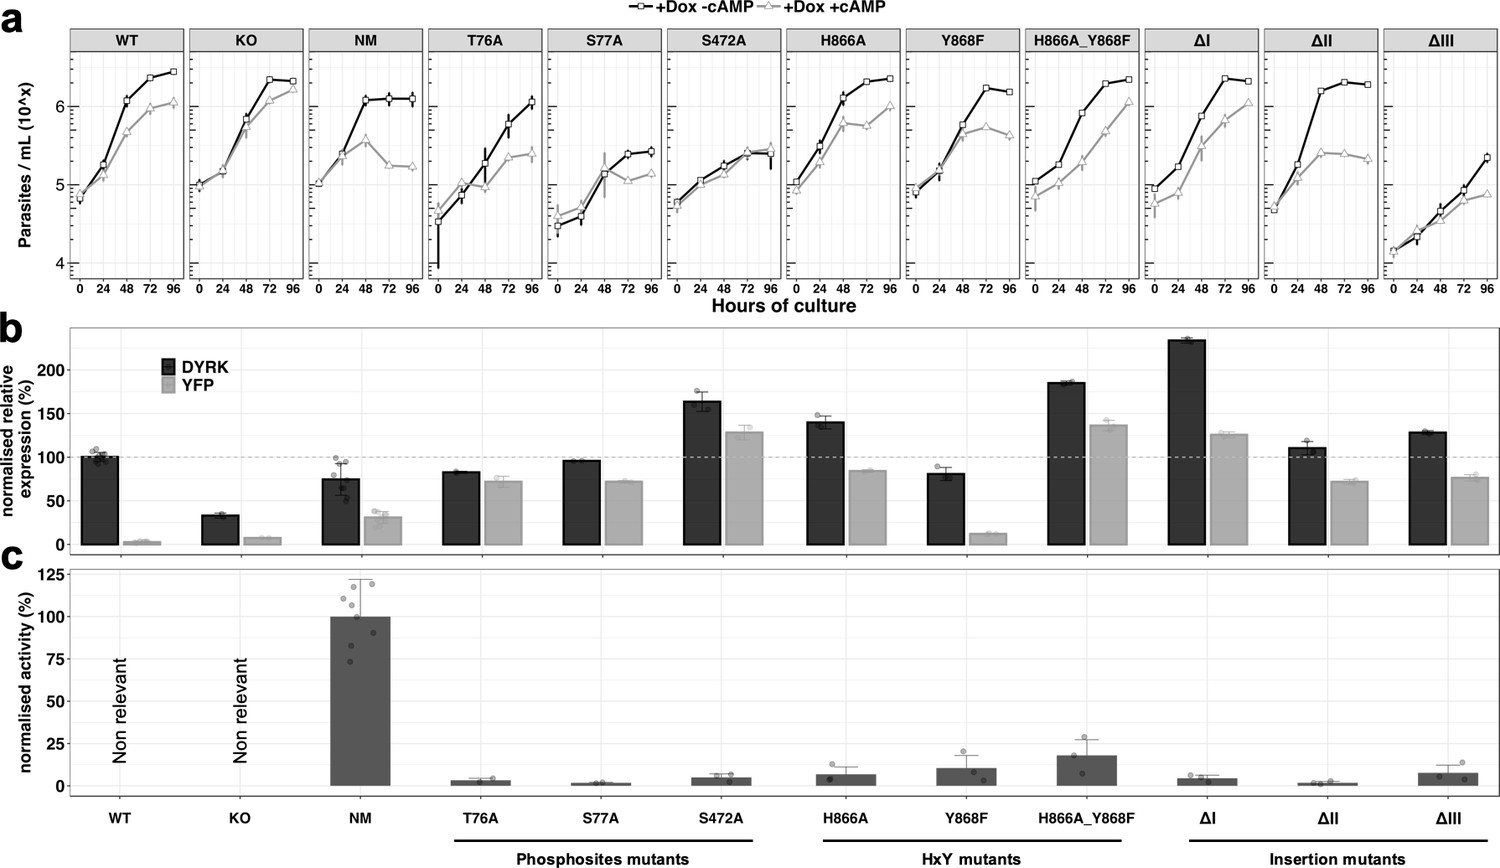
Analysis of the unconventional features of TbDYRK with respect to their phenotype, expression and activity.
(a) In vitro phenotype analysis after expression of TbDYRK mutants treated with doxycycline in the presence (grey) or absence (black) of 8-pCPT-cAMP (n = at least 2 experiments in three replicates; error bars = SD). WT = Parental cell line, KO = Knock out cell line for the gene TbDYRK, NM = Ectopic expression of the non-mutated version of TbDYRK. WT, KO and NM results are the same as presented in Figure 2 and are used here as control; other columns reflect the respective mutants analysed. (b) mRNA level of expression of TbDYRK (in black), including the endogenous and the ectopic gene when present, and of the YFP tag of the ectopic fusion gene (in grey) (n = 1 experiment in three replicates, error bars = SEM). The dotted horizontal grey line represents 100% of expression (mean), obtained from the expression of TbDYRK in the WT cell line after 24 hr of incubation with doxycycline and no 8-pCPT-cAMP. Statistical p-values are provided in Supplementary file 5. (c) Activity of the purified kinase against the generic substrate Casp9 as measured by radioactive kinase assay. The mean level of activity of different experiments of NM has been set at 100% of activity (n = at least 2 experiments in three replicates; error bars = SEM). Statistical p-values are provided in Supplementary file 5.
Figure 3—figure supplement 1
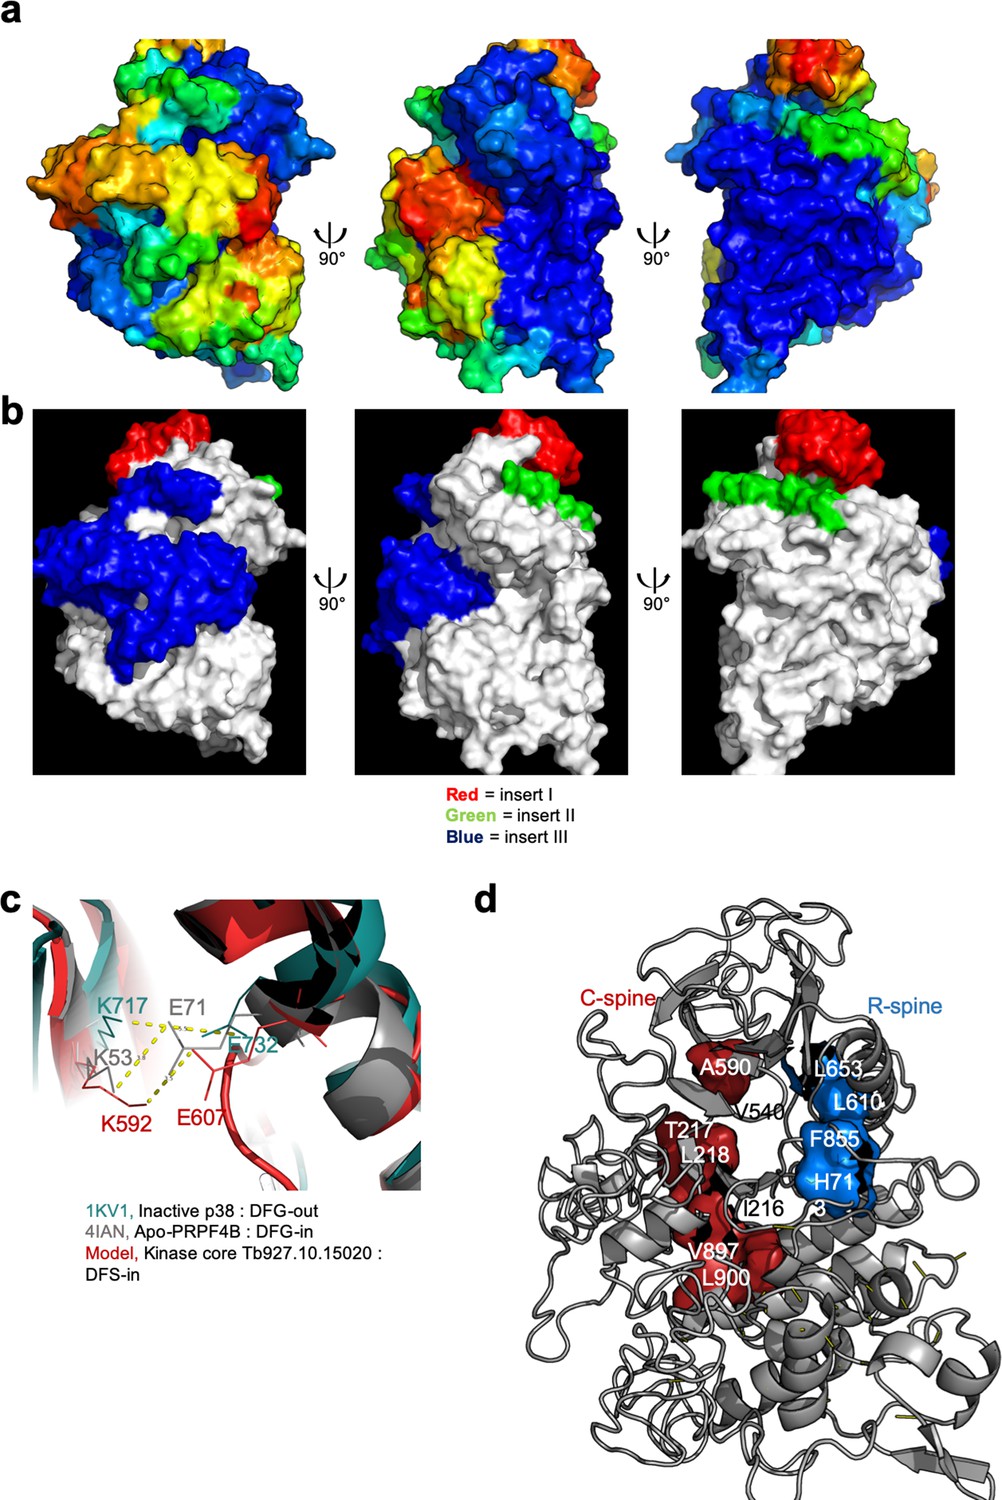
Modelling of the kinase core of TbDYRK.
(a) Visualisation of the b-factor score on the model obtained from the i-TASSER server. Blue = high confidence, red = low confidence. Three views rotated on the y axis by 90° are presented, with the left panel centred on the inserts, the middle panel on the ATP-binding pocket and the right panel on the activation loop. (b) Visualisation of the three inserts on the model obtained from the i-TASSER server. Red = insert I, green = insert II and blue = insert III. Three views are presented, centred and rotated as previously described in a). (c) Superimposition of the model to crystal structures in active conformation (PRPF4-B), and inactive conformation (p38), highlighting the distance between the lysine of the β3 strand of the N-lobe and the glutamic acid of the αC-helix for the close conformation of the ATP binding pocket. (d) Cartoon representation of the kinase core of the model of TbDYRK highlighting the alignment of the non-sequential residues forming the C- and R-spines, as typically observed in active conformations.
Figure 3—figure supplement 2
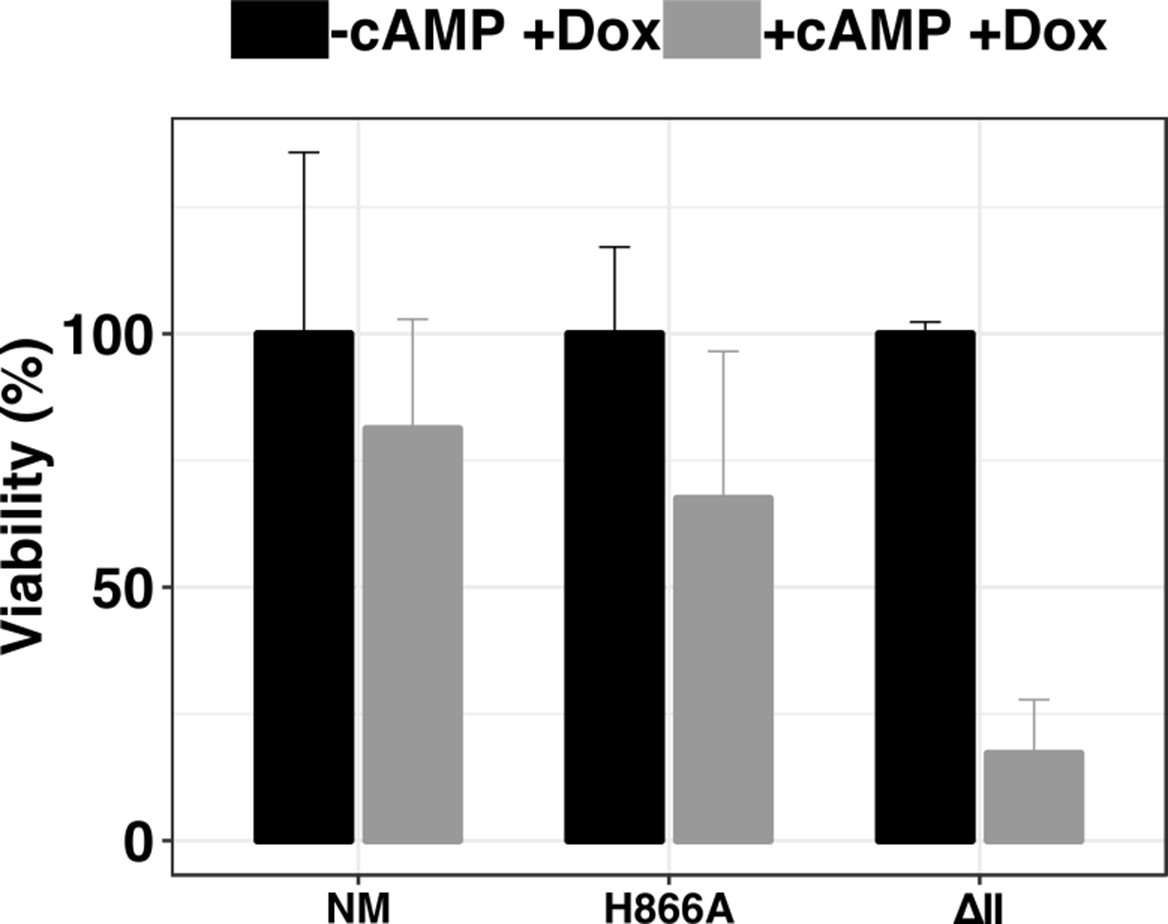
Analysis of cell viability by alamar blue of parasites expressing the ectopic DYRK NM/H866A / ΔII in response to 8-pCPT-cAMP treatment.
Results have been obtained from three independent replicates and normalised by the -8'pCPT-cAMP +Dox condition for each cell line, error bars = SEM.
Figure 4
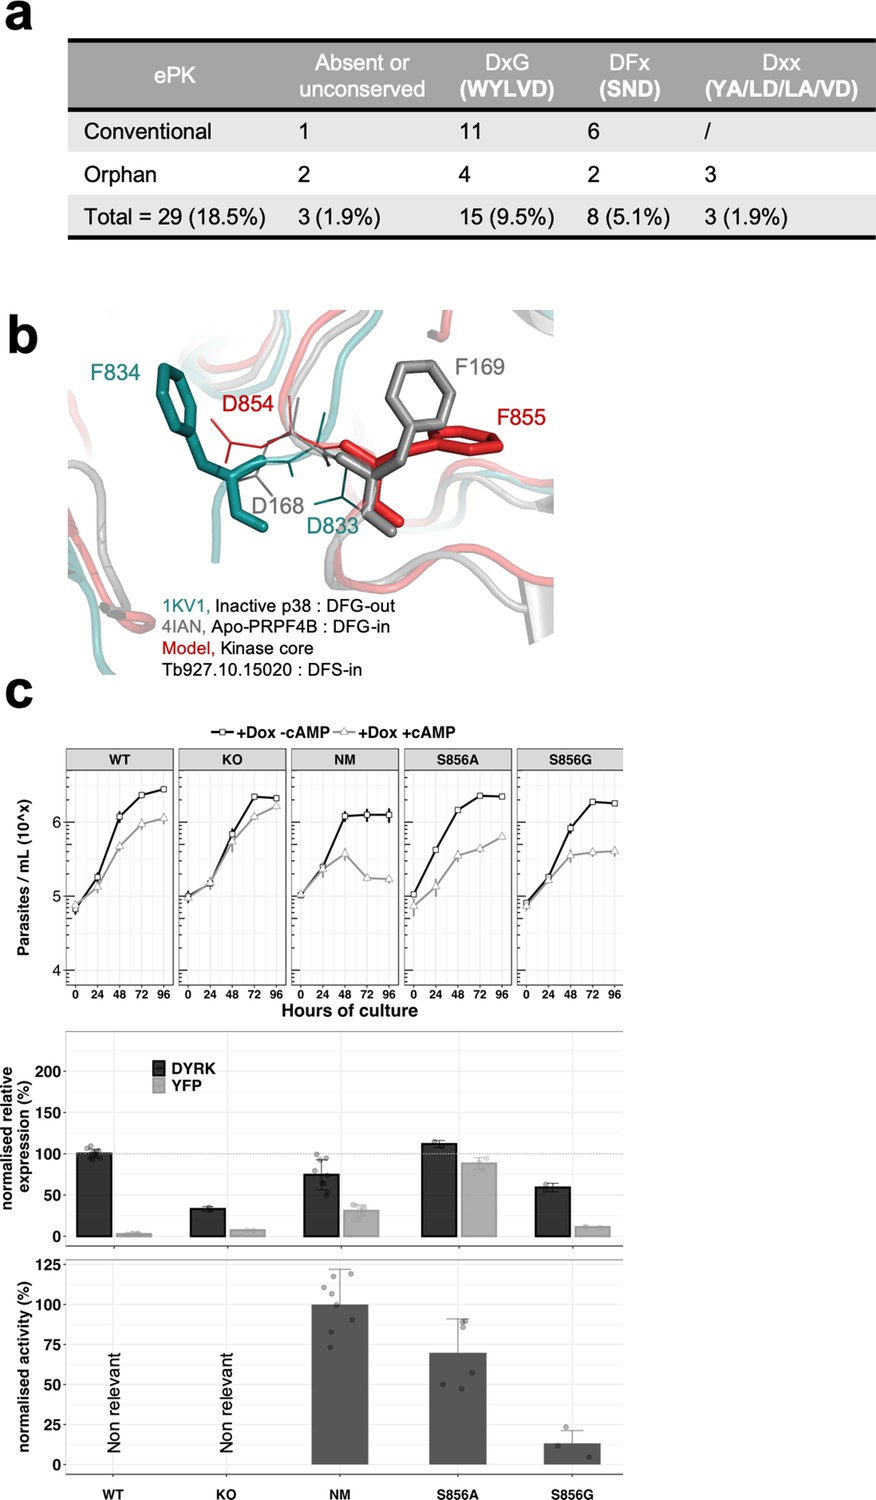
The unconventional DSF motif renders the kinase more rigid and is essential for the activity of the kinase.
(a) Table indicating the unconventional DFG motif in T. brucei ePKs. Conventional = conventional kinases, Orphan = orphan kinases. (b) Model of the TbDYRK kinase core generated by the i-TASSER server, indicating the position ‘DFS-in’ of the DFS motif of the kinase. (c) Structure/function analysis, as presented earlier, of the DFS motif. WT, KO and NM results are the same as presented in Figure 2 and are used here as control. S856A = Ectopic expression of TbDYRK carrying the mutation S856A, S856G = Ectopic expression of TbDYRK carrying the mutation S856G. For the growth curves, n = 3, error bars = SEM; for the mRNA and kinase activity assays, n = 3, error bars = SEM. Statistical p-values are provided in Supplementary file 5 for the kinase activity and mRNA level expression.
Figure 5 with 2 supplements
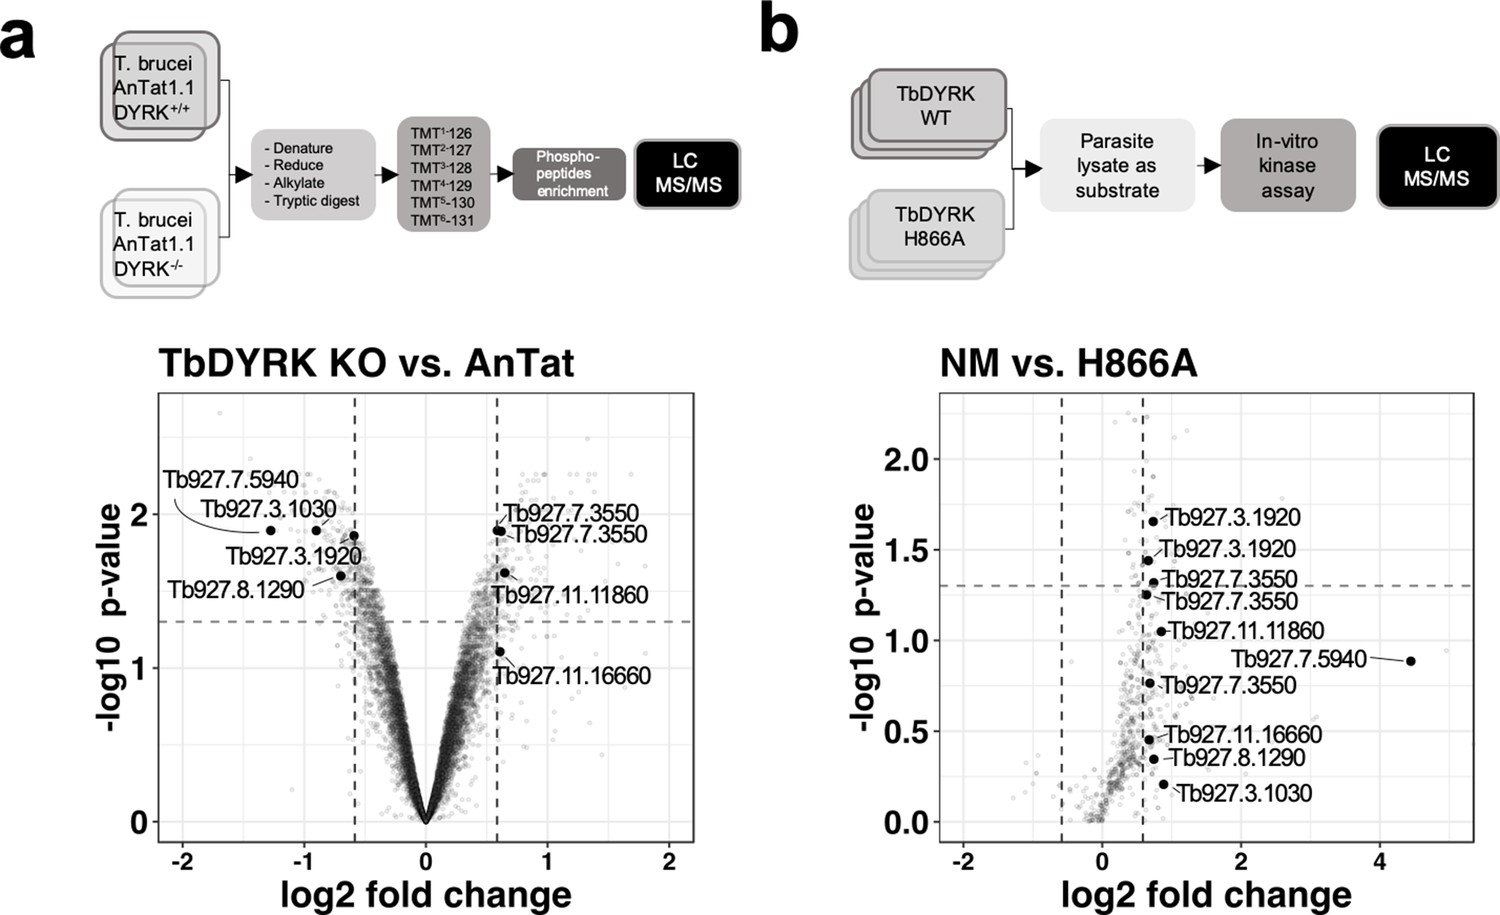
Phosphoproteomic analysis for the identification of substrates of TbDYRK.
(a) Quantitative phosphoproteomic analysis by TMT isobaric tagging comparing the proteome of WT cells (T. brucei AnTat1.1 DYRK+/+) or cells deleted for TbDYRK (DYRK-/-). Top panel: flow chart. Lower panel: Volcano plot of the phosphopeptides with the log2 of the fold change (FC) on the x-axis and the -log10 of the p-value on the y-axis. Vertical dotted lines indicate a |FC| > 1.5 and the horizontal dotted line a p-value<0.05. (b) Quantitative phosphoproteomic analysis comparing the phosphoproteins of cell lysates incubated with the purified active kinase (NM) or inactive (H866A). Top panel: flow chart. Lower panel: Volcano plot of the phosphopeptides with the log2 of the fold change (FC) on the x-axis and the -log10 of the p-value on the y-axis. Vertical dotted lines indicate a |FC| > 1.5 and the horizontal dotted line a p-value<0.05. Common peptides in both analyses, presenting a differential phosphorylation >1.5 times disregarding the sense of regulation, are highlighted in both volcano plots.
Figure 5—figure supplement 1
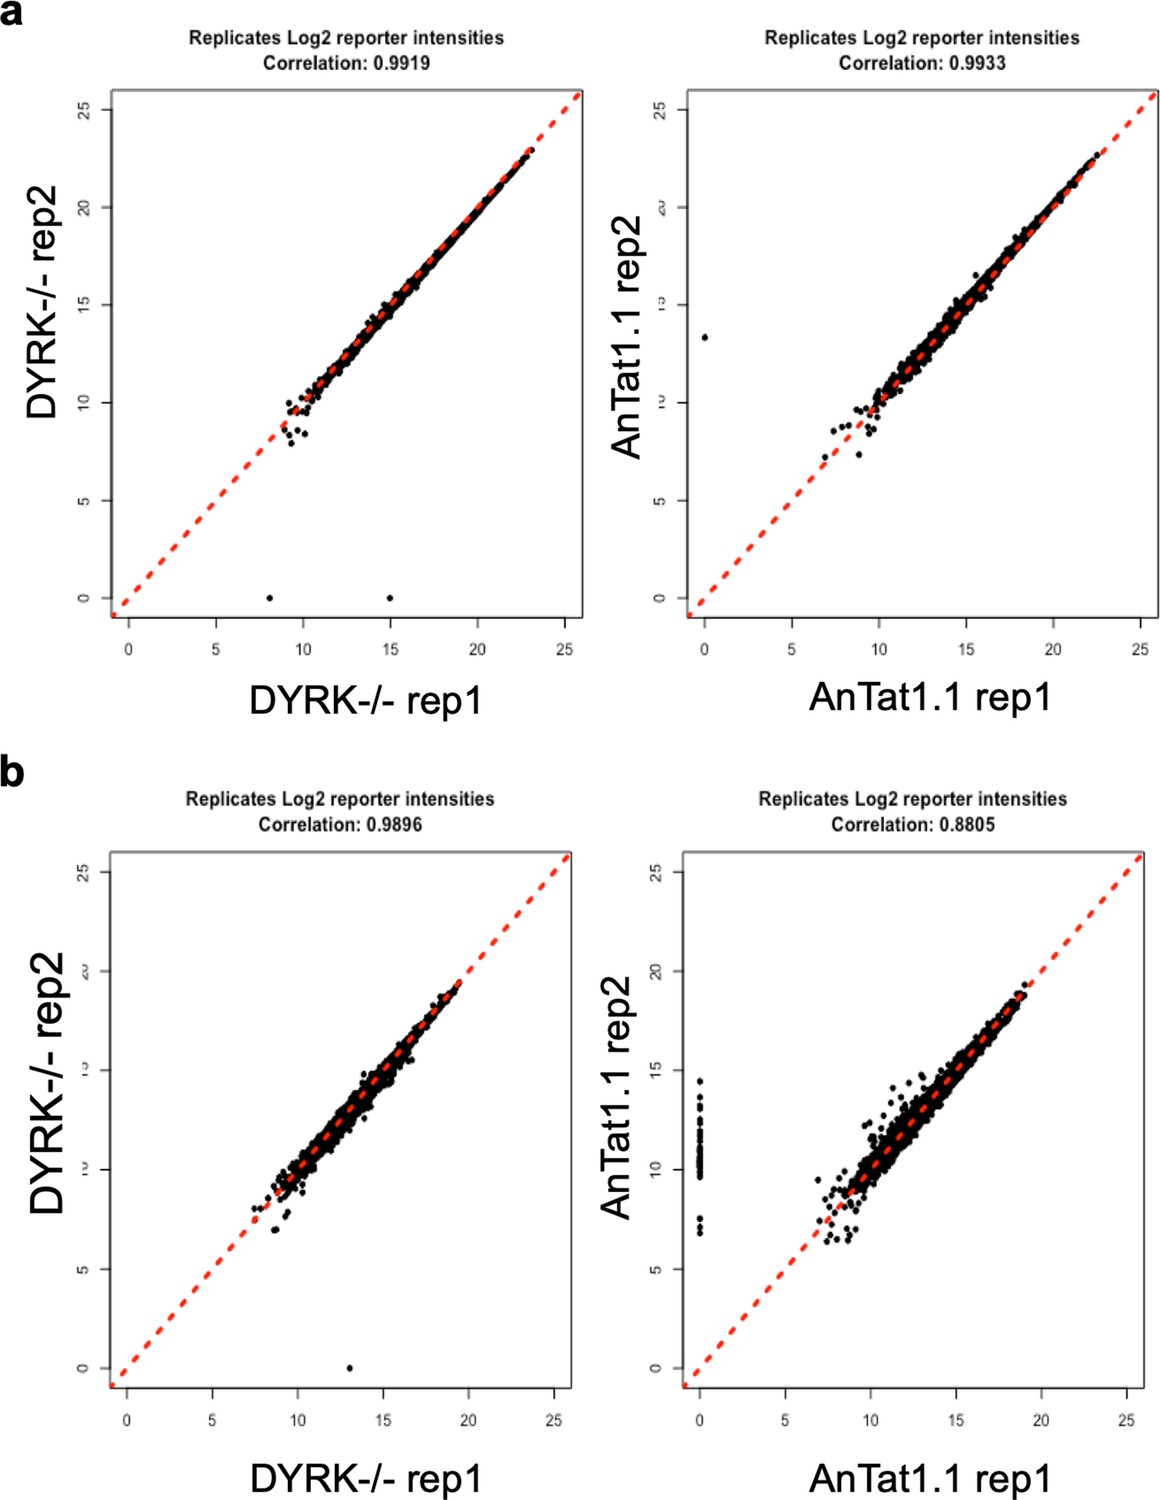
Correlation plots between replicates of the phosphoproteomic analysis comparing DYRK-/-cells to WT AnTat1.1 cells.
(a), Correlation plots of proteins, (b), Correlation plots of phosphopeptides.
Figure 5—figure supplement 2
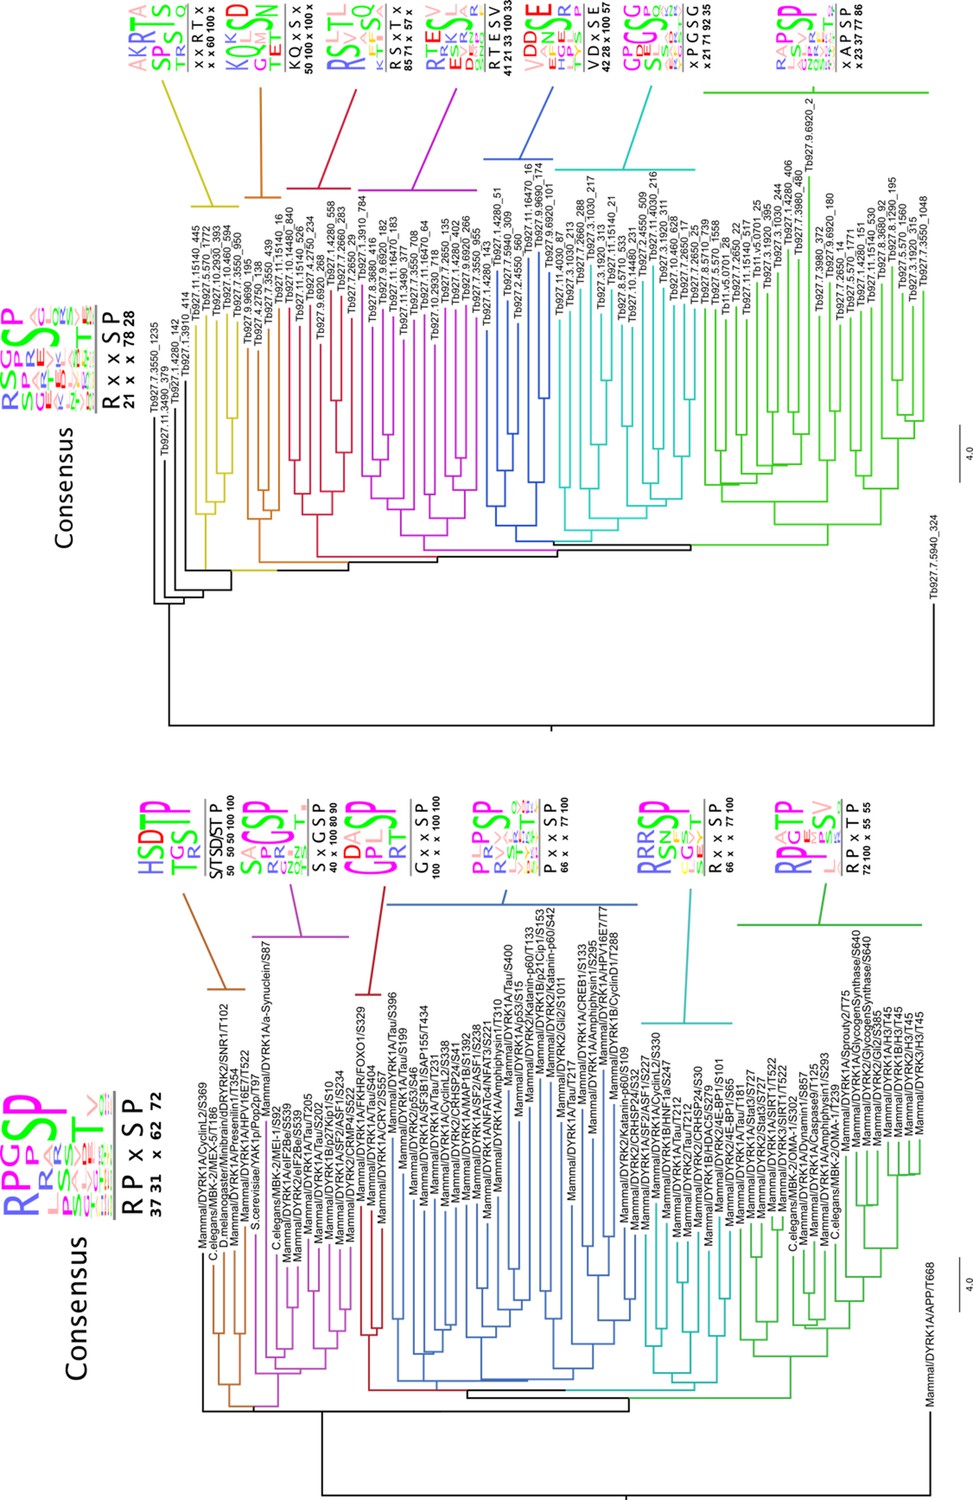
Substrate motif identification.
Substrates from both analysis: NMvsH866A (right panel) and WT vs. KO (left panel) with |FC| > 1.5. Trees generated by neighbour joining using BLOSUM62, consensus filtered for 20% appearance of the residue. Numbers below consensus motifs represent percentage of appearance of the corresponding residue.
Figure 6 with 9 supplements
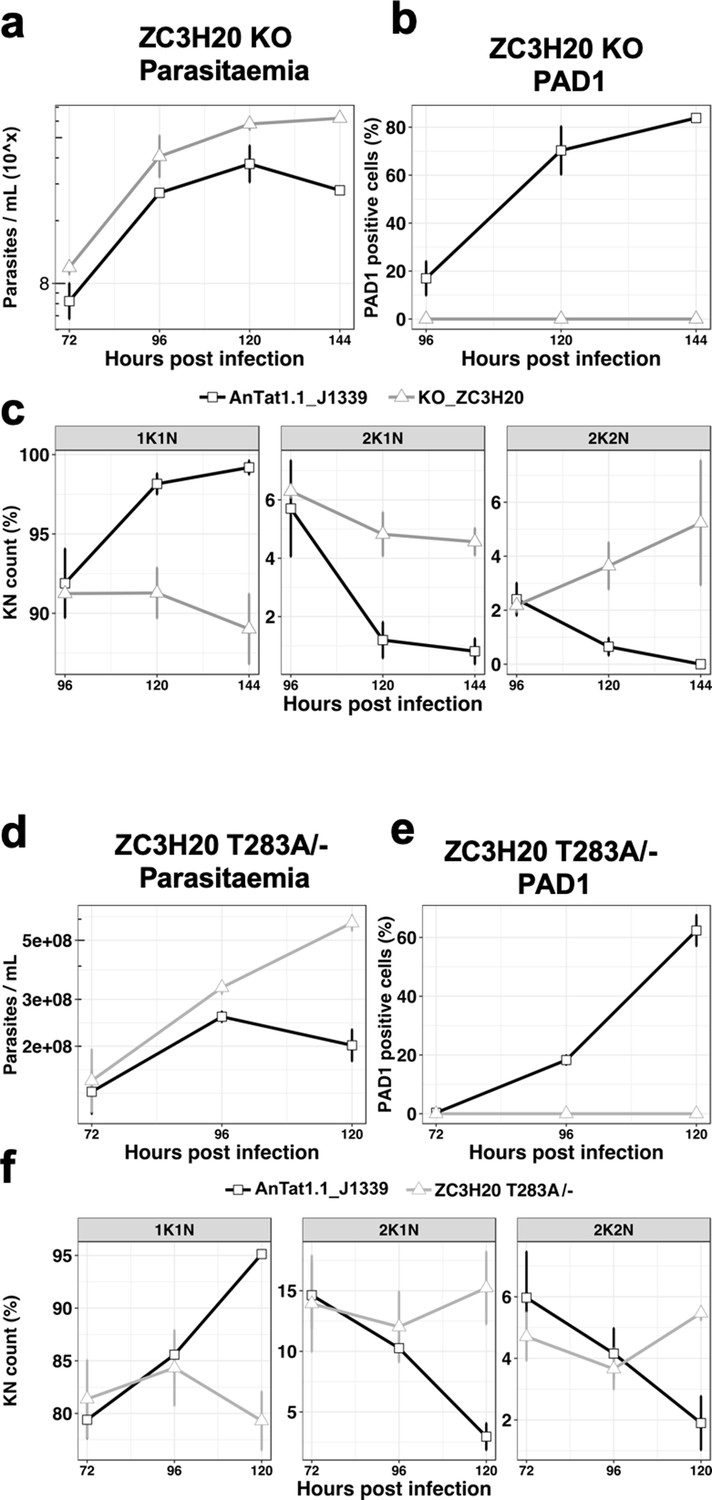
The TbDYRK substrate TbZC3H20 is implicated in the slender to stumpy differentiation.
(a) Parasitaemia of the TbZC3H20 gene KO line (KO_ZC3H20) compared to the parental cell line (AnTat1.1_J1339), n = 3, error bars = SEM. (b) Percentage of PAD1 positives cells of the TbZC3H20 gene KO line (KO_ ZC3H20) compared to the parental cell line (AnTat1.1_ J1339) on different days of in vivo infection, n = 3, error bars = SEM. (c) Percentage of 1K1N, 2K1N and 2K2N cells on different days of in vivo infection. n = 3, error bars = SEM. (d) Parasitaemia of the TbZC3H20 T283A /- line compared to the parental cell line (AnTat1.1_ J1339), n = 3, error bars = SEM. (e) Percentage of PAD1 positive cells of the TbZC3H20 T283A /- line compared to the parental cell line (AnTat1.1_ J1339), n = 3, error bars = SEM. (f) Percentage of 1K1N, 2K1N and 2K2N cells of the TbZC3H20 T283A /- line compared to the parental cell line (AnTat1.1_ J1339) on different days of in vivo infection, n = 3, error bars = SEM.
Figure 6—figure supplement 1
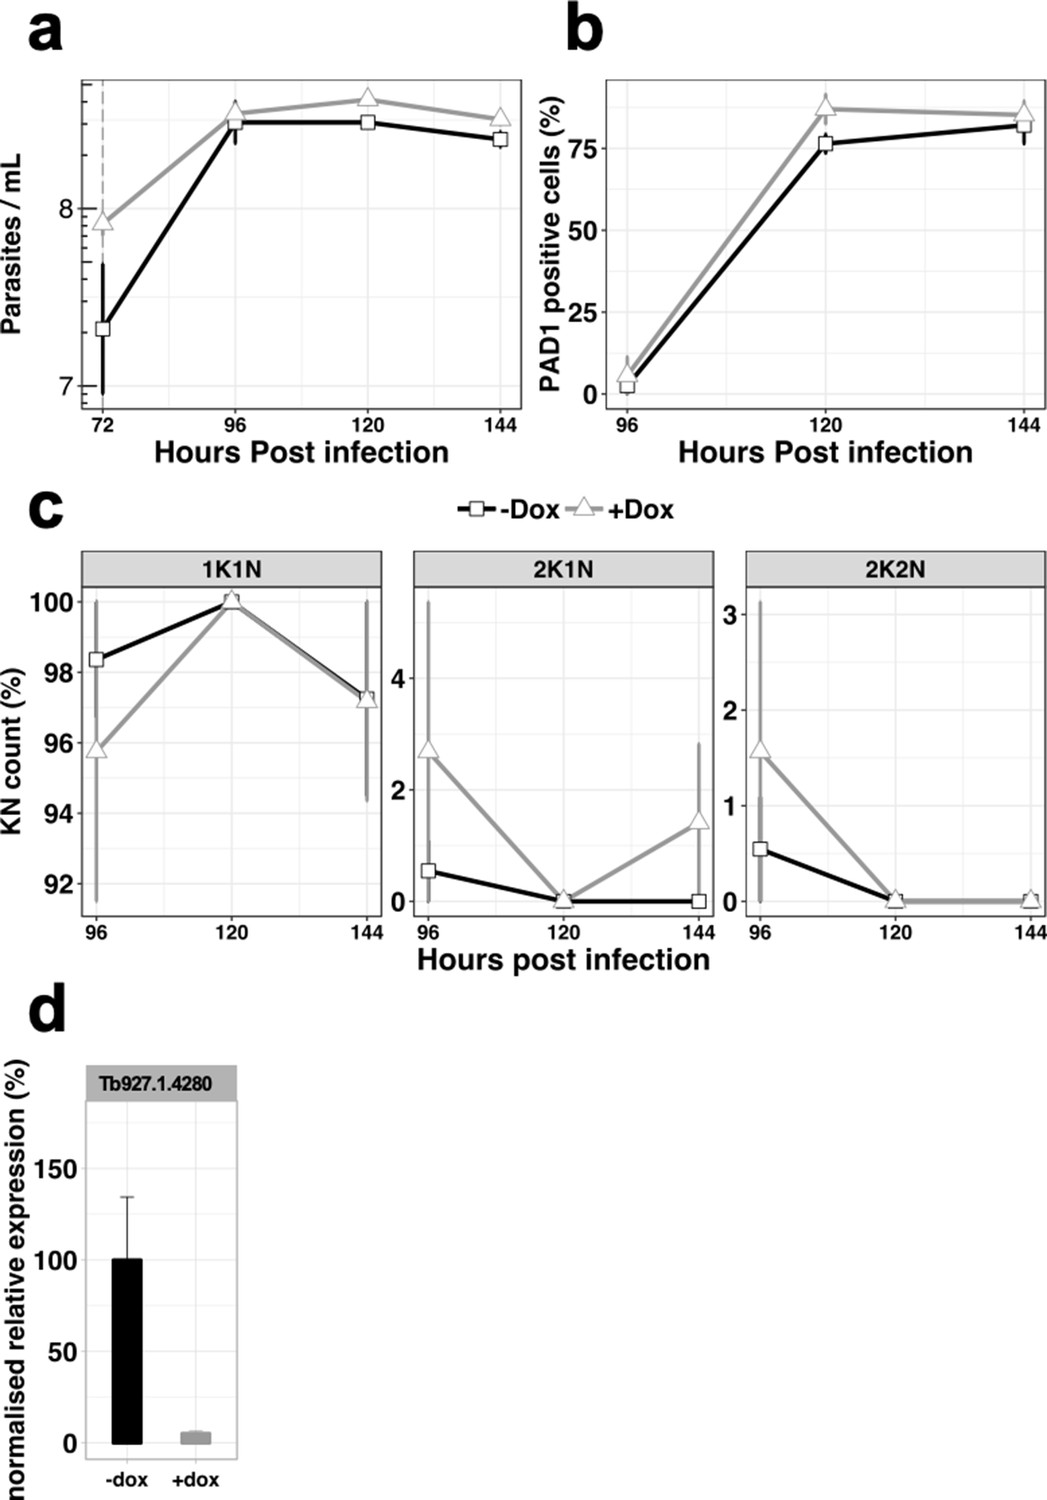
In vivo phenotypic analysis of the RNAi knocked-down cell line for Tb927.1.4280, uninduced (-dox, black line) or induced with doxycycline at 72 hr post infection (+dox, grey line).
(a) Parasitaemia, (b) Percentage of PAD1 positives cells, (c), Percentage of KN count, (d), RT-qPCR determining the relative expression of the gene of interested. n = 3, error bars = SEM.
Figure 6—figure supplement 2
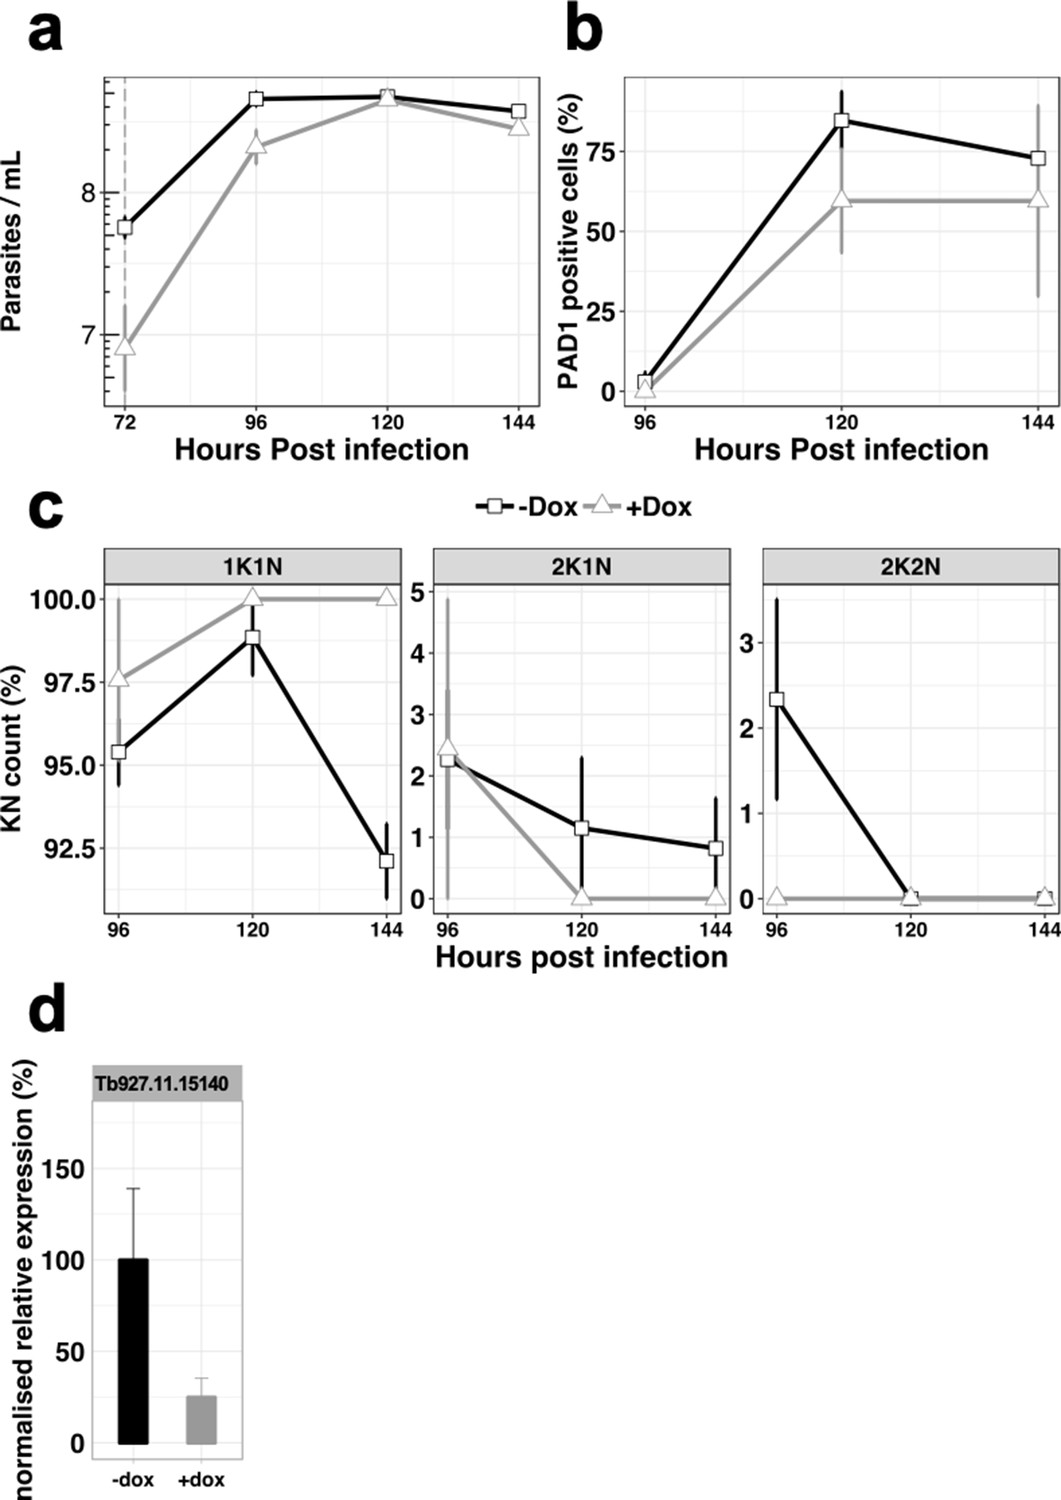
In vivo phenotypic analysis of the knocked-down cell line for Tb927.11.15140, uninduced (-dox, black line) or induced with doxycycline at 72 hr post infection (+dox, grey line).
(a), Parasitaemia, (b), Percentage of PAD1 positives cells, (c), Percentage of KN count, (d), RT-qPCR determining the relative expression of the gene of interested. n = 3 error bars = SEM.
Figure 6—figure supplement 3
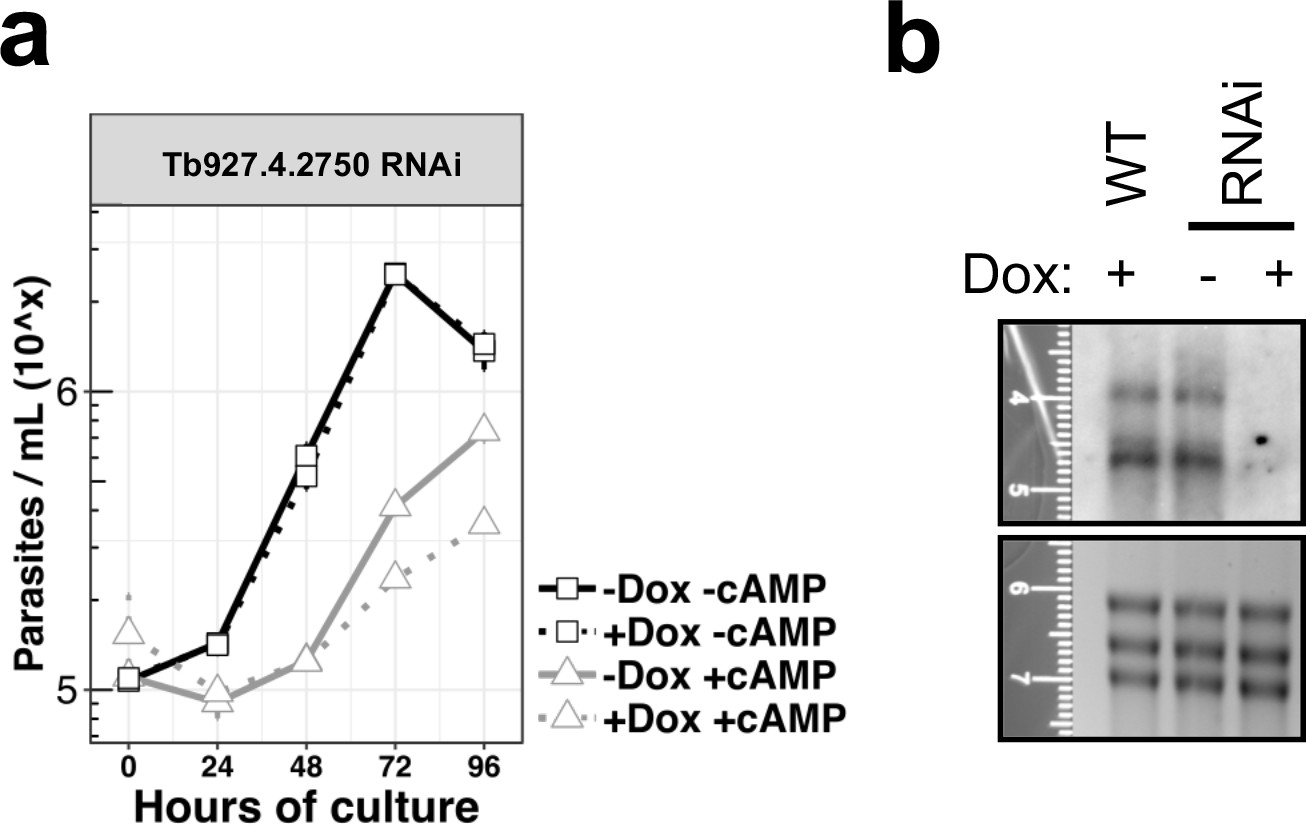
In vitro phenotypic analysis of the knocked-down cell line for gene Tb927.4.2750, uninduced (-dox) or induced with doxycycline (+dox), and treated or not with the cell permeable 8'-pCPT-cAMP.
(a), Growth curves, n = 3 error bars = SEM; (b), Northern blot analysis representative of the three replicates probing the gene Tb927.4.2750 in WT cells or in the knock-down cell line (RNAi) induced or not with doxycycline.
Figure 6—figure supplement 4
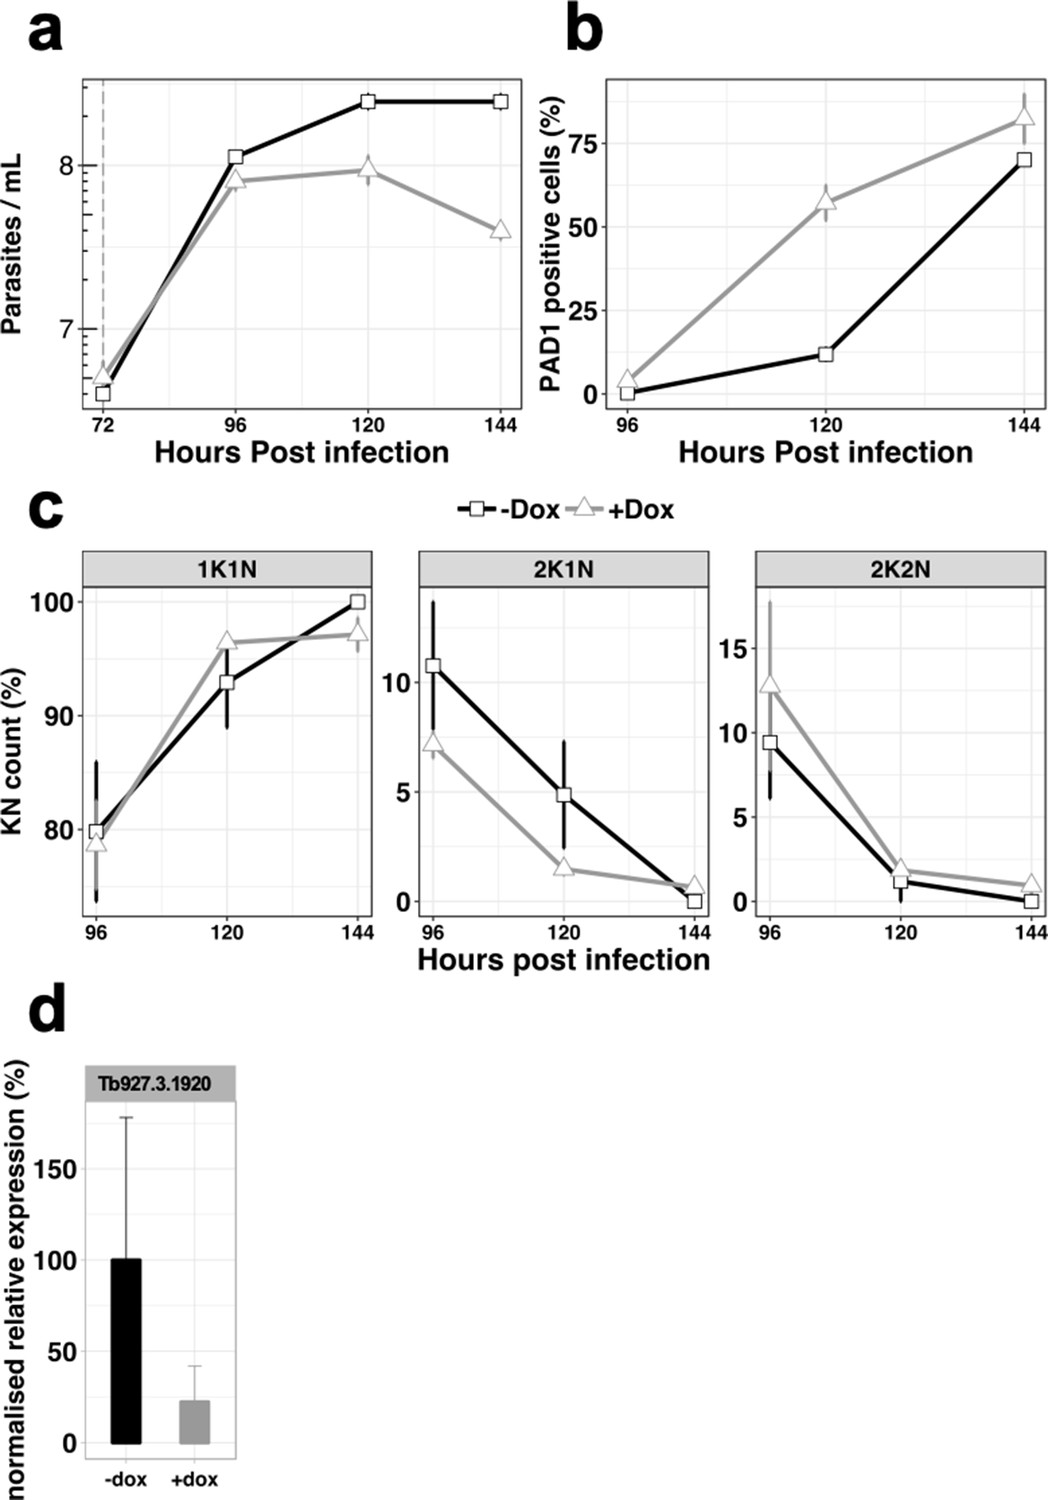
In vivo phenotypic analysis of the knocked-down cell line for gene Tb927.3.1920, uninduced (-dox, black line) or induced with doxycycline at 72 hr post-infection (+dox, grey line).
(a), Parasitaemia, n = 3, error bars = SEM; (b), Percentage of PAD1 positive cells, n = 3, error bars = SEM; (c), Percentage of KN count, n = 3 error bars = SEM; (d), RT-qPCR determining the relative expression of the gene of interested. n = 3, error bars = SEM.
Figure 6—figure supplement 5
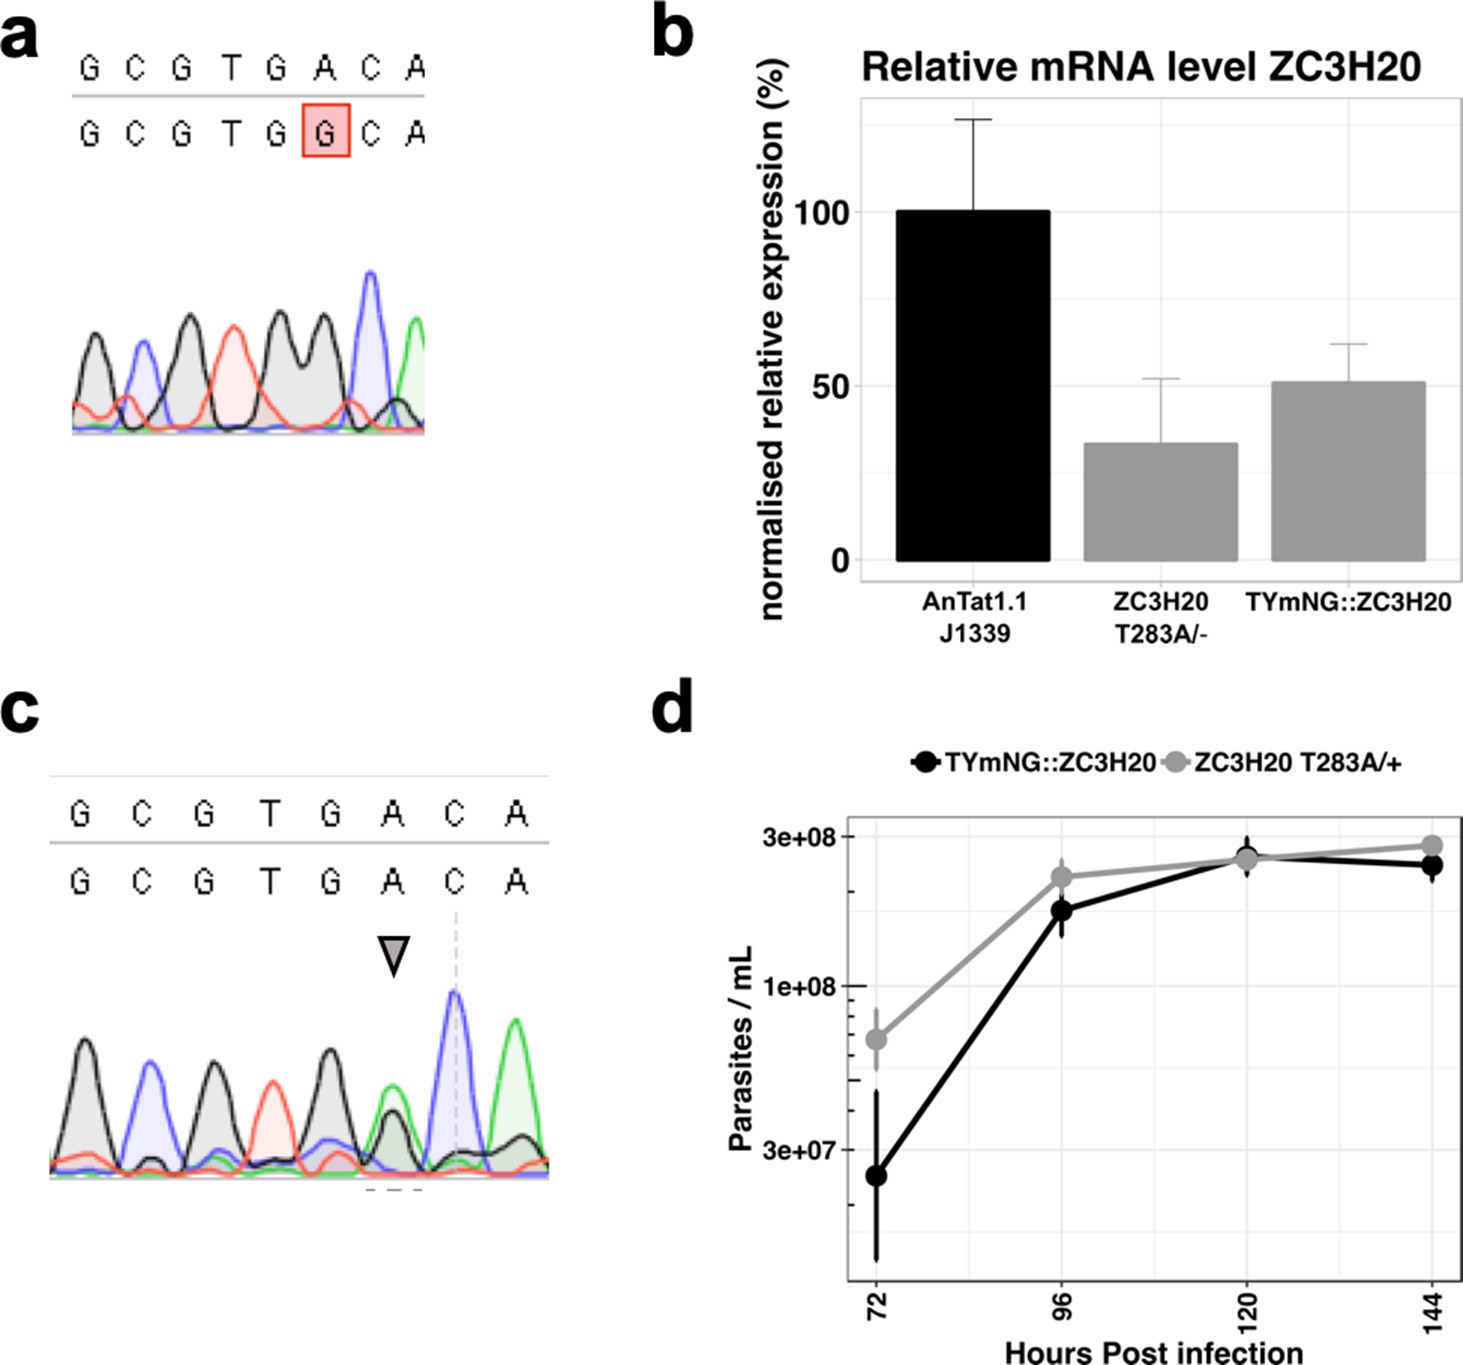
Endogenous mutation TbZC3H20 T283A.
(a) Sequencing results of the gene Tb927.7.2660 coding for the protein TbZC3H20 presenting the single allele mutation A to G generating the T283A. (b) RT-qPCR analysis revealing the mRNA expression level of TbZC3H20 in the single allele TbZC3H20 T283A/- compared to the parental cell line and a line with a single allele of TbZC3H20 replaced by mNeon Green (TYmNG::ZC3H20). n = 3 error bars = SEM. (c) Sequencing results of the gene Tb927.7.2660 coding for the protein TbZC3H20 presenting both the single allele mutation A to G generating the T283A and the endogenous WT allele (arrow head). (d) In vivo parasitaemia of cell line TbZC3H20 T283A/+ (grey line) compared to the parental cell line WT (black line). n = 3 error bars = SEM.
Figure 6—figure supplement 6
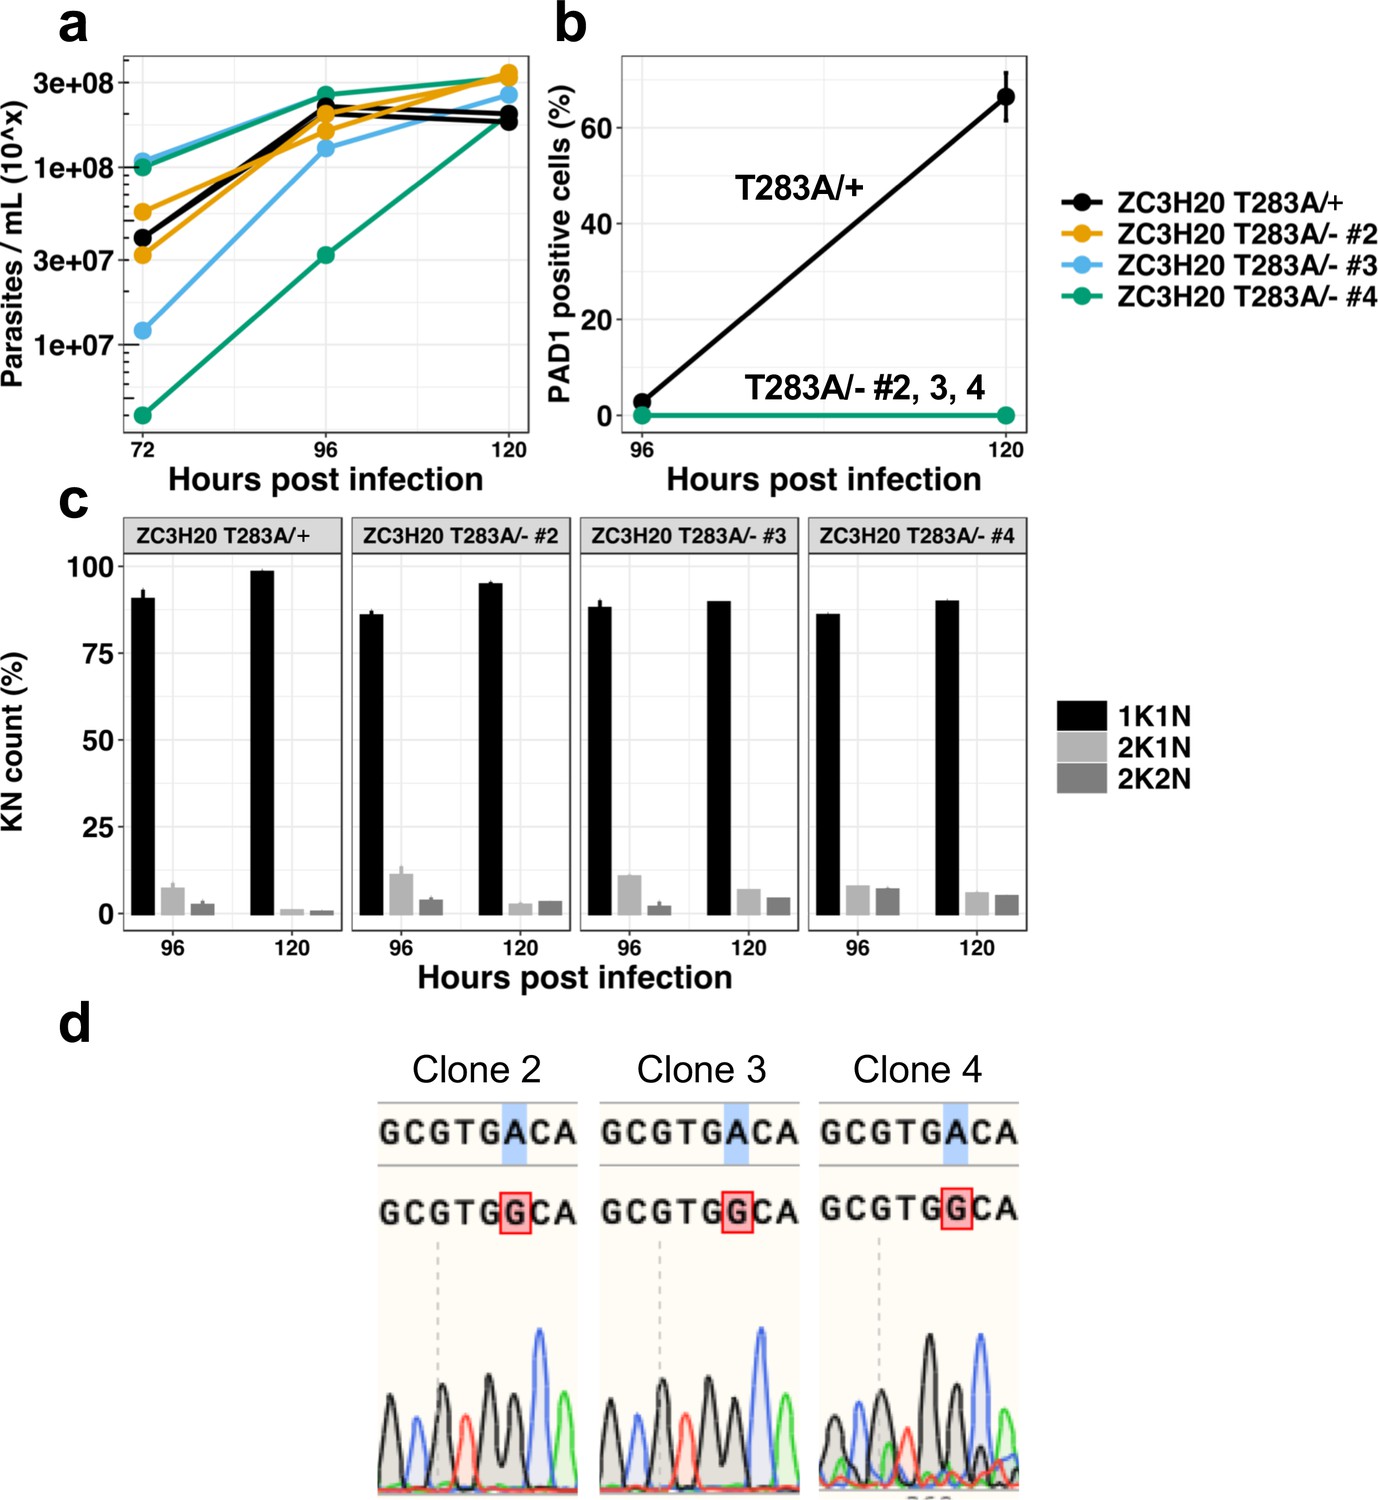
In vivo phenotypic analysis of three additional clones of the cell line TbZC3H20T283A/- confirms the differentiation resistant phenotype as presented in Figure 6.
Parental cell line TbZC3H20T283A/+ (black line), TbZC3H20T283A/- clones 2 (yellow line), 3 (blue line) and 4 (green line). (a) Parasitaemia, n = 2, error bars = SEM; (b) Percentage of PAD1 positive cells, n = 2, error bars = SEM, cells counted >100 per samples; (c) Percentage of KN count, n = 3 error bars = SEM, cells counted >100 per samples, black: 1K1N, light grey: 2K1N, dark grey: 2K2N; (d) Sequencing results of the gene Tb927.7.2660 coding for the protein TbZC3H20 presenting the single allele mutation A to G generating the T283A for the three different clones.
Figure 6—figure supplement 7
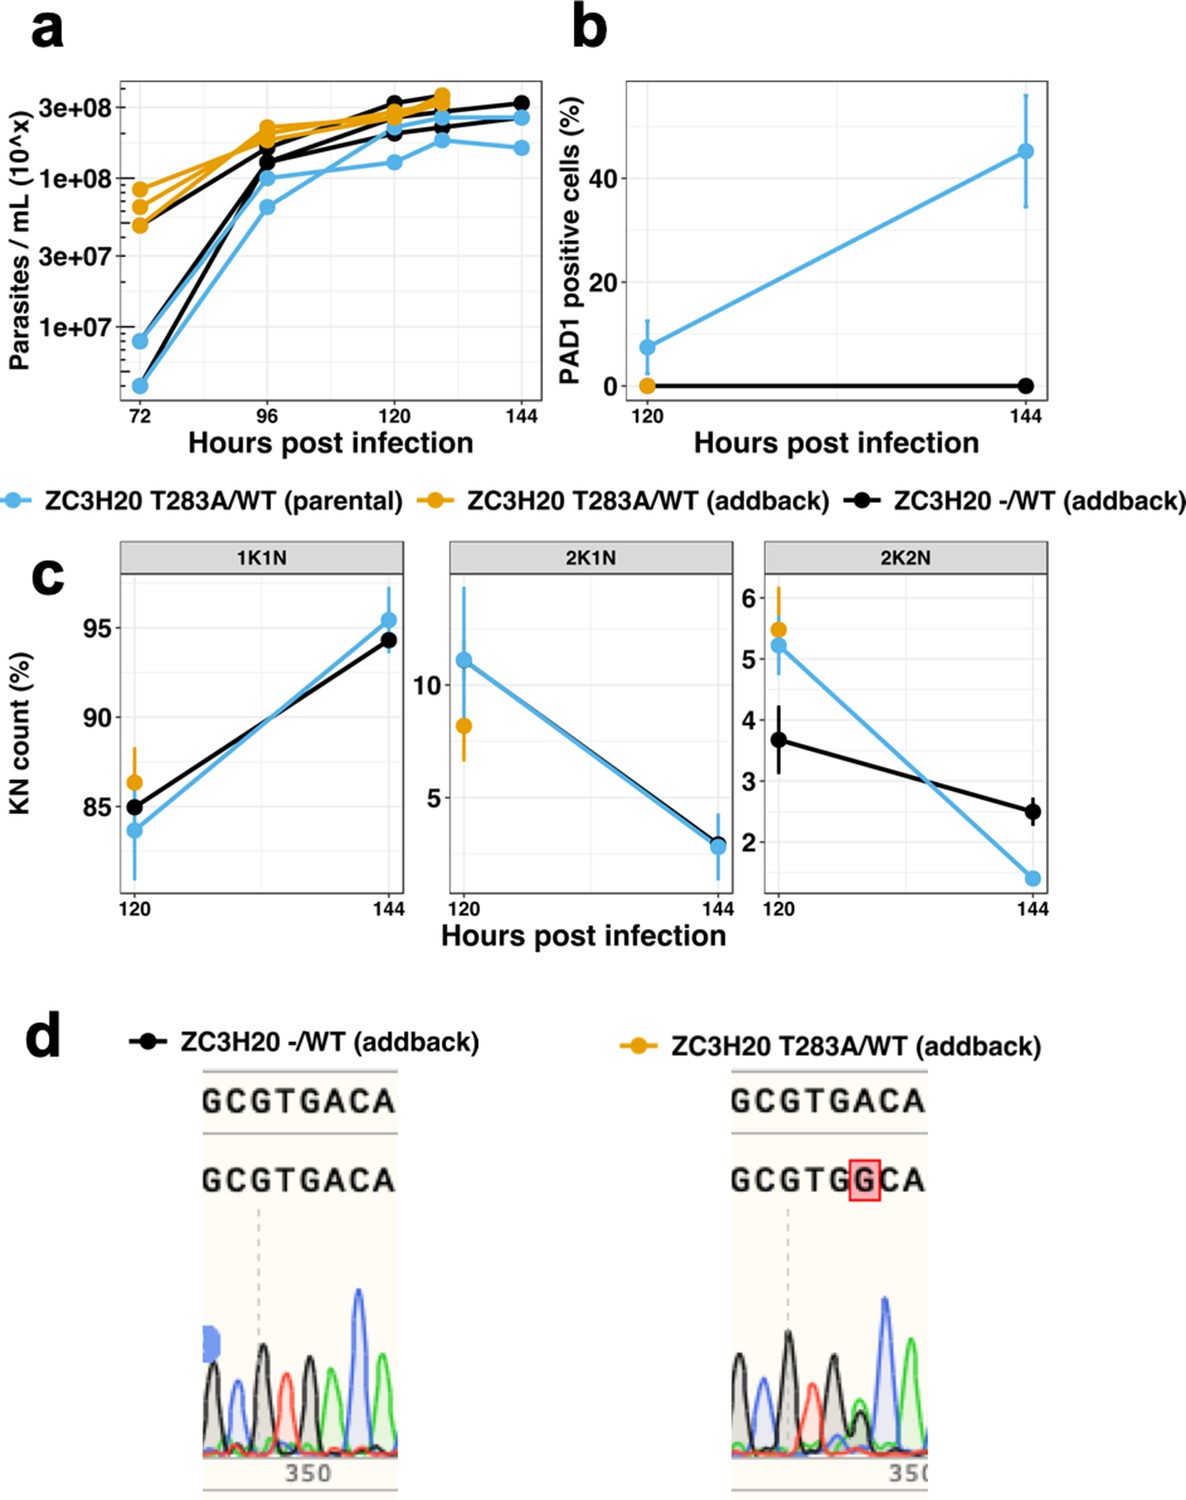
Add-back of a WT copy of TbZC3H20 in the TbZC3H20T283A/- strain in the endogenous context under control of the 3’UTR partially rescues the WT phenotype.
Control cell line TbZC3H20T283A/WT (parental) (blue), TbZC3H20T283A/WT (addback) cell line (yellow) and TbZC3H20-/WT (addback) line (black). (a) Parasitaemia, n = 3 (addback) and n = 2 (control), error bars = SEM; (b) Percentage of PAD1 positive cells at 120 hr post infection, n = 3 (addback) and n = 2 (control), error bars = SEM, cells counted >100 per samples; (c), Percentage of KN count at 120 hr post infection, n = 3 (addback) and n = 2 (control) error bars = SEM, cells counted >100 per samples; (d) Sequencing results of the gene Tb927.7.2660 coding for the protein TbZC3H20 presenting the single allele WT copy in the TbZC3H20-/WT (addback) cell line and both the WT and mutation A to G generating the T283A in the TbZC3H20T283A/WT (addback) cell line.
Figure 6—figure supplement 8
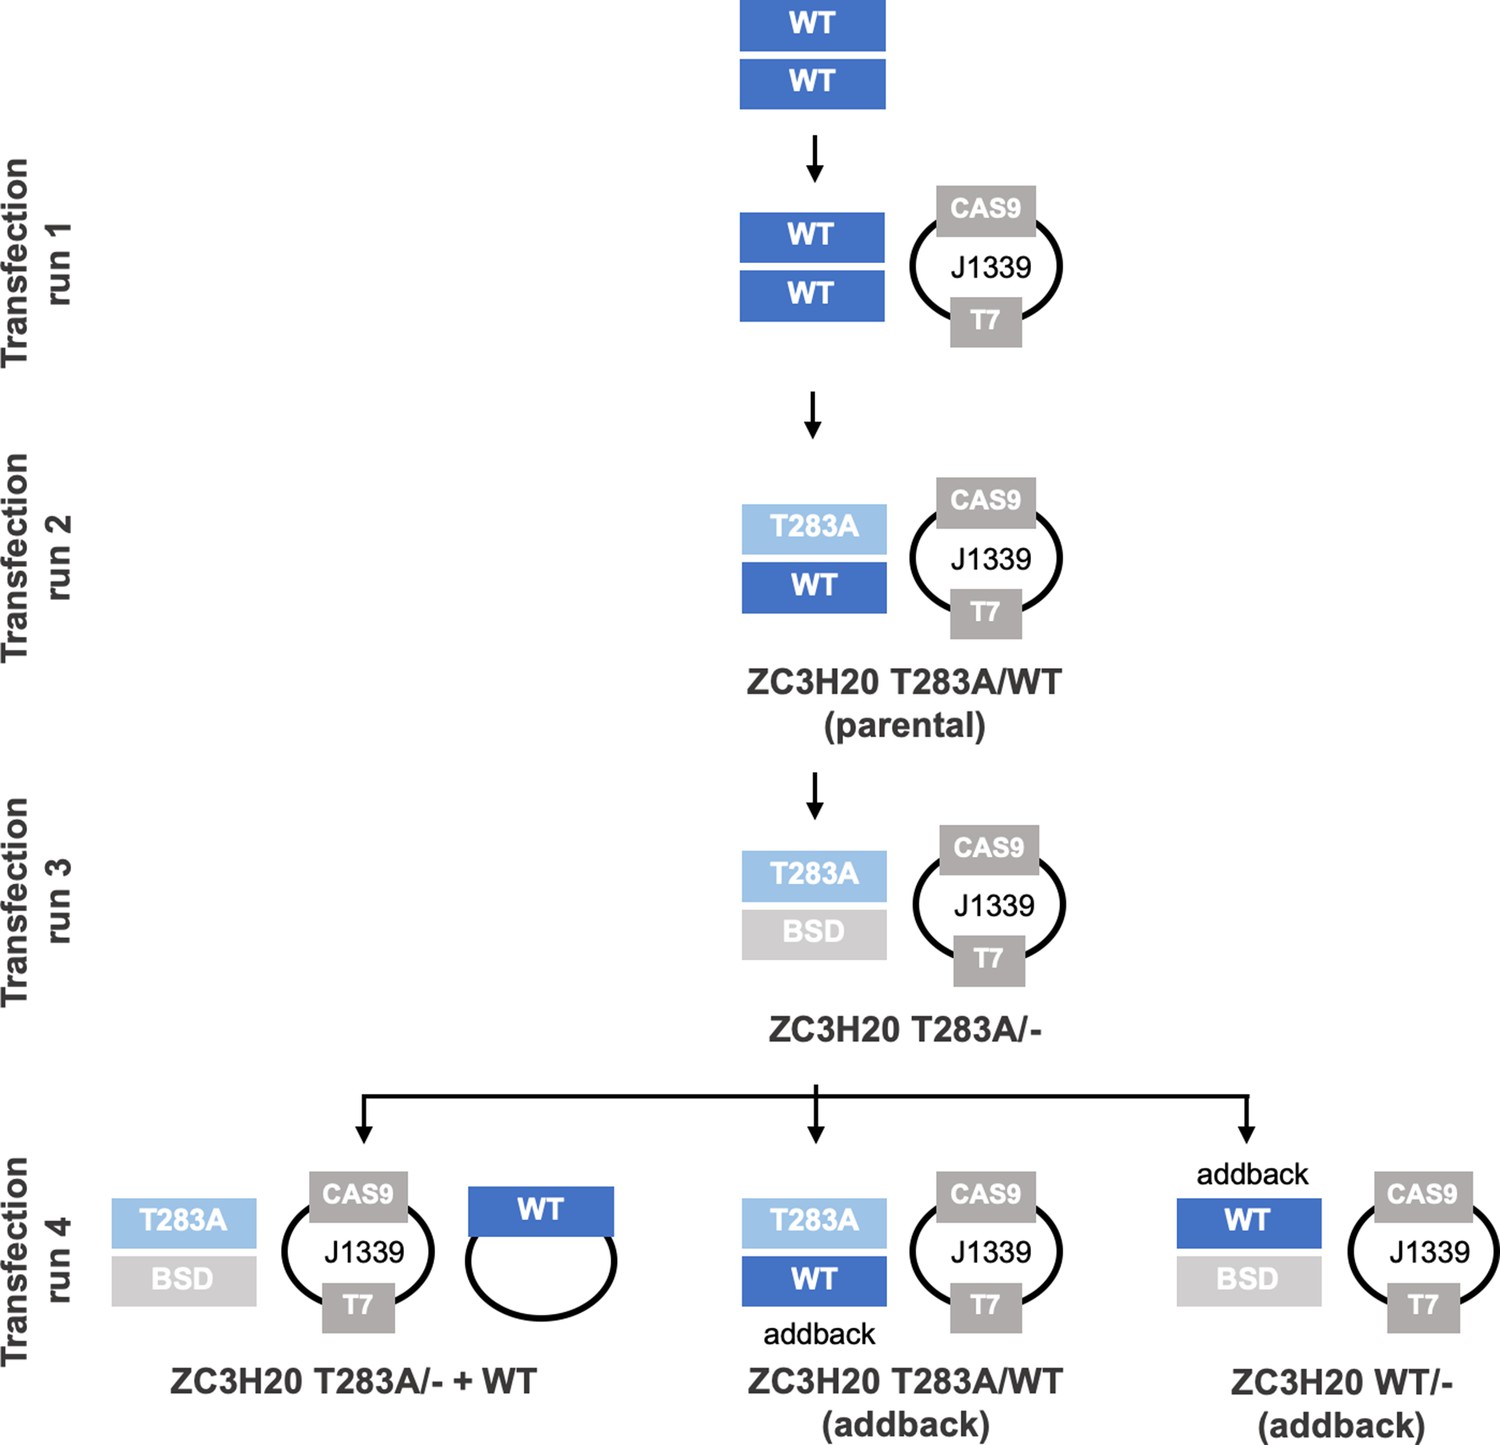
Schematic representation of the genetic background of the different cell lines generated and their corresponding number of transfections.
Figure 6—figure supplement 9
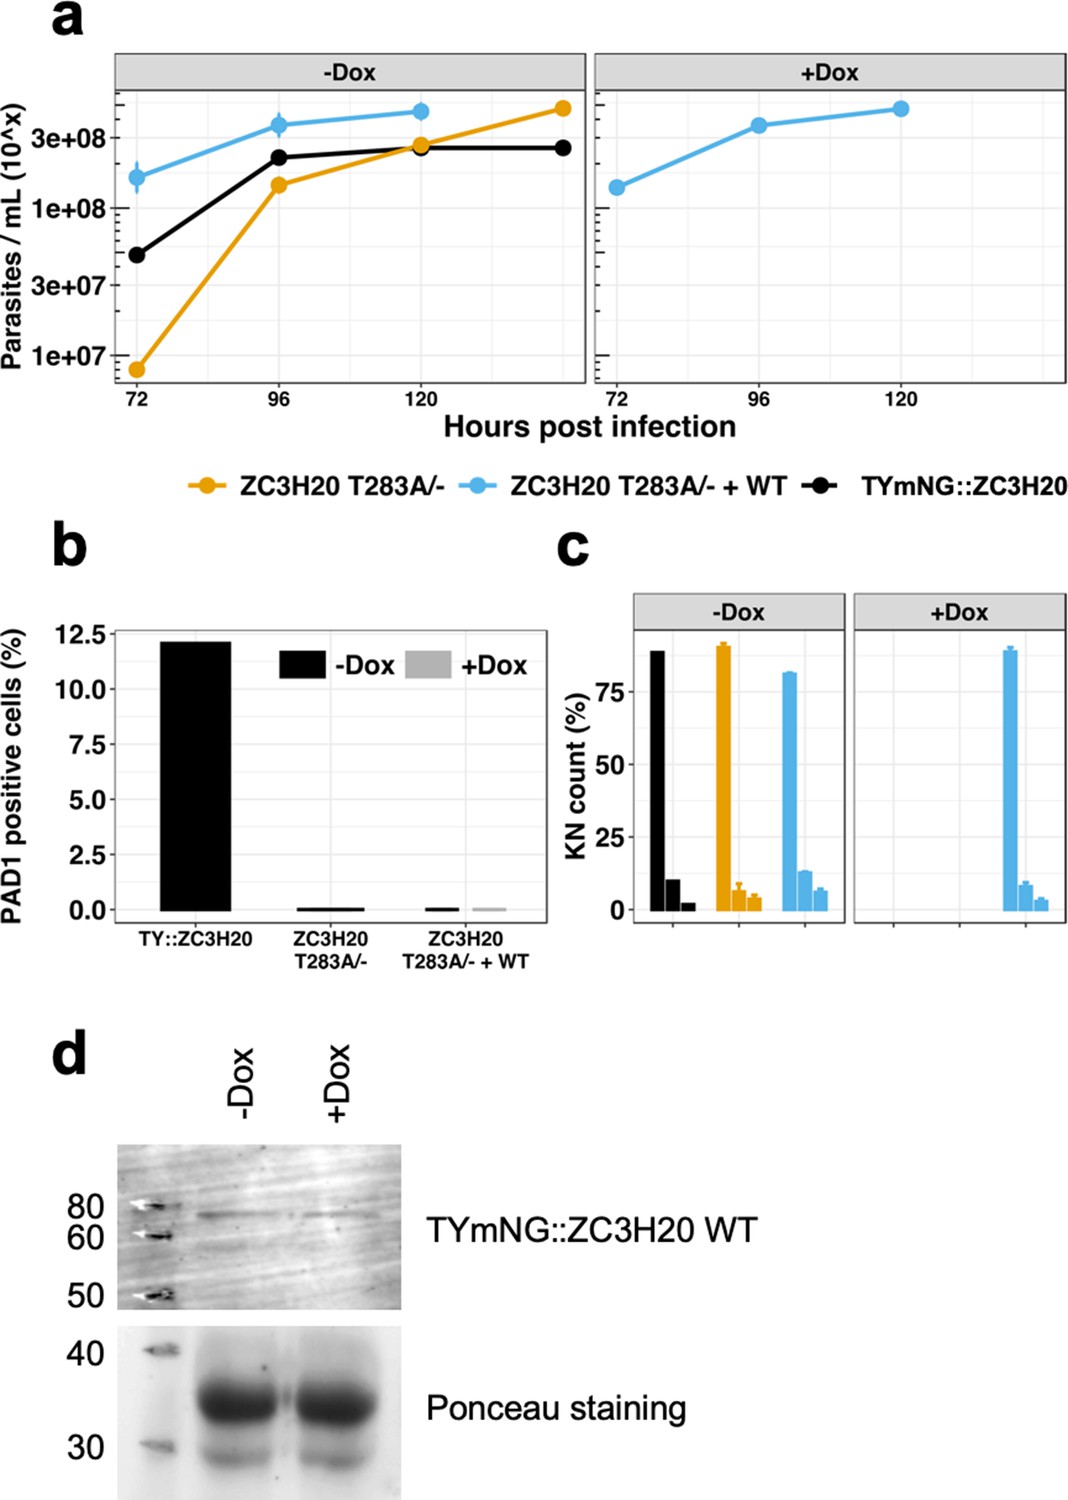
Add-back inducible ectopic expression of a WT copy of TbZC3H20 in the TbZC3H20T283A/- strain is leaky and does not rescue the WT phenotype.
TbZC3H20T283A/- clones 1 (yellow), TbZC3H20T283A/- + WT add-back cell line (blue, + or - doxycyclin) and TYmNG::ZC3H20 control cell line (black). (a) Parasitaemia, n = 3, error bars = SEM; (b) Percentage of PAD1 positive cells at 120 hr post infection, n = 3, error bars = SEM, cells counted >100 per samples; (c) Percentage of KN count at 120 hr post infection, n = 3 error bars = SEM, cells counted >100 per samples, left bar: 1K1N, middle bar: 2K1N, right bar: 2K2N; (d) Western blot of in vitro culture of the TbZC3H20T283A/- + WT add-back cell line incubated in presence or not with doxycycline for 48 hr. The ectopic expression of the WT copy is revealed using the anti-TY tag antibody.
Figure 7
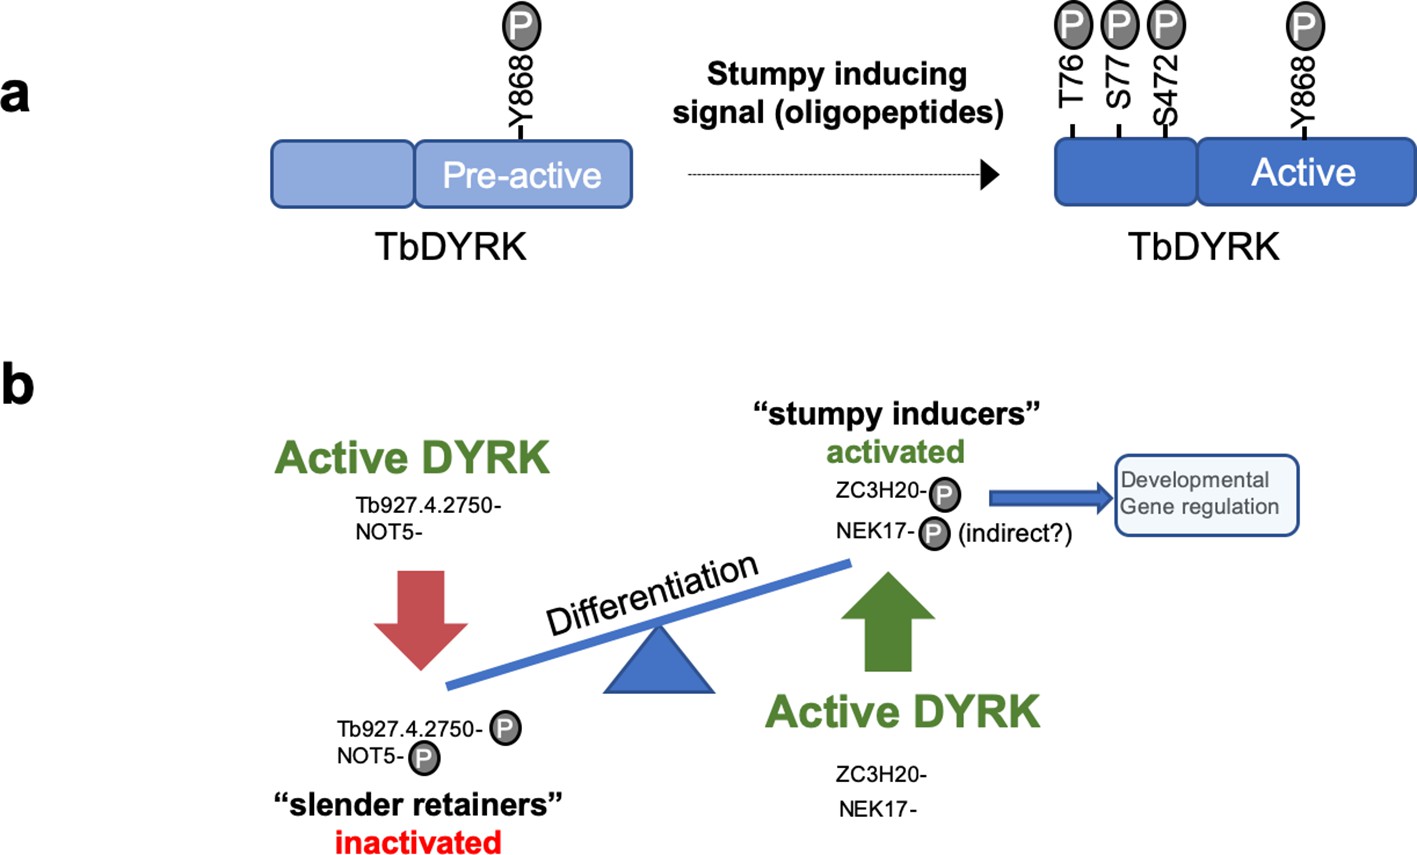
Model of the activation mechanisms and function of the TbDYRK.
(a) Phosphorylation of the pre-active kinase in response to the stumpy inducing signal results in activation of the kinase. (b) Consequences of the activation of TbDYRK for the regulation of differentiation, through the inactivation of slender retainer molecules and the activation of stumpy inducers.
Tables
Key resources table
| Reagent type (species) or resource | Designation | Source or reference | Identifiers | Additional information |
|---|---|---|---|---|
| Antibody | Anti-digoxinegin-AP Fab fragments | Roche | Cat# 11093274910 | Sheep polyclonal, dilution according to manufacturer instruction |
| Antibody | Anti-Ty1 epitope tag specific BB2 antibody | Bastin et al., 1996; hybridoma cell line a gift of Keith Gull, Oxford University/available through Thermofisher | Cat#MA5-23513; RRID:AB_2610644 | Hybrydome mouse monoclonal, clone BB2, WB (1:20), IF (1:5) |
| Antibody | Anti-Mouse AlexaFluor 488 | molecular probes | Cat# A1101 | Goat polyclonal, IF (1:500) |
| Antibody | Anti-Mouse AlexaFluor 568 | abcam | Cat# ab175701 | Goat polyclonal, IF (1:500) |
| Antibody | Anti-Rabbit AlexaFluor 488 | invitrogen | Cat# A1108 | Goat polyclonal, IF (1:500) |
| Antibody | Anti-Rabbit AlexaFluor 568 | invitrogen | Cat# A11036 | Goat polyclonal, IF (1:500) |
| Antibody | IRDye 680 anti-mouse secondary antibody | Li-Cor | Cat#P/N 925-68070; RRID:AB_2651128 | Goat polyclonal, IF (1:5000) |
| Antibody | IRDye 800CW anti-Mouse IgG (H + L) secondary antibody | Li-Cor | Cat#P/N 925-32210; RRID:AB_2687825 | Goat polyclonal, IF (1:5000) |
| Antibody | Anti-PAD1 | Dean et al., 2009 | N/A | Rabbit polyclonal, WB (1:1000), IF (1:1000) |
| Antibody | Anti-Thio-phosphate ester [51-8] | abcam | Cat# ab92570 | Rabbit monoclonal, clone 51-8, WB (1:1000) |
| Cell line (Spodoptera frugiperda) | SF9 insect cells | gibco | Cat# 12659017 | |
| Cell line (Trypanosoma brucei) | Trypanosoma brucei EATRO 1125 AnTat1.1 90:13 | Engstler and Boshart, 2004 | N/A | |
| Cell line (Trypanosoma brucei) | Trypanosoma brucei EATRO 1125 AnTat1.1 J1339 | Rojas et al., 2019 | N/A | |
| Commercial assay, kit | DIG RNA labelling kit (SP6/T7) | Roche | Cat# 11175025910 | |
| Commercial assay, kit | Dneasy Blood & Tissue kit | Qiagen | Cat# 69506 | |
| Commercial assay, kit | Luna Universal qPCR master mix | NEB | Cat# M3003L | |
| Commercial assay, kit | Monarch DNA Gel extraction kit | NEB | Cat# T1020L | |
| Commercial assay, kit | Monarch PCR DNA Cleanup kit | NEB | Cat# T1030S | |
| Commercial assay, kit | Quickchange II site directed mutagenesis kit | Agilent | Cat#200523 | |
| Commercial assay, kit | Rapid DNA ligation kit | invitrogen | Cat# K1423 | |
| Commercial assay, kit | RNeasy mini kit | Qiagen | Cat# 74106 | |
| Commercial assay, kit | Zero blunt TOPO PCR cloning kit | invitrogen | Cat# 45-0245 | |
| Gene (Trypanosoma brucei) | bilobe region protein, putative | Hu et al., 2015 | Tb927.11.15140 | |
| Gene (Trypanosoma brucei) | hypothetical protein | N/A | Tb927.1.4280 | |
| Gene (Trypanosoma brucei) | hypothetical protein | N/A | Tb927.4.2750 | |
| Gene (Trypanosoma brucei) | Not5 | Schwede et al., 2008 | Tb927.3.1920 | |
| Gene (Trypanosoma brucei) | TbDYRK (formely YAK) | Mony et al., 2014 | Tb927.10.15020 | |
| Gene (Trypanosoma brucei) | ZC3H20 | Liu et al., 2020 | Tb927.7.2660 | |
| Other | [g-32P]-ATP (3000 Ci/mmol) | Perkin Elmer | Cat# NEG502A250UC | |
| Other | 8-(4-Chlorophenylthio)adenosine 3′,5′-cyclic monophosphate sodium salt | Sigma-aldrich | Cat# C3912 | |
| Other | Amaxa basic parasite nucleofector kit 2 solution | Lonza | Cat#VMI-1021 | |
| Other | ATP-gamma-S | Abcam | Cat# ab18911 | |
| Other | CDP star | Roche | Cat# 11685627001 | |
| Other | Cellfectin II Reagent | gibco | Cat# 10362100 | |
| Other | DE52 | Whatman | Cat# 4057200 | |
| Other | Dyneabeads protein G | Invitrogen | Cat# 10003D | |
| Other | Grace’s Medium | gibco | Cat# 11595-030 | |
| Other | HMI-9 Medium | Life Technologies | Cat#074-90915 | |
| Other | MOPS | sigma aldrich | Cat# M3183 | |
| Other | NuPAGE 4-12% Bis-Tris Gel | invitrogen | Cat# NP0322BOX | |
| Other | NuPAGE MES SDS running buffer (20x) | invitrogen | Cat# NP0002 | |
| Other | Oligo dT(20) Primer | Invitrogen | Cat# 18418020 | |
| Other | Paraformaldehyde | sigma aldrich | Cat# P6148 | |
| Other | Phire green hot start II DNA polymerase | thermo scientific | Cat# F-124S | |
| Other | PNBM (p-Nitrobenzyl mesylate) in DMSO | abcam | Cat# ab138910 | |
| Other | ProLong Diamond antifade mount | invitrogen | Cat# P36965 | |
| Other | Protease inhibitor cocktail completme EDTA-free | Roche | Cat# 11873580001 | |
| Other | RNAse H | NEB | Cat# M0297S | |
| Other | SDM-79 medium | Life Technologies | Cat#074-90916 | |
| Other | Sf-900 1.3X | gibco | Cat# 10967-032 | |
| Other | Sf-900 II SFM medium | gibco | Cat# 10902-096 | |
| Other | Superscript III reverse transcriptase | Invitrogen | Cat# 18080-044 | |
| Peptide, recombinant protein | Beta-Casein | Sigma-aldrich | Cat# C6905-250MG | |
| Peptide, recombinant protein | Casein-dephosphorylated | Sigma-aldrich | Cat# C4032-100MG | |
| Peptide, recombinant protein | Caspase 9, 200 first amino acids | Cloud-clone corp. | Cat# RPA627Mu01 | |
| Peptide, recombinant protein | Histone H1 | Milipore | Cat# 14-155 | |
| Peptide, recombinant protein | Histones cores H2A, 2B, 3, 4 | BioVision | Cat# 7677-50 | |
| Peptide, recombinant protein | MBP-dephosphorylates | Millipore | Cat# 13-110 | |
| Recombinant DNA reagent | pALC14 | Pusnik et al., 2007 | N/A | |
| Recombinant DNA reagent | pALC14_1.4280 | This study | N/A | Derived from pALC14 from Pusnik et al. (2007), generated in Keith Matthews's Lab |
| Recombinant DNA reagent | pALC14_NOT5 | This study | N/A | Derived from pALC14 from Pusnik et al. (2007), generated in Keith Matthews's Lab |
| Recombinant DNA reagent | pALC14_Tb927.11.15140 | This study | N/A | Derived from pALC14 from Pusnik et al. (2007), generated in Keith Matthews's Lab |
| RecombinantDNA reagent | pALC14_Tb927.4.2750 | This study | N/A | Derived from pALC14 from Pusnik et al. (2007), generated in Keith Matthews's Lab |
| Recombinant DNA reagent | pDEX577-Y | Kelly et al., 2007 | N/A | |
| Recombinant DNA reagent | pDEX577-Y_TbDYRK_∆I::YFP-TY | This study | N/A | Derived from pDEX577-Y from Kelly et al. (2007), generated in Keith Matthews's Lab |
| Recombinant DNA reagent | pDEX577-Y_TbDYRK_∆II::YFP-TY | This study | N/A | Derived from pDEX577-Y from Kelly et al. (2007), generated in Keith Matthews's Lab |
| Recombinant DNA reagent | pDEX577-Y_TbDYRK_∆III::YFP-TY | This study | N/A | Derived from pDEX577-Y from Kelly et al. (2007), generated in Keith Matthews's Lab |
| Recombinant DNA reagent | pDEX577-Y_TbDYRK_ H866A_Y868F::YFP-TY | This study | N/A | Derived from pDEX577-Y from Kelly et al. (2007), generated in Keith Matthews's Lab |
| Recombinant DNA reagent | pDEX577-Y_TbDYRK_H866A::YFP-TY | This study | N/A | Derived from pDEX577-Y from Kelly et al. (2007), generated in Keith Matthews's Lab |
| Recombinant DNA reagent | pDEX577-Y_TbDYRK_K592A::YFP-TY | This study | N/A | Derived from pDEX577-Y from Kelly et al. (2007), generated in Keith Matthews's Lab |
| Recombinant DNA reagent | pDEX577-Y_TbDYRK_NM::YFP-TY | This study | N/A | Derived from pDEX577-Y from Kelly et al. (2007), generated in Keith Matthews's Lab |
| Recombinant DNA reagent | pDEX577-Y_TbDYRK_S472A::YFP-TY | This study | N/A | Derived from pDEX577-Y from Kelly et al. (2007), generated in Keith Matthews's Lab |
| Recombinant DNA reagent | pDEX577-Y_TbDYRK_S77A::YFP-TY | This study | N/A | Derived from pDEX577-Y from Kelly et al. (2007), generated in Keith Matthews's Lab |
| Recombinant DNA reagent | pDEX577-Y_TbDYRK_S856A::YFP-TY | This study | N/A | Derived from pDEX577-Y from Kelly et al. (2007), generated in Keith Matthews's Lab |
| Recombinant DNA reagent | pDEX577-Y_TbDYRK_S856G::YFP-TY | This study | N/A | Derived from pDEX577-Y from Kelly et al. (2007), generated in Keith Matthews's Lab |
| Recombinant DNA reagent | pDEX577-Y_TbDYRK_T76A::YFP-TY | This study | N/A | Derived from pDEX577-Y from Kelly et al. (2007), generated in Keith Matthews's Lab |
| Recombinant DNA reagent | pDEX577-Y_TbDYRK_Y868F::YFP-TY | This study | N/A | Derived from pDEX577-Y from Kelly et al. (2007), generated in Keith Matthews's Lab |
| Recombinant DNA reagent | pDEX577-Y_ZC3H20::YFP-TY | This study | N/A | Derived from pDEX577-Y from Kelly et al. (2007), generated in Keith Matthews's Lab |
| Recombinant DNA reagent | pEnT6B-Y | Kelly et al., 2007 | N/A | |
| Recombinant DNA reagent | pEnT6B-Y_UTRs_TbDYRK | This study | N/A | Derived from pEnT6B-Y from Kelly et al. (2007), generated in Keith Matthews's Lab |
| Recombinant DNA reagent | pEnT6P-Y | Kelly et al., 2007 | N/A | Derived from pEnT6B-Y from Kelly et al. (2007), generated in Keith Matthews's Lab |
| Recombinant DNA reagent | pEnT6P-Y_UTRs_TbDYRK | This study | N/A | Derived from pEnT6B-Y from Kelly et al. (2007), generated in Keith Matthews's Lab |
| Recombinant DNA reagent | pET28a | Novagen | Cat#69864 | |
| Recombinant DNA reagent | pFASTBac1 expression vector | Invitrogen | Cat# 10360-010 | |
| Recombinant DNA reagent | pFASTBac1_TY-YFP-TY | This study | N/A | Derived from pFASTBac1 from Novagen, generated in Keith Matthews's Lab |
| Recombinant DNA reagent | pFASTBac1_TY-YFP-TY::TbDYRK_∆I | This study | N/A | Derived from pFASTBac1 from Novagen, generated in Keith Matthews's Lab |
| Recombinant DNA reagent | pFASTBac1_TY-YFP-TY::TbDYRK_∆II | This study | N/A | Derived from pFASTBac1 from Novagen, generated in Keith Matthews's Lab |
| Recombinant DNA reagent | pFASTBac1_TY-YFP-TY::TbDYRK_∆III | This study | N/A | Derived from pFASTBac1 from Novagen, generated in Keith Matthews's Lab |
| Recombinant DNA reagent | pFASTBac1_TY-YFP-TY::TbDYRK_H866A | This study | N/A | Derived from pFASTBac1 from Novagen |
| Recombinant DNA reagent | pFASTBac1_TY-YFP-TY::TbDYRK_H866A_Y868F | This study | N/A | Derived from pFASTBac1 from Novagen, generated in Keith Matthews's Lab |
| Recombinant DNA reagent | pFASTBac1_TY-YFP-TY::TbDYRK_K592A | This study | N/A | Derived from pFASTBac1 from Novagen, generated in Keith Matthews's Lab |
| Recombinant DNA reagent | pFASTBac1_TY-YFP-TY: :TbDYRK_NM | This study | N/A | Derived from pFASTBac1 from Novagen, generated in Keith Matthews's Lab |
| Recombinant DNA reagent | pFASTBac1_TY-YFP-TY::TbDYRK_S472A | This study | N/A | Derived from pFASTBac1 from Novagen, generated in Keith Matthews's Lab |
| Recombinant DNA reagent | pFASTBac1_TY-YFP-TY::TbDYRK_S77A | This study | N/A | Derived from pFASTBac1 from Novagen, generated in Keith Matthews's Lab |
| Recombinant DNA reagent | pFASTBac1_TY-YFP-TY:: TbDYRK_S856A | This study | N/A | Derived from pFASTBac1 from Novagen, generated in Keith Matthews's Lab |
| Recombinant DNA reagent | pFASTBac1_TY-YFP-TY::TbDYRK_S856G | This study | N/A | Derived from pFASTBac1 from Novagen, generated in Keith Matthews's Lab |
| Recombinant DNA reagent | pFASTBac1_TY-YFP-TY::TbDYRK_T76A | This study | N/A | Derived from pFASTBac1 from Novagen, generated in Keith Matthews's Lab |
| Recombinant DNA reagent | pFASTBac1_TY-YFP-TY::TbDYRK_Y868F | This study | N/A | Derived from pFASTBac1 from Novagen, generated in Keith Matthews's Lab |
| Recombinant DNA reagent | pGEMTeasy | Promega | Cat# A1360 | |
| Recombinant DNA reagent | pJ1339 | Kindly provided by Dr Jack Sunter, Oxford Brookes University | N/A | |
| Recombinant DNA reagent | pPOTv6 | Kindly provided by Dr Sam Dean, Oxford University | N/A | |
| Recombinant DNA reagent | pPOTv6_ZC3H20_T283A | This study | N/A | Derived from pPOTv6, generated in Keith Matthews's Lab |
| Recombinant DNA reagent | pPOTv7 | Kindly provided by Dr Sam Dean, Oxford University | N/A | |
| Recombinant DNA reagent | pTOPO PCR blunt II | invitrogen | Cat# 45-0245 | |
| Recombinant DNA reagent | pPOTv6_BLEO_BSD | This study | N/A | Derived from pPOTv6, generated in Keith Matthews's Lab |
| Recombinant DNA reagent | pPOTv6_BLEO_TY::ZC3H20_BSD | This study | N/A | Derived from pPOTv6, generated in Keith Matthews's Lab |
| Software, algorithm | Bioconductor | Bioconductor | http://www.bioconductor.org/ | |
| Software, algorithm | Blast | NCBI | https://blast.ncbi.nlm.nih.gov/Blast.cgi | |
| Software, algorithm | ClustalXv2 | Larkin et al., 2007 | http://www.clustal.org/clustal2/ | |
| Software, algorithm | Eukaryotic Linear Motif resource | Gouw et al., 2018 | http://elm.eu.org/infos/about.html | |
| Software, algorithm | GeneDB | Hertz-Fowler, 2004 | http://www.genedb.org/Homepage | |
| Software, algorithm | iTASSER | Yang and Zhang, 2015 | https://zhanglab.ccmb.med.umich.edu/I-TASSER/ | |
| Software, algorithm | Jalview | Waterhouse et al., 2009 | N/A | |
| Software, algorithm | LeishGEdit | Beneke et al., 2017 | http://www.leishgedit.net/Home.html | |
| Software, algorithm | MEGA7 | Kumar et al., 2016 | https://www.megasoftware.net | |
| Software, algorithm | MUSCLE | Madeira et al., 2019 | https://www.ebi.ac.uk/Tools/msa/muscle/ | |
| Software, algorithm | OrthoMCL | Chen et al., 2006 | http://orthomcl.org/orthomcl/ | |
| Software, algorithm | Pfam | El-Gebali et al., 2019 | http://pfam.xfam.org | |
| Software, algorithm | PRATT v2.1 | Jonassen et al., 1995 | N/A | |
| Software, algorithm | PyMol1.8 | Schrödinger | https://pymol.org/2/ | |
| Software, algorithm | R | R | https://www.r-project.org/ | |
| Software, algorithm | RNAit | Redmond et al., 2003 | https://dag.compbio.dundee.ac.uk/RNAit/ | |
| Software, algorithm | Rstudio | Rstudio | https://rstudio.com/ | |
| Software, algorithm | TriTrypDB | Aslett et al., 2010 | http://tritrypdb.org/tritrypdb/ | |
| Strain, strain background (Escherichia coli) | MAX Efficiency DH10Bac chemically competent cells | gibco | Cat# 10361012 | |
| Strain, strain background (Mus musculus) | Mouse MF1, female | Charles River | N/A | |
| Transfected construct | Trypanosoma brucei EATRO 1125 AnTat1.1 90:13_RNAi_Not5 | This study | N/A | Cell lines generated in Keith Matthews's Lab |
| Transfected construct | Trypanosoma brucei EATRO 1125 AnTat1.1 90:13_RNAi_Tb927.1.4280 | This study | N/A | Cell lines generated in Keith Matthews's Lab |
| Transfected construct | Trypanosoma brucei EATRO 1125 AnTat1.1 90:13_RNAi_Tb927.11.15140 | This study | N/A | Cell lines generated in Keith Matthews's Lab |
| Transfected construct | Trypanosoma brucei EATRO 1125 AnTat1.1 90:13_RNAi_Tb927.4.2750 | This study | N/A | Cell lines generated in Keith Matthews's Lab |
| Transfected construct | Trypanosoma brucei EATRO 1125 AnTat1.1 90:13_TbDYRK_∆I | This study | N/A | Cell lines generated in Keith Matthews's Lab |
| Transfected construct | Trypanosoma brucei EATRO 1125 AnTat1.1 90:13_TbDYRK_∆II | This study | N/A | Cell lines generated in Keith Matthews's Lab |
| Transfected construct | Trypanosoma brucei EATRO 1125 AnTat1.1 90:13_TbDYRK_∆III | This study | N/A | Cell lines generated in Keith Matthews's Lab |
| Transfected construct | Trypanosoma brucei EATRO 1125 AnTat1.1 90:13_TbDYRK_H866A | This study | N/A | Cell lines generated in Keith Matthews's Lab |
| Transfected construct | Trypanosoma brucei EATRO 1125 AnTat1.1 90:13_TbDYRK_H866A_Y868F | This study | N/A | Cell lines generated in Keith Matthews's Lab |
| Transfected construct | Trypanosoma brucei EATRO 1125 AnTat1.1 90:13_TbDYRK_K592A | This study | N/A | Cell lines generated in Keith Matthews's Lab |
| Transfected construct | Trypanosoma brucei EATRO 1125 AnTat1.1 90:13_TbDYRK_KO | This study | N/A | Cell lines generated in Keith Matthews's Lab |
| Transfected construct | Trypanosoma brucei EATRO 1125 AnTat1.1 90:13_TbDYRK_NM | This study | N/A | Cell lines generated in Keith Matthews's Lab |
| Transfected construct | Trypanosoma brucei EATRO 1125 AnTat1.1 90:13_TbDYRK_S472A | This study | N/A | Cell lines generated in Keith Matthews's Lab |
| Transfected construct | Trypanosoma brucei EATRO 1125 AnTat1.1 90:13_TbDYRK_S77A | This study | N/A | Cell lines generated in Keith Matthews's Lab |
| Transfected construct | Trypanosoma brucei EATRO 1125 AnTat1.1 90:13_TbDYRK_S856A | This study | N/A | Cell lines generated in Keith Matthews's Lab |
| Transfected construct | Trypanosoma brucei EATRO 1125 AnTat1.1 90:13_TbDYRK_S856G | This study | N/A | Cell lines generated in Keith Matthews's Lab |
| Transfected construct | Trypanosoma brucei EATRO 1125 AnTat1.1 90:13_TbDYRK_T76A | This study | N/A | Cell lines generated in Keith Matthews's Lab |
| Transfected construct | Trypanosoma brucei EATRO 1125 AnTat1.1 90:13_TbDYRK_Y868F | This study | N/A | Cell lines generated in Keith Matthews's Lab |
| Transfected construct | Trypanosoma brucei EATRO 1125 AnTat1.1 J1339_ZC3H20_KO | This study | N/A | Cell lines generated in Keith Matthews's Lab |
| Transfected construct | Trypanosoma brucei EATRO 1125 AnTat1.1 J1339_ZC3H20_T283A/- | This study | N/A | Cell lines generated in Keith Matthews's Lab |
| Transfected construct | Trypanosoma brucei EATRO 1125 AnTat1.1 J1339_ZC3H20_T283A/-_pDEX577-Y-ZC3H20 | This study | N/A | Cell lines generated in Keith Matthews's Lab |
Additional files
-
Supplementary file 1
List of primers used in the study.
- https://cdn.elifesciences.org/articles/51620/elife-51620-supp1-v2.xlsx
-
Supplementary file 2
Results of the phosphoproteomic analysis comparing DYRK-/-cells to WT AnTat1.1cells.
Sheet 1 KOvsWT_|FC| > 1.5_p<0.05 presents the peptides with an absolute value of FC > 1.5 and a p-value<0.05. Sheet 2 GOenrichDownKO indicate the GO term enrichment of biological functions of proteins presenting a down regulation of phosphorylation in the DYRK-/-cell line. Sheet 3 GOenrichUpKO indicate the GO term enrichment of biological functions of proteins presenting an up regulation of phosphorylation in the DYRK-/-cell line. Yellow colour indicates the proteins for which further analysis have been performed.
- https://cdn.elifesciences.org/articles/51620/elife-51620-supp2-v2.xlsx
-
Supplementary file 3
Results of the phosphoproteomic analysis the phosphorylation of cell lysates by the active DYRK non-mutated NM to the inactive mutant H866A.
Sheet 1 NMvsH866A_|FC| > 1.5_p<0.05 presents the peptides with an absolute value of FC > 1.5 and a p-value<0.05. Sheet 2 GOenrichUpNM indicate the GO term enrichment of biological functions of proteins presenting a phosphorylation in presence of the NM. Yellow colour indicates the proteins for which further analysis have been performed.
- https://cdn.elifesciences.org/articles/51620/elife-51620-supp3-v2.xlsx
-
Supplementary file 4
List of proteins (sheet 1) and peptides (sheet 2) common in both analyses with an absolute value of FC > 1.5.
Green colour indicates the statically significant protein/peptides (p-value<0.05).
- https://cdn.elifesciences.org/articles/51620/elife-51620-supp4-v2.xlsx
-
Supplementary file 5
p-Values.
Sheet 1, p-values for the kinase activity assay. Sheet 2, p-values for the RT-qPCR analysis, upper table comparing the expression level of the gene TbDYRK and the lower table the YFP gene. Statistic calculation were performed using a pairwise t-test, considering non-equal variances, and apply the holm correction.
- https://cdn.elifesciences.org/articles/51620/elife-51620-supp5-v2.xlsx
-
Transparent reporting form
- https://cdn.elifesciences.org/articles/51620/elife-51620-transrepform-v2.docx
Download links
A two-part list of links to download the article, or parts of the article, in various formats.
Downloads (link to download the article as PDF)
Open citations (links to open the citations from this article in various online reference manager services)
Cite this article (links to download the citations from this article in formats compatible with various reference manager tools)
An atypical DYRK kinase connects quorum-sensing with posttranscriptional gene regulation in Trypanosoma brucei
eLife 9:e51620.
https://doi.org/10.7554/eLife.51620


