Energetic and physical limitations on the breaching performance of large whales
- Hopkins Marine Station of Stanford University, United States
- Saint Louis University, United States
- Cascadia Research Collective, United States
- Accademia del Leviatano, Italy
- West Chester University, United States
- Institute of Marine Sciences, University of California, United States
- Okeanos R&D Centre and the Institute of Marine Research, University of the Azores, Portugal
- Department of Biology, Syracuse University, United States
- Institute for Coastal and Marine Research, Nelson Mandela University, South Africa
- Department of Birds and Mammals, Greenland Institute of Natural Resources, Greenland
- Moss Landing Marine Laboratories, San Jose State University, United States
- Stellwagen Bank National Marine Sanctuary, United States
- Duke University Marine Laboratory, United States
- Aarhus Institute for Advanced Studies, Aarhus University, Denmark
- Aarhus University, Denmark
Figures
Figure 1
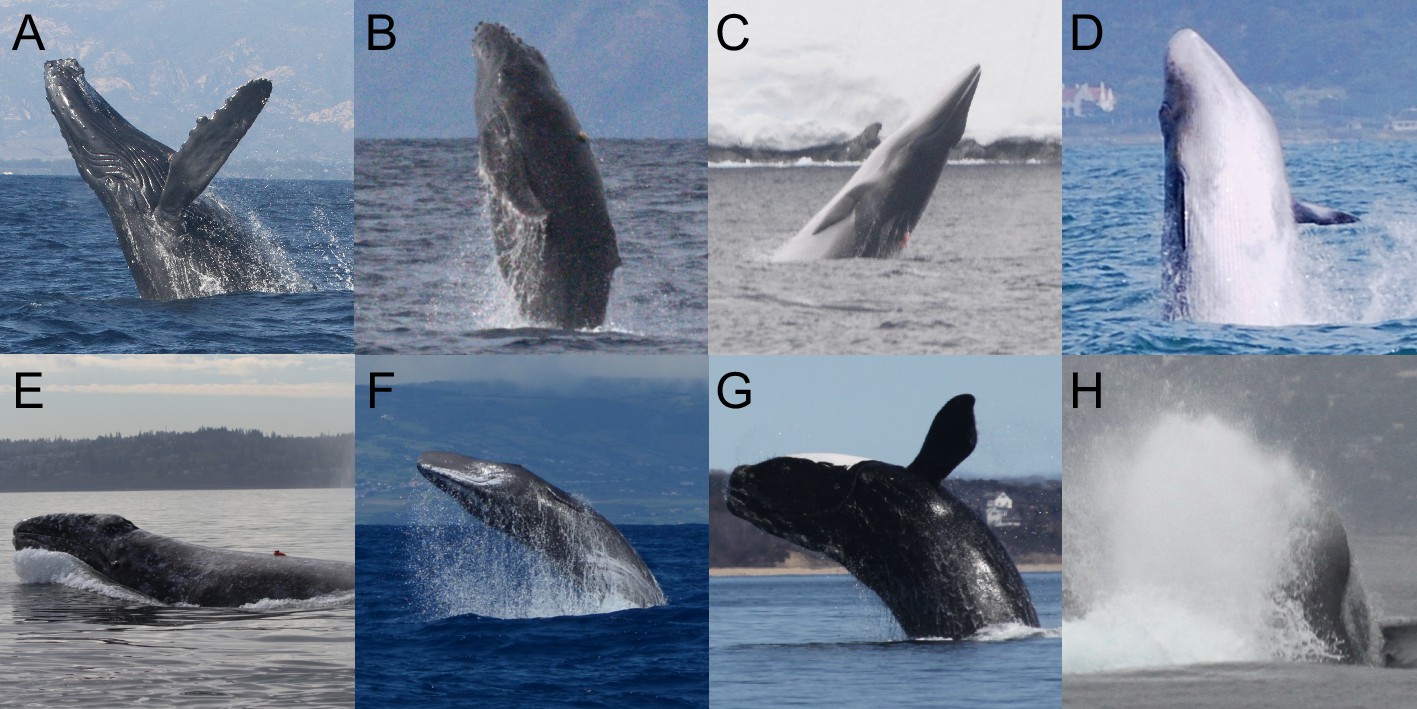
Breaching whales.
(A) A tagged humpback whale (NMFS permit #16111). (B) A tagged humpback calf (NMFS permit #14682). (C) A tagged minke whale (NMFS permit #14809). (D) An untagged Bryde's whale breaching (credit K. Underhill, Simon's Town Boat Company). (E) A tagged gray whale falling back into the water (NMFS permit #16111). (F) An untagged sperm whale (permit #49/2010/DRA). (G) A tagged right whale (MMPA permit #775–1875). (H) An untagged blue whale partially emerging from the water while participating in a 'racing behavior' (NMFS permit #16111).
Figure 2
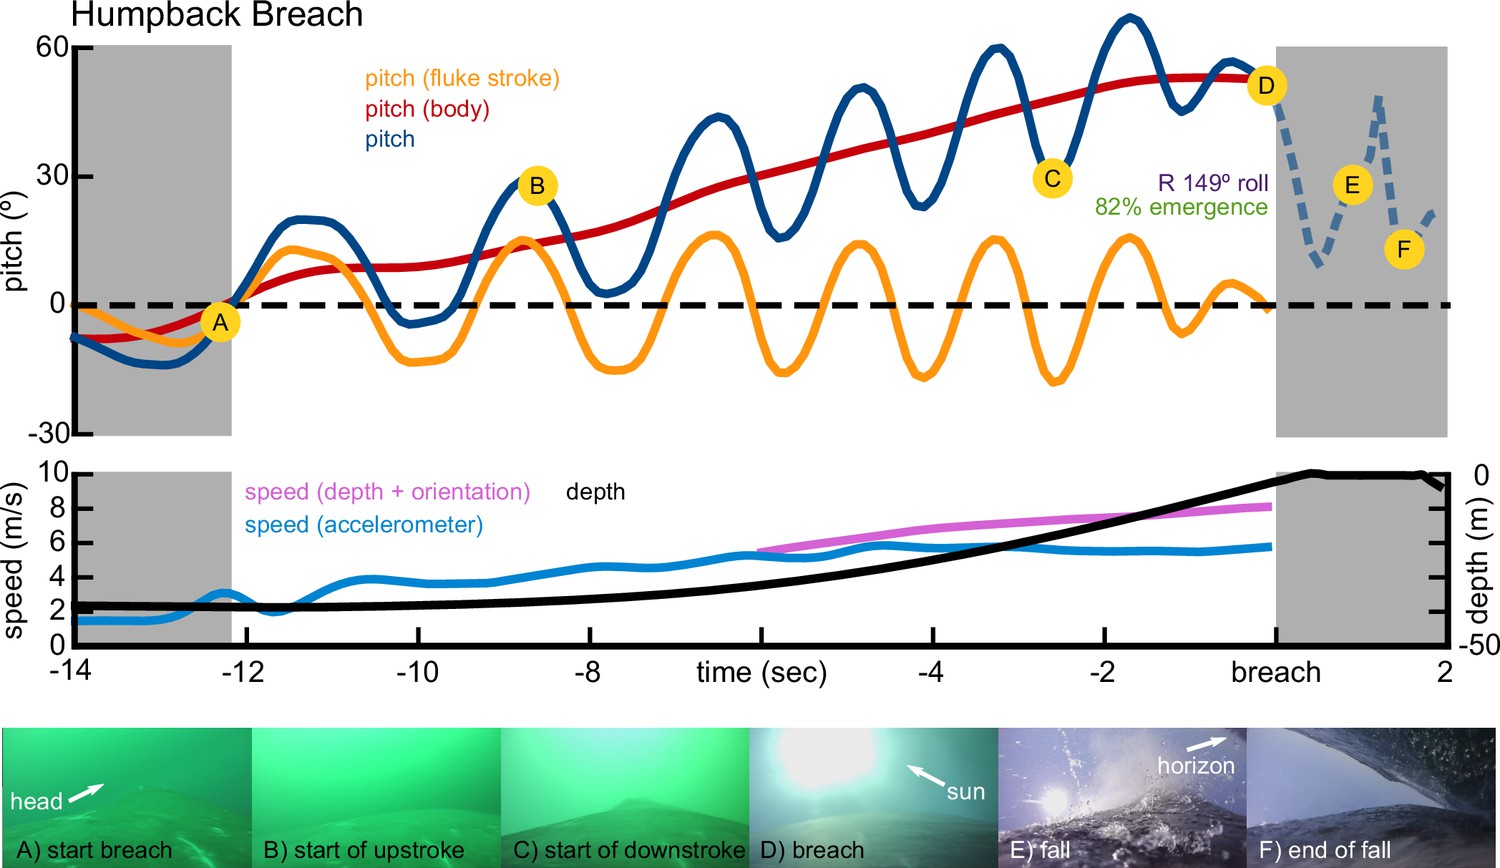
Representative breaching kinematics of a humpback whale.
Three metrics of pitch are shown: the pitch changes of the body (red), pitch oscillations due to the fluke stroke (orange), and the sum of the two (blue). Two measurements of speed are shown: speed calculated from orientation corrected depth rate (purple), and speed calculated from the accelerometer vibrations (blue). Depth is also shown (black). Images from the onboard camera are shown at specific landmarks during the breach. The video of this breach is included in the supplementary materials (Video 1).
Figure 3
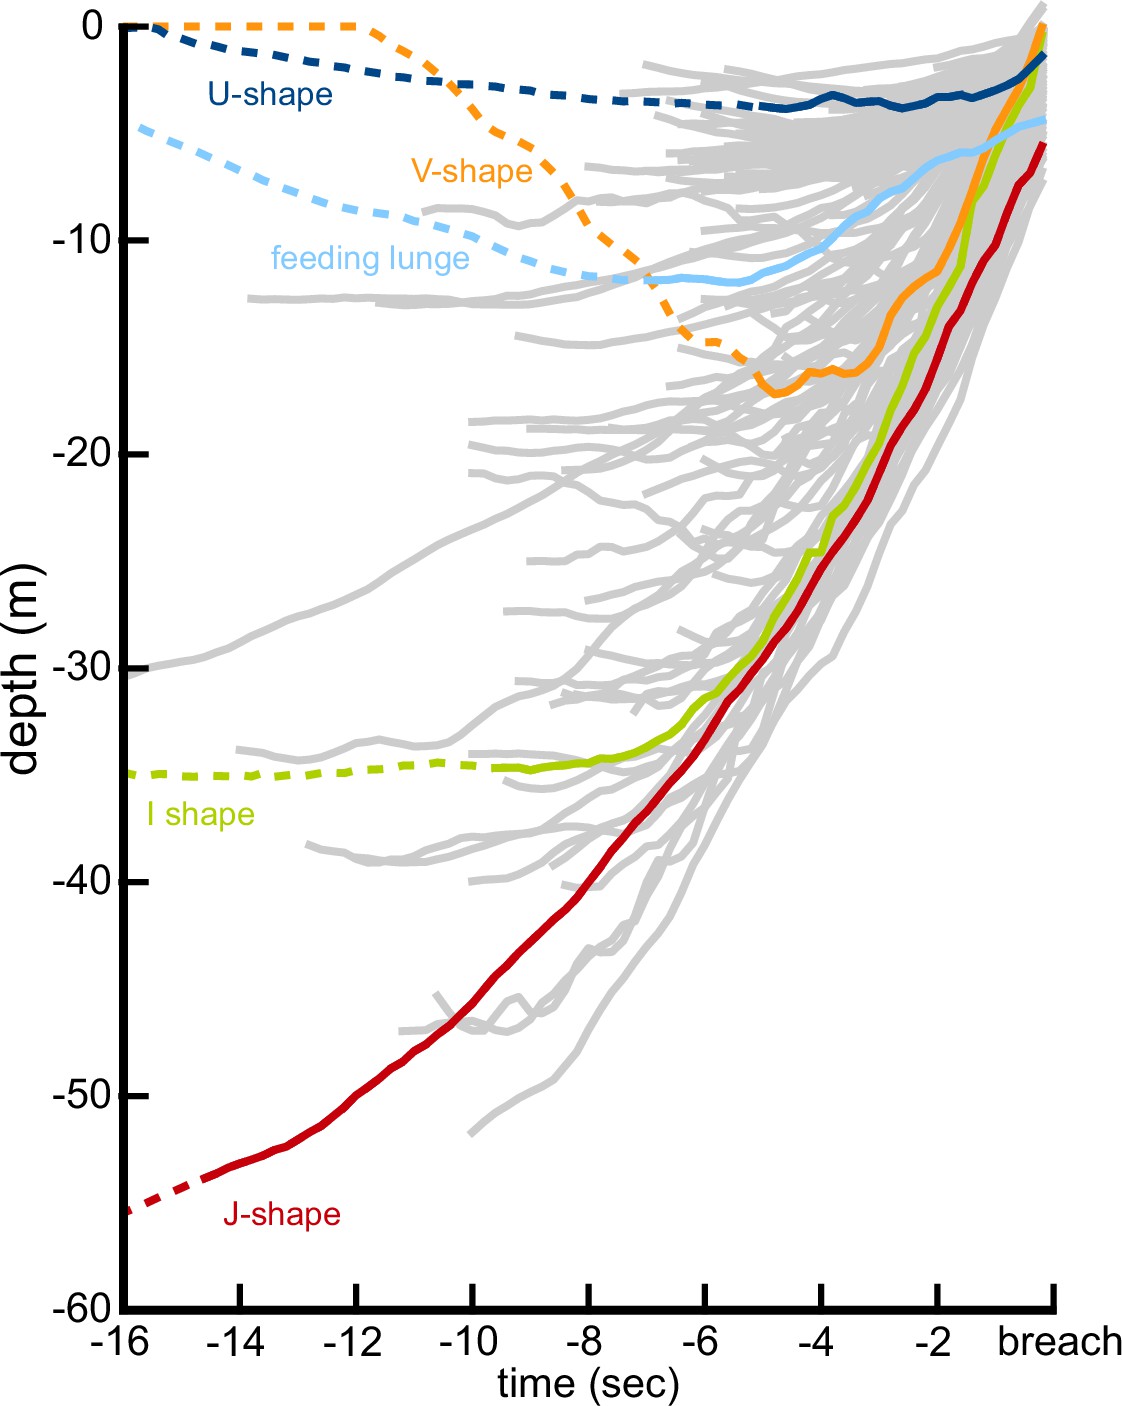
The diversity of underwater breaching behavior is illustrated by the depth profiles of 152 breaching accelerations performed by 37 humpback whales.
Four representative trajectories illustrating U, V, I, and J-shaped breaching profiles are highlighted, showing both the beginning of the upwards acceleration (solid line) and the 16 s prior to the breach, provided for context (dotted line).
Figure 4

Representative breaching kinematics of a minke whale (A), a Bryde’s whale (B), a gray whale (C), a sperm whale (D), and a right whale (E).
Three metrics of pitch are shown: the pitch changes of the body (red), pitch oscillations due to the fluke stroke (orange), and the sum of the two (blue). Two measurements of speed are shown: speed calculated from orientation corrected depth rate (purple), and speed calculated from the accelerometer vibrations (blue). Depth is also shown (black). The graphs show the 12 s before the whale emerges from the water, with gray shaded areas representing time before the breaching maneuver begins.
Figure 5
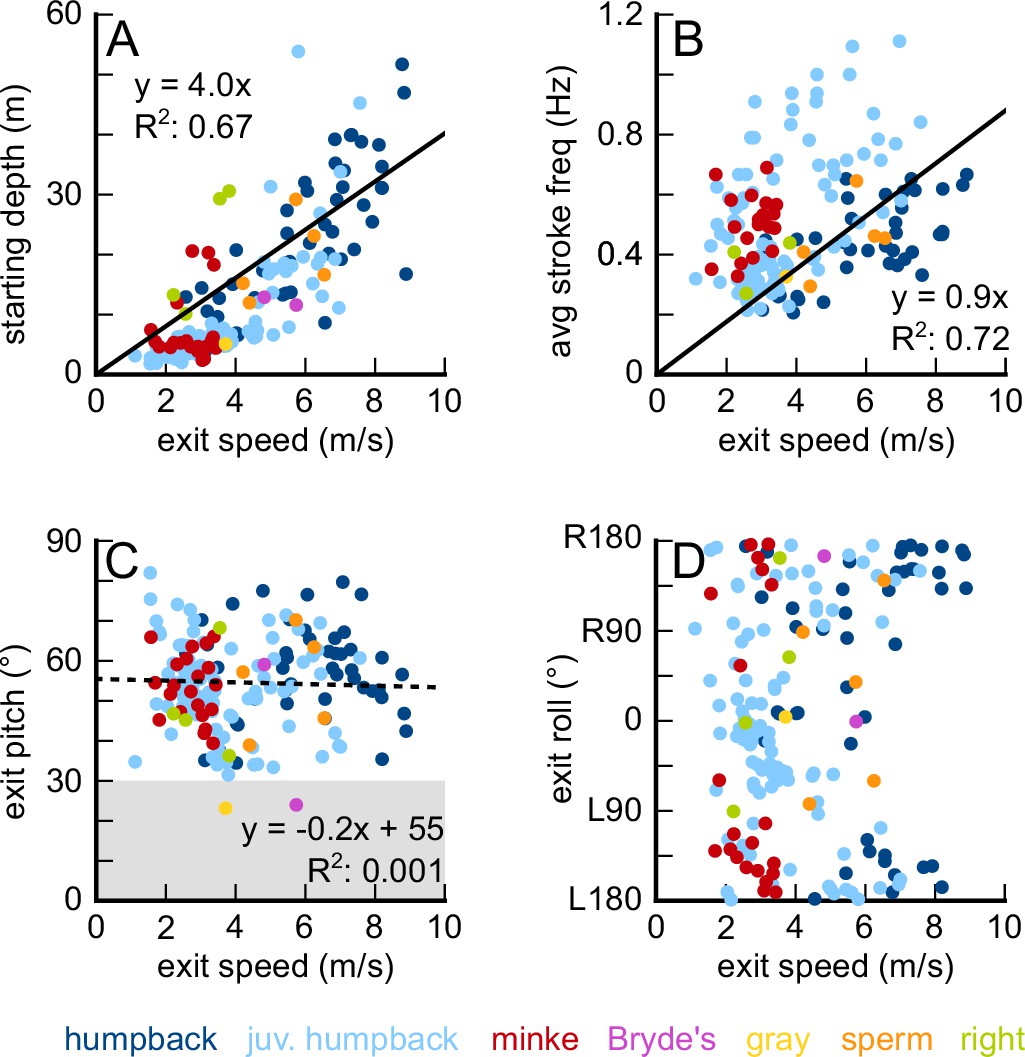
Breaching speed is correlated with starting depth (A) and average stroke frequency (B), but not with breaching pitch (C), or breaching roll angle (D).
-
Figure 5—source data 1
Data from 187 breaches performed by 28 individual humpback whales, two minke whales, one Bryde’s whale, one gray whale, three sperm whales, and two right whales.
- https://cdn.elifesciences.org/articles/51760/elife-51760-fig5-data1-v1.csv
Figure 6
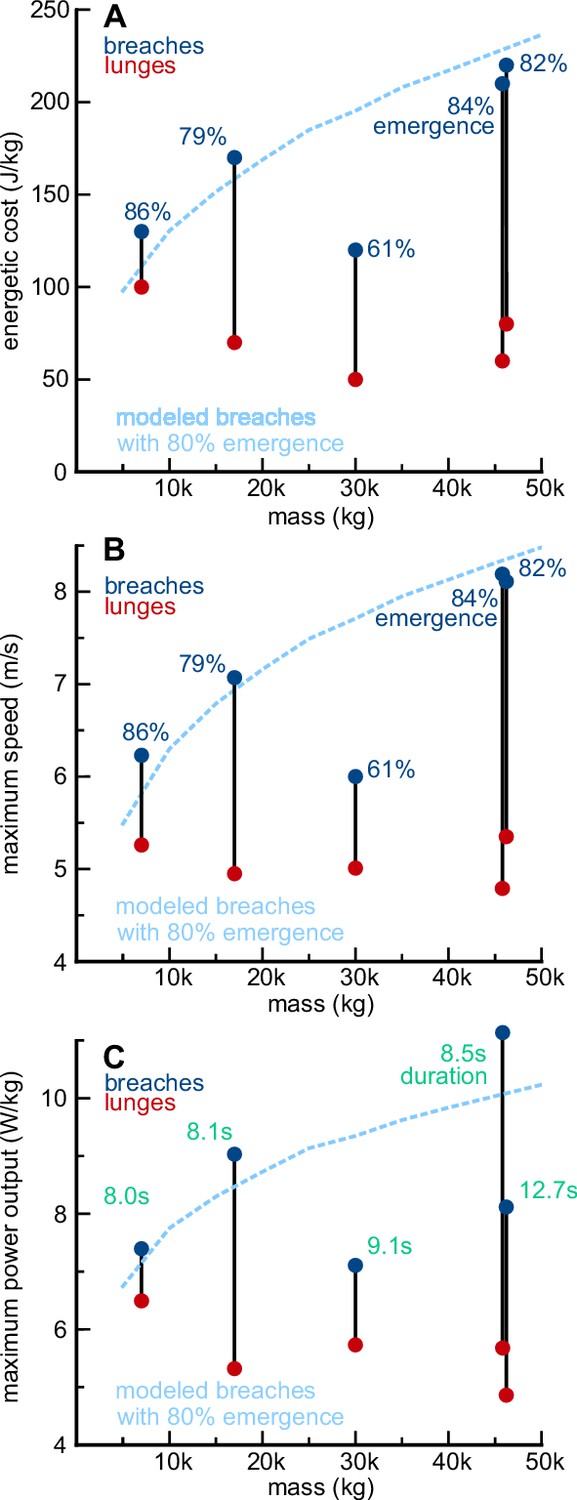
The cost of breaching increases with body size, in humpback whales.
(A) The mass-specific energy expenditure required to perform high-emergence breaches (blue) and high-performance lunges (red) is shown for five humpback whales of different sizes. Because the whales breached with different percentages of their bodies emerging from the water (dark blue numbers), the expected relationship between mass and the energetic cost of breaching with 80% body emergence, is shown for comparison (light blue line). The modeled breaches were calculated using average parameters from the trajectories of the five individuals shown (65° pitch; body width = 18% of length; 1.75 m/s starting velocity; 0.65 m/s2 acceleration; no plateau phase). Both the model and the data show that the mass-specific cost of breaching increases with body size. (B) This pattern is largely driven by the higher speeds that larger whales need to emerge from the water. (C) To attain the higher speeds required to emerge from the water, larger whales need to generate higher mass-specific mechanical power outputs or extend the duration of their trajectories (green numbers).
Videos
Video 1
Camera-tag video of a humpback whale performing a breach.
The trajectory of this breach is shown in Figure 2.
Tables
Table 1
Performance and kinematics of breaching whales.
Mean ± standard deviation are presented along with maximum and minimum values, shown in parentheses. It was not always possible to measure all of the metrics for each breach. Velocity for the gray whale and Bryde’s whale breaches were measured using the accelerometer vibrations, while all other velocities were measured using the orientation corrected depth rate.
| Humpback whale | Humpback juvenile | Minke whale | Bryde’s whale | Gray whale | Sperm whale | Right whale | |
|---|---|---|---|---|---|---|---|
| # individuals | 25 | 3 | 2 | 1 | 1 | 3 | 2 |
| # events (full, partial breaches) | 46 (39, 6) | 106 (66, 33) | 22 (11, 10) | 2 (2, 0) | 1 (1, 0) | 6 (5, 0) | 4 (1, 3) |
| depth (m) | 24 ± 12 (4, 52) | 9 ± 8 (2, 54) | 7 ± 5 (2, 21) | 12 ± 1 (12, 13) | 5 | 20 ± 6 (12, 29) | 21 ± 11 (10, 31) |
| duration (s) | 7.9 ± 2.3 (4.4, 13.7) | 5.2 ± 2.4 (1.9, 17.6) | 7.5 ± 3.8 (2.9, 18.2) | 5.3 ± 2.2 (3.8, 6.9) | 7.9 | 7.3 ± 1.8 (5.0, 10.2) | 8.8 ± 2.2 (6.9, 11.5) |
| # strokes | 4.1 ± 1.5 (1.7, 6.7) | 2.8 ± 1.6 (1.1, 10.7) | 3.8 ± 1.8 (1.7, 7.5) | - | 2.8 | 3.8 ± 1.2 (2.1, 5.6) | 3.6 ± 1.7 (2.0, 5.4) |
| stroke frequency (Hz) | 0.4 ± 0.1 (0.2, 0.7) | 0.5 ± 0.2 (0.2, 1.1) | 0.5 ± 0.1 (0.3, 0.7) | - | 0.3 | 0.5 ± 0.1 (0.3, 0.6) | 0.4 ± 0.1 (0.3, 0.4) |
| exit speed (m/s) | 6.1 ± 1.8 (2.6, 8.9) | 3.6 ± 1.4 (1.1, 7.6) | 2.7 ± 0.6 (1.6, 3.4) | 5.3 ± 0.6 (4.8, 5.7) | 3.7 | 5.4 ± 1.1 (4.2, 6.5) | 3.0 ± 0.8 (2.2, 3.8) |
| exit pitch (°) | 56 ± 13 (14, 80) | 52 ± 13 (19, 82) | 52 ± 10 (26, 66) | 42 ± 25 (24, 59) | 23 | 49 ± 18 (20, 70) | 49 ± 14 (36, 68) |
| exit roll (°) | 119 ± 57 (4, 178) | 84 ± 58 (2, 179) | 132 ± 39 (37, 177) | 83 ± 116 (1, 165) | 4 | 88 ± 37 (39, 140) | 80 ± 67 (2, 163) |
| emergence (%) | 63 ± 19 (26, 100) | 55 ± 23 (20, 120) | 39 ± 9 (20, 53) | 68 ± 24 (51, 85) | 58 | 65 ± 13 (49, 82) | 33 ± 9 (24, 46) |
Table 2
Breaching trajectories were broadly categorized based on their shape.
| Trajectory | Starting location | Characteristics | Species | # events |
|---|---|---|---|---|
| U-shape | surface | horizontal acceleration slightly below the surface; rapid upward pitch change to emerge from water (Whitehead, 1985a) | humpback | 1 |
| humpback, juv. | 80 | |||
| minke | 17 | |||
| grey | 1 | |||
| V-shape | surface | powered or unpowered descent; abrupt, upward change of direction to start ascent | humpback | 21 |
| humpback, juv. | 18 | |||
| minke | 4 | |||
| Bryde’s | 2 | |||
| sperm | 5 | |||
| right | 2 | |||
| J-shape | depth | slow ascent from depth; abrupt rapid acceleration towards surface | humpback | 4 |
| humpback, juv. | 4 | |||
| sperm | 1 | |||
| I-shape | depth | holding station at depth; abrupt, rapid acceleration towards surface | humpback | 20 |
| humpback, juv. | 4 | |||
| minke | 1 | |||
| right | 2 |
Table 3
Kinematic and energetic parameters for five breaches and five high performance lunges performed by five humpback whales spanning a range of sizes.
Length (m) | Mass (kg) | Emergence (%) | Duration (secs) | Final velocity (m/s) | Stroke freq (Hz) | Energy (MJ) | Max power (kW) | |||||
|---|---|---|---|---|---|---|---|---|---|---|---|---|
| Breach | Breach | Lunge | Breach | Lunge | Breach | Lunge | Breach | Lunge | Breach | Lunge | ||
| 7.8 | 7000 | 86 | 8.0 | 6.8 | 6.2 | 5.3 | 0.7 | 0.5 | 0.9 | 0.7 | 5 | 5 |
| 10.5 | 17000 | 79 | 8.1 | 4.7 | 7.1 | 5.0 | 0.6 | 0.4 | 2.8 | 1.2 | 15 | 10 |
| 12.7 | 30000 | 61 | 9.1 | 2.9 | 6.0 | 5.0 | 0.4 | 0.3 | 3.7 | 1.6 | 23 | 18 |
| 14.7 | 46000 | 84 | 8.5 | 3.3 | 8.2 | 4.8 | 0.5 | 0.3 | 9.8 | 2.6 | 50 | 25 |
| 14.8 | 46000 | 82 | 12.7 | 6.1 | 8.1 | 5.4 | 0.5 | 0.2 | 10.3 | 3.6 | 38 | 23 |
Additional files
-
Supplementary file 1
Parameters used to calculate the energetics of breaching and lunge feeding, in humpback whales.
(A) Lower and upper bounds of daily Field Metabolic Rate (FMRdaily) for five humpback whales across a range of sizes.
FMRdaily, WM was calculated using the equation for marine mammal FMRdaily proposed by Williams and Maresh (2015). FMRdaily, Nagy was calculated using the equation for terrestrial mammal FMRdaily proposed by Nagy (2005) and multiplied by 1.5. The cost of a high-performance breach and a single high-performance lunge are expressed as percentage of daily energy budget. B) Kinematic and morphological parameters used to calculate the energetics of breaching and lunge feeding.
- https://cdn.elifesciences.org/articles/51760/elife-51760-supp1-v1.docx
-
Transparent reporting form
- https://cdn.elifesciences.org/articles/51760/elife-51760-transrepform-v1.pdf
Download links
A two-part list of links to download the article, or parts of the article, in various formats.
Downloads (link to download the article as PDF)
Open citations (links to open the citations from this article in various online reference manager services)
Cite this article (links to download the citations from this article in formats compatible with various reference manager tools)
Energetic and physical limitations on the breaching performance of large whales
eLife 9:e51760.
https://doi.org/10.7554/eLife.51760


