Cortical encoding of melodic expectations in human temporal cortex
- Laboratoire des systèmes perceptifs, Département d’études cognitives, École normale supérieure, PSL University, CNRS, France
- Department of Psychology, New York University, United States
- Institut de Neurosciences des Système, UMR S 1106, INSERM, Aix Marseille Université, France
- UCL Ear Institute, United Kingdom
- Department of Electrical Engineering, Columbia University, United States
- Mortimer B Zuckerman Mind Brain Behavior Institute, Columbia University, United States
- Department of Neurosurgery, Zucker School of Medicine at Hofstra/Northwell, United States
- Feinstein Institute of Medical Research, Northwell Health, United States
- Institute for Systems Research, Electrical and Computer Engineering, University of Maryland, United States
Figures
Figure 1
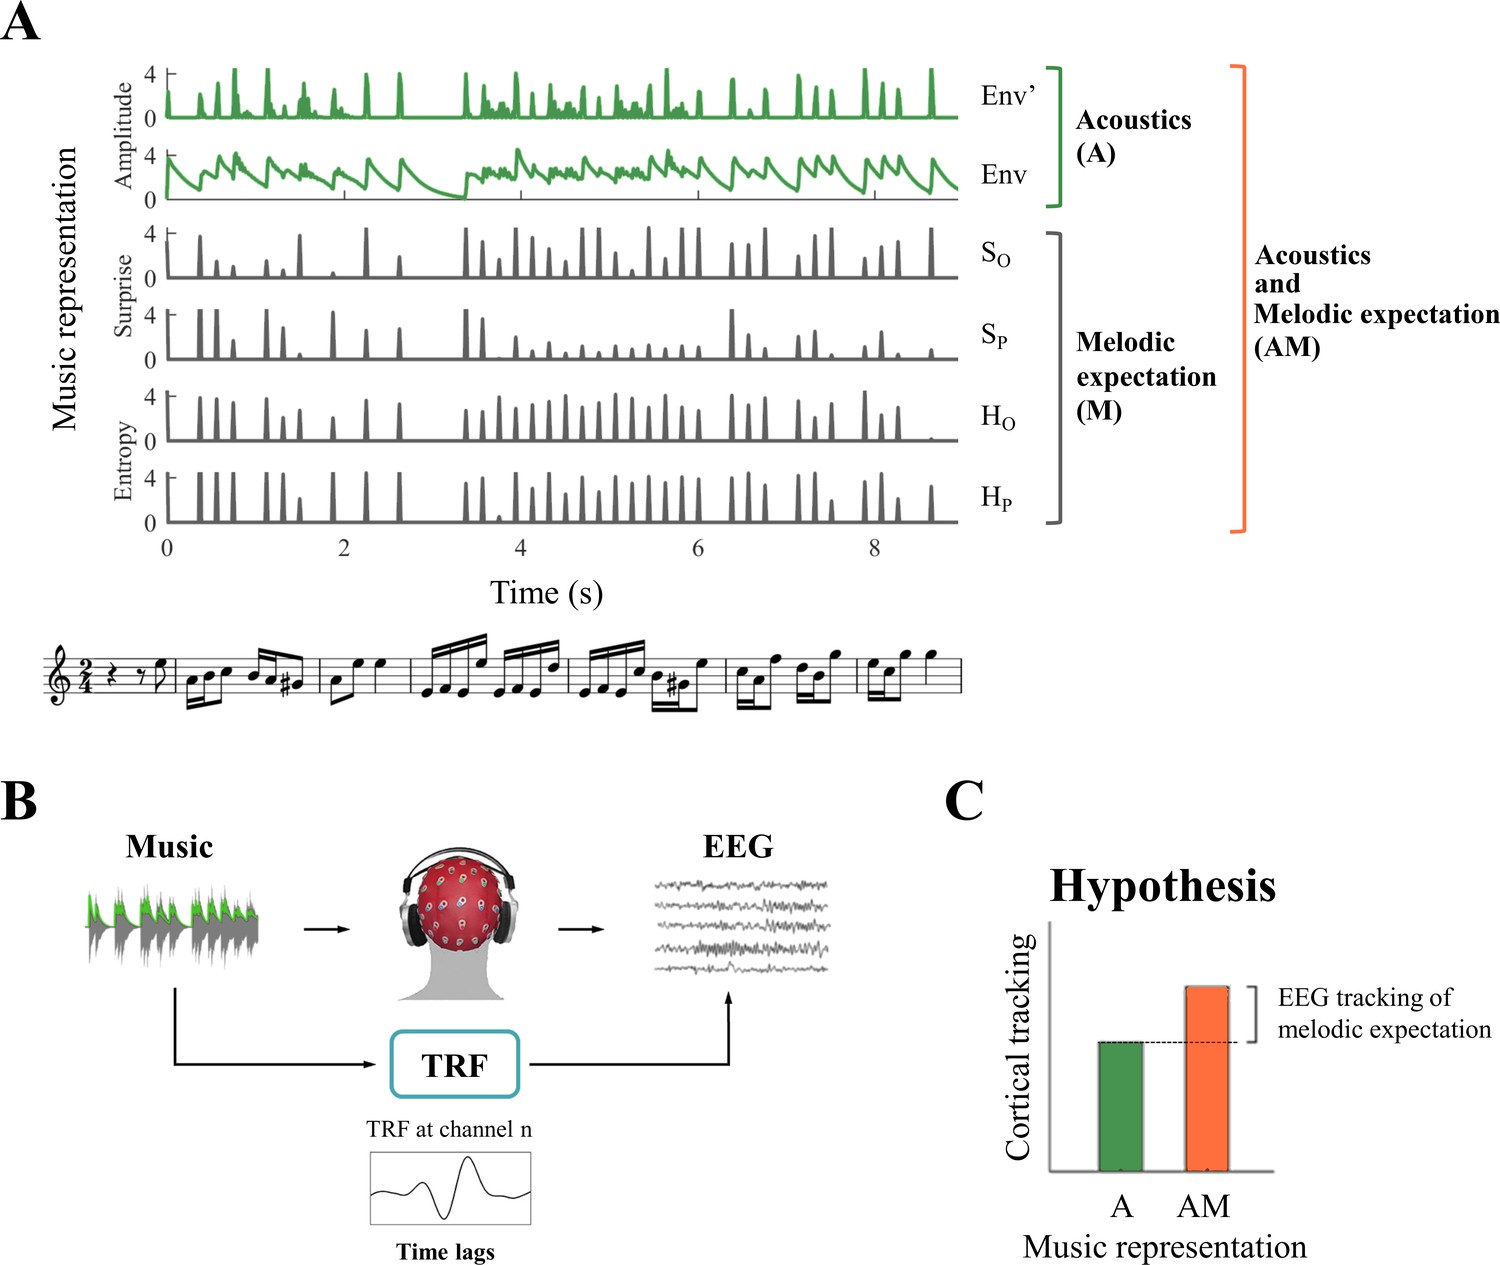
System identification framework for isolating neural correlates of melodic expectations.
(A) Music score of a segment of auditory stimulus, with its corresponding features (from bottom to top): acoustic envelope (Env), half-way rectified first derivative of the envelope (Env’), and the four melodic expectation features: entropy of note-onset (Ho) and pitch (Hp), surprise of note-onset (So) and pitch (Sp). (B) Regularized linear regression models were fit to optimally describe the mapping from stimulus features (Env in the example) to each EEG and ECoG channel. This approach, called the Temporal Response Function (TRF), allows us to investigate the spatio-temporal dynamics of the linear model by studying the regression weights for different EEG and ECoG channels and time-latencies. (C) TRFs were used to predict EEG and ECoG signals on unseen data by using only acoustic features (A) and a combination of acoustic and melodic expectation features (AM). We hypothesised that cortical signals encode melodic expectations, therefore we expected larger EEG and ECoG predictions for the combined feature-set AM.
Figure 2 with 1 supplement
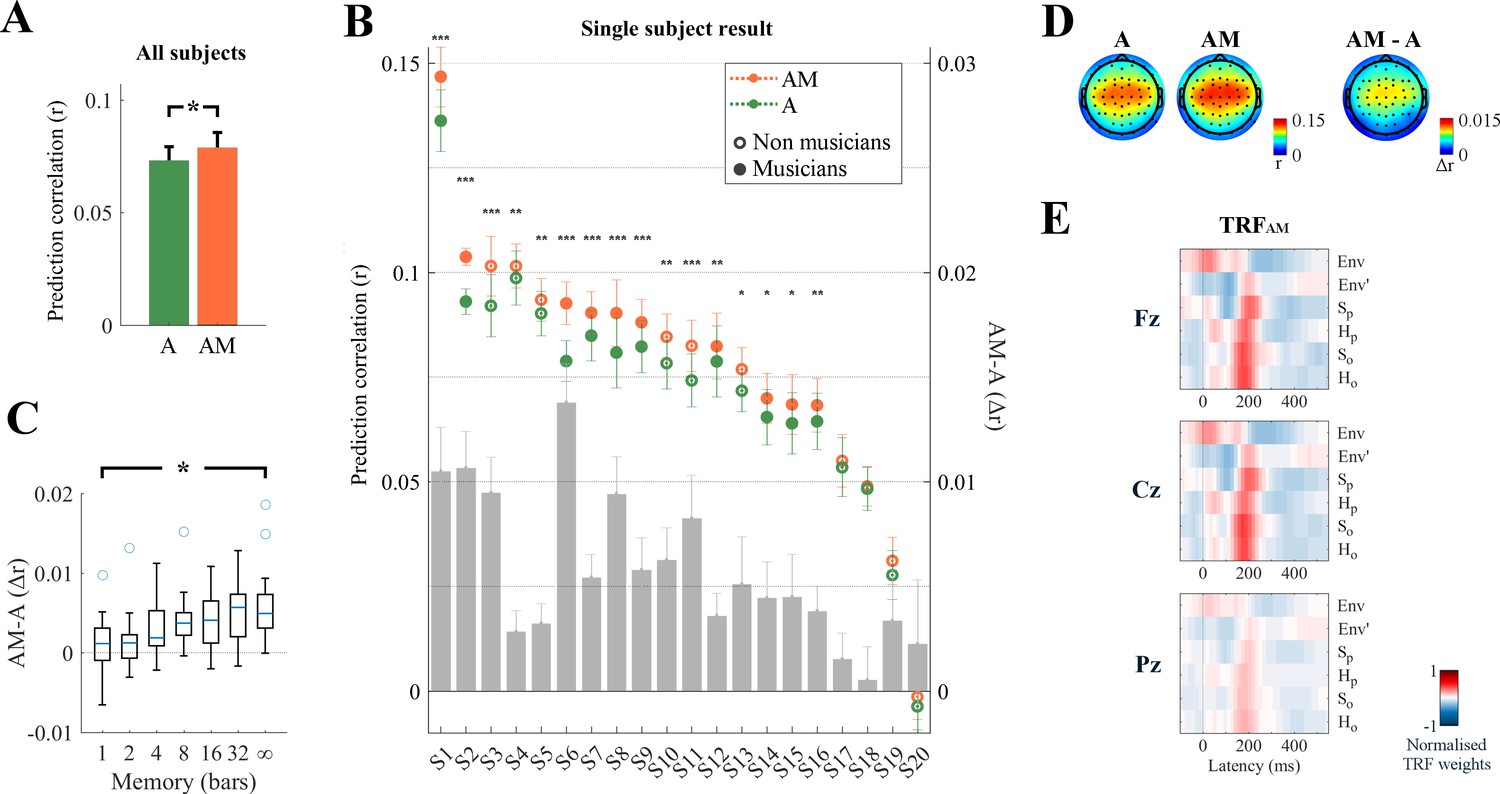
Low-rate (1–8 Hz) cortical signals reflect melodic expectations.
Scalp EEG data were recorded while participants listened to monophonic music. Forward ridge regression models were fit to assess what features of the stimulus were encoded in the low-rate EEG signal. The link between music features and EEG was assessed by using these models to predict unseen EEG data. (A) Prediction correlations were greatest when the stimulus was described by a combination of acoustic information (A: envelope Env, and its half-way rectified first derivative Env’) and melodic expectations (M: SP, SO, HP, HO). This effect of expectations was significant on the average prediction correlation across all 64 EEG electrodes (*p<10−6). The error bars indicate the SEM across participants. (B) The enhancement due to melodic expectations emerged at the individual subject level. The gray bars indicate the predictive enhancement due to melodic expectation. Error bars indicate the SEM over trials (***p<0.001, **p<0.01, *p<0.05, permutation test). (C) Predictive enhancement due to melodic expectations (AM-A; y-axis) increased with the length of the local context (in bars; x-axis) used to estimate the expectation of each note (ANOVA: *p=0.0003). The boxplot shows the 25th and 75th percentiles, with the whiskers extending to the most extreme data-points that were not considered outliers. Circles indicate outliers. (D) The effect of melodic expectations (rAM-rA) emerged bilaterally on the same scalp areas that showed also envelope tracking. (E) Ridge regression weights for TRFAM. Red and blue colors indicate positive and negative TRF components respectively.
Figure 2—figure supplement 1
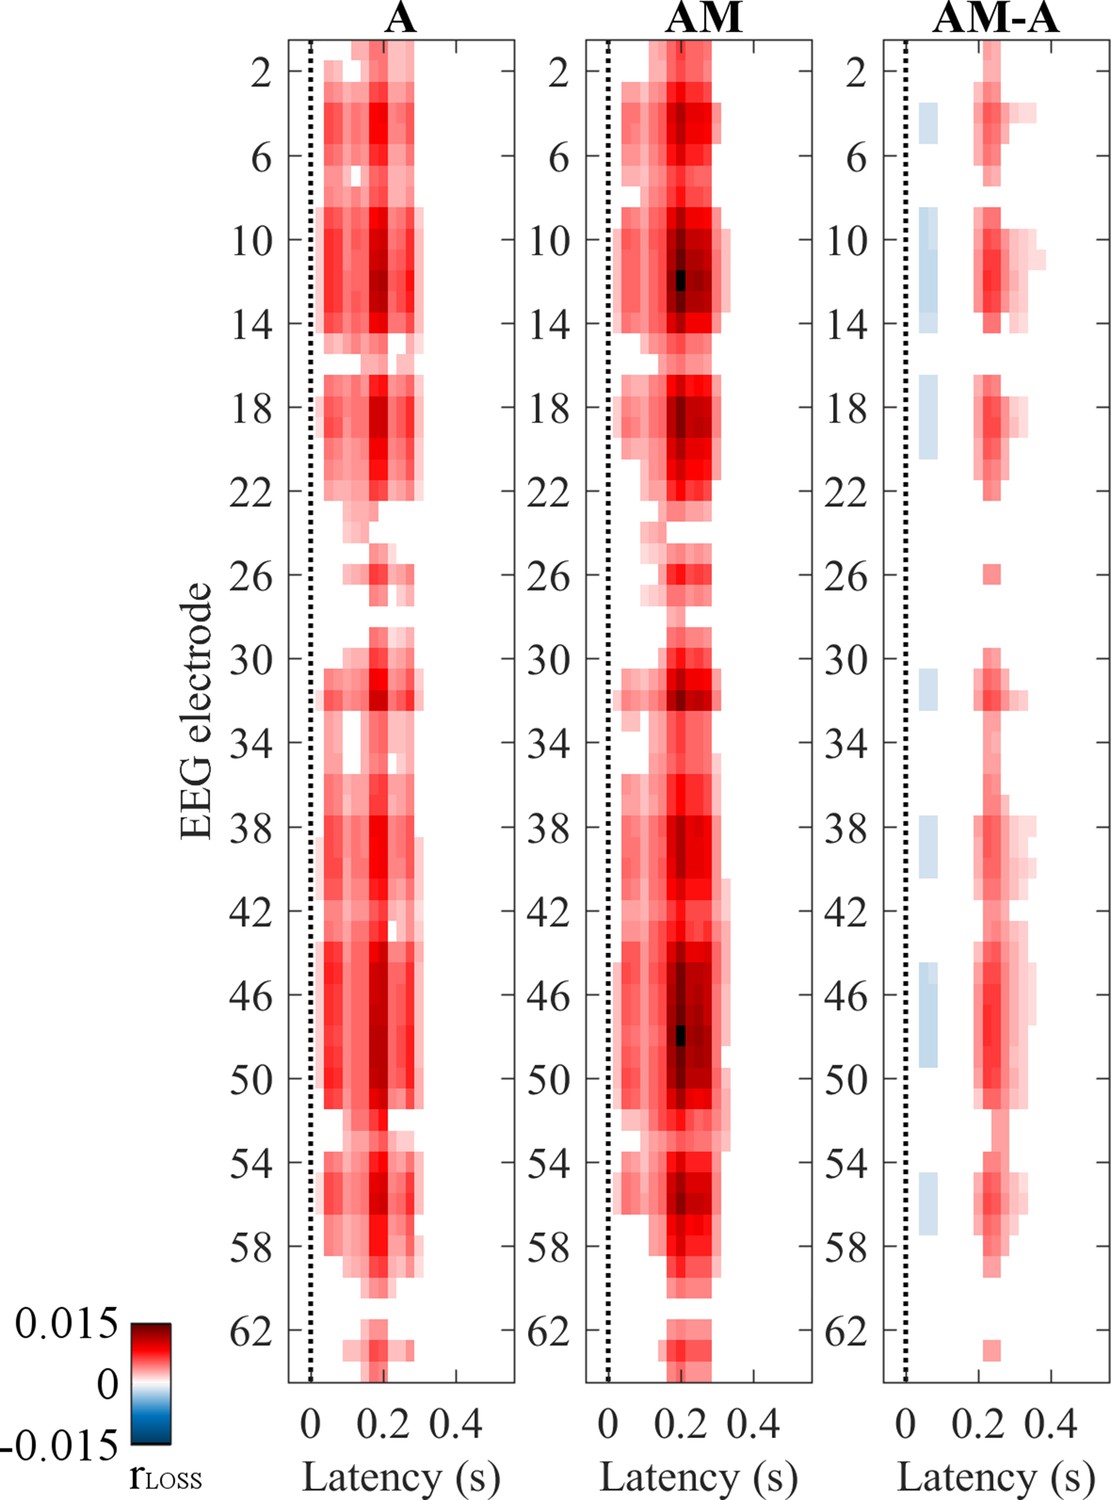
The latency of the effect of melodic expectations on the low-rate EEG data (1–8 Hz) was assessed by measuring the loss in EEG prediction correlation when a given time-latency window is removed from the TRF fit.
This loss was calculated for a sliding 50ms-long latency window and was plotted as a heat-map for each electrode. White colored pixels indicate non-significant results (p>0.05, cluster-mass statistics). Red color indicates a larger loss, thus a stronger importance, of a particular time-latency window. The x-axis indicates the centre of the time-latency window.
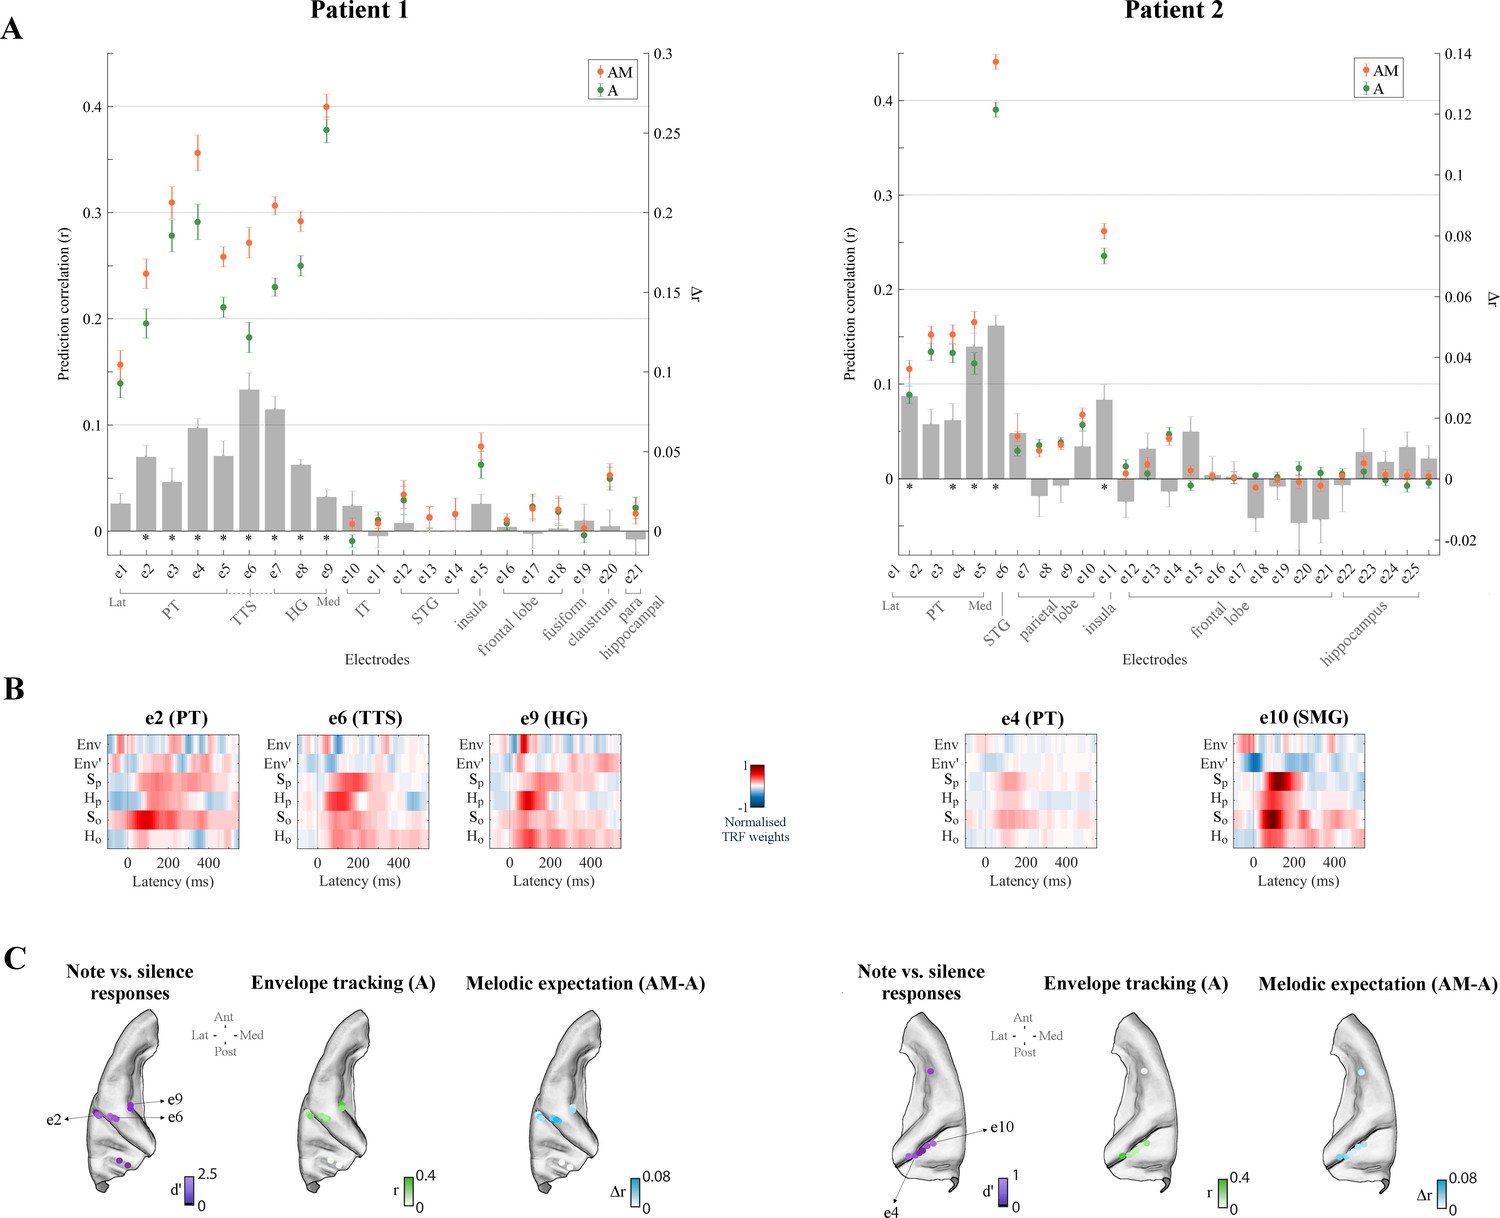
Figure 3 with 1 supplement
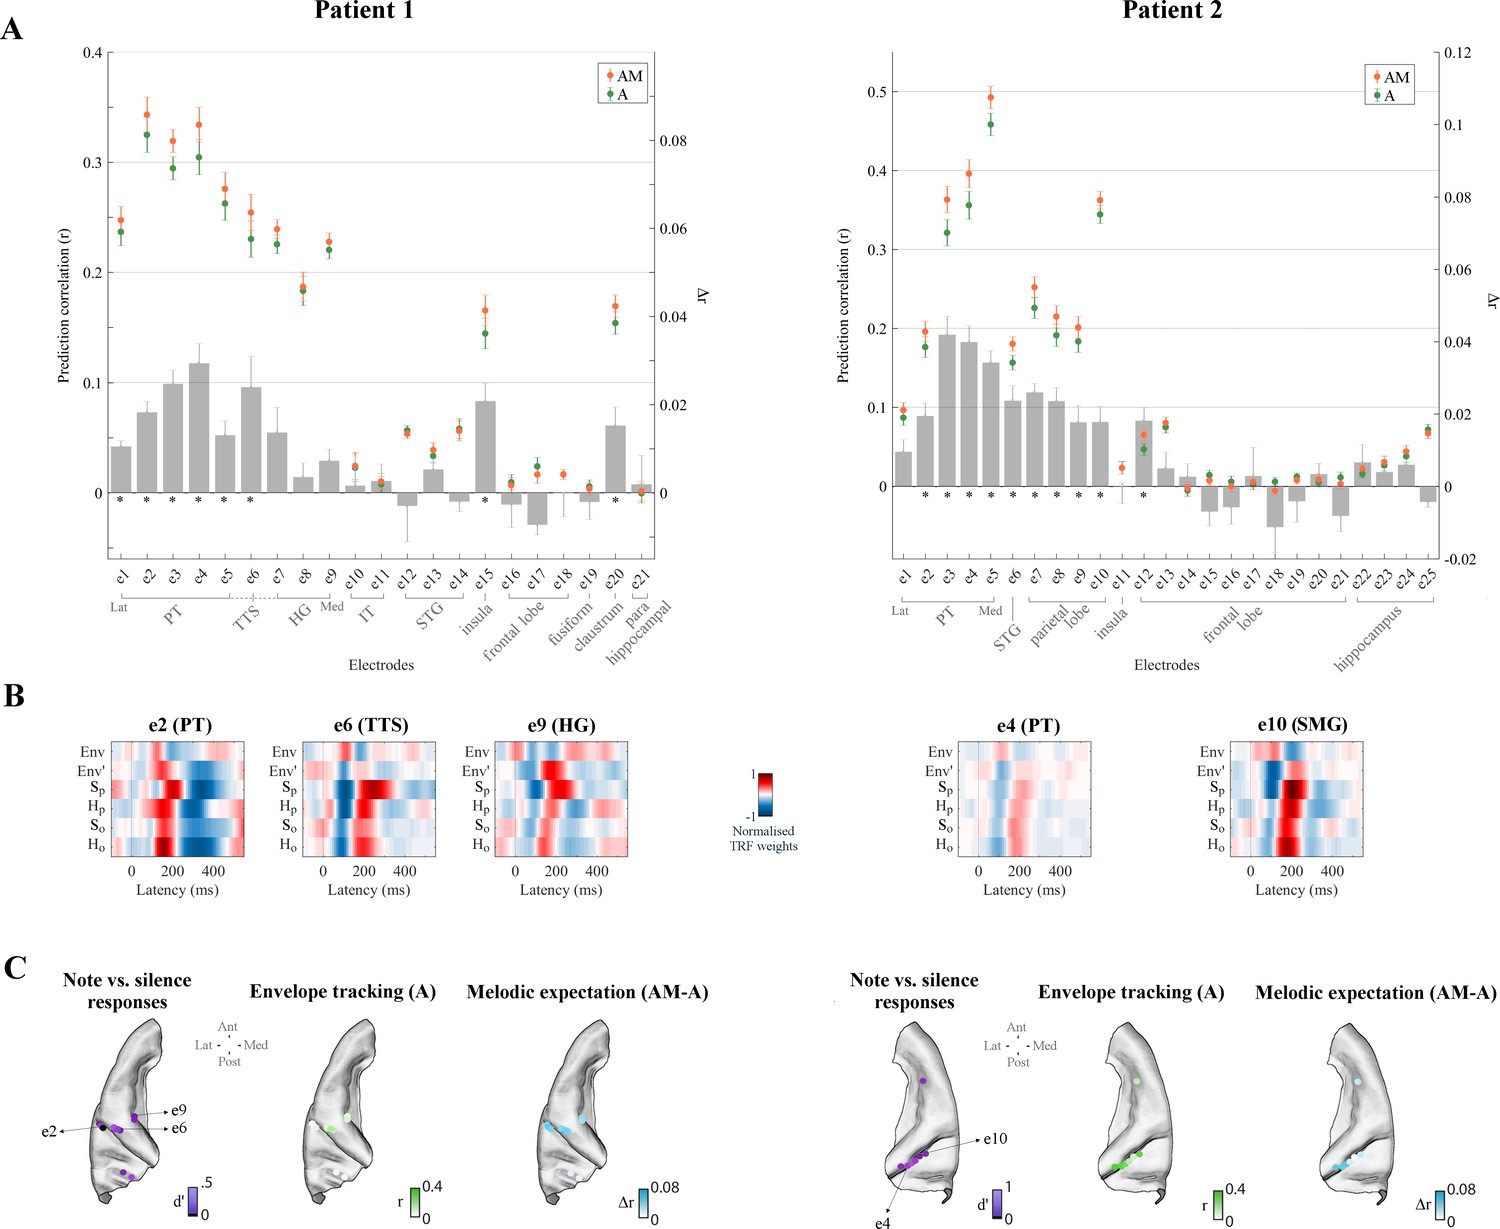
Low-rate (1–8 Hz) cortical signals in bilateral temporal cortex reflect melodic expectations.
Electrocorticography (ECoG) data were recorded from three epilepsy patients undergoing brain surgery. Magnetic resonance imaging was used to localise the ECoG electrodes. Electrodes with stronger low-rate or high-γ (70–150 Hz) responses to monophonic music than to silence were selected (Cohen’s d > 0.5). (A) ECoG prediction correlations for individual electrodes for A and AM. Electrodes within each group, as indicated by the gray square brackets, were sorted from lateral to medial cortical sites. The gray bars indicate the predictive enhancement due to melodic expectation (rAM-rA). Error bars indicate the SEM over trials (*p<0.01, FDR-corrected permutation test). (B) TRF weights for selected electrodes. For Patient 1, PT and TTS electrodes (e1-e5 and e6 respectively) exhibited large effects of musical expectations, while HG electrodes (e7-e9) had strong envelope tracking (A) but showed smaller effects of expectations that did not reach statistical significance. Patient two showed also strong envelope tracking and a significant effect of melodic expectations in the right temporal and parietal lobes (for example, the PT electrode e4 and the SMG electrode e10 respectively). (C) Low-rate (1–8 Hz) ECoG segments time-locked to note onsets were selected and compared with segments corresponding to silence. Colors in the first brain plot of each patient indicate the effect-size of the note vs. silence comparison (Cohen’s d > 0.5). The second brain plot shows the EEG prediction correlations when using acoustic features only (A). The third brain plot depicts the increase in EEG predictions when including melodic expectation features (AM-A).
Figure 3—figure supplement 1

Bilateral electrocorticography (ECoG) results for Patient 3.
Electrodes with stronger low-rate (1–8 Hz) or high-γ (70–150 Hz) time-locked responses to musical notes than to silence were selected (Cohen’s d > 0.5). (A) Low-rate ECoG prediction correlations for individual electrodes for A and AM. Electrodes within each group, as indicated by the gray square brackets, were sorted from lateral to medial cortical sites. The gray bars indicate the predictive enhancement due to melodic expectation (rAM-rA). Error bars indicate the SEM over trials (*p<0.01, FDR-corrected permutation test). (B) ECoG electrodes that showed stronger time-locked responses to notes than to silence. The three plots show the effect-size of the note vs. silence response comparison for low-rate (1–8 Hz) ECoG signals (left), the EEG prediction correlations when using acoustic features only (A) (right), and the contrast between EEG predictions for AM and A (bottom).
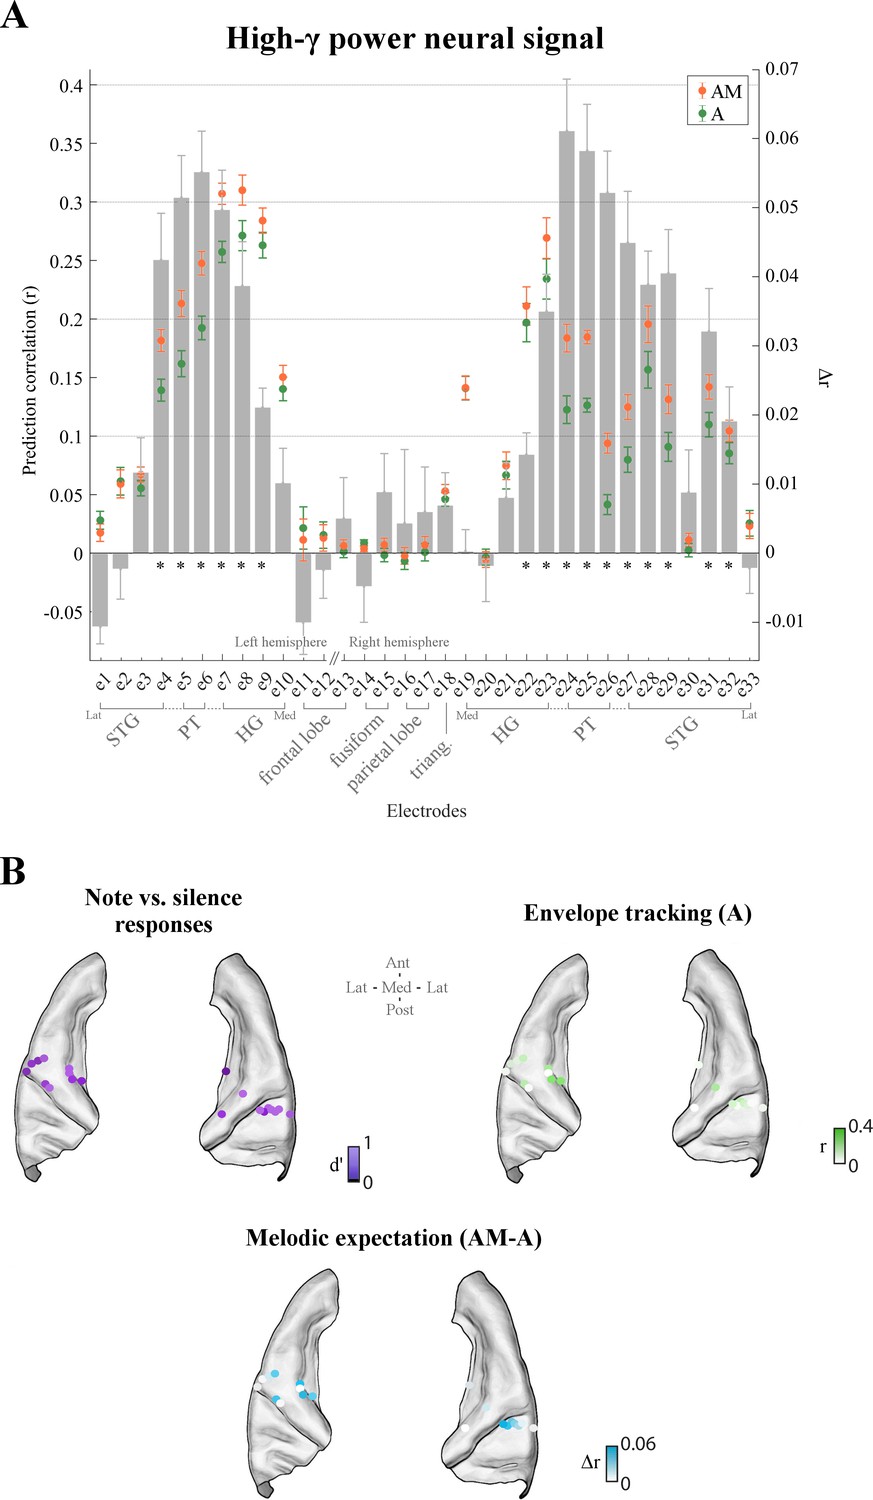
Figure 4 with 1 supplement
High-γ neural signals in bilateral temporal cortex reflect melodic expectations.
Electrodes with stronger low-rate (1–8 Hz) or high-γ (70–150 Hz) responses to monophonic music than to silence were selected (Cohen’s d > 0.5). (A) ECoG prediction correlations for individual electrodes for A and AM. Electrodes within each group, as indicated by the gray square brackets, were sorted from lateral to medial cortical sites. The gray bars indicate the predictive enhancement due to melodic expectation (rAM-rA). Error bars indicate the SEM over trials (*p<0.01, FDR-corrected permutation test). (B) Normalised TRF weights for selected electrodes (same electrodes as for Figure 3). For Patient 1, the HG electrode e9 showed the strongest envelope tracking and small effect of melodic expectations, while e6 in TTS exhibited the largest effect of expectations (Δr6 > Δr9, p=1.8e−4, d = 2.38). For Patient 2, both e4 (PT) and e10 (SMG) electrodes showed strong envelope tracking and a significant effect of melodic expectations. (C) High-γ (70–150 Hz) ECoG segments time-locked to note onsets were selected and compared with segments corresponding to silence. Colors in the first brain plot of each patient indicate the effect-size of the note vs. silence comparison (Cohen’s d > 0.5). The second brain plot shows the EEG prediction correlations when using acoustic features only (A). The third brain plot depicts the increase in EEG predictions when including melodic expectation features (AM-A).
Figure 4—figure supplement 1
Bilateral electrocorticography (ECoG) results for Patient 3.
Electrodes with stronger low-rate (1–8 Hz) or high-γ (70–150 Hz) time-locked responses to musical notes than to silence were selected (Cohen’s d > 0.5). (A) High-γ ECoG prediction correlations for individual electrodes for A and AM. Electrodes within each group, as indicated by the gray square brackets, were sorted from lateral to medial cortical sites. The gray bars indicate the predictive enhancement due to melodic expectation (rAM-rA). Error bars indicate the SEM over trials (*p<0.01, FDR-corrected permutation test). (B) ECoG electrodes that showed stronger time-locked responses to notes than to silence. The three plots show the effect-size of the note vs. silence response comparison for high-γ (70–150 Hz) ECoG signals (left), the EEG prediction correlations when using acoustic features only (A) (right), and the contrast between EEG predictions for AM and A (bottom).
Figure 5 with 1 supplement
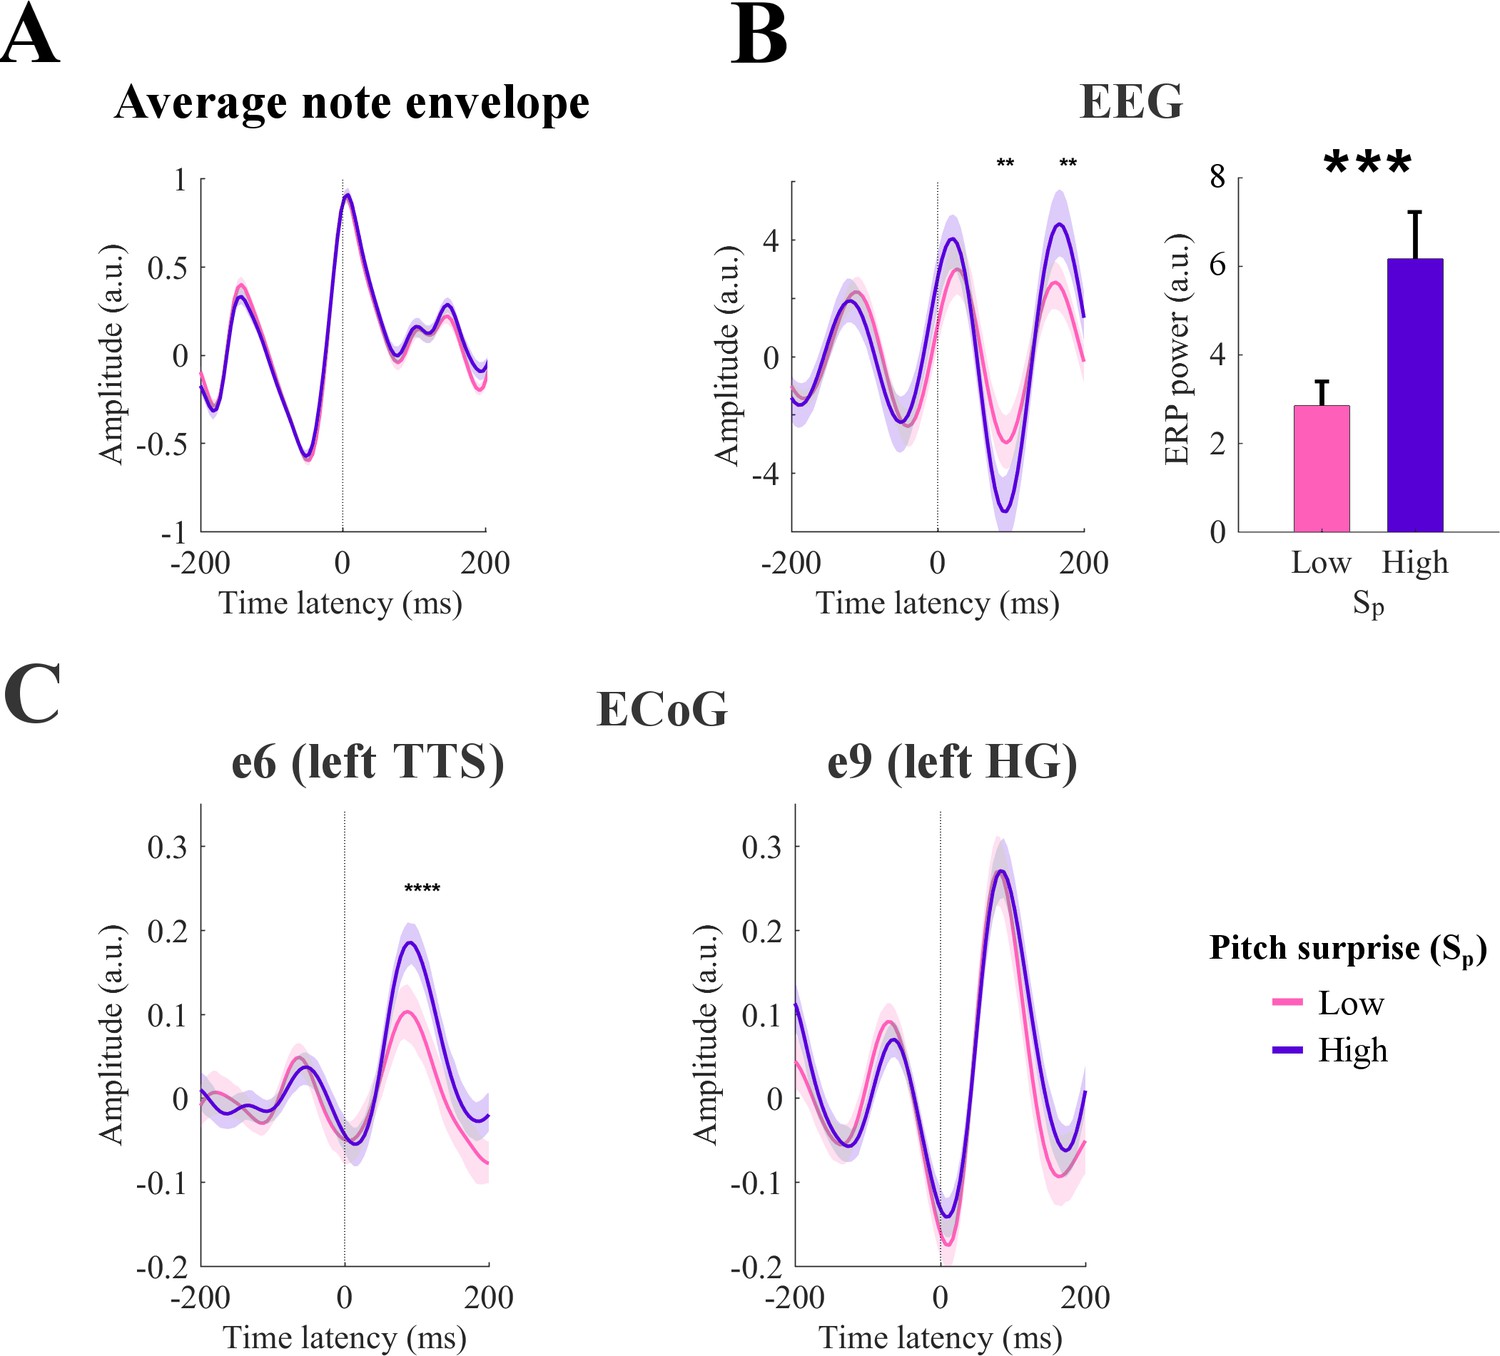
Event-related potentials (ERP) analysis.
(A) Notes with equal peak envelope were selected (median envelope amplitude across all notes with a tolerance of ±5%). Together, the selected elements were 25% of all notes. Notes were grouped according to the corresponding pitch surprise values (Sp). The figure shows the average sound envelope for the 20% notes with lowest and highest surprise values. Shaded areas indicate the 95% confidence interval. (B) Low-rate EEG signals time-locked to note-onset were selected for high and low Sp values. ERPs for channel Cz are shown on the left. Shaded areas indicate the 95% confidence interval (across subjects). Stars indicate significant differences between ERPs for high and low surprise for a given note onset-EEG latency (permutation test, p<0.05, FDR-corrected). The right panel shows the total ERP power for the latencies from 0 to 200 ms (*p<0.001, permutation test). Error-bars indicate the SEM across subjects. (C) ERPs for high-γ ECoG data from left TTS and HG (Patient 1). Stars indicate significant differences between ERPs for high and low surprise for a given note onset-EEG latency (permutation test, p<0.05, FDR-corrected). Shaded areas indicate the 95% confidence interval (across individual trials, that is responses to single notes).
Figure 5—figure supplement 1
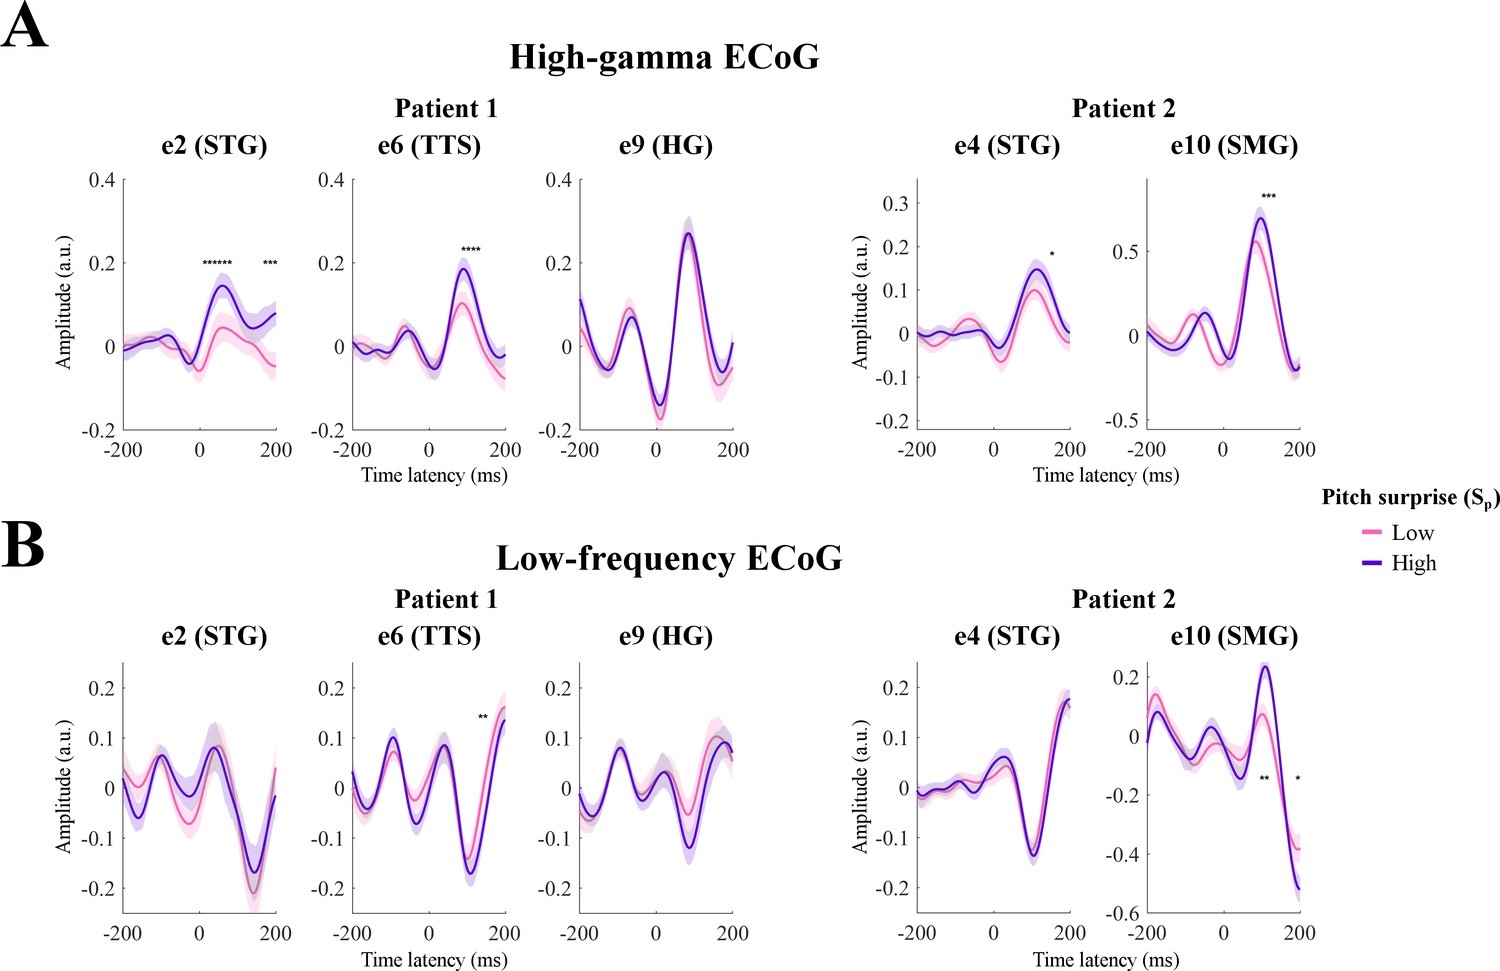
Event-related potentials (ERP) analysis.
(A) Musical notes with equal envelope amplitude (within 5% of the median amplitude for all notes) were selected. Together, this corresponds to the 25% of all data. Musical notes were grouped in five bins according to Sp. ERPs for high-γ ECoG data for selected electrodes from patients 1 and 2. Stars indicate significance (p<0.05, unpaired two-samples Wilcoxon test, uncorrected values). (B) ERPs for low-rate ECoG data.
Figure 6 with 1 supplement
Distinct cortical encoding of pitch and note onset-time during naturalistic music listening.
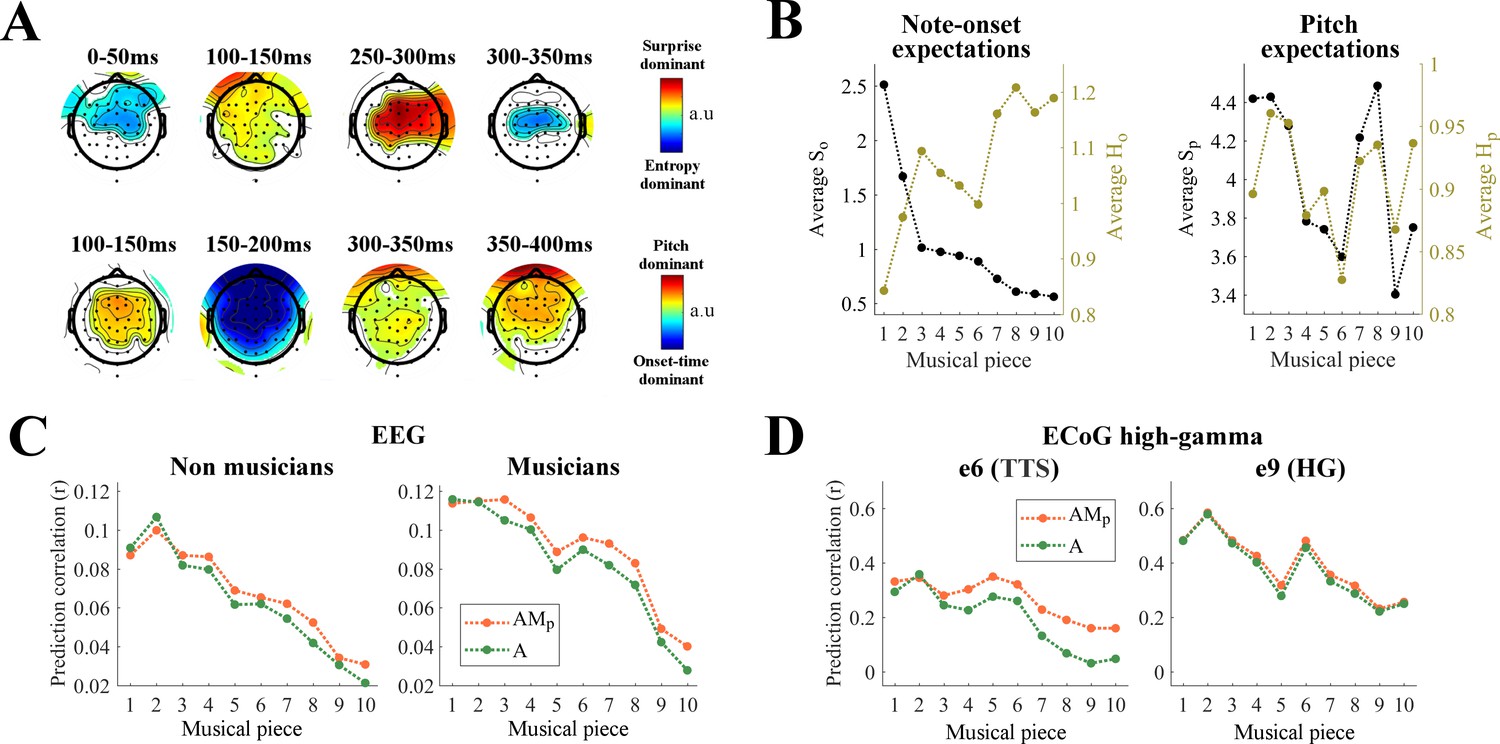
(A) Contrasts at each EEG channel of the TRF weights for surprise vs. entropy (top) and pitch vs. onset-time (bottom) in TRFAM. Colors indicate significant differences (p<0.05, permutation test, FDR-corrected) (B) Average surprise and entropy of note-onsets (So and Ho) and of pitch (Sp and Hp) for each musical piece. Musical pieces were sorted based on So, where lower average So indicates musical pieces with more predictable tempo. (C) Cortical tracking of music changes with overall surprise of note onset-time within a musical piece. Single-trial EEG prediction result (average across all channels) for musicians (Nm = 10) and non-musicians (Nn = 10). Trials were sorted as in panel B. (D) Single-trial ECoG prediction correlations for the surgery Patient one for two electrodes of interest.
Figure 6—figure supplement 1
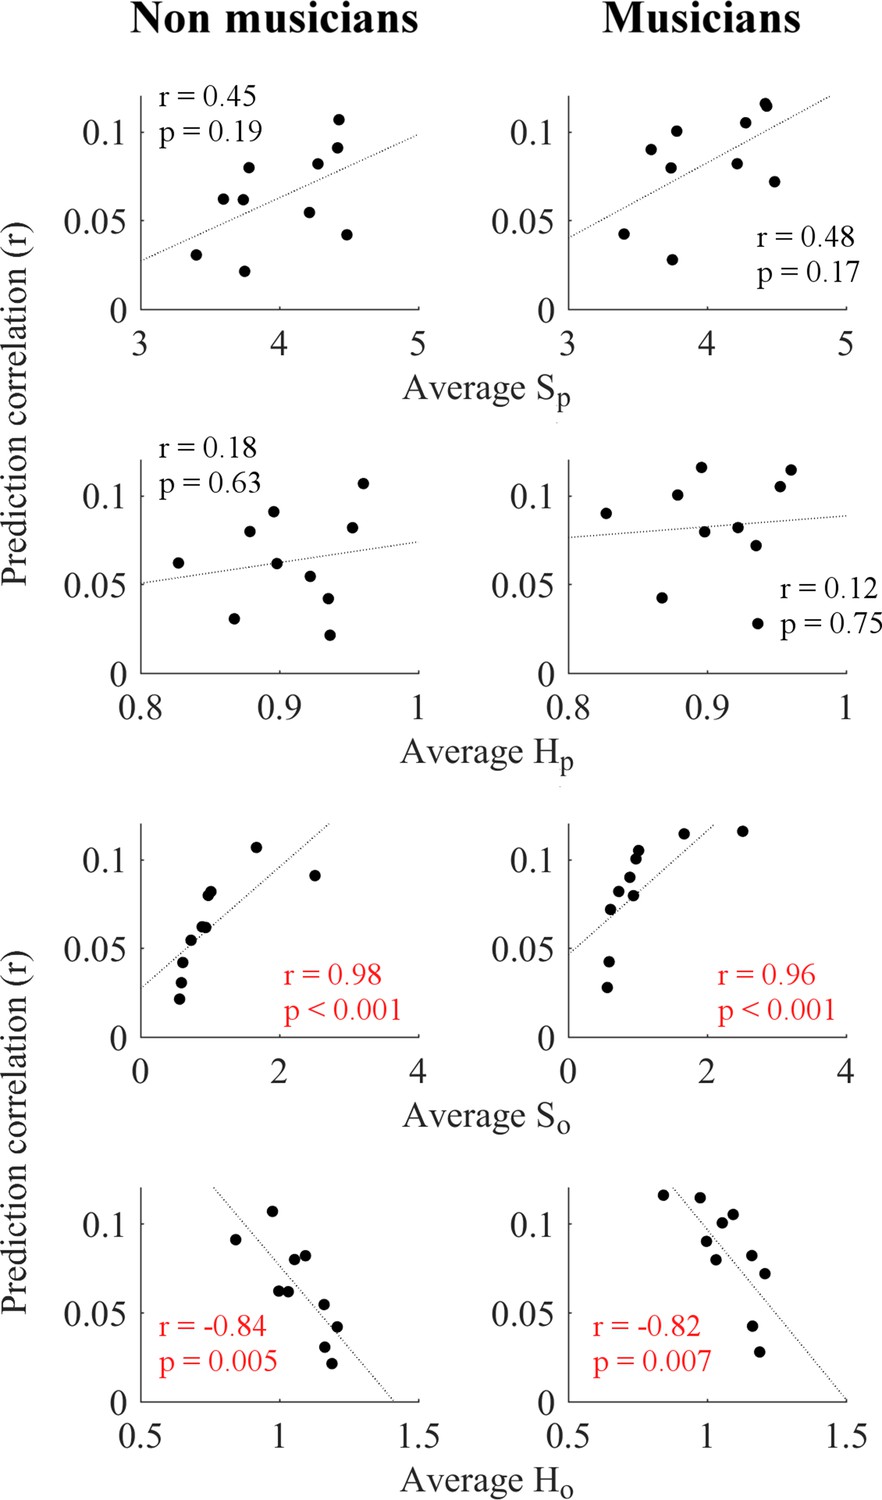
Scatter plots indicating the correlation between EEG prediction correlation using the acoustic regressors A for each musical piece and the average expectation score (Sp, Hp, So, or Ho) for all notes of the corresponding piece.
Significant correlations were highlighted in red. Results are shown for non-musicians and musicians separately.
Figure 7
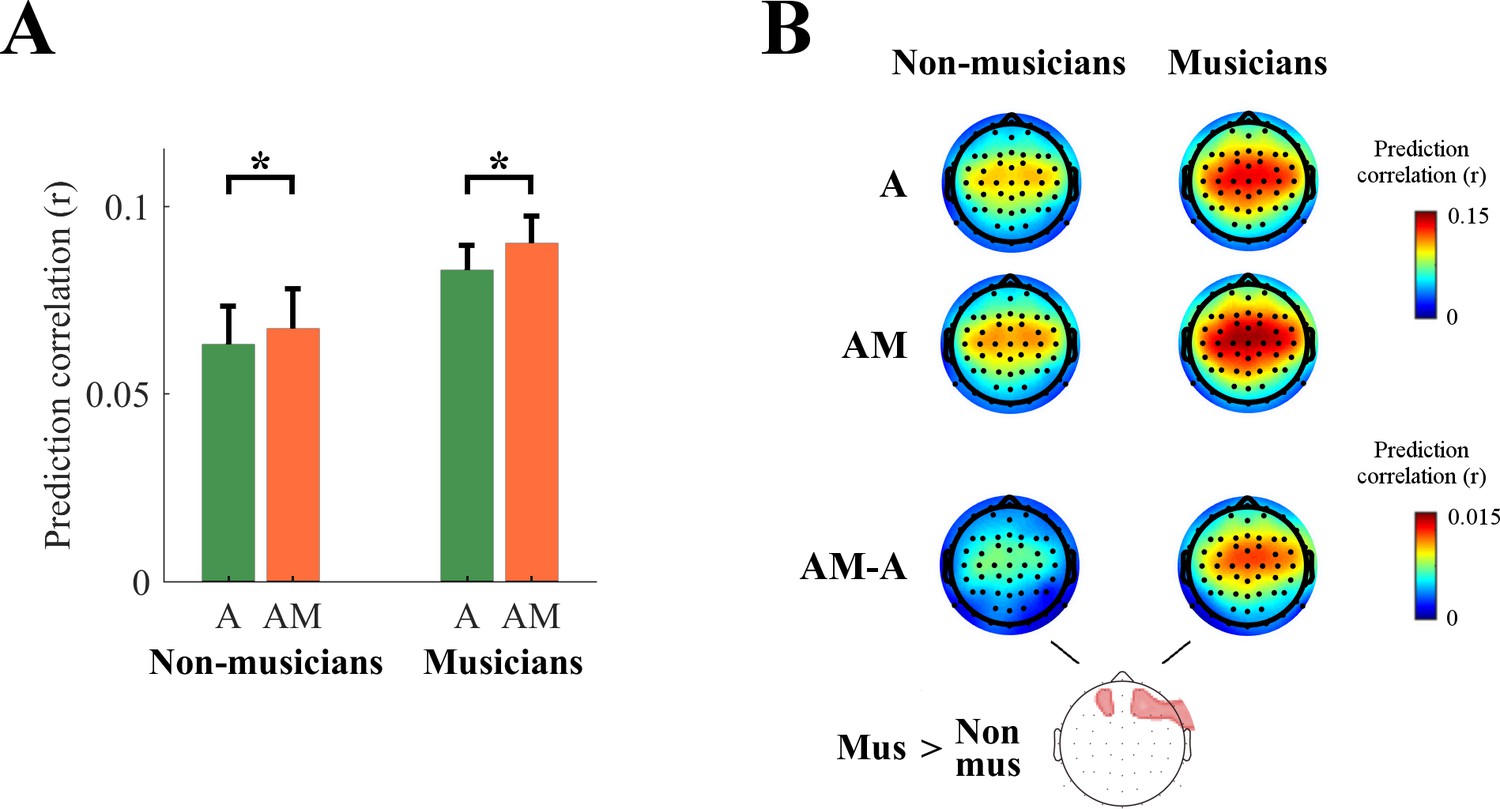
Effect of musical expertise on the low-rate encoding of melodic expectations.
(A) EEG prediction correlations (average across all scalp channels) for musicians and non-musicians (*p<10−5). The error bars indicate the SEM across participants. (B) EEG prediction correlations for individual scalp electrodes (red color indicates stronger prediction correlations) for A, AM, and AM-A. A cluster statistics found a stronger effect of melodic expectations for musicians.
Videos
Video 1
Video showing the ECoG electrode placement in 3D for each of the three participants.
Dots indicate ECoG channels. Red dots indicate channels that were responsive to the music input. The corresponding interactive Matlab 3D plots were also uploaded.
Video 2
Video showing the ECoG electrode placement in 3D for each of the three participants.
Dots indicate ECoG channels. Red dots indicate channels that were responsive to the music input. The corresponding interactive Matlab 3D plots were also uploaded.
Video 3
Video showing the ECoG electrode placement in 3D for each of the three participants.
Dots indicate ECoG channels. Red dots indicate channels that were responsive to the music input. The corresponding interactive Matlab 3D plots were also uploaded.
Additional files
-
Supplementary file 1
Tables indicating the coordinates (MNI) of the intracranial electrodes for each patient.
- https://cdn.elifesciences.org/articles/51784/elife-51784-supp1-v1.docx
-
Supplementary file 2
Matlab interactive 3D plots showing the ECoG electrode placement for the first ECoG patient.
Dots indicate ECoG channels. Red dots indicate channels that were responsive to the music input.
- https://cdn.elifesciences.org/articles/51784/elife-51784-supp2-v1.zip
-
Supplementary file 3
Matlab interactive 3D plots showing the ECoG electrode placement for the second ECoG patient.
Dots indicate ECoG channels. Red dots indicate channels that were responsive to the music input.
- https://cdn.elifesciences.org/articles/51784/elife-51784-supp3-v1.zip
-
Supplementary file 4
Matlab interactive 3D plots showing the ECoG electrode placement for the third ECoG patient.
Dots indicate ECoG channels. Red dots indicate channels that were responsive to the music input.
- https://cdn.elifesciences.org/articles/51784/elife-51784-supp4-v1.zip
-
Transparent reporting form
- https://cdn.elifesciences.org/articles/51784/elife-51784-transrepform-v1.docx
Download links
A two-part list of links to download the article, or parts of the article, in various formats.
Downloads (link to download the article as PDF)
Open citations (links to open the citations from this article in various online reference manager services)
Cite this article (links to download the citations from this article in formats compatible with various reference manager tools)
Cortical encoding of melodic expectations in human temporal cortex
eLife 9:e51784.
https://doi.org/10.7554/eLife.51784


