Nicotinamide mononucleotide adenylyltransferase uses its NAD+ substrate-binding site to chaperone phosphorylated Tau
- Interdisciplinary Research Center on Biology and Chemistry, Shanghai Institute of Organic Chemistry, Chinese Academy of Sciences, China
- University of the Chinese Academy of Sciences, China
- Department of Molecular and Cellular Pharmacology, University of Miami Miller School of Medicine, United States
- Bio-X-Renji Hospital Research Center, Renji Hospital, School of Medicine, Shanghai Jiao Tong University, China
- Bio-X Institutes, Key Laboratory for the Genetics of Developmental and Neuropsychiatric Disorders, Ministry of Education, Shanghai Jiao Tong University, China
- Department of Neurology, Molecular Biology Institute, and Brain Research Institute, University of California, Los Angeles, United States
- School of Pharmacy, Key Laboratory of Molecular Pharmacology and Drug Evaluation (Yantai University), Ministry of Education, Collaborative Innovation Center of Advanced Drug Delivery System and Biotech Drugs in Universities of Shandong, Yantai University, China
- State Key Laboratory of Medical Molecular Biology, Department of Biochemistry and Molecular Biology, Institute of Basic Medical Sciences, Chinese Academy of Medical Sciences & Peking Union Medical College, China
Figures
Figure 1 with 7 supplements

NMNATs inhibit pTau amyloid fibril formation and specifically bind to the phosphorylated sites of pTau.
(A) Domain compositions of Tau23 and K19. The repeat regions are presented as gray boxes. Phosphorylation sites characterized in this work are marked. (B) Inhibition of NMNATs on the amyloid fibril formation of pTau23 (60 μM) by the ThT fluorescence kinetic assay and TEM microscopy. Human NMNATs: hN1, hN2, and hN3; Drosophila Nmnats: PC and PD; mouse NMNAT3: mN3. A gradient concentration of NMNATs were applied as indicated. The data showned correspond to mean ± s.d., with n = 5. The EM images framed in red mean pTau23 only and those in gray mean 1:1 (mol: mol, pTau23:NMNAT). Scale bar: 500 nm. (C) Overlay of 2D 1H-15N HSQC spectra of pK19 alone (100 μM, gray) and pK19 titrated by mN3 (200 μM, red). Signals of pSer residues are enlarged. (D) Residue-specific chemical shift changes of pK19 analyzed based on (c). The domain organization of pK19 is indicated and signals of pSer residues are highlighted in yellow. (E) Residue-specific intensity changes of pK19 (red) and K19 signals (light blue) based on (c) and Figure 1—figure supplement 6a. (F) Binding affinity of pK19/K19 with mN3 measured by BLI. The association and dissociation profiles of pK19/K19 to mN3 (20 μg ml−1) divided by a vertical dash line are shown. Concentrations of pK19/K19 proteins and dissociation constant (KD) are indicated.
-
Figure 1—source data 1
ThT fluorescence profiles of pTau23 in the absence or presence of various NMNATs at the indicated concentrations (Figure 1B).
- https://cdn.elifesciences.org/articles/51859/elife-51859-fig1-data1-v1.xlsx
-
Figure 1—source data 2
Residue-specific chemical shift changes (Figure 1D) and intensity changes (Figure 1E) of pK19 titrated by mN3.
- https://cdn.elifesciences.org/articles/51859/elife-51859-fig1-data2-v1.xlsx
-
Figure 1—source data 3
The association and dissociation response of pK19/K19 to mN3 (Figure 1F).
- https://cdn.elifesciences.org/articles/51859/elife-51859-fig1-data3-v1.xlsx
Figure 1—figure supplement 1
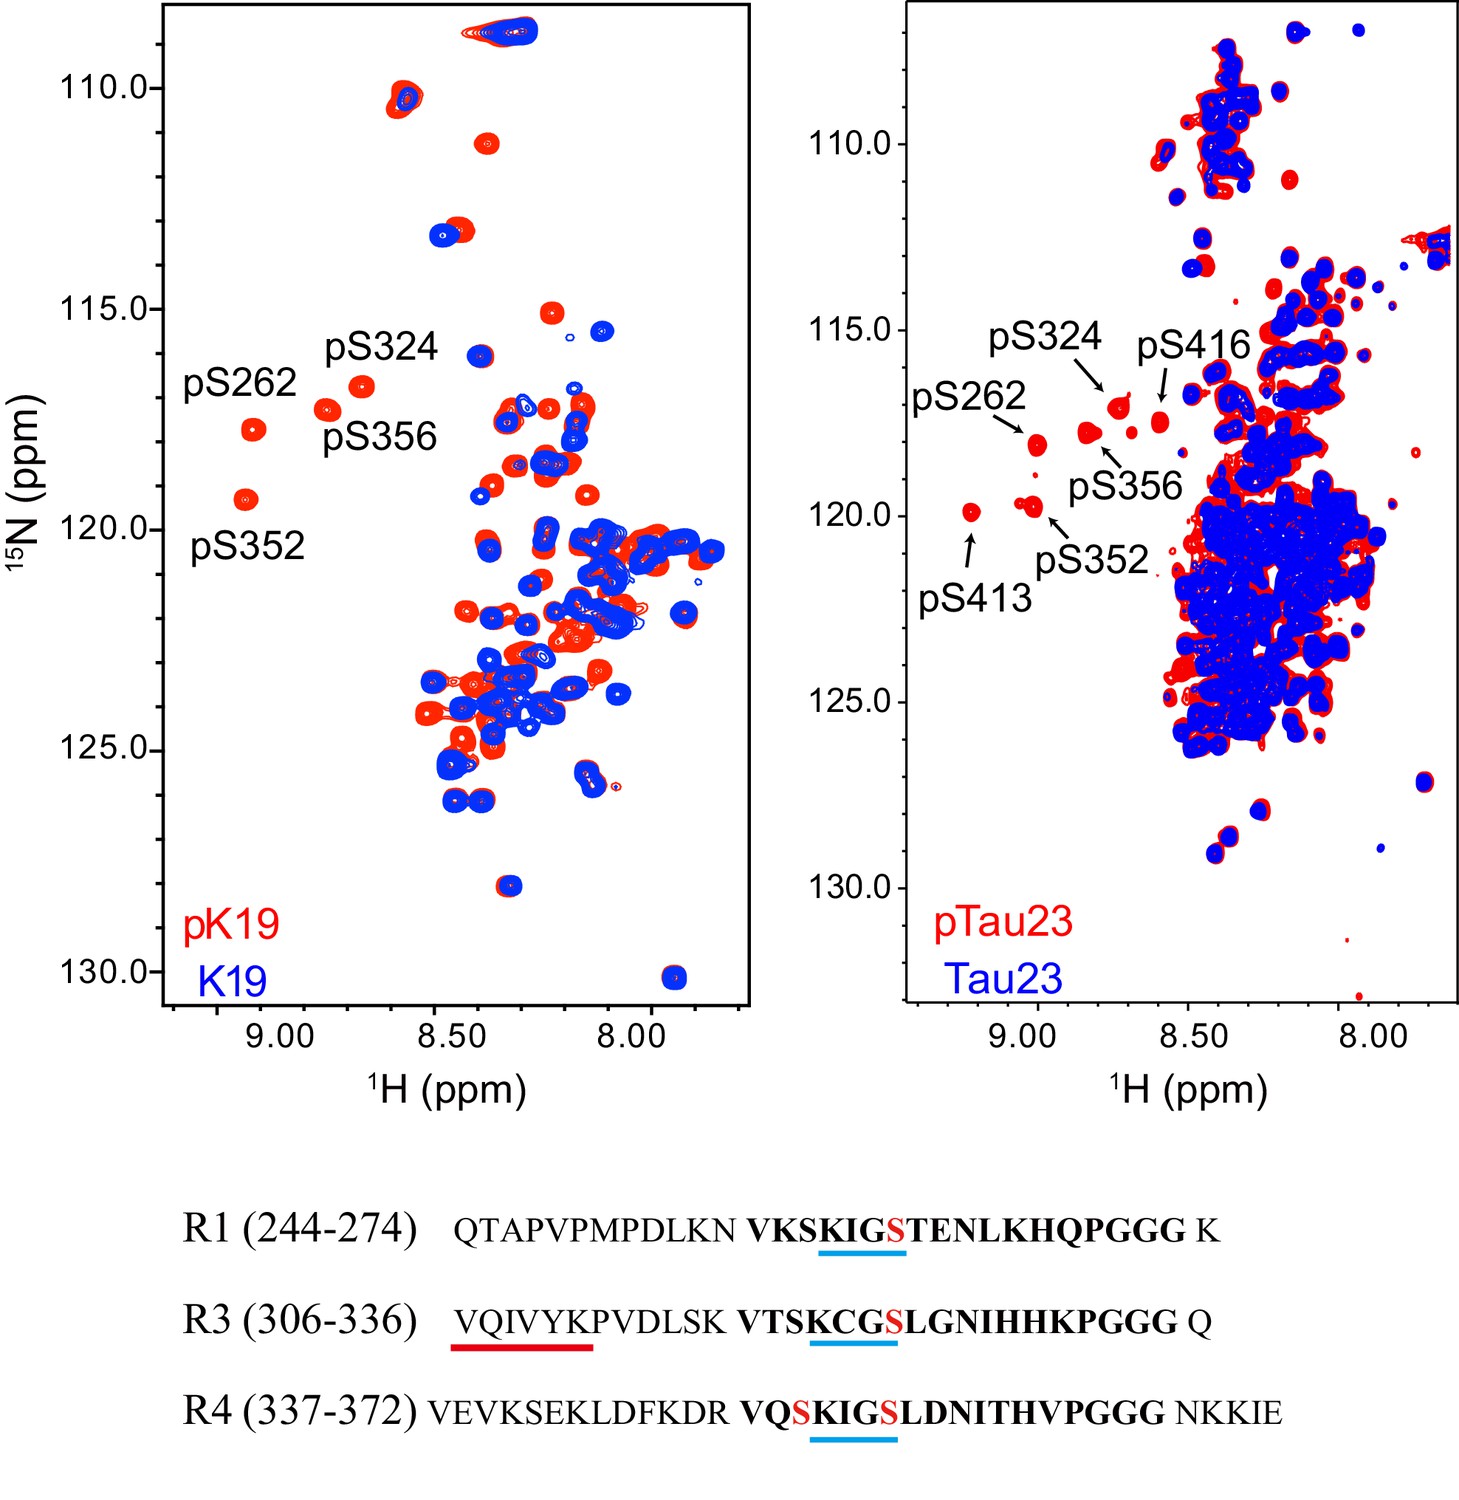
Characterization of MARK2 phosphorylation sites on pK19 (left) and pTau23 (right) by NMR.
Overlay of the 2D 1H-15N HSQC spectra of pK19 (red) and K19 (blue), and pTau23 (red) and Tau23 (blue). The phosphorylated serine residues are labeled. The primary sequences of R1, R3, and R4 are shown. The 18-residue repeats are in bold. The KXGS motifs are underscored with blue lines. The four serine residues that are phosphorylated by MARK2 are highlighted in red. The fibril-forming core sequence is underscored with a red line.
Figure 1—figure supplement 2

Enzyme activities of different isoforms of NMNAT from different organisms.
The data shown correspond to mean ± s.d., with n = 3.
Figure 1—figure supplement 3
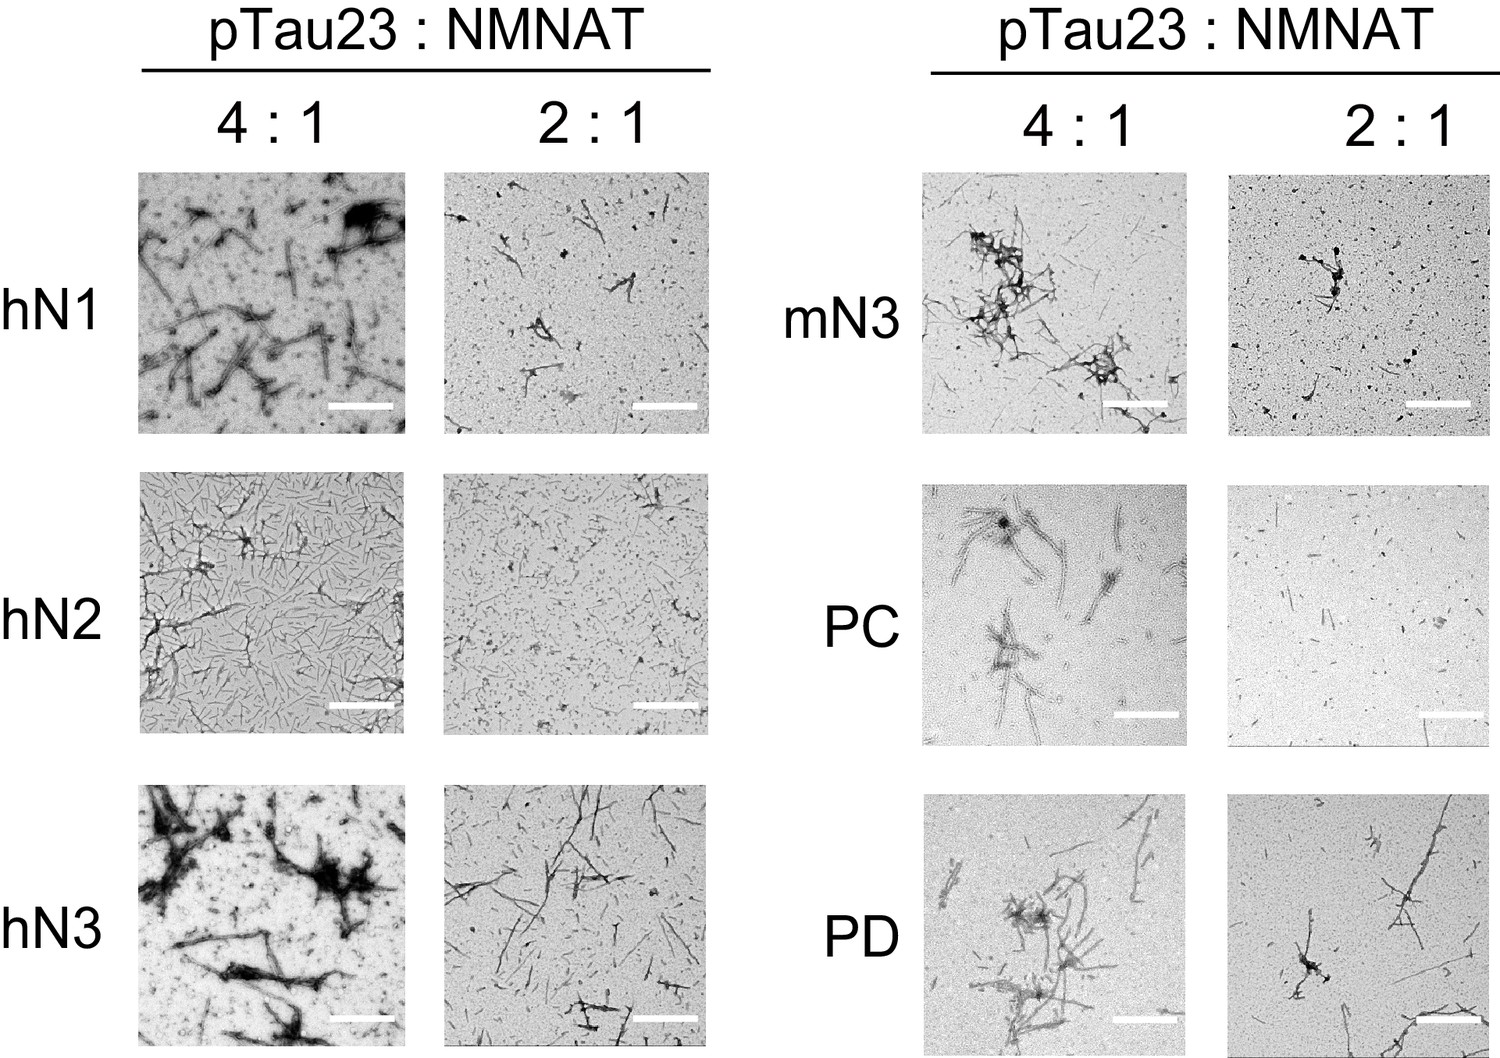
Inhibition of NMNATs on the fibril formation of pTau23 imaged by negative-staining TEM.
Tau fibrils were imaged after pTau23 incubation with NMNATs at 37°C for 60 hr. The molar ratios of pTau23 to NMNATs are indicated. Scale bars: 500 nm.
Figure 1—figure supplement 4
Inhibition of NMNATs on the fibril formation of pK19.
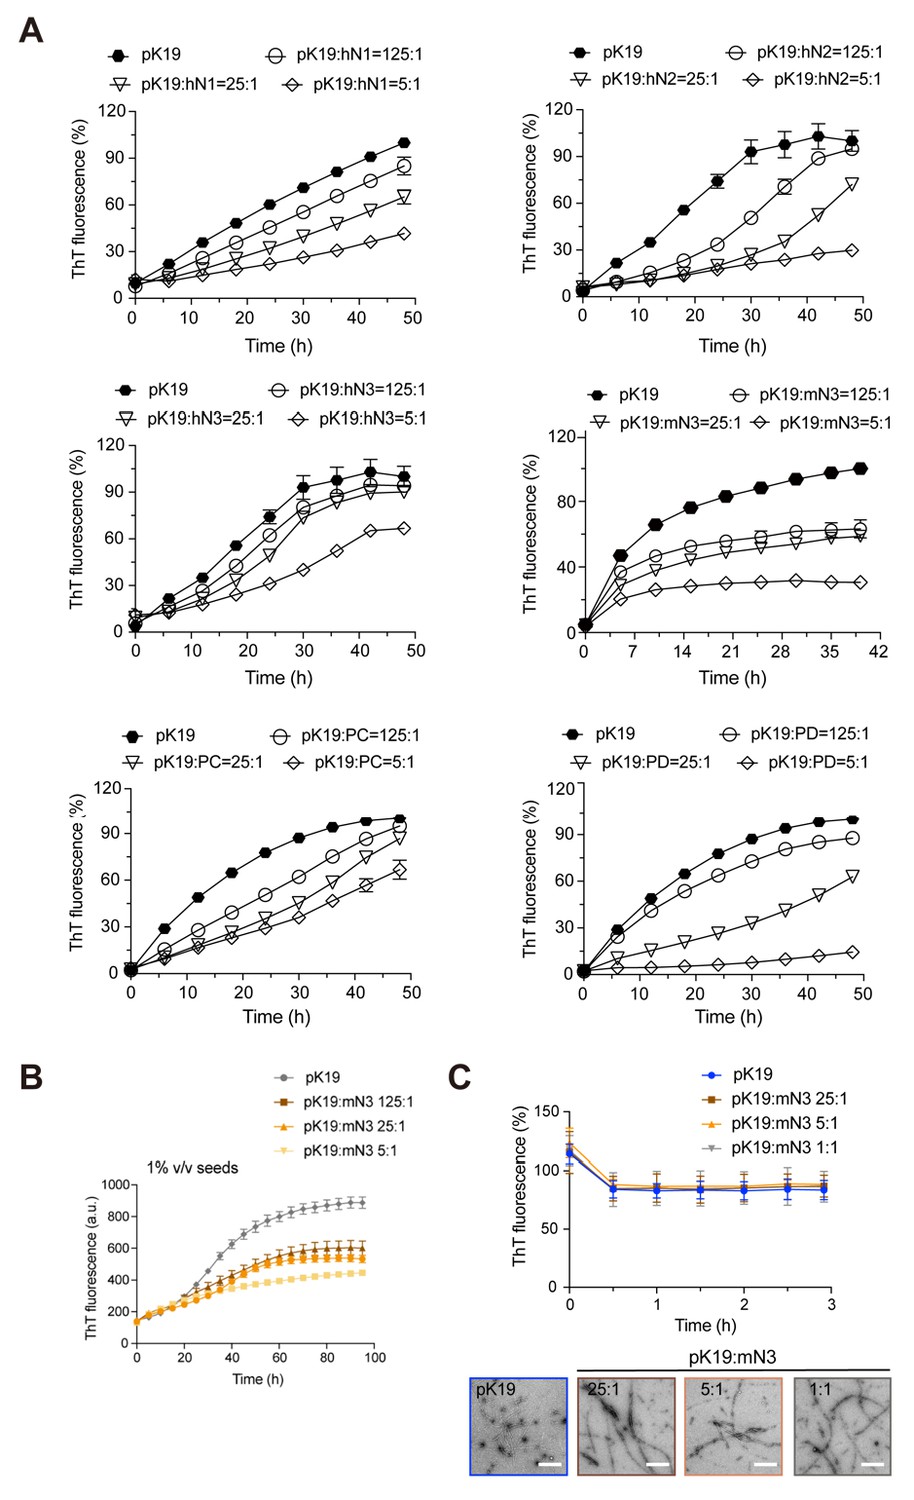
(A) Inhibition of NMNATs on the amyloid fibril formation of pK19 (100 μM) measured by the ThT fluorescence kinetic assay. A gradient concentration of NMNATs was applied as indicated. The data shown correspond to mean ± s.d., with n = 3. (B) ThT fluorescent assay showed the inhibition of mN3 on the fibril formation of pK19 (100 μM) in the presence of 1% (v/v) preformed pK19 fibril seeds. Molar ratios of pK19 to mN3 are indicated. The data shown correspond to mean ± s.d., with n = 5. (C) mN3 exhibits no disaggregation of preformed pK19 fibrils measured by ThT fluorescence assay (upper). The molar ratios of pK19 to mN3 are indicated. Error bars correspond to mean ± s.d., with n = 3. TEM images (lower) show no effect of mN3 on preformed pK19 fibrils. pK19 samples were imaged by TEM after incubation with indicated concentrations of mN3 at 37°C for 3 hr. Scale bars: 500 nm.
Figure 1—figure supplement 5
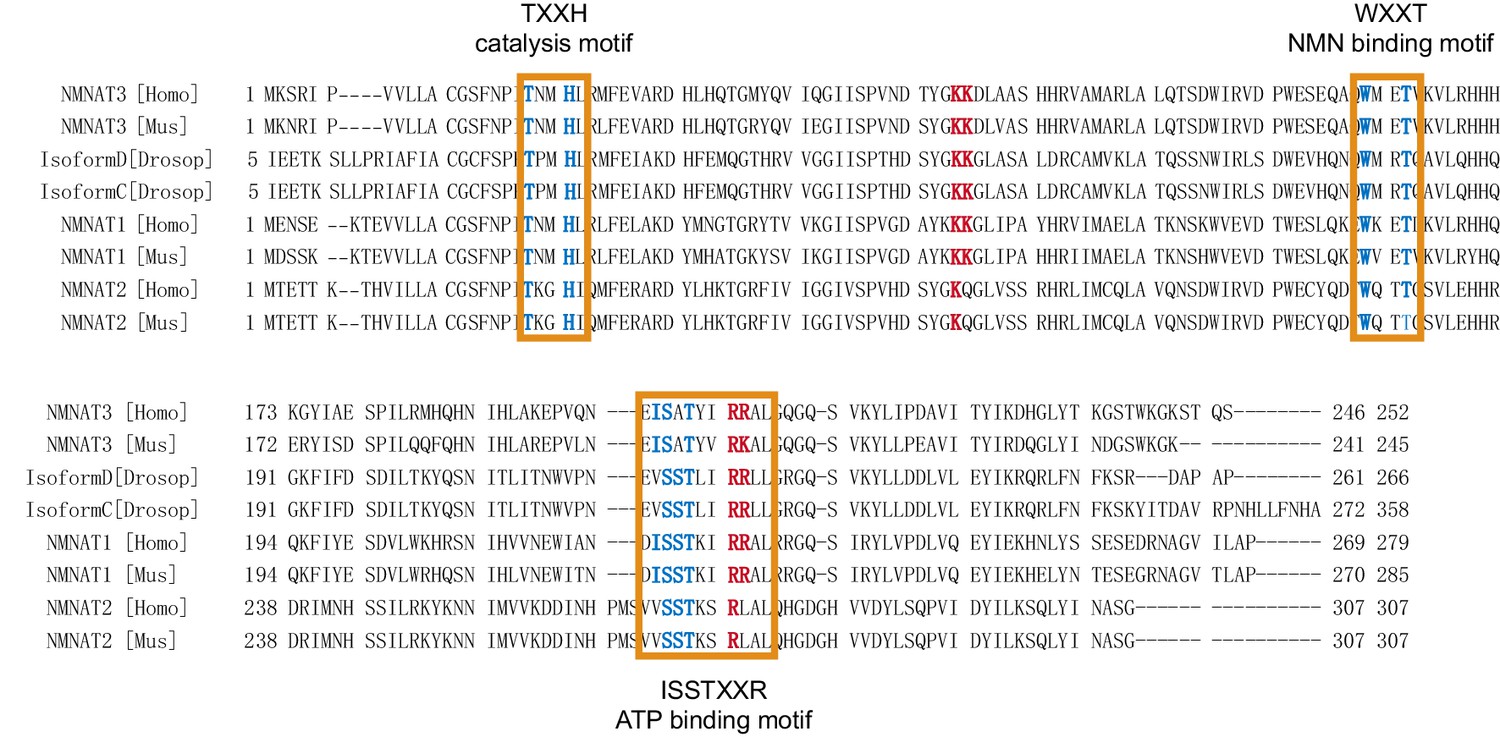
Sequence alignment of NMNATs from different species.
The catalytic and substrate-binding motifs (highlighted with orange frames) are highly conserved and the conserved residues are in blue. The positively charged residues that are essential for the chaperone-like activity are colored in red.
Figure 1—figure supplement 6

NMR titration of NMNAT to Tau.
(A) Overlay of 2D 1H-15N HSQC spectra of K19 alone (100 μM, gray) and K19 titrated by mN3 (blue; molar ratio 1:2). (B) Overlay of 2D 1H-15N HSQC spectra of pTau23 (left)/Tau23(right) alone (100 μM, gray) and that titrated by mN3 (red; molar ratio 1:2). pSer residues are enlarged.
Figure 1—figure supplement 7
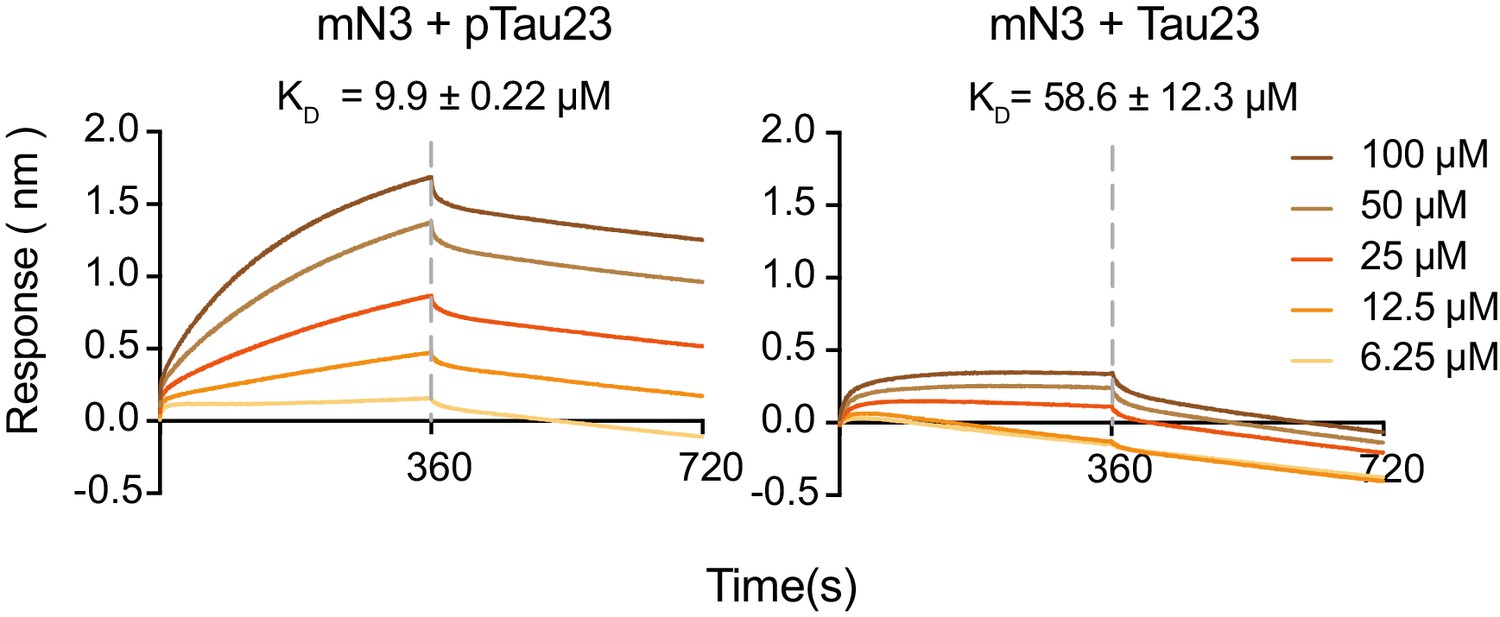
Binding affinity of pTau23 (left) and Tau23 (right) with mN3 measured by BLI.
The SA sensor chip was coated with biotinylated mN3 (20 μg ml−1). The association and dissociation profiles divided by a vertical dash line are shown. The KD values are reported.
Figure 2 with 4 supplements
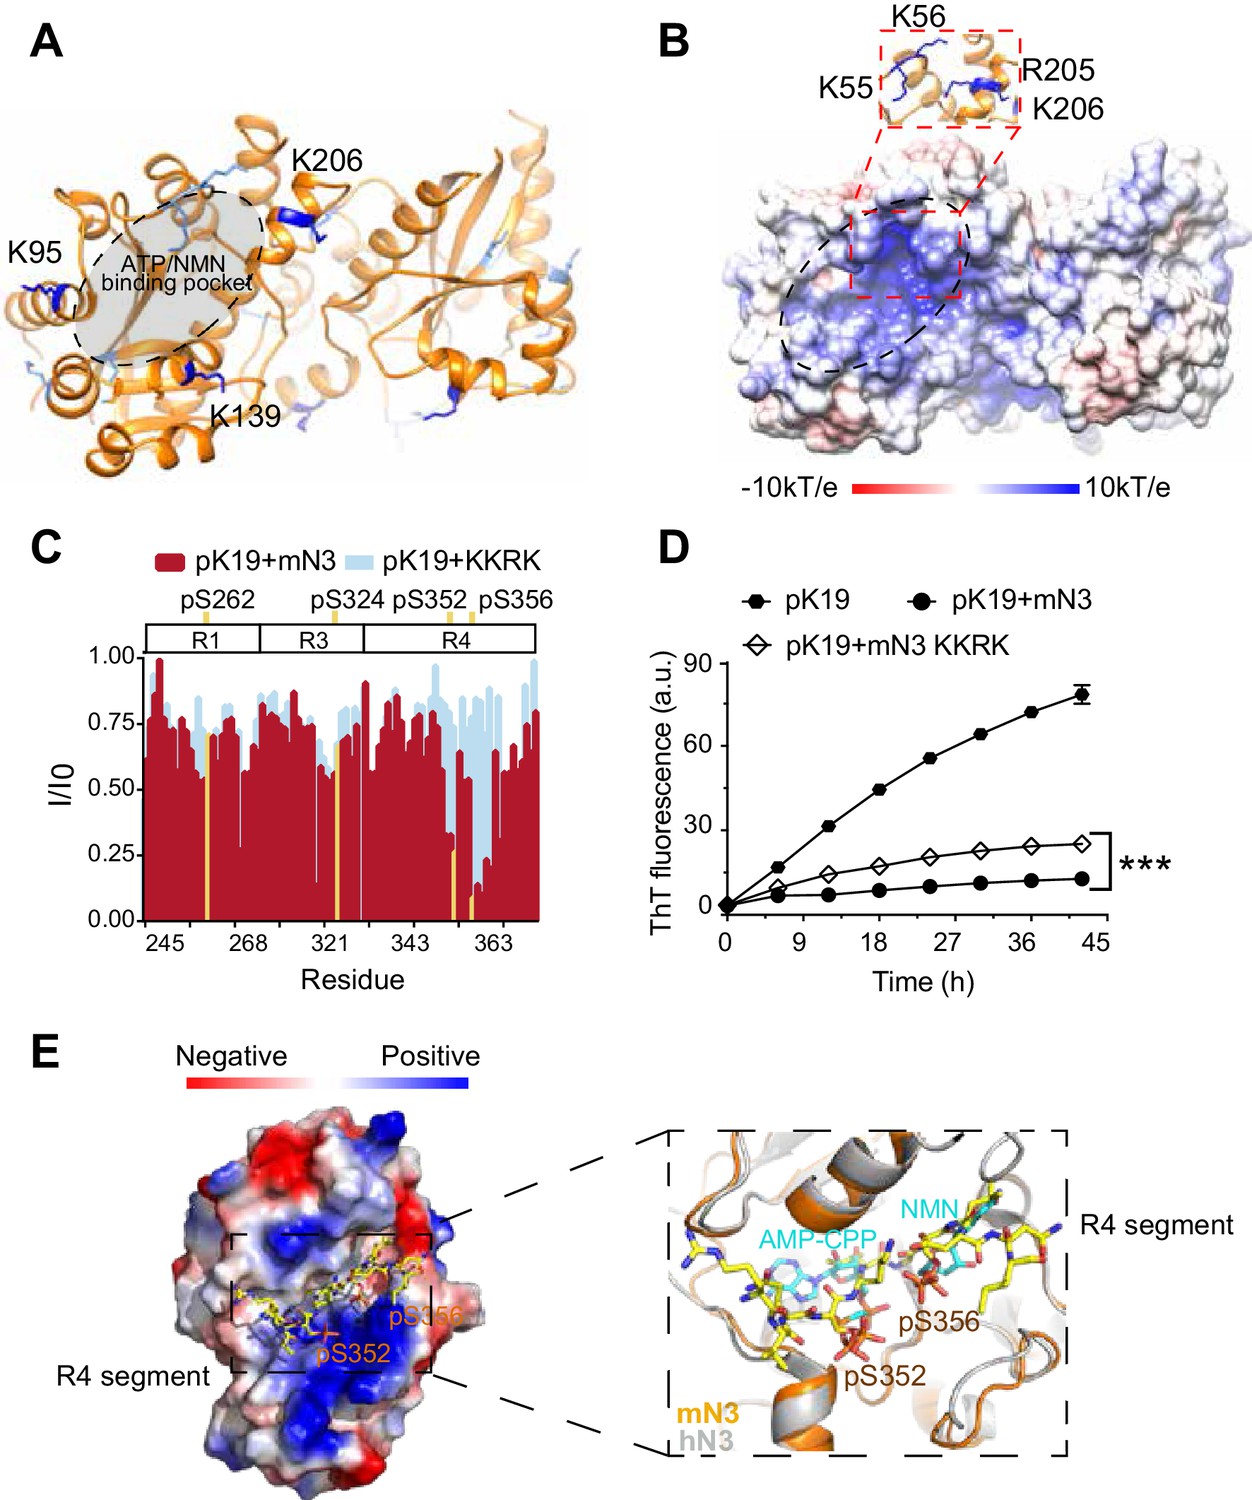
Structural characterization of the pTau-binding site on mN3.
(A) The structure of mN3 is shown in cartoon. Lysine residues that cross-linked with pK19 are shown as sticks in dark blue. Other lysine residues of mN3 are shown in light blue. The ATP/NMN binding site is shaded in gray. (B) Electrostatic surface representation of mN3. The pqr file was calculated at pH = 6.5. The positively-charged patch is highlighted with dash lines. The residues that compose the positively charged patch are shown as sticks in blue in the zoom-in view. (C) Overlay of the residue-specific intensity changes of pK19 signals titrated by mN3 (red) and KKRK mutant (light blue), respectively. pSer residues are colored in yellow. The domain organization of K19 is indicated on top. (D) Influence of KKRK mutations on the inhibition of mN3 against pK19 amyloid aggregation measured by the ThT fluorescence assays. The molar ratio of pK19 to mN3 is 1:0.2. Data correspond to mean ± s.d., with n = 3. Values are compared using Student’s t-test. ***p<0.001. (E) Structural model of mN3 in complex with the phosphorylated R4 segment 349RVQ(p)SKIG(p)SLDNI360. The electrostatic surface of the mN3 structure is shown. The peptide is shown as sticks in yellow. A zoom-in view of the peptide-binding site in (E) superimposed on the structure of hN3 in complex with AMP-CPP and NMN (PDB ID: 1NUS). AMP-CPP and NMN are shown as sticks in cyan.
-
Figure 2—source data 1
Residue-specific intensity changes of pK19 signals titrated by mN3 KKRK mutant (Figure 2C).
- https://cdn.elifesciences.org/articles/51859/elife-51859-fig2-data1-v1.xlsx
-
Figure 2—source data 2
ThT fluorescence profiles of pK19 in the absence or presence of mN3 WT and KKRK mutant (Figure 2D).
- https://cdn.elifesciences.org/articles/51859/elife-51859-fig2-data2-v1.xlsx
Figure 2—figure supplement 1

Characterization of mN3 dimer structure and activities.
(A) Structure superimposition of mN3 (orange) and hN3 (green, PDB ID: 1NUS). Substrates AMP-CPP (non-hydrolyzable ATP analog) and NMN from the structure of hN3 are shown as sticks in magenta. Positively charged residues that compose the positively-charged patch of mN3 are shown in sticks. Their interactions with the phosphate groups of substrates are labeled in the zoom-in view. (B) Structures of NMNAT proteins. Functional oligomers are shown including dimers of mN3 (PDB ID: 5Z9R) and BsN (1KAM), hexamer of hN1 (1KQN) and tetramer of hN3 (1NUR). The conserved dimer units (green and cyan) are shown in the same orientation. (C) SEC-MALS of mN3. The graph on the left shows the elution profile of mN3 by size exclusion chromatography (smooth trace) and the resulting molecular mass (red dotted line). Raw data of light scattering signal (upper) and dRI (lower) are shown on the right. (D) Size exclusion chromatography of mN3 at indicated concentrations. (E) SEC-MALS of mN3 EL mutant. The resulting molecular mass indicates a mixture of mN3 dimer and monomer in solution. (F) Melting temperature of mN3 WT and EL mutant measured by the DSF assay. The data shown correspond to mean ± s.d., with n = 3. Values are compared using Student’s t-test. ****p<0.0001. (G) Enzyme activities of mN3 WT and EL mutant measured with the NMN concentration of 625 µm. The data shown correspond to mean ± s.d., with n = 3. Values are compared using Student’s t-test. ****p<0.0001. (H) ThT kinetic assay of pK19 (100 μM) inhibited by mN3 WT and EL mutant. The molar ratio of pK19 to mN3 is indicated. The data shown correspond to mean ± s.d., with n = 5.
Figure 2—figure supplement 2
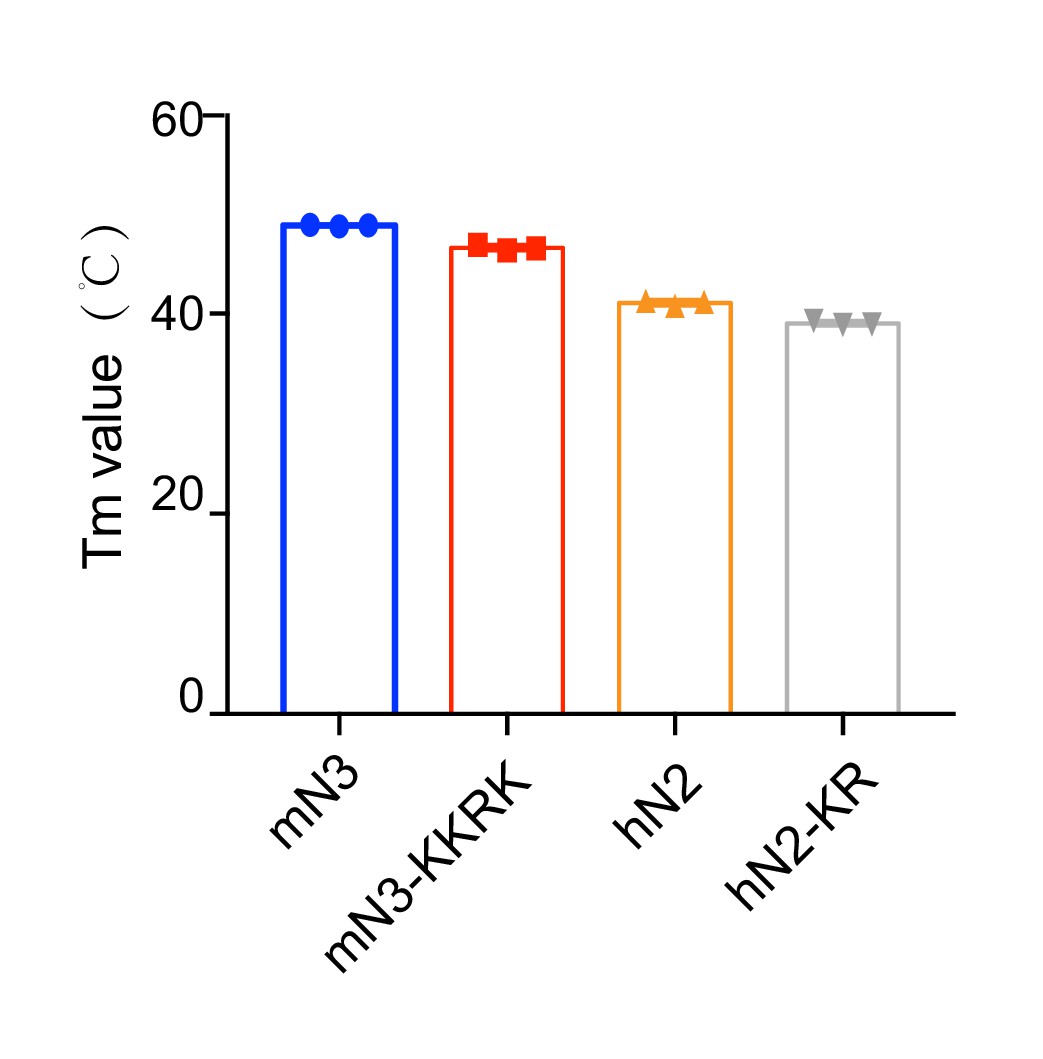
Melting temperature of mN3 and hN2 variants measured by the DSF assay.
The data shown correspond to mean ± s.d., with n = 3.
Figure 2—figure supplement 3

2D 1H-15N HSQC spectra of pK19 titrated by mN3-KKRK.
pK19: 100 μM, gray; pK19 titrated by mN3-KKRK: molar ratio of 1:2, light blue. Signals of pSer residues are enlarged.
Figure 2—figure supplement 4
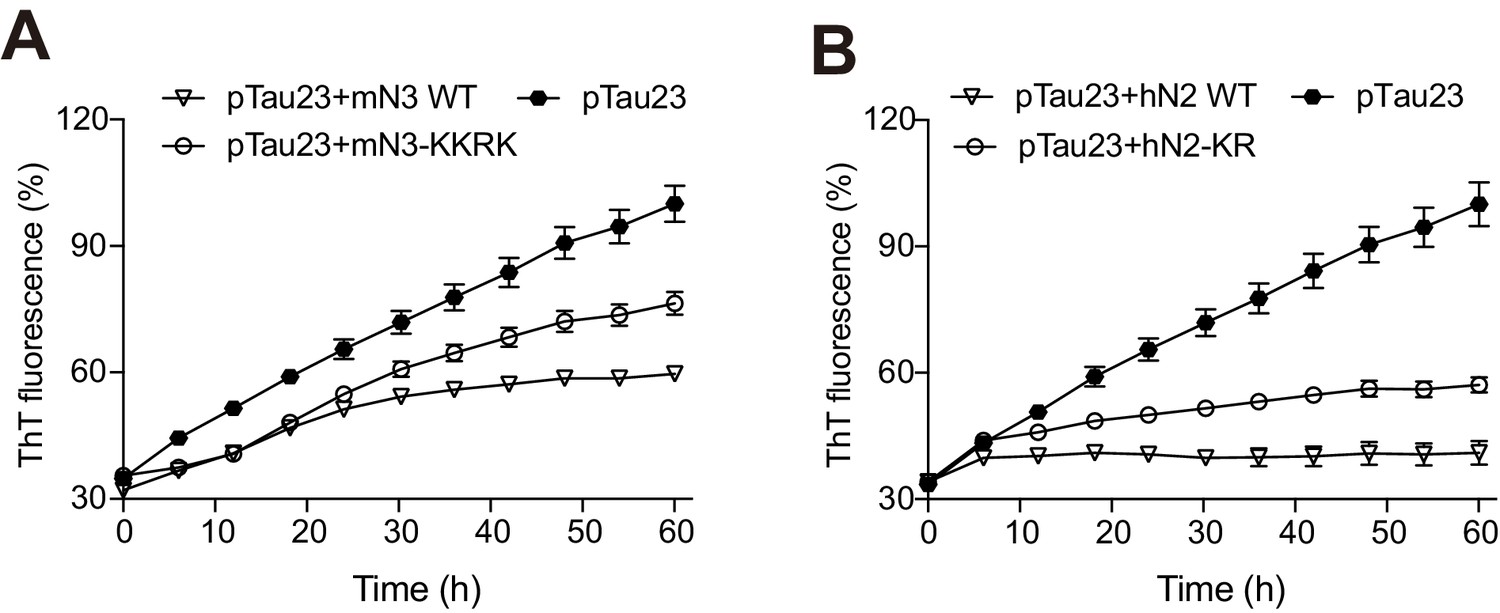
Influences of mN3 (A) and hN2 (B) mutations on pTau23 aggregation measured by ThT fluorescence assays.
The molar ratios of mN3 and hN2 mutants to mN3 are 1:1, respectively. The data shown correspond to mean ± s.d., with n = 5.
Figure 3 with 1 supplement
Competition of pK19 and NMN/ATP in the dual activities of NMNAT.
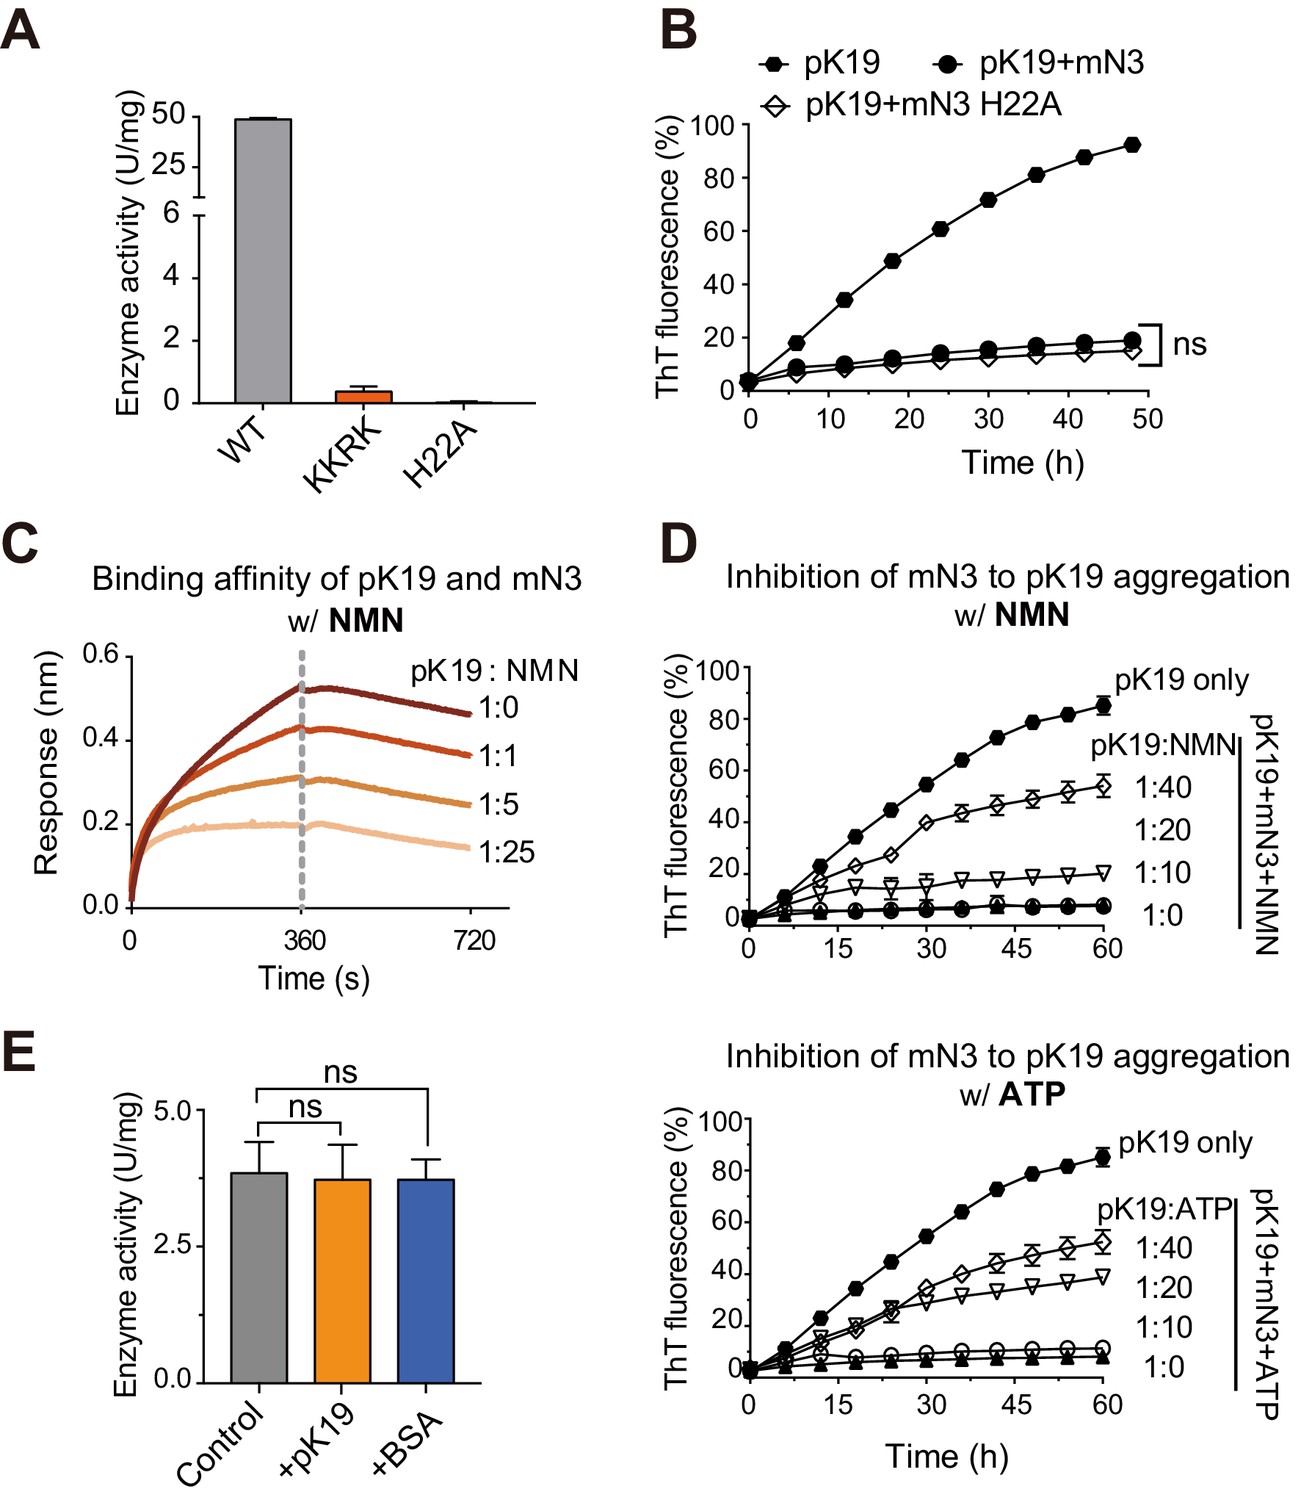
(A) Enzyme activities of mN3 WT and mutants. The data showed correspond to mean ± s.d., with n = 3. (B) Influence of the H22A mutation on the inhibition of mN3 against the amyloid aggregation of pK19. The molar ratio of pK19 to mN3 is 1:0.2. The data showed correspond to mean ± s.d., with n = 3. Values are compared using Student’s t-test. ‘ns’, not significant. (C) NMN weakens the binding of pK19 to mN3 in a dose-dependent manner measured by BLI analysis. mN3 was immobilized on the SA sensor. pK19 (50 μM) was pre-mixed with NMN at the indicated molar ratios for association. The same amounts of NMN were used for the association and dissociation measurements. The association and dissociation profiles are divided by a vertical dash line. (D) The presence of NMN (top) or ATP (bottom) reduces the inhibitory effect of mN3 against pK19 amyloid aggregation in a dose-dependent manner. Molar ratios of pK19 to NMN/ATP are indicated. The data showed correspond to mean ± s.d., with n = 3. (E) The presence of pK19 (pK19: NMN/ATP = 10:1) shows no significant influence on the enzyme activity of mN3. The data showed correspond to mean ± s.d., with n = 3. Values are compared using Student’s t-test. ‘ns’, not significant.
-
Figure 3—source data 1
Enzyme activities of mN3 WT and mutants (Figure 3A).
- https://cdn.elifesciences.org/articles/51859/elife-51859-fig3-data1-v1.xlsx
-
Figure 3—source data 2
ThT fluorescence profiles of pK19 in the absence or presence of mN3 WT and H22A mutant (Figure 3B).
- https://cdn.elifesciences.org/articles/51859/elife-51859-fig3-data2-v1.xlsx
-
Figure 3—source data 3
NMN weakens the binding of pK19 to mN3 (Figure 3C).
- https://cdn.elifesciences.org/articles/51859/elife-51859-fig3-data3-v1.xlsx
-
Figure 3—source data 4
The presence of NMN or ATP reduces the inhibitory effect of mN3 against pK19 amyloid aggregation (Figure 3D).
- https://cdn.elifesciences.org/articles/51859/elife-51859-fig3-data4-v1.xlsx
-
Figure 3—source data 5
The presence of pK19 shows no significant influence on the enzyme activity of mN3 (Figure 3E).
- https://cdn.elifesciences.org/articles/51859/elife-51859-fig3-data5-v1.xlsx
Figure 3—figure supplement 1

Position of H22 in the over-all mN3 structure.
(A) The surface of the mN3 structure is shown in orange. The apo structure of mN3 is superimposed with the structure of hN3 in complex with AMP-CPP and NMN (PDB ID: 1NUS). AMP-CPP and NMN are shown in magenta as sticks. The interaction of H22 and AMP-CPP is shown in a zoom-in view. (B) R4 segment resides at the entrance of the enzymatic pocket of mN3, and thus the mutation of H22, which is deep at the bottom of the pocket, may not significantly influence the binding of R4 to mN3. R4 segment is in yellow sticks. mN3 is in orange.
Figure 4 with 4 supplements

Drosophila Nmnat (PD) suppresses pTau-induced mitochondrial clustering.
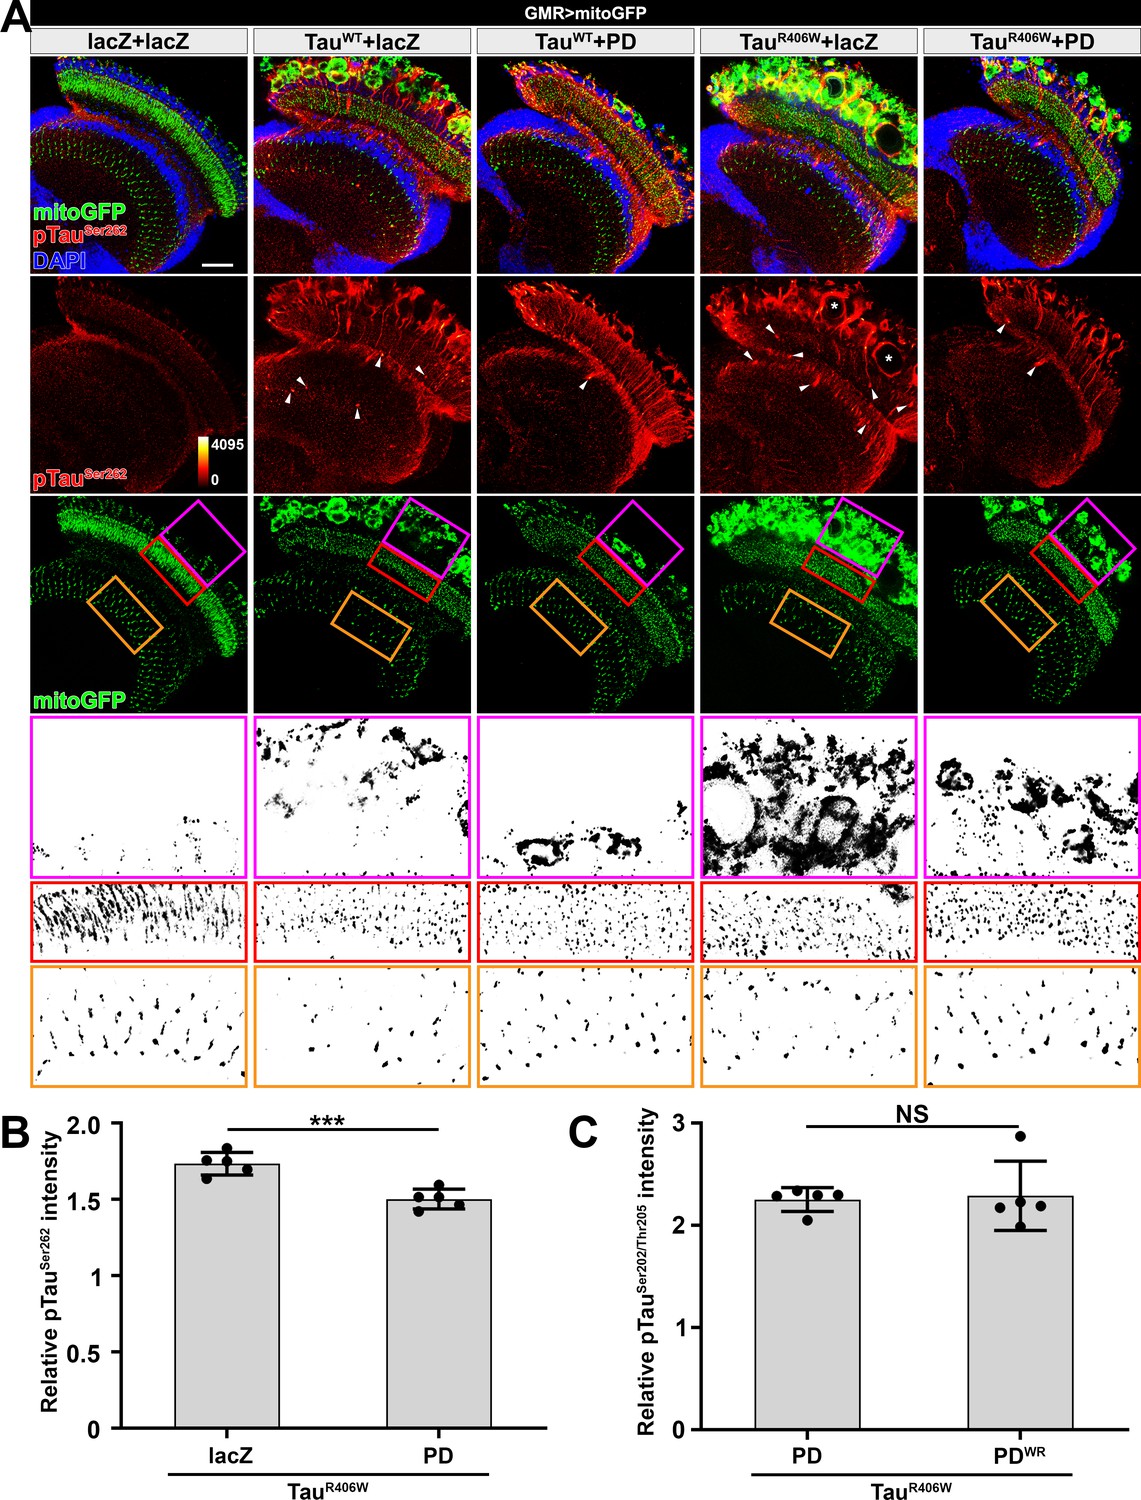
(A) Adult female Drosophila (2 days after eclosion, DAE) brains expressing mitochondrial marker mitoGFP (green) together with lacZ+lacZ, TauWT+lacZ, TauR406W+lacZ, TauWT+PD, TauWT+PDWR, TauR406W+PD, or TauR406W+PDWR under photoreceptor-specific driver GMR-GAL4 were stained for pTau (red spectrum) and DAPI (blue). White arrowheads show the aggregation of pTau. White asterisks show the holes formed in the lamina cortex layer, indicating retinal degeneration. Magenta, red, and yellow boxes indicate the lamina cortex, lamina, and medulla layers, respectively. Scale bar, 30 µm. (B) Diagram of the adult Drosophila visual system. Each ommatidium contains six outer photoreceptors (R1–R6) and two inner photoreceptors (R7 and R8). R1-R6 traverse the lamina cortex (magenta box) and project their axons into the lamina (red box), while the axons of R7 and R8 pass through the lamina and terminate in distinct synaptic layers in the medulla (orange box). (C, D) Quantification of mitoGFP intensity in the lamina cortex (C) and medulla (D). Data are presented as mean ± s.d., with n = 5. One-way ANOVA post hoc Tukey test; **p<0.01, ***p<0.001, ****p<0.0001.
Figure 4—figure supplement 1
Drosophila NMNAT(PD) suppresses pTau-induced mitochondrial clustering.
(A) Adult female Drosophila (2 DAE) brains expressing mitochondrial marker mitoGFP (green) together with lacZ+lacZ, TauWT+lacZ, TauWT+PD, TauR406W+lacZ, or TauR406W+PD under GMR-GAL4 were stained for pTau (red spectrum) and DAPI (blue). White arrowheads show the aggregation of pTau. White asterisks show the holes formed in the lamina cortex layer. Magenta, red, and yellow boxes indicate the lamina cortex, lamina, and medulla layers, respectively. Scale bar, 30 µm. (B) Quantification of pTauSer262 intensity in the lamina and lamina cortex in A. Data are presented as mean ± s.d., with n = 5. Independent samples t-test; ***p<0.001. (C) Quantification of pTauSer202/Thr205 intensity in the lamina and lamina cortex in Figure 4A. Data are presented as mean ± s.d., with n = 5. Independent samples t-test; NS: not significant.
Figure 4—figure supplement 2
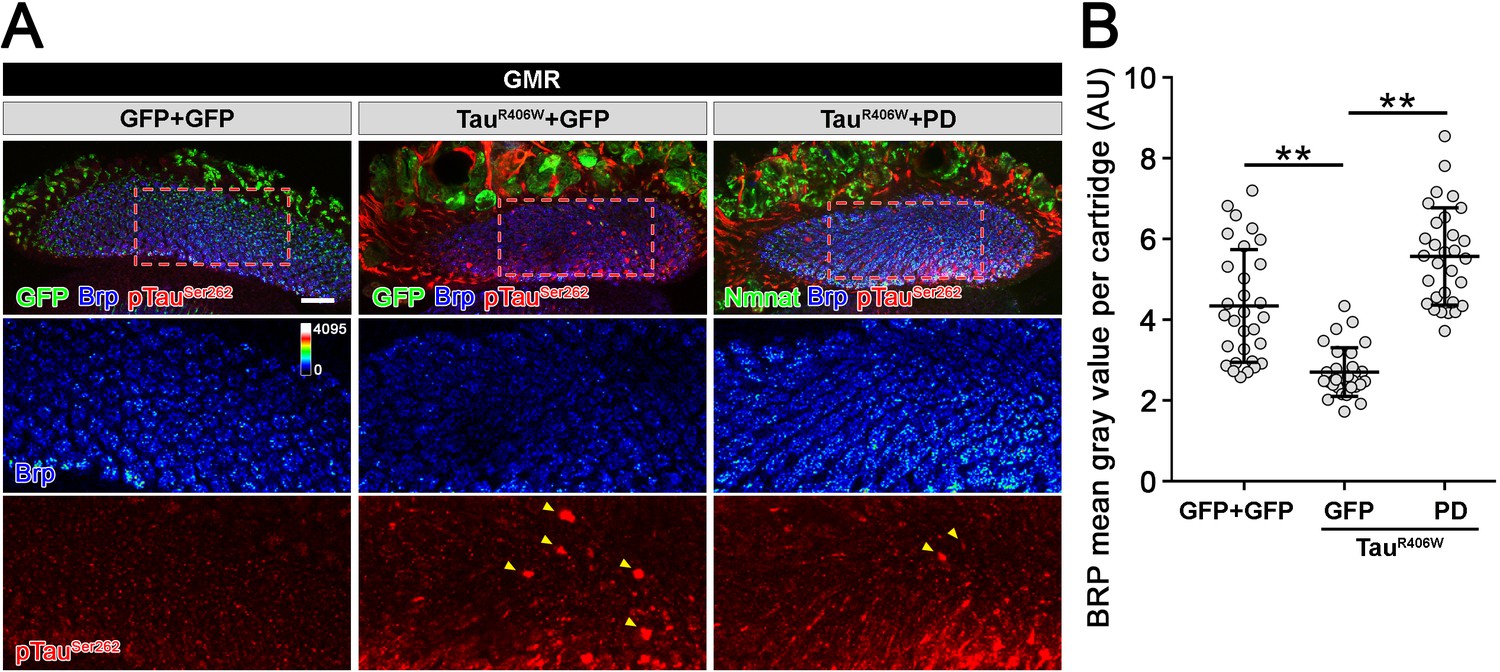
Drosophila Nmnat (PD) suppresses pTau-induced Brp loss.
(A) Confocal micrographs show the Brp staining in lamina synapses. Brp labels active zone structure. pTauSer262 labels hyperphosphorylated Tau. Arrowheads mark pTau aggregates. Scale bar, 20 µm. (B) Quantification (mean ± s.d.; n = 30 cartridges from three animals) of the Brp level in the lamina. One-way ANOVA post hoc Tukey test; **p<0.01.
Figure 4—figure supplement 3
Activities of mN3 variants.
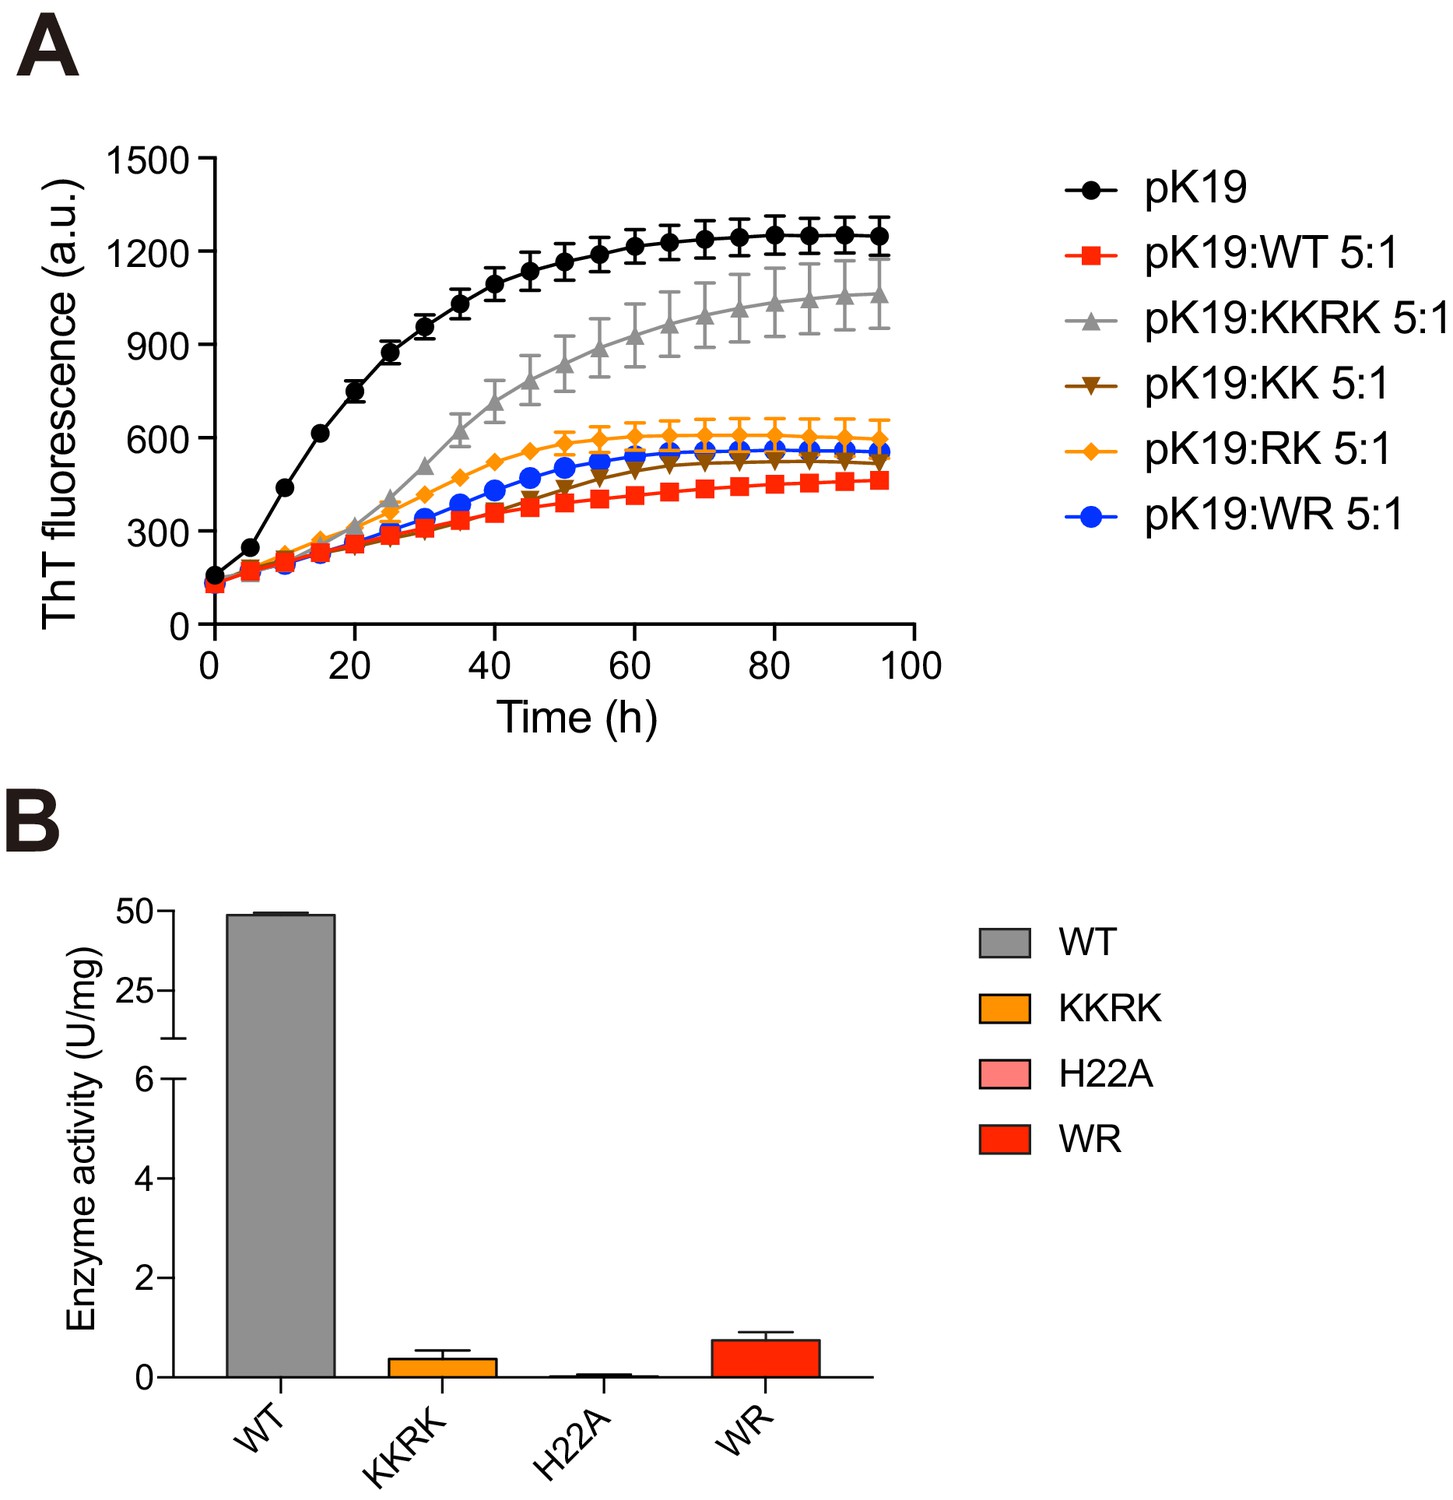
(A) ThT fluorescence assays (top) shows the influences of mN3 mutations on the inhibition of pK19 (100 μM) amyloid aggregation. The molar ratios of pK19 to mN3 variants are indicated. The data shown correspond to mean ± s.d., with n = 5. (B) The enzymatic activities of mN3 variants measured with the NMN concentration of 625 µm are shown below. The data shown correspond to mean ± s.d., with n = 3.
Figure 4—figure supplement 4
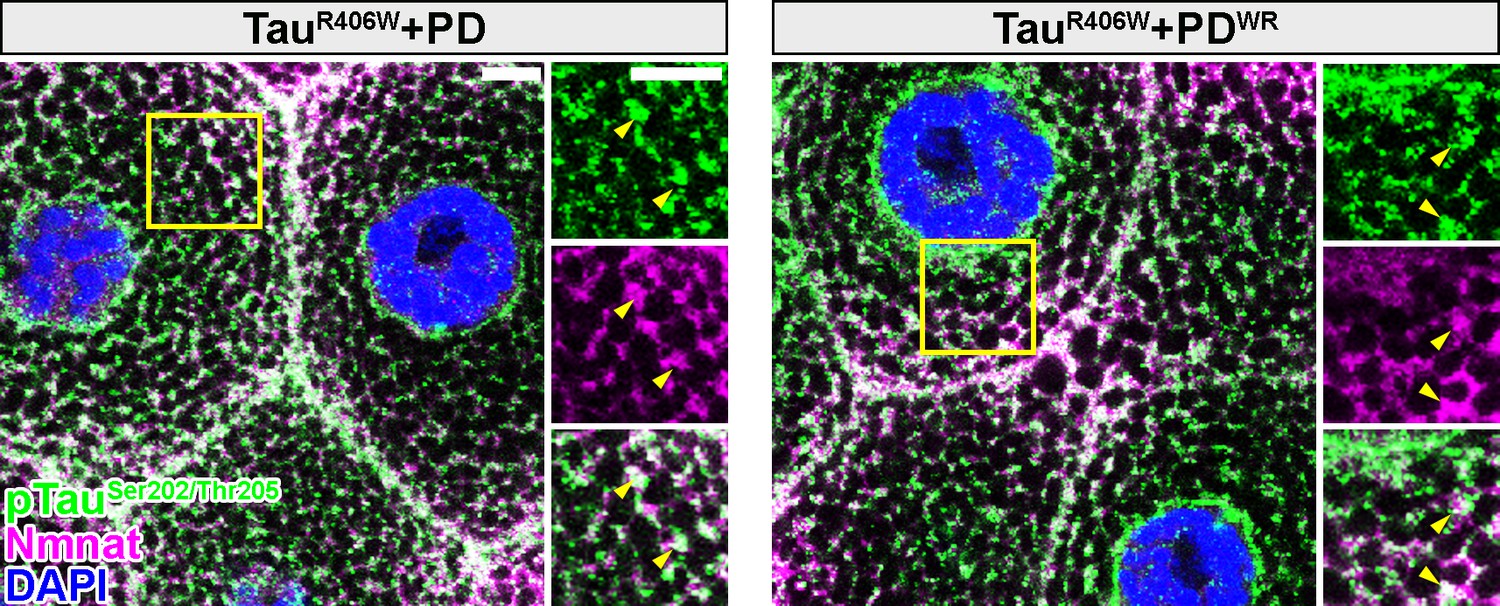
Drosophila Nmnat PD and PDWR colocalize with pTau in vivo.
Third instar larval salivary gland cells expressing TauR406W with PD or PDWR by OK371-GAL4 were stained with pTau (green), Nmnat (magenta), and DAPI (blue). Yellow arrowheads indicate the colocalization of pTau with PD/PDWR. Scale bars, 10 µm.
Figure 5 with 2 supplements
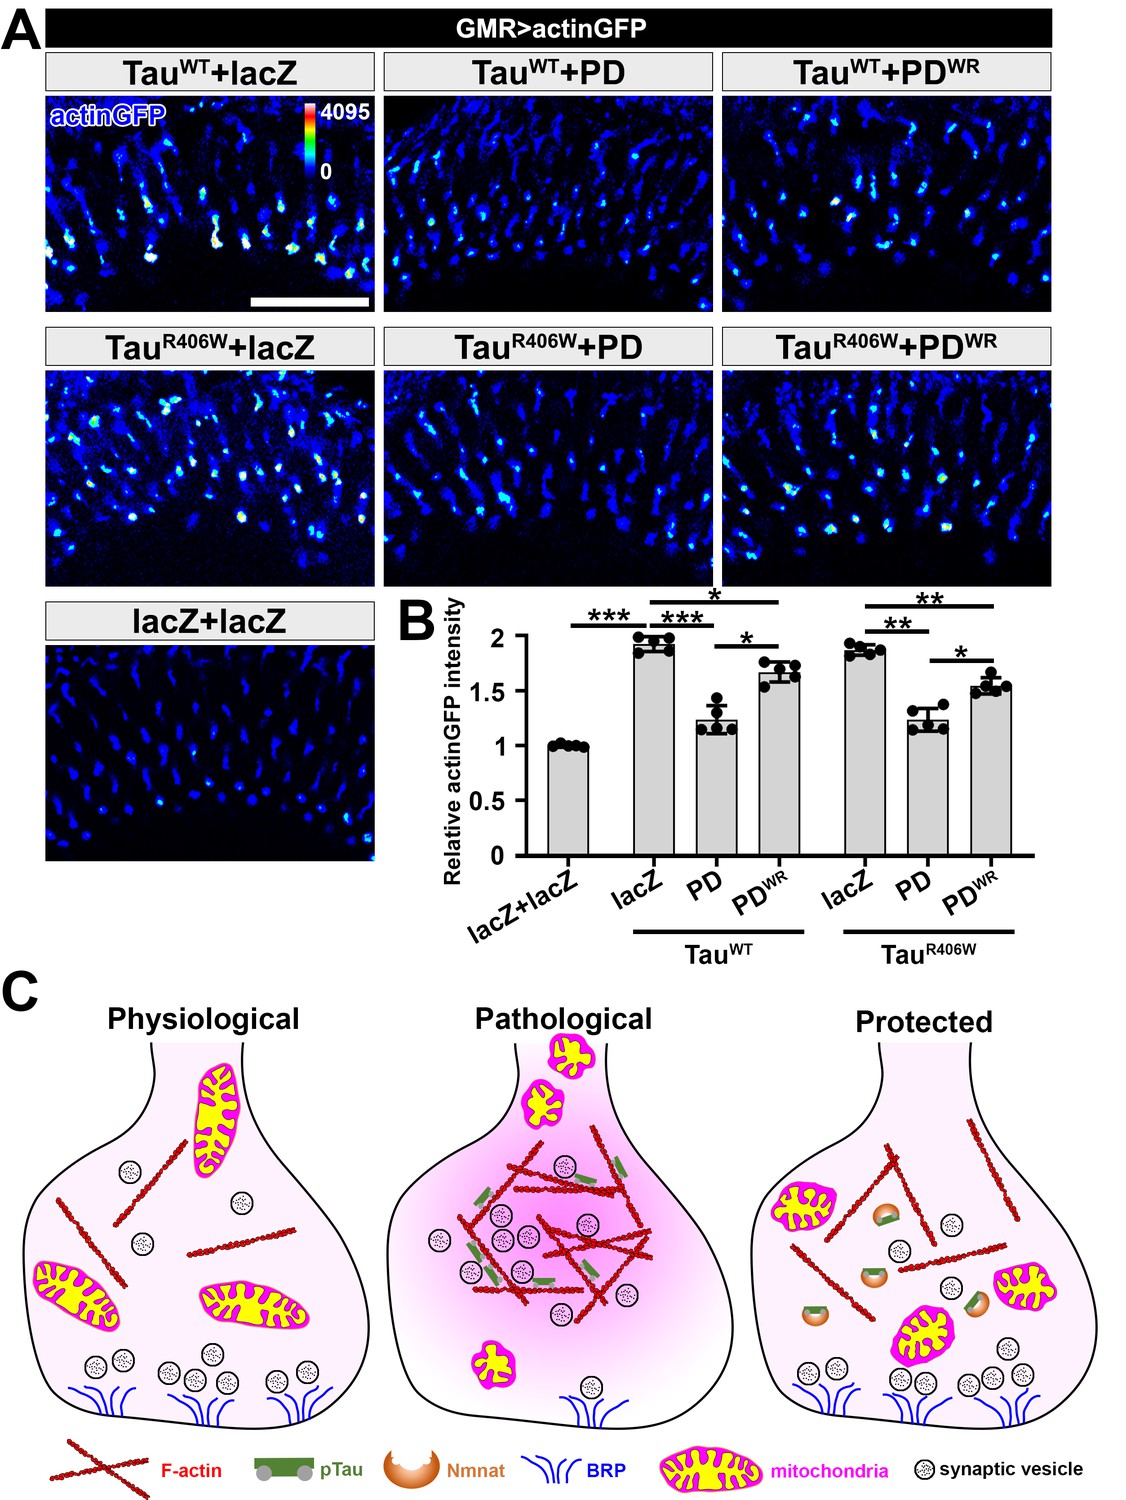
NMNAT (PD) suppresses F-actin accumulation at synaptic terminals.
(A) Medulla area of adult female Drosophila (2 DAE) expressing actin-GFP (blue spectrum) together with lacZ+lacZ, TauWT+lacZ, TauWT+PD, TauWT+PDWR, TauR406W+lacZ, TauR406W+PD, or TauR406W+PDWR under photoreceptor-specific driver GMR-GAL4. Scale bar, 30 µm. (B) Quantification of the actinGFP level in the medulla. One-way ANOVA post hoc Tukey test; *p<0.05, **p<0.01, ***p<0.001. (C) Schematic model of Nmnat protection against pTau-induced synaptopathy. Under pathological condition, pTau promotes mitochondrial clustering and impairs mitochondrial transport, reduces Brp level at synapses, and stimulates F-actin accumulation that restricts synaptic vesicle mobility. Nmnat specifically binds to pTau and regulates pTau phase separation, restores the presence of mitochondria and Brp at synaptic terminals, and alleviates F-actin accumulation.
Figure 5—figure supplement 1
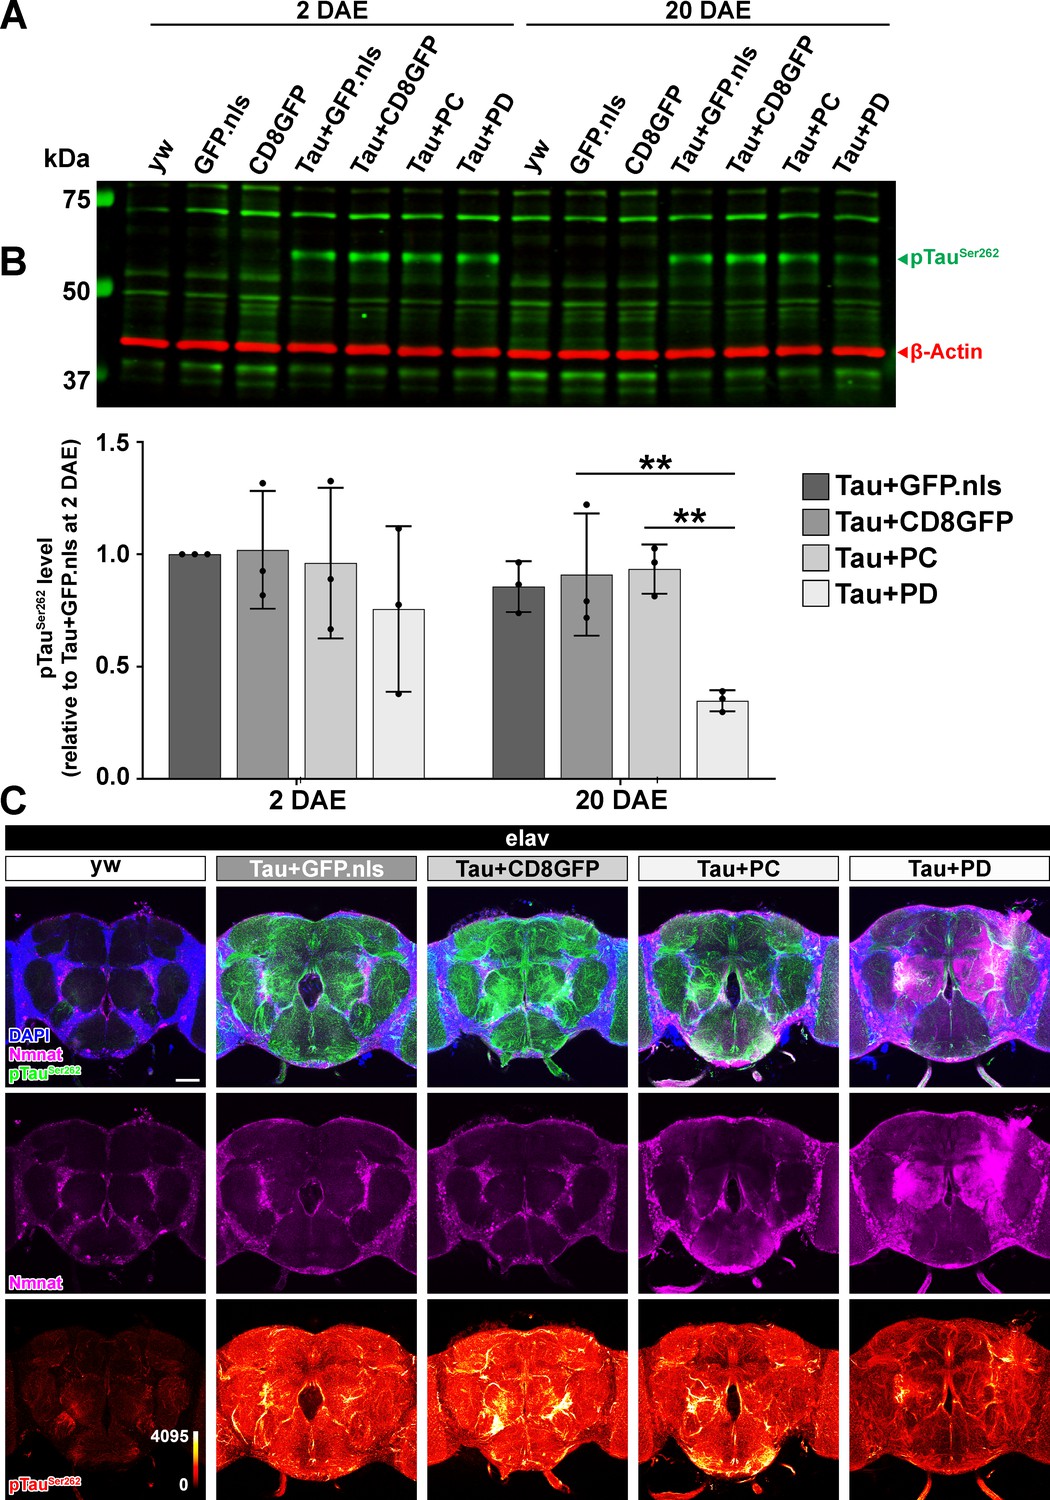
Drosophila Nmnat-PD, not PC, reduces total pTauSer262 level in the brain.
(A) Western blot analysis of protein extracts from adult yw fly heads or fly heads with neuronal expression of GFP.nls (nuclear localized GFP), CD8GFP, TauR406W+GFP.nls, TauR406W+CD8GFP, TauR406W+PC, or TauR406W+PD by elav-GAL4 at 2 and 20 DAE using antibodies against pTauSer262 and β-actin (internal control). (B) Quantification of the pTau levels in A. Fold change of pTauSer262 was normalized to the TauR406W+GFP.nls group at 2 DAE. Data are presented as mean ± s.d., with n = 3. One-way ANOVA post hoc Bonferroni’s test. **p<0.01. (C) Adult yw fly brains or fly brains with neuronal expression of TauR406W+GFP.nls, TauR406W+CD8GFP, TauR406W+PC, or TauR406W+PD by elav-GAL4 at 20 DAE were probed for Nmnat (magenta) and pTauSer262 (green) and stained for DAPI (blue). In the bottom row, the intensity of pTau is indicated by a heat map. Scale bar: 50 μm.
Figure 5—figure supplement 2
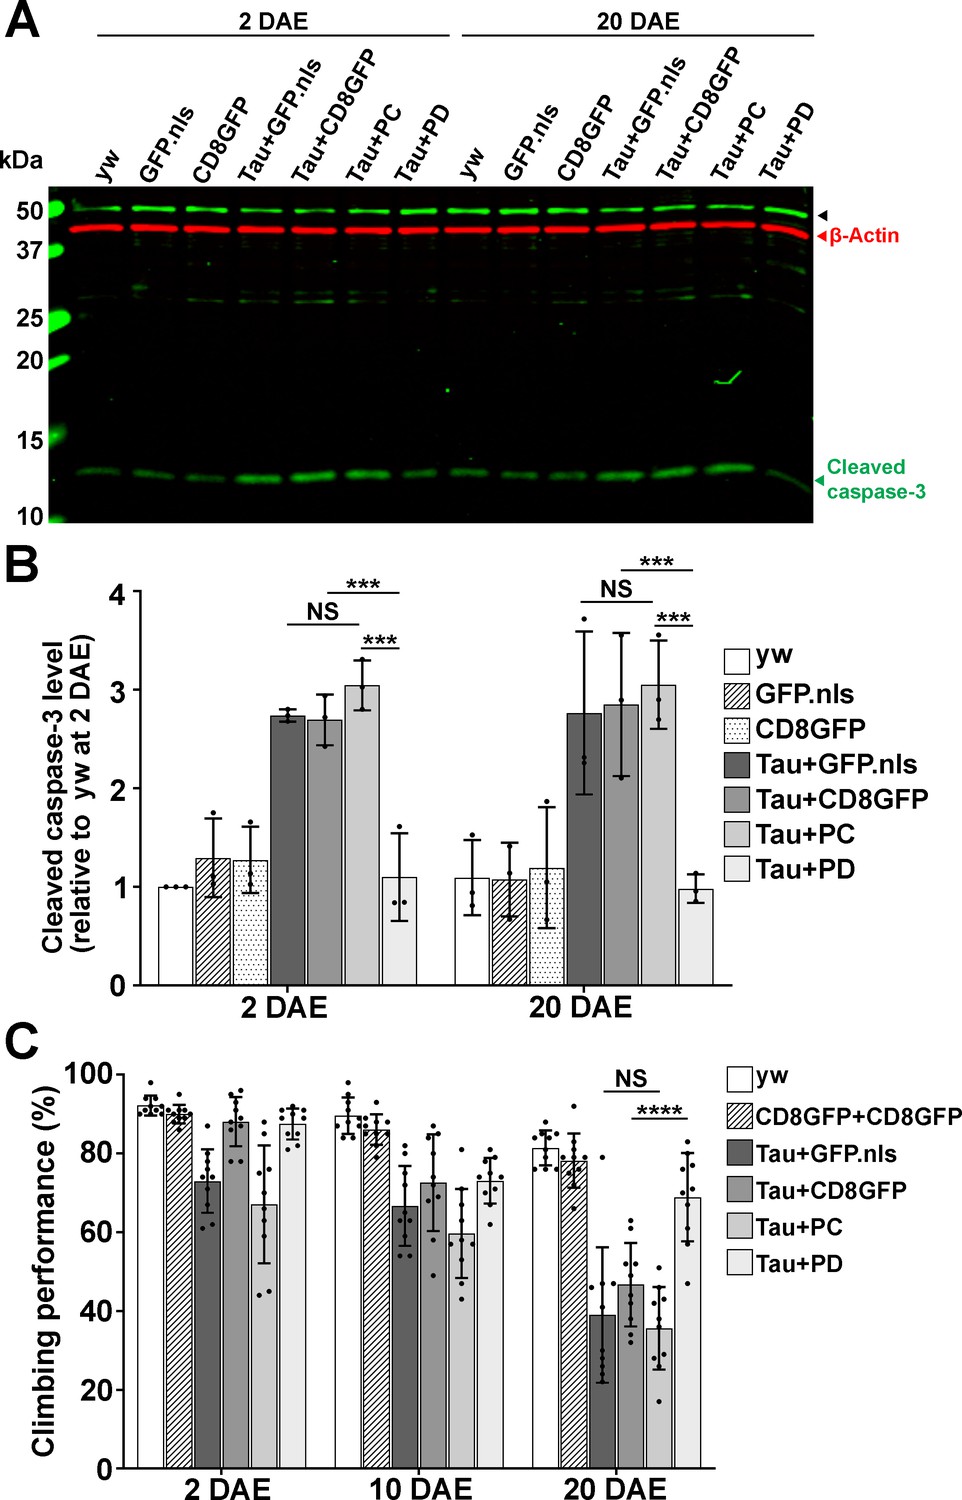
Drosophila Nmnat PD, not PC, protects against Tau-induced brain apoptosis and locomotor defects.
A Western blot analysis of proteins extracted from 2 and 20 DAE yw fly heads or fly heads with neuronal expression of GFP.nls, CD8GFP, TauR406W+GFP.nls, TauR406W+CD8GFP, TauR406W+PC, or TauR406W+PD by elav-GAL4 using an antibody against cleaved caspase-3. β-actin was used as an internal control. B Quantification of the cleaved caspase-3 levels in A. Fold change of P12 was normalized to 2 DAE yw flies. n = 3. Data are presented as mean ± s.d., with n = 3. One-way ANOVA with Bonferroni’s post hoc test. ***p<0.001, NS: not significant. C Climbing performance of yw flies or flies with neuronal expression of CD8GFP+CD8GFP, TauR406W+GFP.nls, TauR406W+CD8GFP, TauR406W+PC, and TauR406W+PD by elav-GAL4 at 2, 10, and 20 DAE. Ten groups (10 flies in each, total 100 flies) of each genotype were tested. Data are presented as mean ± s.d., with n = 10. One-way ANOVA with Bonferroni’s post hoc test. ****p<0.0001, NS: not significant.
Figure 6 with 1 supplement
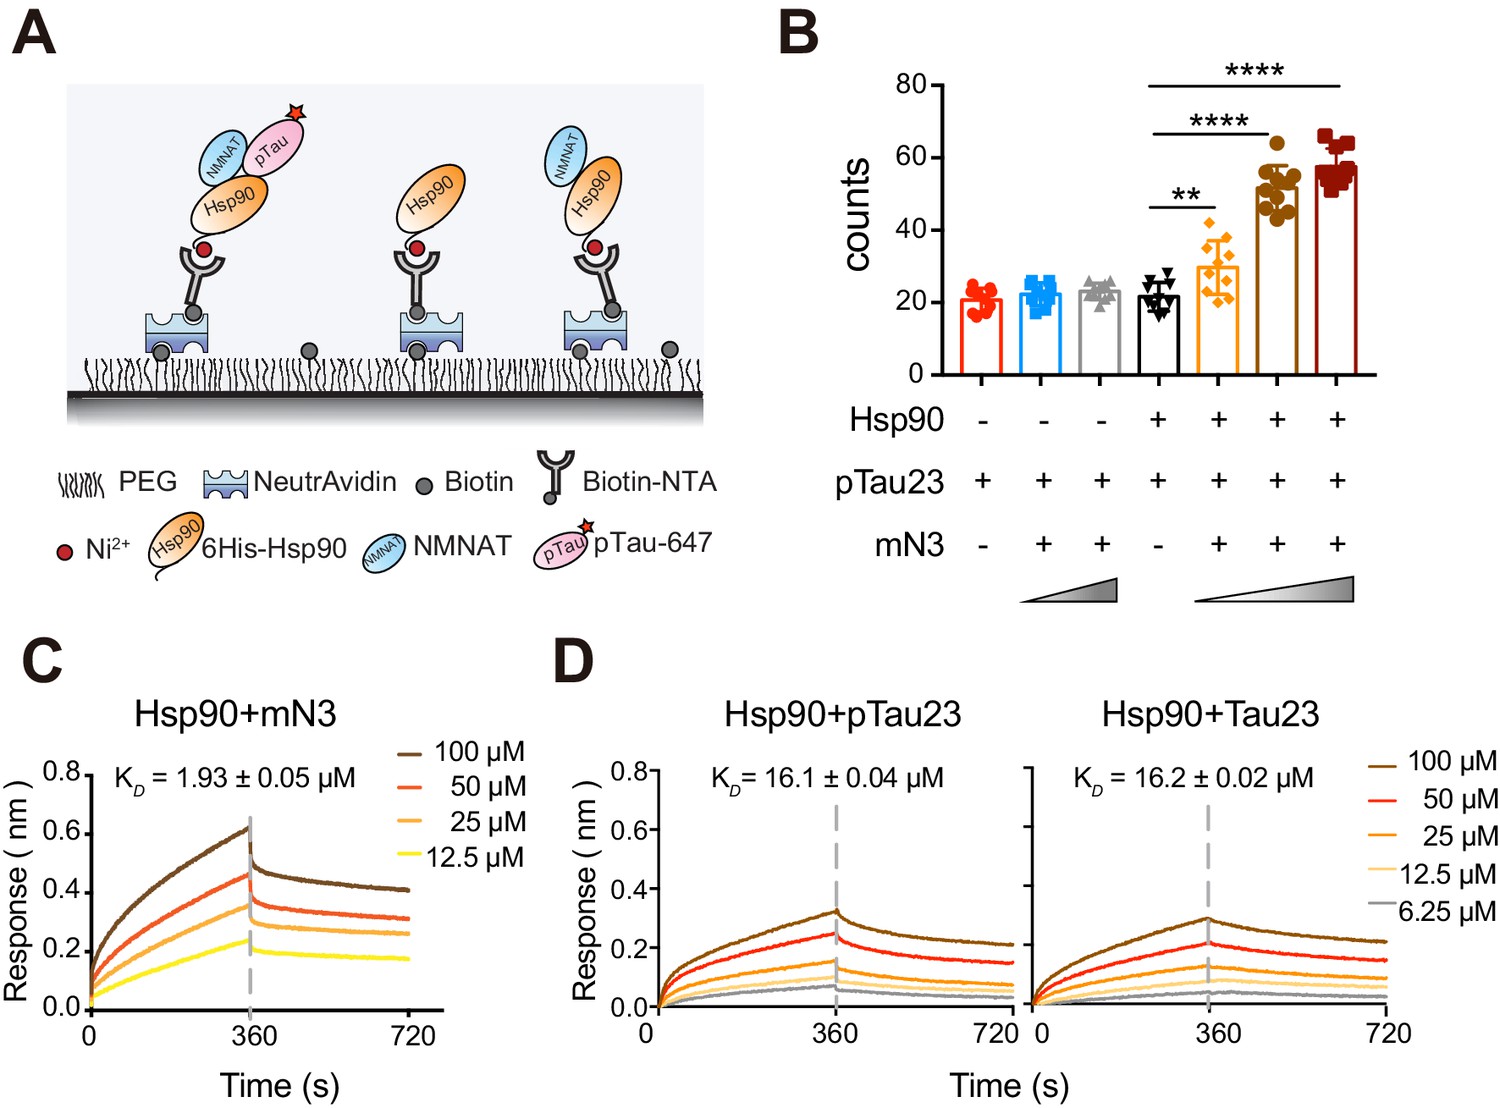
mN3 acts as a co-chaperone to assist Hsp90 in the recognition of pTau.
(A) Schematic illustration of the SMPull assay by TIRF microscopy. His6-tagged Hsp90 was immobilized to the slide by chelating to Biotin-NTA-Ni. Single molecular interaction was monitored by the fluorescence from Alexa-647 that was labeled on pTau23/Tau23 monomer. (B) The average number of fluorescent counts per imaging area detected by SMPull. TIRF images were recorded for the sample systems containing Hsp90, mN3 (4 nM) and pTau23 as indicated. The concentrations of mN3 from left to right are 0, 4, 20, 0, 0.8, 4, and 20 nM. Error bars denote standard deviations (s.d.) (n = 10). Values were compared using Student’s t-test. **, p<0.01. ****, p<0.0001. (C) BLI measurements of mN3 binding to the SA sensor chip coated with biotinylated Hsp90 (20 μg ml−1). The mN3 concentrations are indicated. The KD value of mN3 binding to Hsp90 is reported. (D) BLI measurements of the binding of pTau23 (left)/Tau23 (right) to the SA sensor chip coated with biotinylated Hsp90 (20 μg ml−1). The Tau protein concentrations are indicated.
-
Figure 6—source data 1
The average number of fluorescent counts per imaging area detected by SMPull (Figure 6B and Figure 6—figure supplement 1).
- https://cdn.elifesciences.org/articles/51859/elife-51859-fig6-data1-v1.xlsx
-
Figure 6—source data 2
BLI measurements of the binding of mN3 (Figure 6C) or pTau23/Tau23 (Figure 6D) to Hsp90.
- https://cdn.elifesciences.org/articles/51859/elife-51859-fig6-data2-v1.xlsx
Figure 6—figure supplement 1

mN3 mediates the binding of pTau23, but not Tau23, to Hsp90.
(A) TIRF microscopic images show the enhancement of mN3 to the binding of Hsp90 with pTau23 but not Tau23. (B) The average number of fluorescent counts per imaging area detected by SMPull. The concentrations of mN3 from left to right are 0, 4, 20, 0, 0.8, 4, and 20 nM. Error bars denote standard deviations (s.d.) (n = 10).
Figure 7

Schematics of NMNAT as a key node between pTau homeostasis and NAD+ metabolism.
NMNAT functions as both an NAD+ synthase involved in NAD+ metabolism, and a chaperone-like protein assisting the clearance of pathological pTau deposition. During aging, as the levels of ATP and NMN decrease, the chaperone-like function of NMNAT may show up to antagonize pTau aggregation.
Tables
Key resources table
| Reagent type (species) or resource | Designation | Source or reference | Identifiers | Additional i nformation |
|---|---|---|---|---|
| Antibody | Rabbit polyclonal anti-cleaved caspase 3 (Asp175) | Cell Signaling Technology | Cat# 9661; RRID:AB_2341188 | (1:1000) for western blot |
| Antibody | Mouse monoclonal anti-β-actin | Sigma-Aldrich | Cat# A1978; RRID:AB_476692 | (1:10000) for western blot |
| Antibody | Mouse monoclonal anti-Brp | Developmental Studies Hybridoma Bank | Cat# nc82; RRID:AB_2314866 | (1:250) for immuno fluorescent staining |
| Antibody | Rabbit polyclonal anti-pTau(Ser262) | Santa Cruz | Cat# sc-101813; RRID:AB_1129981 | (1:250) for immuno fluorescent staining |
| Antibody | Mouse monoclonal anti-pTau (Ser202/Thr205) | Thermo Fisher Scientific | Cat# MN1020; RRID:AB_223647 | (1:250) for immuno fluorescent staining |
| Antibody | Guinea pig polyclonal anti-Drosophila Nmnat | Laboratory of Dr. R Grace Zhai Zhai et al., 2006 | (1:500) for immuno fluorescent staining | |
| Antibody | Alexa Fluor 555 Goat polyclonal anti-Mouse IgG (H+L) | Thermo Fisher Scientific | Cat# A-21422; RRID:AB_2535844 | (1:250) for immuno fluorescent staining |
| Antibody | Alexa Fluor 647 Goat polyclonal anti- Guinea pig IgG (H+L) | Thermo Fisher Scientific | Cat# A-21450; RRID:AB_2735091 | (1:250) for immunofluorescent staining |
| Antibody | Cy3 conjugated polyclonal anti-Rabbit IgG (H+L) | Rockland | Cat# 611-104-122; RRID:AB_218568 | (1:250) for immunofluorescent staining |
| Antibody | DyLight 800 conjugated polyclonal anti-Mouse IgG (H+L) | Rockland | Cat# 610-145-002; RRID:AB_10703265 | (1:1000) for western blot |
| Antibody | DyLight 680 conjugated polyclonal anti-Rabbit IgG (H+L) | Rockland | Cat# 611-144-002; RRID:AB_1660962 | (1:1000) for western blot |
| Chemical | Protease inhibitor | Roche | Cat# 11873580001 | |
| Chemical | Triton X-100 | Sigma-Aldrich | Cat# T9284 | |
| Chemical | VECTASHIELD antifade mounting medium | Vector Laboratories | Cat# H-1000; RRID:AB_2336789 | |
| Chemical | DAPI | Thermo Fisher Scientific | Cat# D1306; RRID:AB_2629482 | (1:300) for immuno fluorescent staining |
| Chemical | Normal goat serum | Thermo Fisher Scientific | Cat# PCN5000 | |
| Peptide, recombinant protein | His6-NMNATs | This paper | purified from E. coliBL21-RIL cells | |
| Peptide, recombinant protein | His6-Hsp90 | This paper | purified from E. coli BL21-RIL cells | |
| Peptide, recombinant protein | Tau23 | This paper | purified from E. coli BL21-RIL cells | |
| Peptide, recombinant protein | K19 | This paper | purified from E. coliBL21-RIL cells | |
| Peptide, recombinant protein | His10-HRV-3C protease | This paper | purified from E. coli BL21-RIL cells | |
| Peptide, recombinant protein | His6-MBP-MARK2-T208E | This paper | purified from E. coli BL21-RIL cells | |
| Chemical compound, drug | Thioflavin T | Sigma-Aldrich | Cat# 596200 | |
| Chemical compound, drug | BS3 | Thermo Fisher Scientific | Cat# 21585 | |
| Chemical compound, drug | SYPRO Orange | Thermo Fisher Scientific | Cat# S6650 | |
| Chemical compound, drug | NMN | Sigma-Aldrich | Cat# N3501 | |
| Chemical compound, drug | ATP | Sigma-Aldrich | Cat# A2383 | |
| Chemical compound, drug | Semicarbazide-HCl | Sigma-Aldrich | Cat# S2201 | |
| Chemical compound, drug | Alcohol dehydrogenase | Sigma-Aldrich | Cat# A7011 | |
| Chemical compound, drug | Alexa Fluor 647 | Thermo Fisher Scientific | Cat# A32757 | |
| Software, algorithm | Graphpad Prism | GraphPad software | SCR_002798 | |
| Software, algorithm | Adobe illustrator | Adobe Inc | SCR_010279 | |
| Software, algorithm | Adobe Photoshop | Adobe Inc | SCR_014199 | |
| Software, algorithm | ASTRA VI software | Wyatt Technologies | SCR_016255 | |
| Software, algorithm | smCamera | Taekjip Ha, Johns Hopkins University | ||
| Software, algorithm | LI-COR Image Studio Software | LI-COR Biosciences | SCR_015795 | |
| Software, algorithm | Olympus Fluoview FV10-ASW | Olympus | SCR_014215 |
Additional files
-
Supplementary file 1
Data collection and structure refinement statistics of mN3.
- https://cdn.elifesciences.org/articles/51859/elife-51859-supp1-v1.docx
-
Supplementary file 2
Cross-linked peptides between pK19 and mN3.
- https://cdn.elifesciences.org/articles/51859/elife-51859-supp2-v1.docx
-
Transparent reporting form
- https://cdn.elifesciences.org/articles/51859/elife-51859-transrepform-v1.docx
Download links
A two-part list of links to download the article, or parts of the article, in various formats.
Downloads (link to download the article as PDF)
Open citations (links to open the citations from this article in various online reference manager services)
Cite this article (links to download the citations from this article in formats compatible with various reference manager tools)
Nicotinamide mononucleotide adenylyltransferase uses its NAD+ substrate-binding site to chaperone phosphorylated Tau
eLife 9:e51859.
https://doi.org/10.7554/eLife.51859


