Optogenetic control of excitatory post-synaptic differentiation through neuroligin-1 tyrosine phosphorylation
- University of Bordeaux, Interdisciplinary Institute for Neuroscience, UMR 5297, France
- CNRS, Interdisciplinary Institute for Neuroscience, UMR 5297, France
- Australian Regenerative Medicine Institute (ARMI), Faculty of Medicine, Nursing and Health Sciences, Monash University, Australia
- European Molecular Biology Laboratory Australia (EMBL Australia), Monash University, Australia
Figures
Figure 1
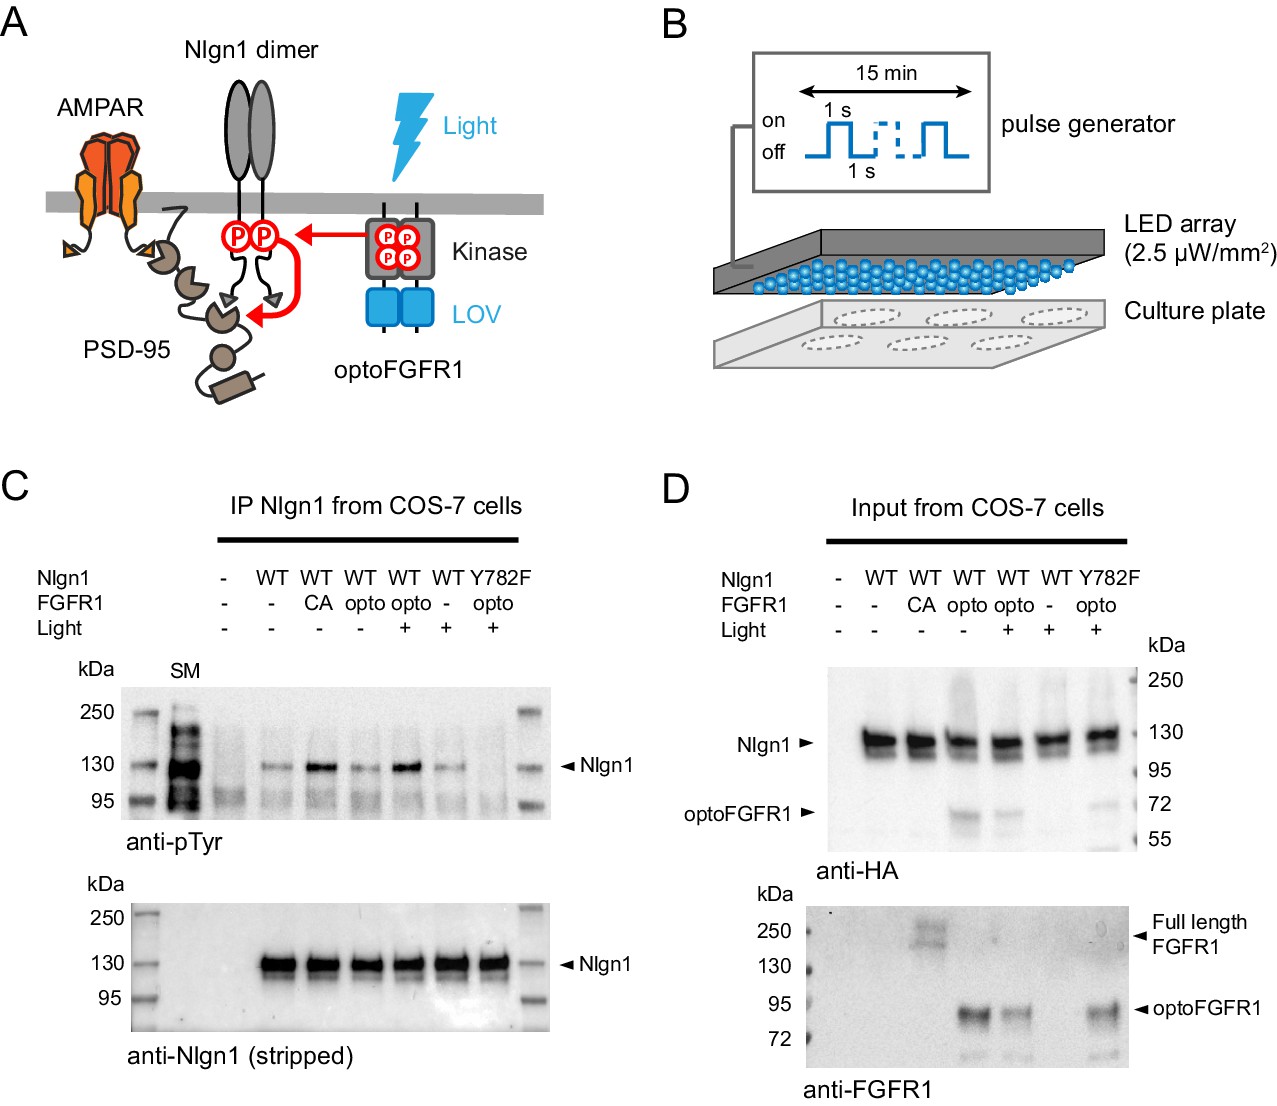
Optogenetic phosphorylation of Nlgn1 at residue Y782.
(A) Schematic diagram of optogenetically-driven Nlgn1 tyrosine phosphorylation using optoFGFR1. Phosphorylated Nlgn1 is expected to recruit PSD-95 that serves as a platform for trapping AMPARs. (B) Scheme representing the 470 LED array that is placed in the incubator and used to illuminate COS-7 cells or organotypic slices contained in a six-well plate. (C) pTyr and Nlgn1 immunoblots of proteins extracted from COS-7 cells and immunoprecipitated with anti-Nlgn1 antibodies. Cells expressed either no Nlgn1, Nlgn1 alone, Nlgn1 + constitutively active (CA) FGFR1, Nlgn1 + optoFGFR1, and Nlgn1-Y782F + optoFGFR1. In the first lane, the starting material (SM) from non-transfected cells reveals numerous tyrosine phosphorylated proteins, whereas a single band is present in the Nlgn1 IP samples (black arrowhead). Cells were either kept in the dark (- light), or exposed to alternative 470 nm light and pulses (1 s light pulse every 1 s) for 15 min (+ light). (D) Corresponding starting material immunoblotted with HA and FGFR1 antibodies, respectively. The arrowheads represent HA-tagged Nlgn1, HA-tagged optoFGFR1, or constitutively active FGFR1.
Figure 2
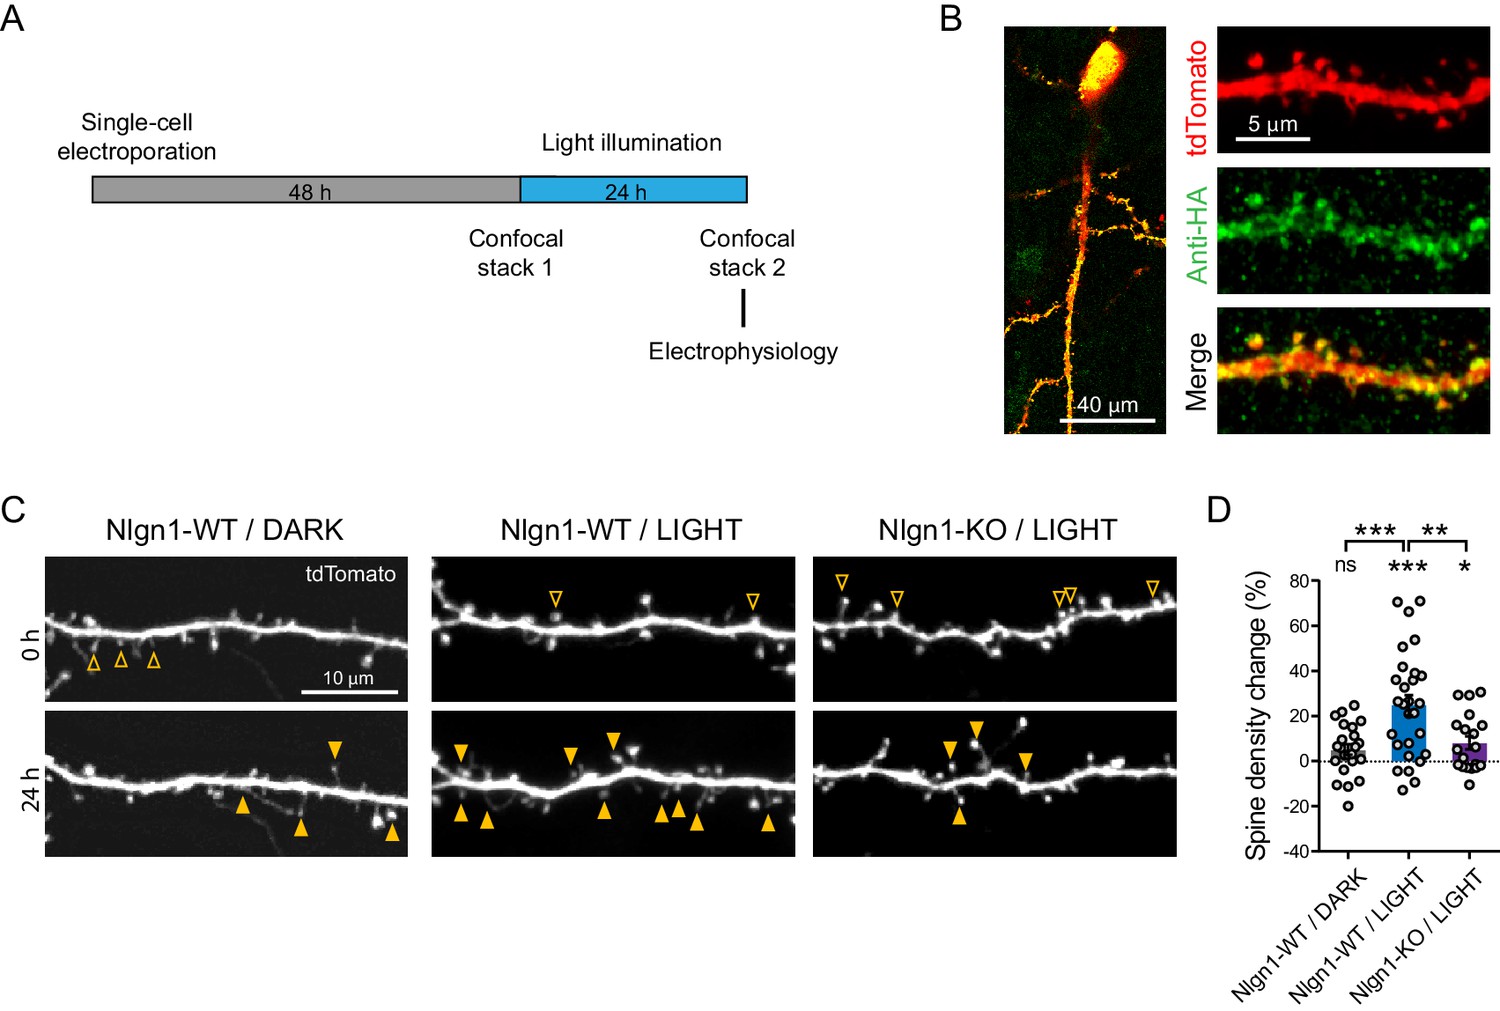
Optogenetic stimulation of optoFGFR1 increases dendritic spine density in a Nlgn1-dependent manner.
(A) Experimental procedure to investigate the effect of the optogenetic stimulation of optoFGFR1 on spine density and synaptic transmission. CA1 neurons in organotypic slices from WT or Nlgn1 KO mice were electroporated at DIV 3–5 with tdTomato and HA-tagged optoFGFR1. Two days later, they were either stimulated with alternating blue light for 24 hr or kept in the dark, and processed for imaging or electrophysiology. (B) Confocal images of CA1 neurons and dendritic segments showing tdTomato (red) and anti-HA immunostaining (green). (C) Confocal images of apical dendrites from electroporated neurons before (0 hr) and 24 hr after light activation of optoFGFR1. Control slices did not receive light, or received light but were from the Nlgn1 KO background. Solid arrowheads point to spines which have appeared, and empty arrowheads to spines which have disappeared in the time interval. (D) Normalized spine density for each condition (n = 19–28 dendrites from N = 5–7 cells). Change in spine density was assessed for each condition using paired t-test (***p<0.001, *p<0.05, ns: not significant). Spine density change was compared across conditions using a one-way ANOVA followed by Tukey’s multiple comparison test (***p<0.001, **p<0.01).
Figure 3 with 1 supplement
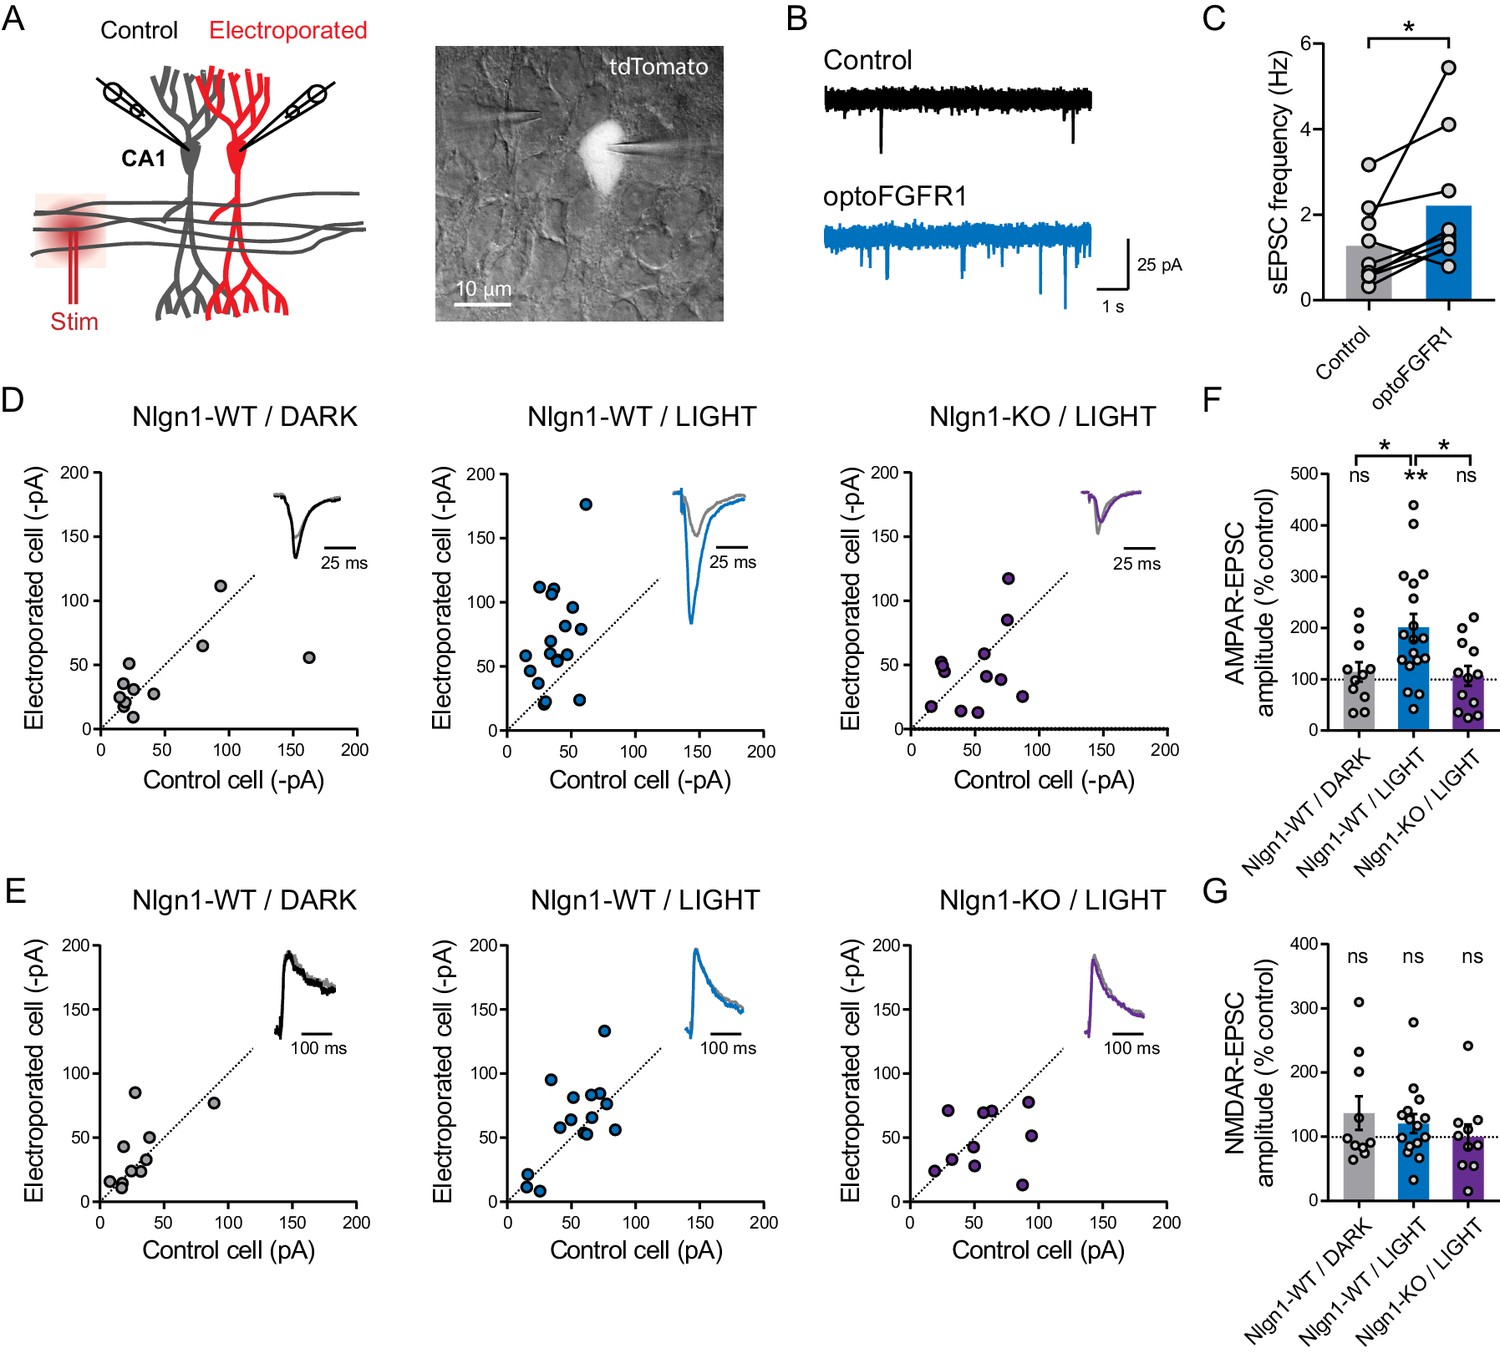
Light activation of optoFGFR1 in CA1 neurons selectively increases AMPA receptor-mediated EPSCs in a Nlgn1-dependent manner.
(A) Dual patch-clamp recordings of AMPAR- and NMDAR-mediated currents upon stimulation of Schaffer’s collaterals were made at holding potentials of −70 and +40 mV (respectively) in electroporated neurons and non-electroporated counterparts. The image shows two patched neurons in the CA1 area, the brighter one expressing optoFGFR1 + tdTomato. (B) Representative electrophysiological recordings of spontaneous AMPAR-mediated EPSCs (sEPSCs) in a control non-electroporated neuron (black trace), and a paired neuron expressing optoFGFR1 and pre-exposed to light for 24 hr (blue trace). (C) Corresponding sEPSC frequency for control neurons and neurons expressing optoFGFR1. Data were compared using the Wilcoxon matched-pairs signed rank test (*p<0.05). (D, E) Scatter plots of AMPAR- and NMDAR-mediated EPSCs, respectively, in neurons expressing optoFGFR1 compared to paired unelectroporated neurons (control cell), in the indicated conditions. Representative traces (color) normalized to control (grey) are shown as insets. (F, G) Average of AMPAR- and NMDAR-mediated EPSCs in the three conditions, normalized to the control (100%). Data were compared to the control condition by the Wilcoxon matched-pairs signed rank test, and between themselves using one-way ANOVA followed by Tukey's multiple comparison (**p<0.01, *p<0.05, ns: not significant).
Figure 3—figure supplement 1
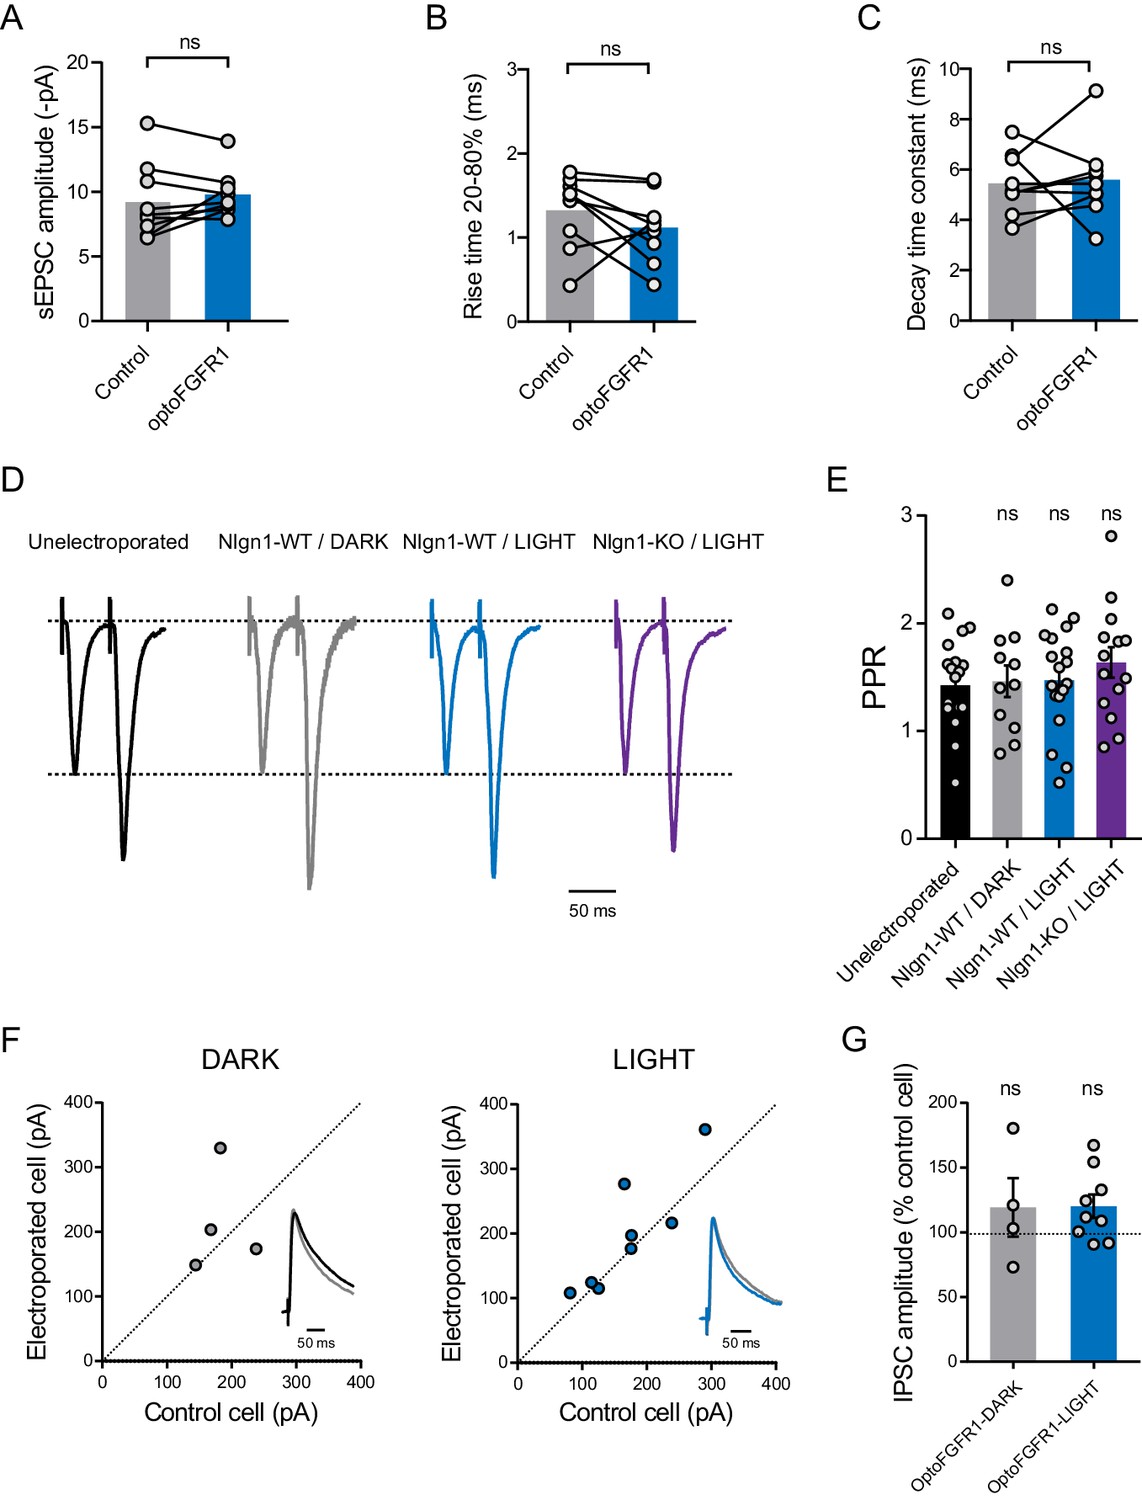
Stimulation of optoFGFR1 does not affect spontaneous AMPAR-mediated EPSC amplitude or kinetics, paired pulse ratio (PPR), or inhibitory currents in CA1 neurons.
(A–C) Quantification of AMPAR-mediated sEPSC amplitude, rise time, and decay time, respectively, for control neurons (grey boxes) and neurons expressing optoFGFR1 (blue boxes). Data were compared using the paired t-test (A,B) or the Wilcoxon matched-pairs signed rank test (C) (ns: not significant). (D) Average EPSC traces in response to paired stimuli (50 ms interstimulus interval) recorded from an unelectroporated WT neuron (in black), WT neurons expressing optoFGFR1 kept in the dark (in grey) or exposed to light (in blue) and a Nlgn1-KO neuron expressing optoFGFR1 and exposed to light (in violet). (E) Average PPR for the same conditions as in (A) (Wilcoxon matched-pairs signed rank test, ns: not significant). Data represent mean ± SE. (F) Scatter plots of IPSCs in optoFGFR1-expressing neurons versus paired unelectroporated neurons (control cell), in the dark (black) and light (blue) and conditions, respectively. Representative IPSCs traces (black or blue) were recorded at a holding potential of +10 mV, normalized to control (grey), and are shown as insets. (G) Average amplitude of IPSCs in the two conditions, normalized to the control (100%). Data were compared to the control condition by the Wilcoxon matched-pairs signed rank test (ns, not significant).
Figure 4 with 1 supplement
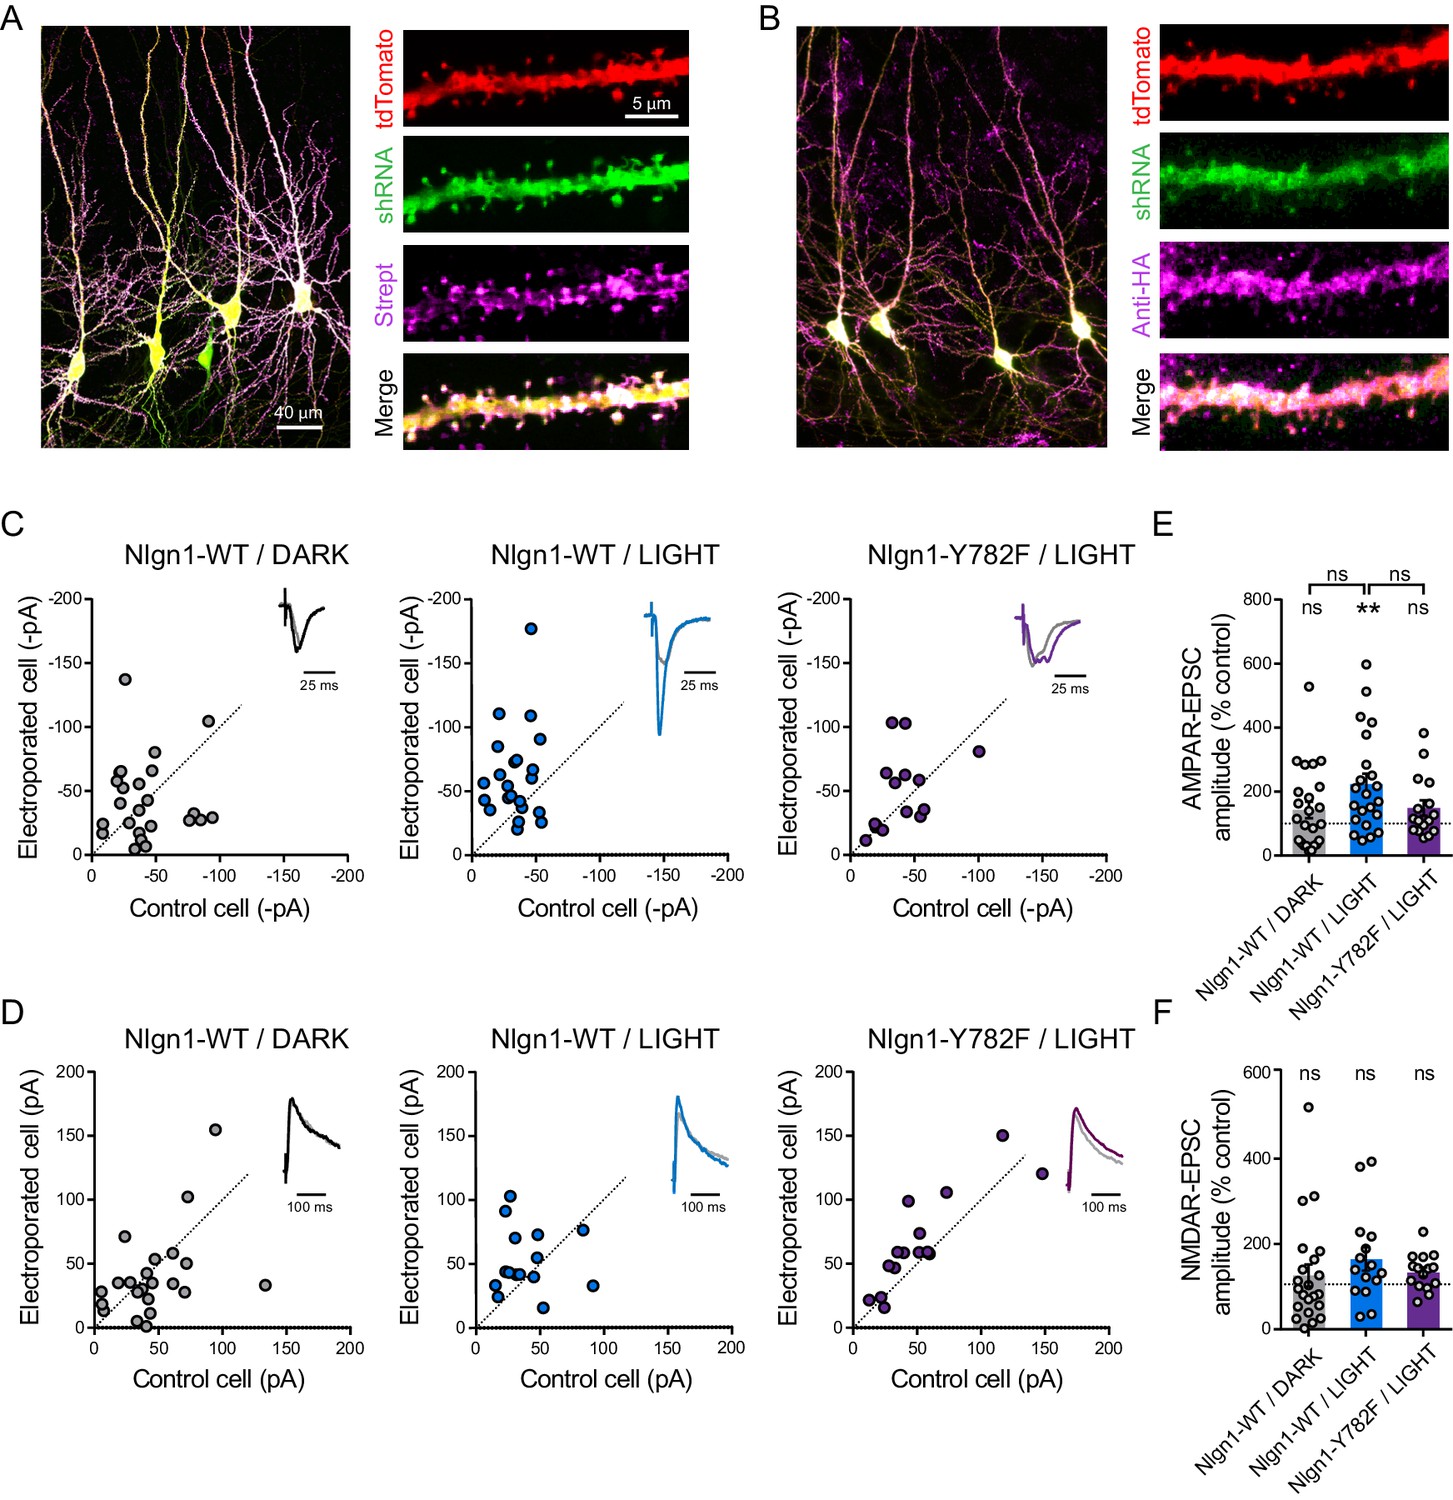
The light-induced increase in AMPA receptor-mediated EPSCs is specific to Y782 phosphorylation in Nlgn1.
CA1 Neurons were co-electroporated with plasmids encoding tdTomato, shRNA against endogenous Nlgn1 containing a GFP reporter, shRNA resistant AP-tagged Nlgn1-WT or -Y782F, biotin ligase (BirAER), and HA-tagged optoFgfr1. (A, B) Confocal images showing tdTomato (red) and GFP (green). Biotinylated Nlgn1 and optoFGFR1 were stained in different slices using streptavidin-Atto647 and anti-HA antibody, respectively (magenta). (C, D) Scatter plots of AMPAR- and NMDAR-mediated EPSCs, respectively, for electroporated versus paired non-electroporated neurons (control cell) in the indicated conditions. Representative traces (black, blue or violet) normalized to control (grey) are shown as insets. (E, F) Average of AMPAR-and NMDAR-mediated EPSCs, respectively, normalized to the control (100%) in the different conditions. Data were compared to the control condition by the Wilcoxon matched-pairs signed rank test and between themselves using one-way ANOVA followed by Tukey's multiple comparison (**p<0.01, ns: not significant).
Figure 4—figure supplement 1
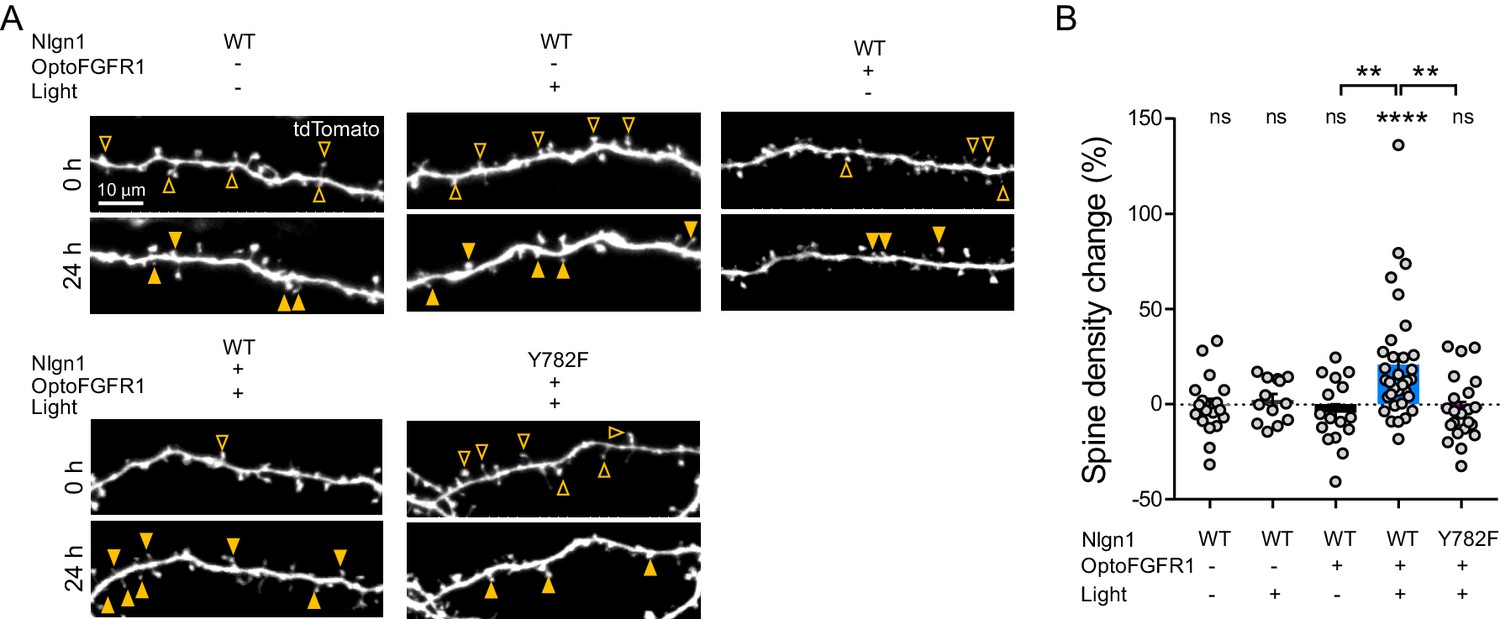
The light-induced increase in spine density is specific to Y782 phosphorylation in Nlgn1.
(A) Confocal images of tdTomato in apical dendrites from CA1 neurons before (0 hr) and after (24 hr) light activation. Control neurons either did not receive light, or did not contain optoFGFR1, or were expressing the Nlgn1-Y782F mutant. Solid arrowheads point to spines which have appeared, and empty arrowheads to spines which have disappeared in the time period. (B) Normalized spine density for each condition (n = 13–33 dendrites from N = 4–10 cells). Change in spine density was assessed for each condition using the paired t-test (****p<0.0001, ns: not significant). Spine density change was compared across conditions using the Kruskal-Wallis test followed by Dunn’s multiple comparison test, paired t-test (**p<0.001).
Figure 5 with 1 supplement
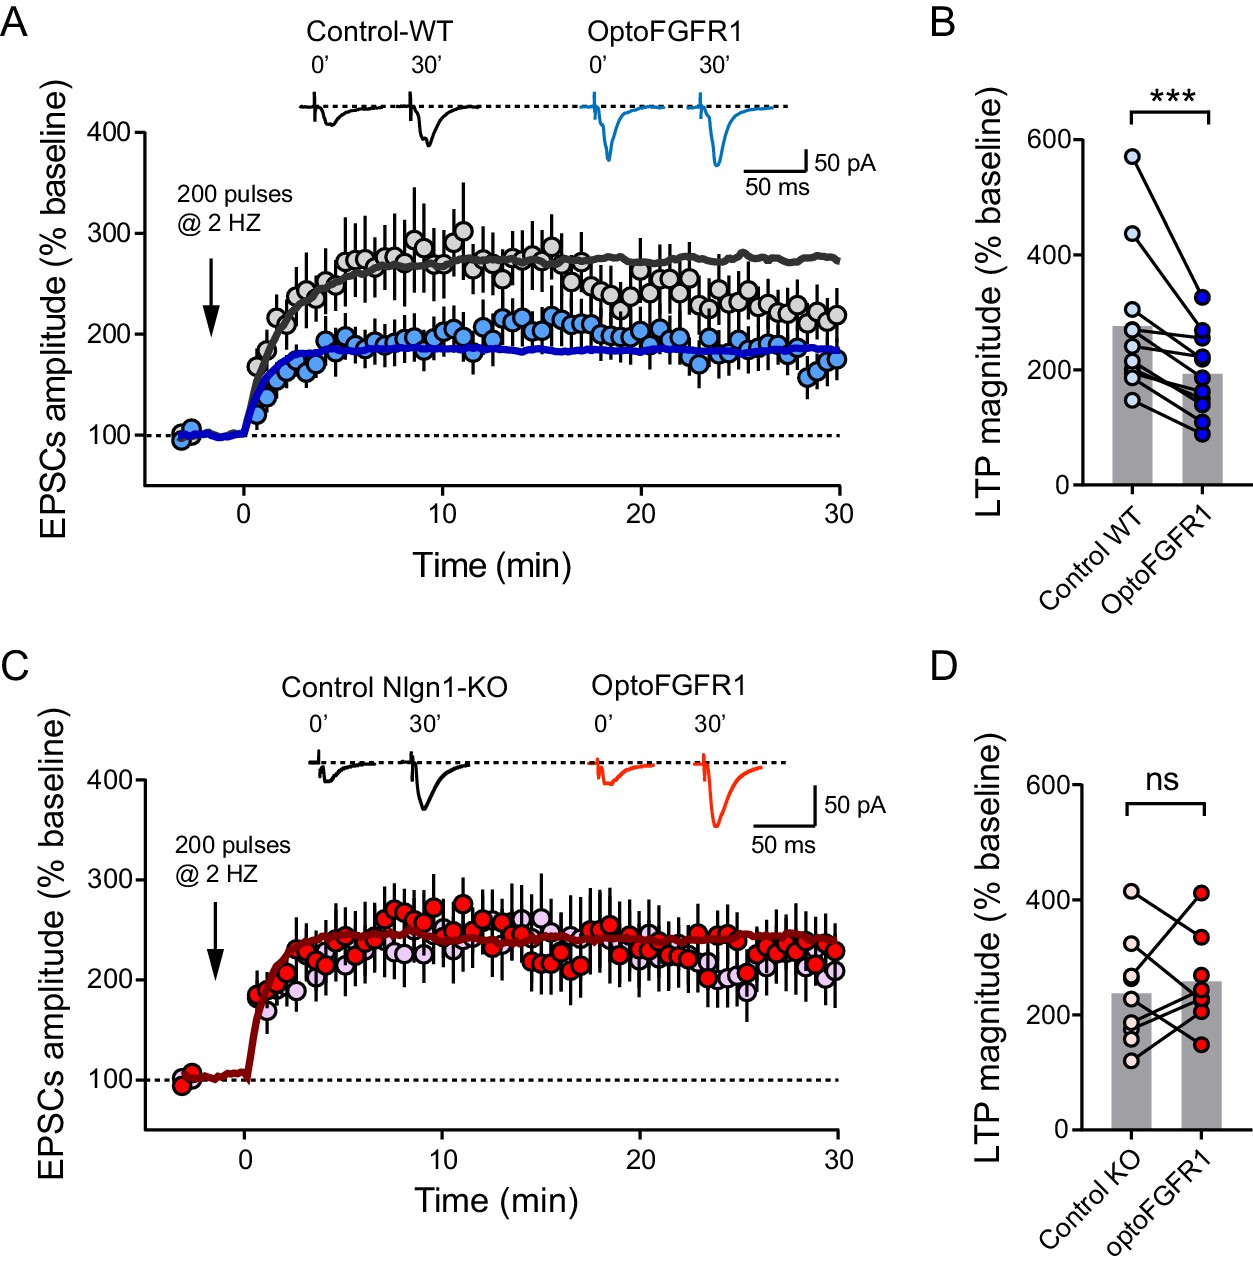
Light activation of Nlgn1 phosphorylation by optoFGFR1 reduces LTP.
(A) Average AMPAR-mediated EPSCs in CA1 neurons expressing optoFGFR1 (blue circles) or in non-electroporated neighbors (grey circles), all pre-exposed to light for 24 hr, upon LTP induction at time 0 using a pairing protocol. Sample traces are shown at time 0 and 30 min after LTP induction. The solid lines show averages from 10 computer simulations for each condition with parameters kon = 1 s−1 (black) or 3 s−1 (blue), and koff drops from 0.04 to 0.004 s−1. (B) Individual values of the long-term plateau of AMPAR-mediated EPSC in the two conditions (6–10 min after LTP induction), expressed as a percentage of the baseline level. Data were compared to the control condition (unelectroporated neuron also exposed to light) by Wilcoxon matched-pairs signed rank test (***p<0.001). (C, D) Similar LTP recordings and quantification in CA1 neurons from Nlgn1 KO slices, with corresponding simulations (red line, kon = 1 s−1 and koff drops from 0.04 to 0.008 s−1). Data were compared to the control condition (unelectroporated neuron also exposed to light) by Wilcoxon matched-pairs signed rank test (ns: non-significant).
Figure 5—figure supplement 1
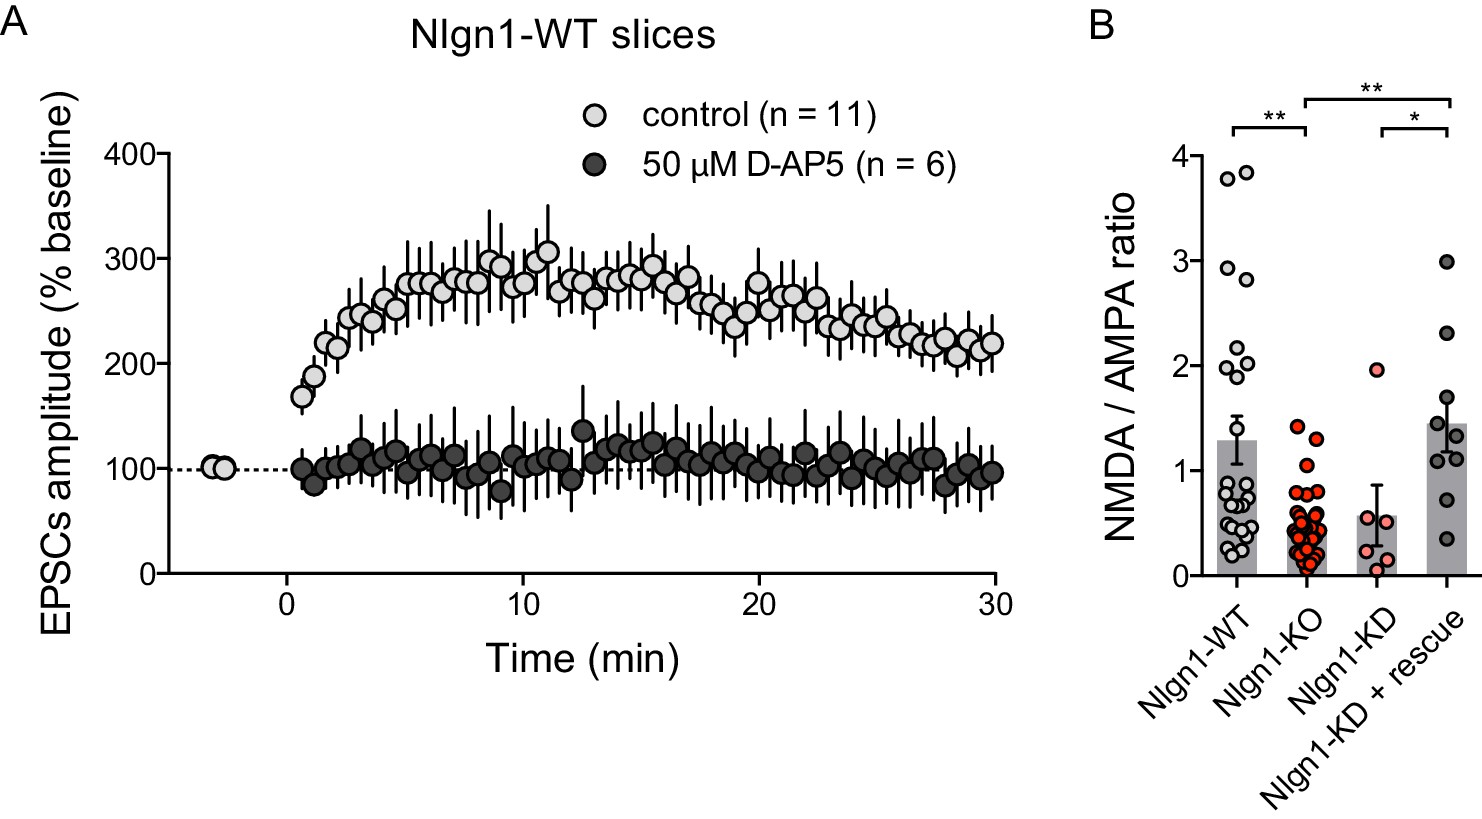
LTP dependence on NMDARs and effect of Nlgn1 expression level on the NMDA/AMPA ratio.
(A) Evoked AMPAR-mediated EPSCs upon induction of LTP at time zero, normalized to baseline, in control ACSF or in the presence of 50 µM D-AP5. Note the abolishment of LTP in the AP5 condition. (B) Quantification of the ratio between NMDAR-mediated and AMPAR-mediated EPSCs calculated in the same CA1 neurons, for different conditions: control unelectroporated neurons from either wild type (Nlgn1-WT, light grey) or Nlgn1-KO (red) slices, neurons from WT slices electroporated with shRNA to Nlgn1 (Nlgn1-KD, pink), and neurons co-electroporated with shRNA to Nlgn1 and AP-tagged Nlgn1 rescue construct (dark grey).
Figure 6 with 1 supplement
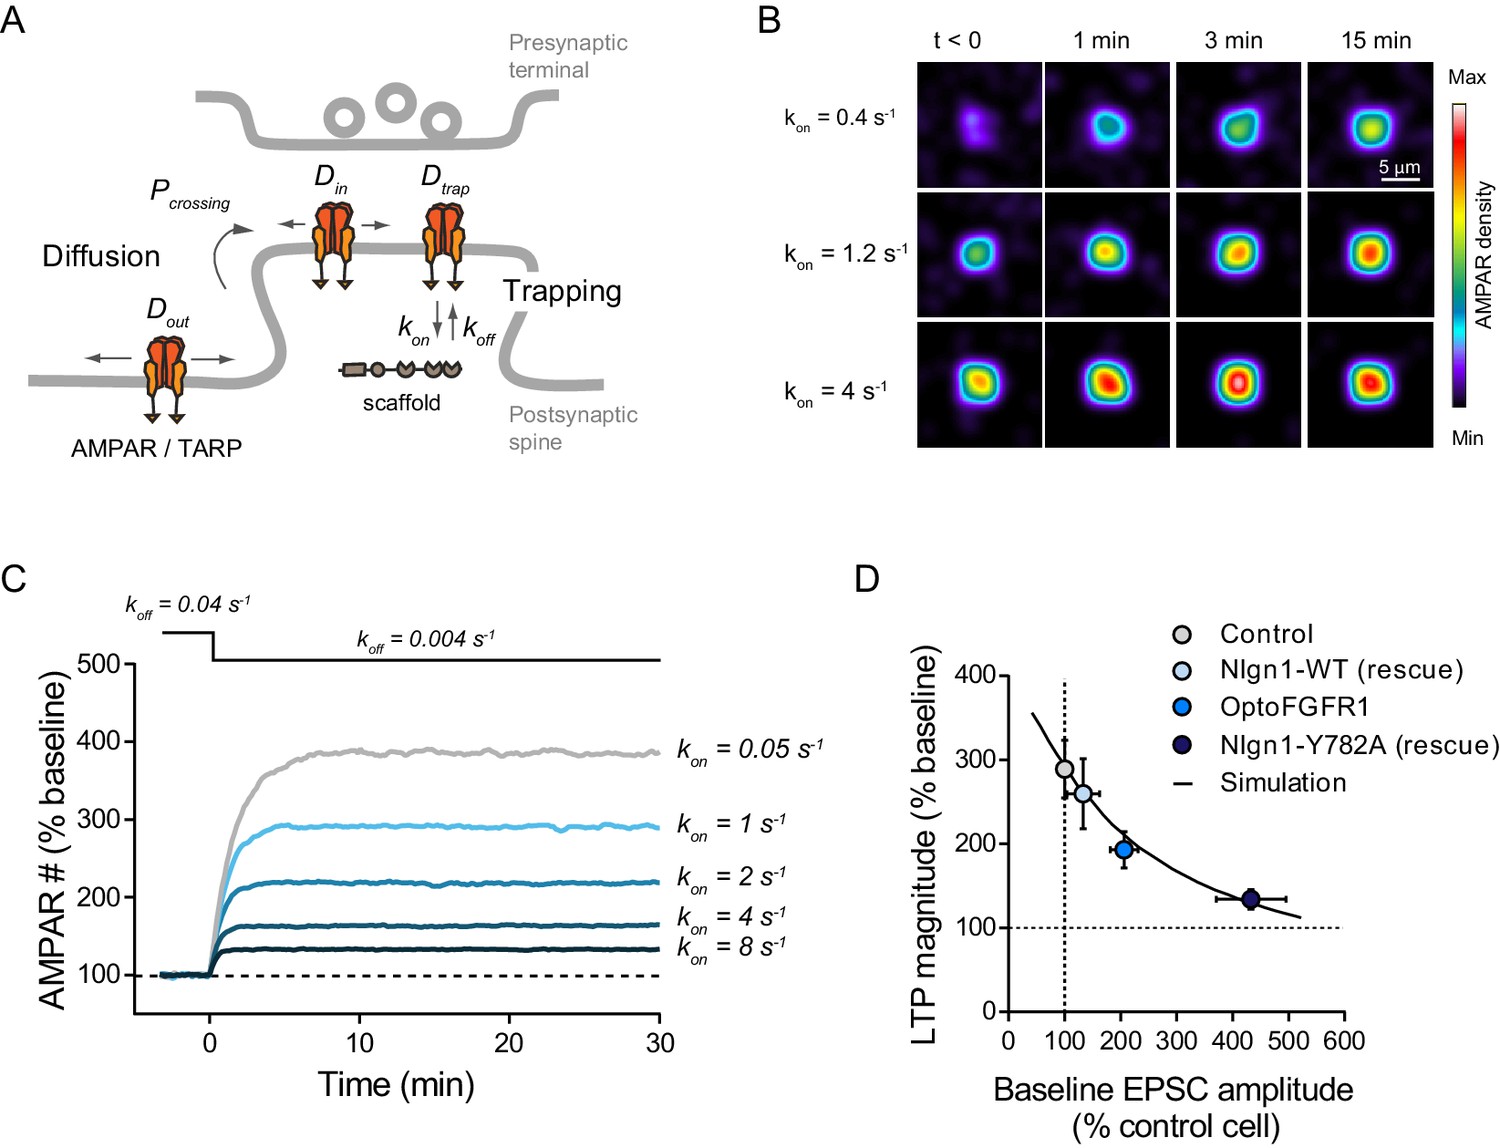
Modeling LTP experiments.
(A) Schematic diagram of the AMPAR diffusion/trap process, with model parameters being indicated in italic. (B) Heat maps representing simulations of AMPAR accumulation at a single synapse over time. LTP is mimicked by decreasing the AMPAR/scaffold off-rate, causing a diffusional trapping of AMPARs from extra-synaptic pools. Nlgn1 phosphorylation is mimicked by increasing the initial AMPAR/scaffold on-rate, resulting in higher basal AMPAR level and lower LTP (relatively to baseline). (C) Graph showing the relative change in synaptic AMPAR content (in % of baseline) over time, when LTP is simulated by a drop in koff from 0.04 to 0.004 s−1 at time zero. Curves correspond to different values of the parameter kon ranging from 0.05 to 8 s−1. (D) Relationship between basal synaptic AMPAR content and LTP plateau level (% of baseline). Experimental points (circles) were obtained from non-electroporated neurons (grey), neurons expressing opoFGFR1 and stimulated with light (blue), or neurons co-expressing shRNA to Nlgn1 and either Nlgn1-WT (light blue) or Nlgn1-Y782A (dark blue) data taken from Letellier et al. (2018). Basal AMPAR-mediated EPSCs were normalized to match a synaptic level of 33 AMPARs in the control condition (Levet et al., 2015). The solid line represents simulated data generated by varying the AMPAR/scaffold binding rate from 0.1 to 10 s−1.
Figure 6—figure supplement 1
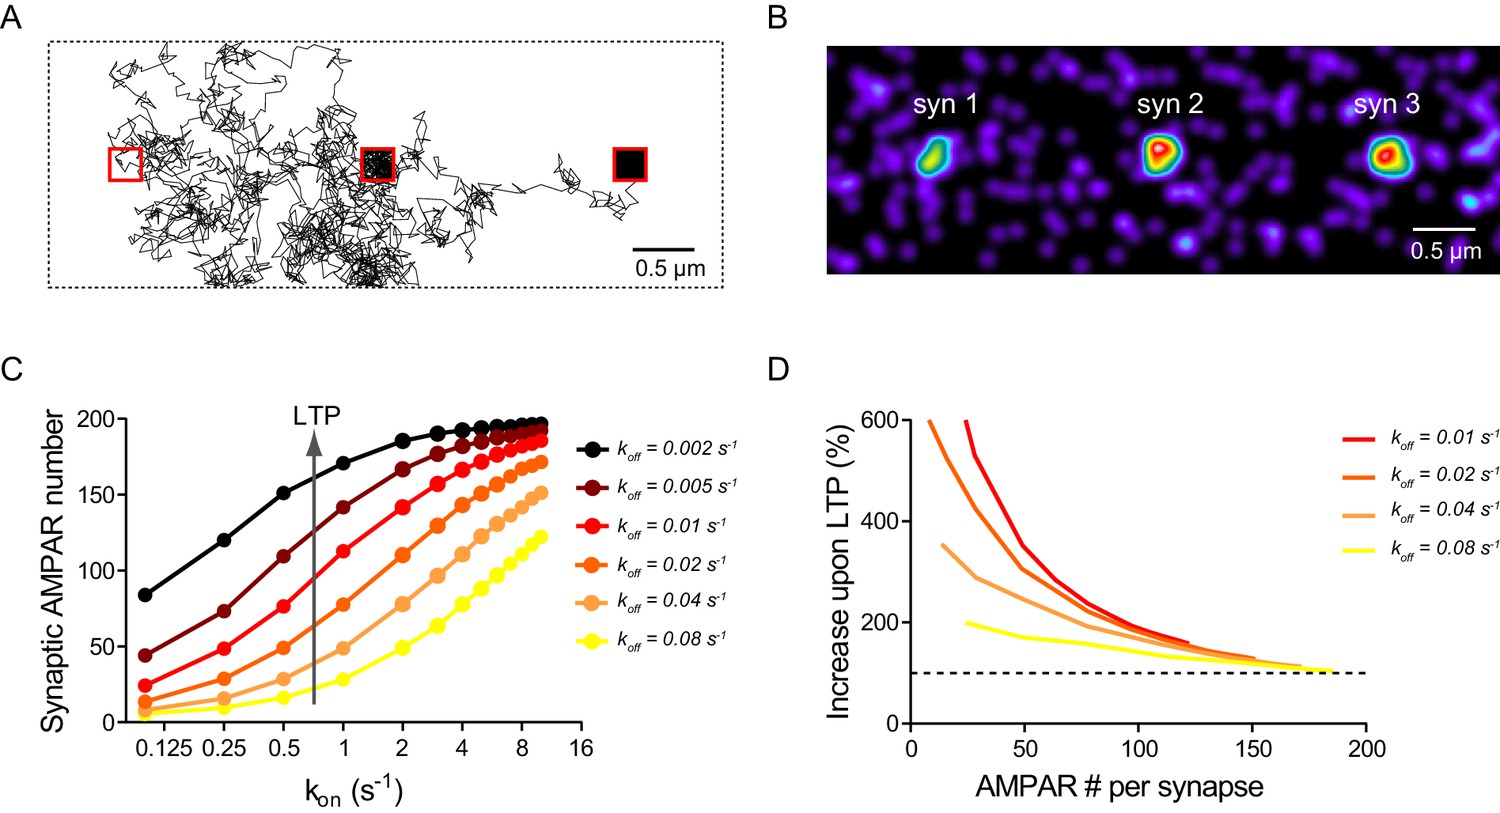
Computer simulations of AMPAR diffusion/trapping in LTP.
(A) Representative example of a single simulated AMPAR trajectory (time step Δt = 0.1 s, total duration 200 s). Note the fast AMPAR extra-synaptic diffusion and the slow diffusion when the AMPAR is trapped within the synapse (red squares). (B) Still image illustrating the steady-state distribution of AMPARs in the simulated neurite geometry. Individual AMPARs are represented by a Gaussian intensity profile of FWHM of 25 nm. Note AMPAR accumulation at synapses. (C) Graph showing the steady-state synaptic AMPAR number versus the AMPAR/scaffold binding rate (kon ranging from 0.05 s−1 to 10 s−1), for different values of the unbinding rate (koff ranging from 0.002 s−1 to 0.08 s−1). The synaptic AMPAR level saturates at high kon and/or low koff values due to the depletion of the finite AMPAR extra-synaptic pool. (D) Predicted relationship between the basal synaptic AMPAR content and the LTP response, expressed as a percentage of the AMPAR baseline (dashed line). The four curves represent different initial koff values (the final value is 0.004 s−1 for all conditions), for a constant kon = 1 s−1.
Tables
Key resources table
| Reagent type (species) or resource | Designation | Source or reference | Identifiers | Additional information |
|---|---|---|---|---|
| Gene (Mus musculus) | Nlgn1 | NCBI | NM_138666.4 | |
| Gene (Mus musculus) | Fgfr1 | NCBI | NM_010206.3 | |
| Strain, strain background (Mus musculus) | C57Bl/6J | Charles River | RRID:IMSR_JAX:000664 | |
| Genetic reagent (Mus musculus) | Nlgn1-KO | Varoqueaux et al., 2006 (PMID:16982420) | RRID:MGI:3688627 | N. Brose (MPI Goettingen) C57Bl/6J background |
| Cell line (Simian) | COS-7 | ATCC | RRID:CVCL_0224 | |
| Biological sample (Mus muscumus) | Organotypic slices (350 µm) | This paper Stoppini et al. (1991) (PMID:1715499) | Prepared from P5-P8 animals. From C57Bl/6J WT or Nlgn1-KO mice | |
| Transfected construct Mus musculus | HA-Nlgn1 | P. Scheiffele (Biozentrum, Basel) | In COS cells with X-TremeGENE kit | |
| Transfected construct Mus musculus | Fgfr1 V561M-FLAG (CA) | This paper | Obtained with In-Fusion HD Cloning Kit using Fgfr1-V561M-F and Fgfr1-V561M-R primers on the Fgfr1-Flag plasmid. In COS cells | |
| Transfected construct Mus musculus | optoFgfr1-HA | Grusch et al., 2014 (PMID:24986882) | (RRID:Addgene_58745 | In COS cells with X-TremeGENE kit. In organotypic slices by single cell electroporation. |
| Transfected construct Mus musculus | HA-Nlgn1 Y782F | Giannone et al., 2013 (PMID:23770246) | In COS cells with X-TremeGENE kit. | |
| Transfected construct (Synthetic) | tdTomato | R. Tsien (UC San Diego, CA) | In organotypic slices by single cell electroporation. | |
| Transfected construct (M. musculus) | Nlgn1 -shRNA (targeting Nlgn1) | Chih et al., 2005 (PMID:15681343) | RRID:Addgene_59339 | Gift from P. Scheiffele In organotypic slices by single cell electroporation. |
| Transfected construct (M. musculus) | AP-Nlgn1 rescue (shRNA resistant) | Chamma et al., 2016 (PMID:26979420) | In organotypic slices by single cell electroporation. | |
| Transfected construct (M. musculus) | AP-Nlgn1 Y782F rescue (shRNA resistant) | Letellier et al., 2018 (PMID:30266896) | In organotypic slices by single cell electroporation. | |
| Transfected construct (M. musculus) | BirAER | A. Ting (Stanford University, CA) | ||
| Recombinant DNA reagent (M. musculus) | Fgfr1-Flag plasmid | Duchesne et al., 2006 PMID:16829530 | L. Duchesne (Université de Rennes) | |
| Sequence-based reagent | Primers Fgfr1-V561M-F; Fgfr1-V561M-R | This paper From Eurogentec | TGTCATTATGGAGTACGCCTC; TACTCCATAATGACATAAAGAGG | |
| Antibody | anti-Nlgn1 (Rabbit polyclonal) | Synaptic systems 129013 | RRID:AB_2151646 | IP (2 µg) WB (1:1000) |
| Antibody | anti-phosphotyrosine P-Tyr-100 (Mouse monoclonal) | Cell Signaling Technology 9411 | RRID:AB_331228 | WB (1:1000) |
| Antibody | anti-FGFR1 (monoclonal polyclonal) | Cell Signaling Technology D8E4 9740 | RRID:AB_11178519 | WB (1:1000) |
| Antibody | anti-HA (Rat monoclonal) | Roche 3F10 11867423001 | RRID:AB_390918 | WB (1:1000) IHC (1:100) |
| Antibody | Easyblot HRP antibodies anti-mouse;anti-rabbit | GeneTex GTX221667-01;GTX221666-01 | RRID:AB_10728926; RRID:AB_10620421 | WB (1:1000) |
| Antibody | Alexa647-conjugated anti-rat antibody (Goat Polyclonal) | Molecular Probes A21247 | RRID:AB_141778 | IHC (1:200) |
| Peptide, recombinant protein | NeutrAvidin | Invitrogen | A2666 | IHC (1:200) |
| Commercial assay or kit | In-Fusion HD Cloning Kit | Takara Bio | 639642 (Ozyme) | In COS cells |
| Commercial assay or kit | X-tremeGENE HP DNA Transfection Reagent | Roche (RRID:SCR_001326) | 6366546001 | |
| Commercial assay or kit | Dynabeads Protein G | Thermo Fisher Scientific (RRID:SCR_008452) | 10004D | For immunoprecipitation |
| Chemical compound, drug | D-AP5 | TOCRIS (RRID:SCR_003689) | 0106/10 | 50 µM |
| Chemical compound, drug | Bicuculline | TOCRIS (RRID:SCR_003689) | 0130/50 | 20 µM |
| Chemical compound, drug | NBQX | TOCRIS (RRID:SCR_003689) | 0373/10 | 100 nM or 10 µM |
| Chemical compound, drug | NHS-ester ATTO 647N | ATTO-TEC GmbH | AD 647 N-31 | |
| Software, algorithm | Metamorph | Molecular Devices | RRID:SCR_002368 | |
| Software, algorithm | GraphPad | PRISM | RRID:SCR_002798 | |
| Software, algorithm | Clampex | Axon Instruments | ||
| Software, algorithm | Clampfit | Axon Instruments | ||
| Software, algorithm | Minianalysis | Synaptosoft | RRID:SCR_002184 | |
| Software, algorithm | FluoSim | Lagardère et al., 2020 (DOI:10.1101/2020.02.06.937045) | Full source code will be deposited on GitHub upon paper acceptance |
Additional files
-
Source code 1
LTP program description.
- https://cdn.elifesciences.org/articles/52027/elife-52027-code1-v1.docx
-
Transparent reporting form
- https://cdn.elifesciences.org/articles/52027/elife-52027-transrepform-v1.docx
Download links
A two-part list of links to download the article, or parts of the article, in various formats.
Downloads (link to download the article as PDF)
Open citations (links to open the citations from this article in various online reference manager services)
Cite this article (links to download the citations from this article in formats compatible with various reference manager tools)
Optogenetic control of excitatory post-synaptic differentiation through neuroligin-1 tyrosine phosphorylation
eLife 9:e52027.
https://doi.org/10.7554/eLife.52027


