Sequentially induced motor neurons from human fibroblasts facilitate locomotor recovery in a rodent spinal cord injury model
- Hans Schöler Stem Cell Research Center (HSSCRC), Ulsan National Institute of Science and Technology (UNIST), Republic of Korea
- School of Life Sciences, Ulsan National Institute of Science and Technology (UNIST), Republic of Korea
- Department of Neurosurgery, Spine and Spinal Cord Institute, Severance Hospital, Yonsei University College of Medicine, Republic of Korea
- Computational Biology and Systems Biomedicine Group, Computational Biomedicine Data Analysis Platform, Biodonostia Health Research Institute, Spain
- Department of Cell and Developmental Biology, Max Planck Institute for Molecular Biomedicine, Germany
- IKERBASQUE, Basque Foundation for Science, Spain
Figures
Figure 1 with 6 supplements
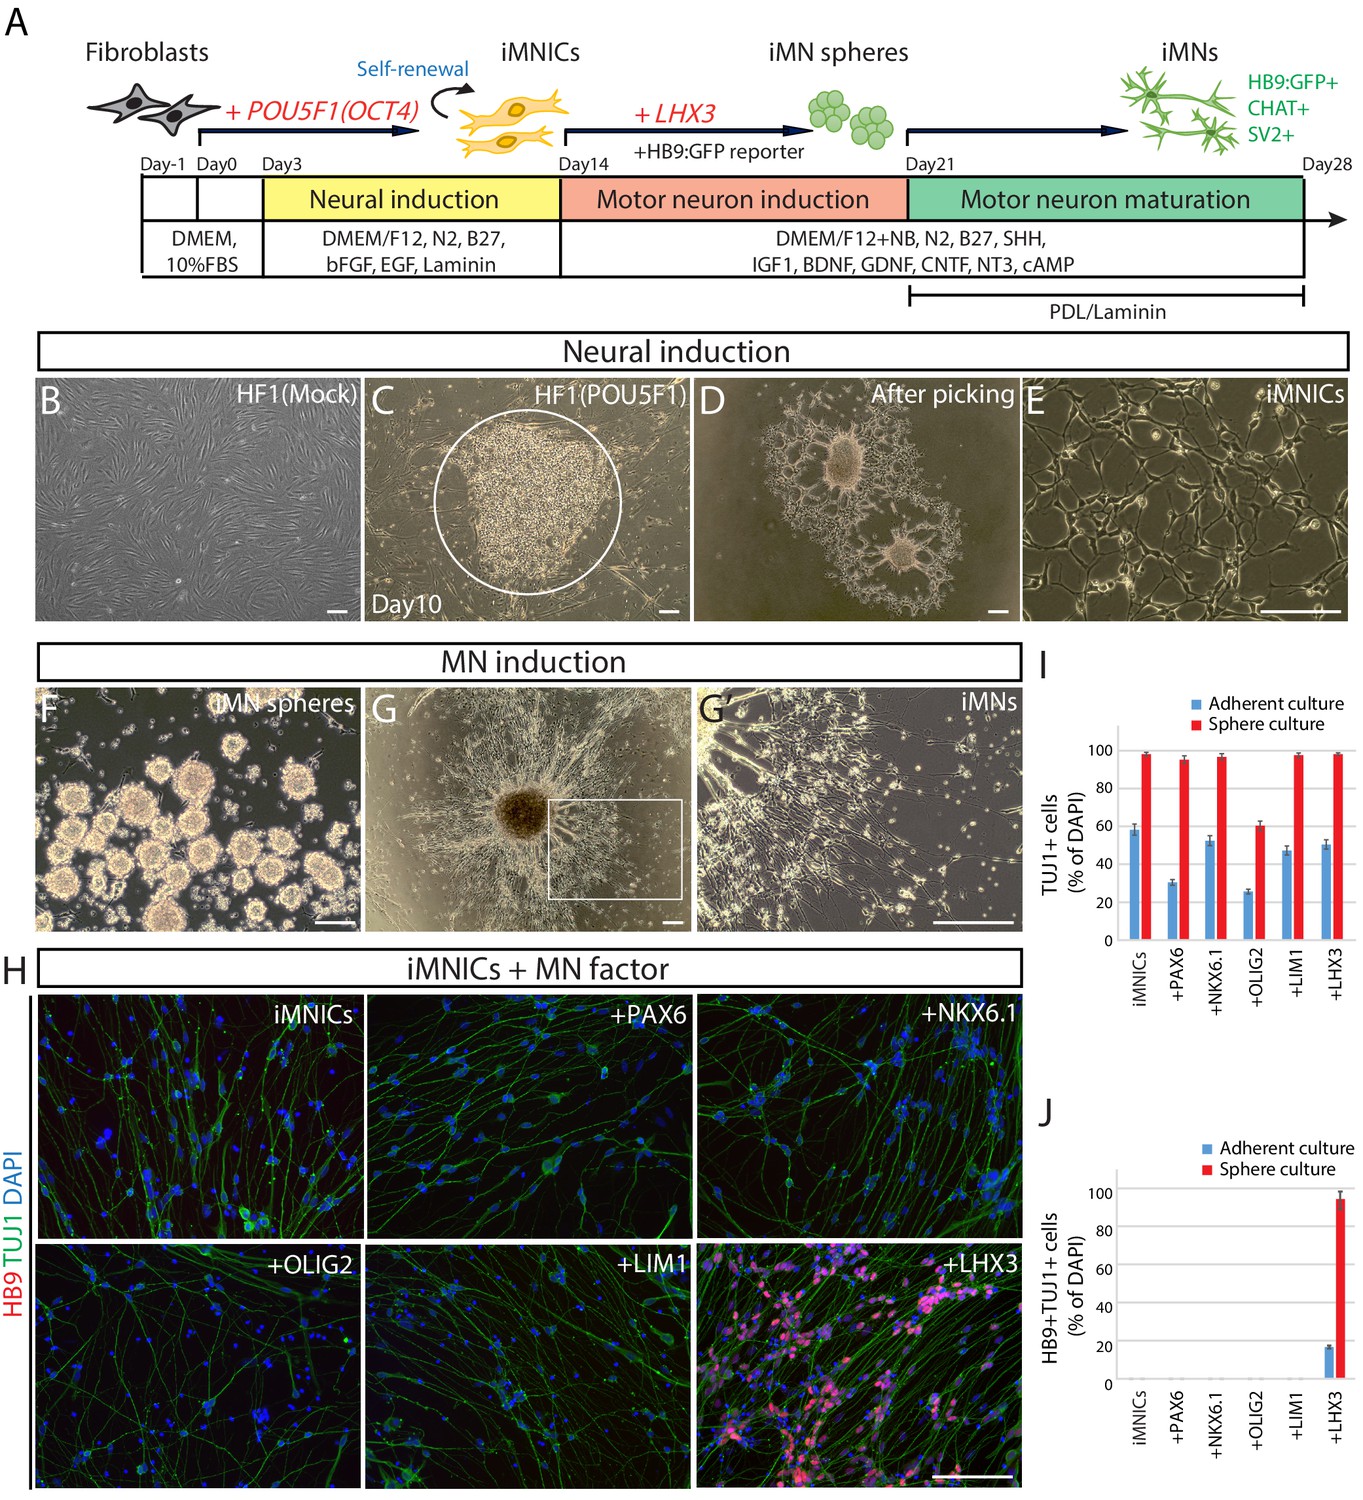
Generation of induced motor neurons (iMNs) from human fibroblasts.
(A) The experimental scheme for the generation of iMNs by sequential transduction of two transcription factors. (B–G) The morphological change of human fibroblasts (HF1) during reprogramming. (B) The morphology of mock-infected HF1 in neural induction medium. (C) The emergence of cell cluster after 10 days of POU5F1(OCT4) infection in neural induction medium. (D) The morphology of POU5F1(OCT4)-infected cells after picking. (E) The morphology of iMNICs after passage. (F) Appearance of iMN spheres in motor neuron induction medium. (G) The morphology of iMNs on PDL/Laminin-coated plate. (G’) Zoomed image of the square in (G) shows complex axonal processes. Scale bars, 125 μm in (B–G’). (H) Immunofluorescence images of iMNs (HF1-iMN2) converted from iMNICs after 14 days of MN factor transduction under sphere culture condition. Addition of LHX3 to iMNICs but not any other MN factors enhanced conversion efficiency to generate HB9+TUJ1+ iMNs. The cells were co-stained with HB9 (red) and TUJ1 (green), and the nuclei were counterstained with DAPI. Scale bars, 125 μm. (I–J) Conversion efficiency determined by quantification of TUJ1+ cells (I) and HB9+TUJ1+ cells (J) depending on transduced MN factor and culture condition. Data are presented as mean ± SD (n = 3), and represent triplicate experimental replicates. Related data can be found in Figure 1—figure supplements 1–6.
-
Figure 1—source data 1
Quantification of TUJ1+/HB9+TUJ1+ iMNs depending on TF, qRT-PCR analysis of MN genes, and qRT-PCT analysis of endogenous expression of POU5F1, NANOG, and SOX2.
- https://cdn.elifesciences.org/articles/52069/elife-52069-fig1-data1-v1.xlsx
Figure 1—figure supplement 1
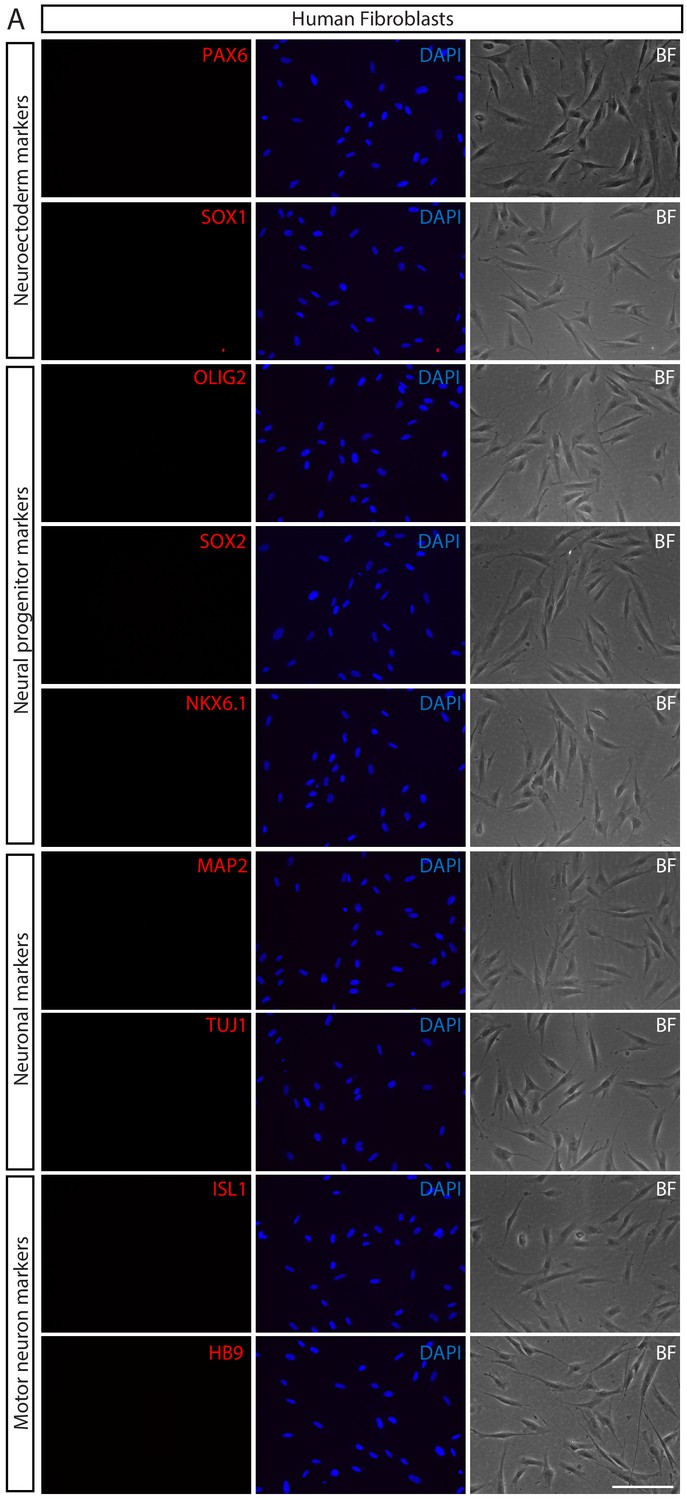
Validation of parental human fibroblasts.
(A) Immunofluorescence images of human fibroblasts stained with neuroectoerm markers (PAX6 and SOX1), neural progenitor markers (OLIG2, SOX2, and NKX6.1), neuronal markers (MAP2 and TUJ1), and motor neuron markers (HB9 and ISL1). The nuclei were counterstained with DAPI. Morphology of fibroblasts are shown under bright field (BF) microscopy. Scale bars, 75 µm.
Figure 1—figure supplement 2
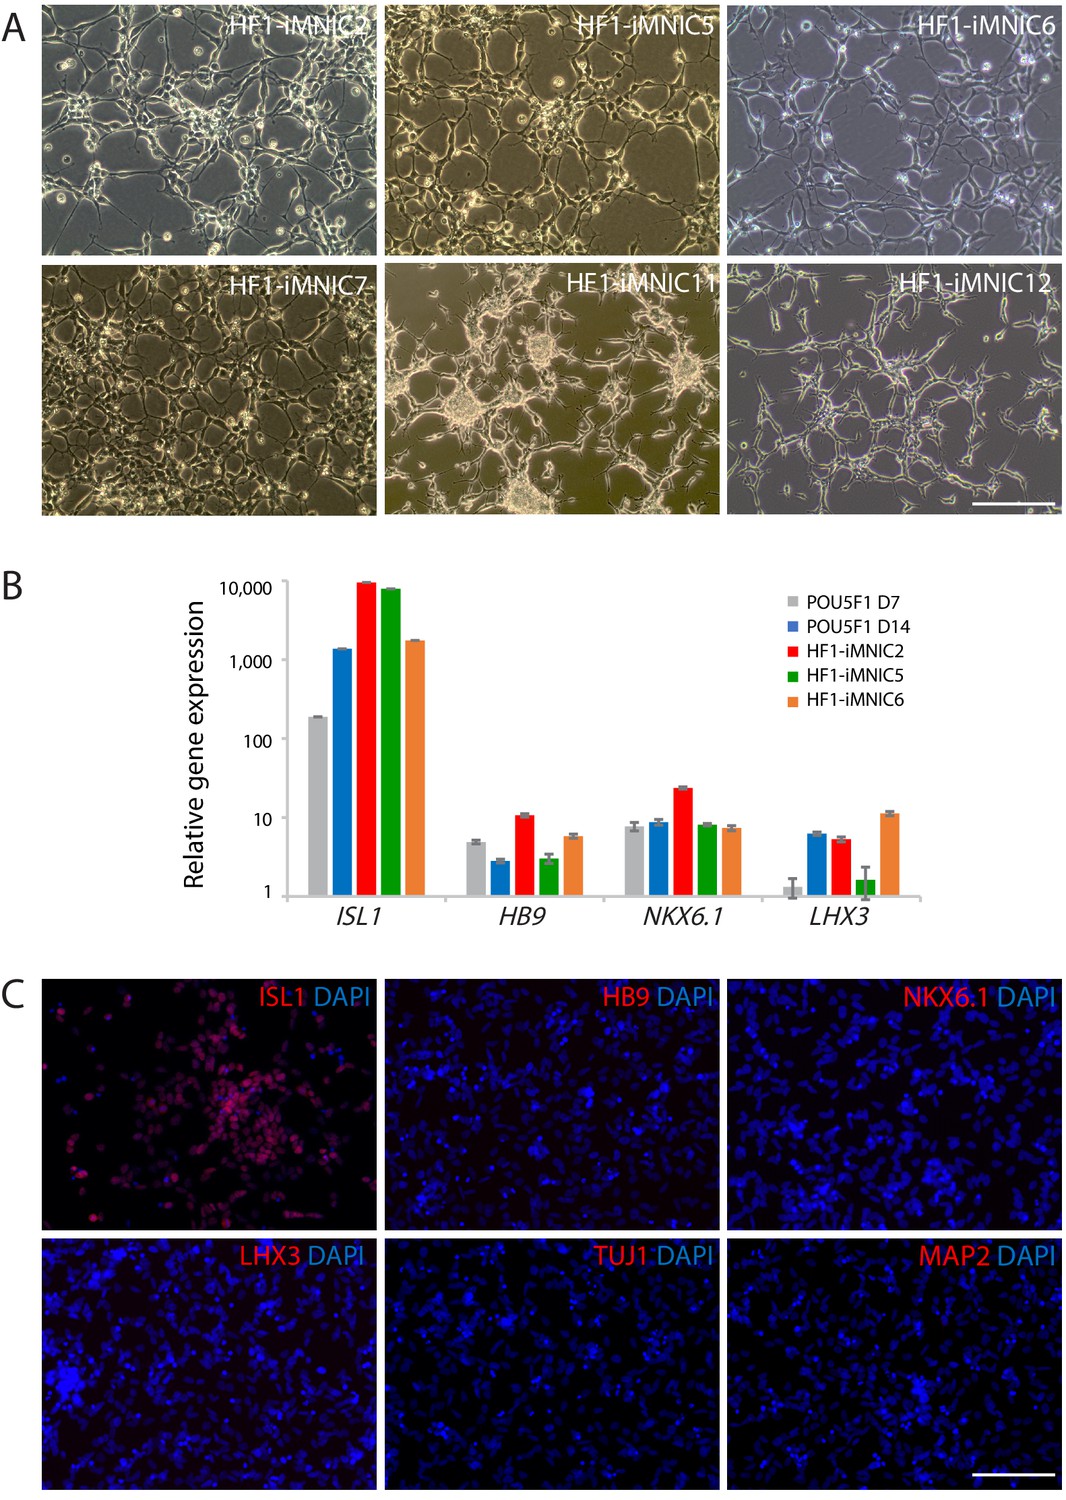
Establishment of iMNIC clones and upregulation of ISL1 expression after POU5F1(OCT4) induction.
(A) The morphology of established iMNIC clones (HF1-iMNIC2, 5, 6, 7, 11 and 12). Scale bars, 125 μm. (B) qRT-PCR analysis of mRNA expression level for motor neuron genes (ISL1, HB9, NKX6.1, and LHX3) in cells at day 7 and 10 after POU5F1(OCT4) transduction and iMNIC clones relative to fibroblasts. Graphs present fold changes after normalization to GAPDH. Data are presented as mean ± SD, and represent experimental replicates (n = 3). (C) Immunofluorescence images of iMNICs stained with motor neuron markers (ISL1, HB9, NKX6.1 and LHX3), and neuronal marker (TUJ1 and MAP2). The nuclei were counterstained with DAPI. Scale bars, 125 µm.
Figure 1—figure supplement 3
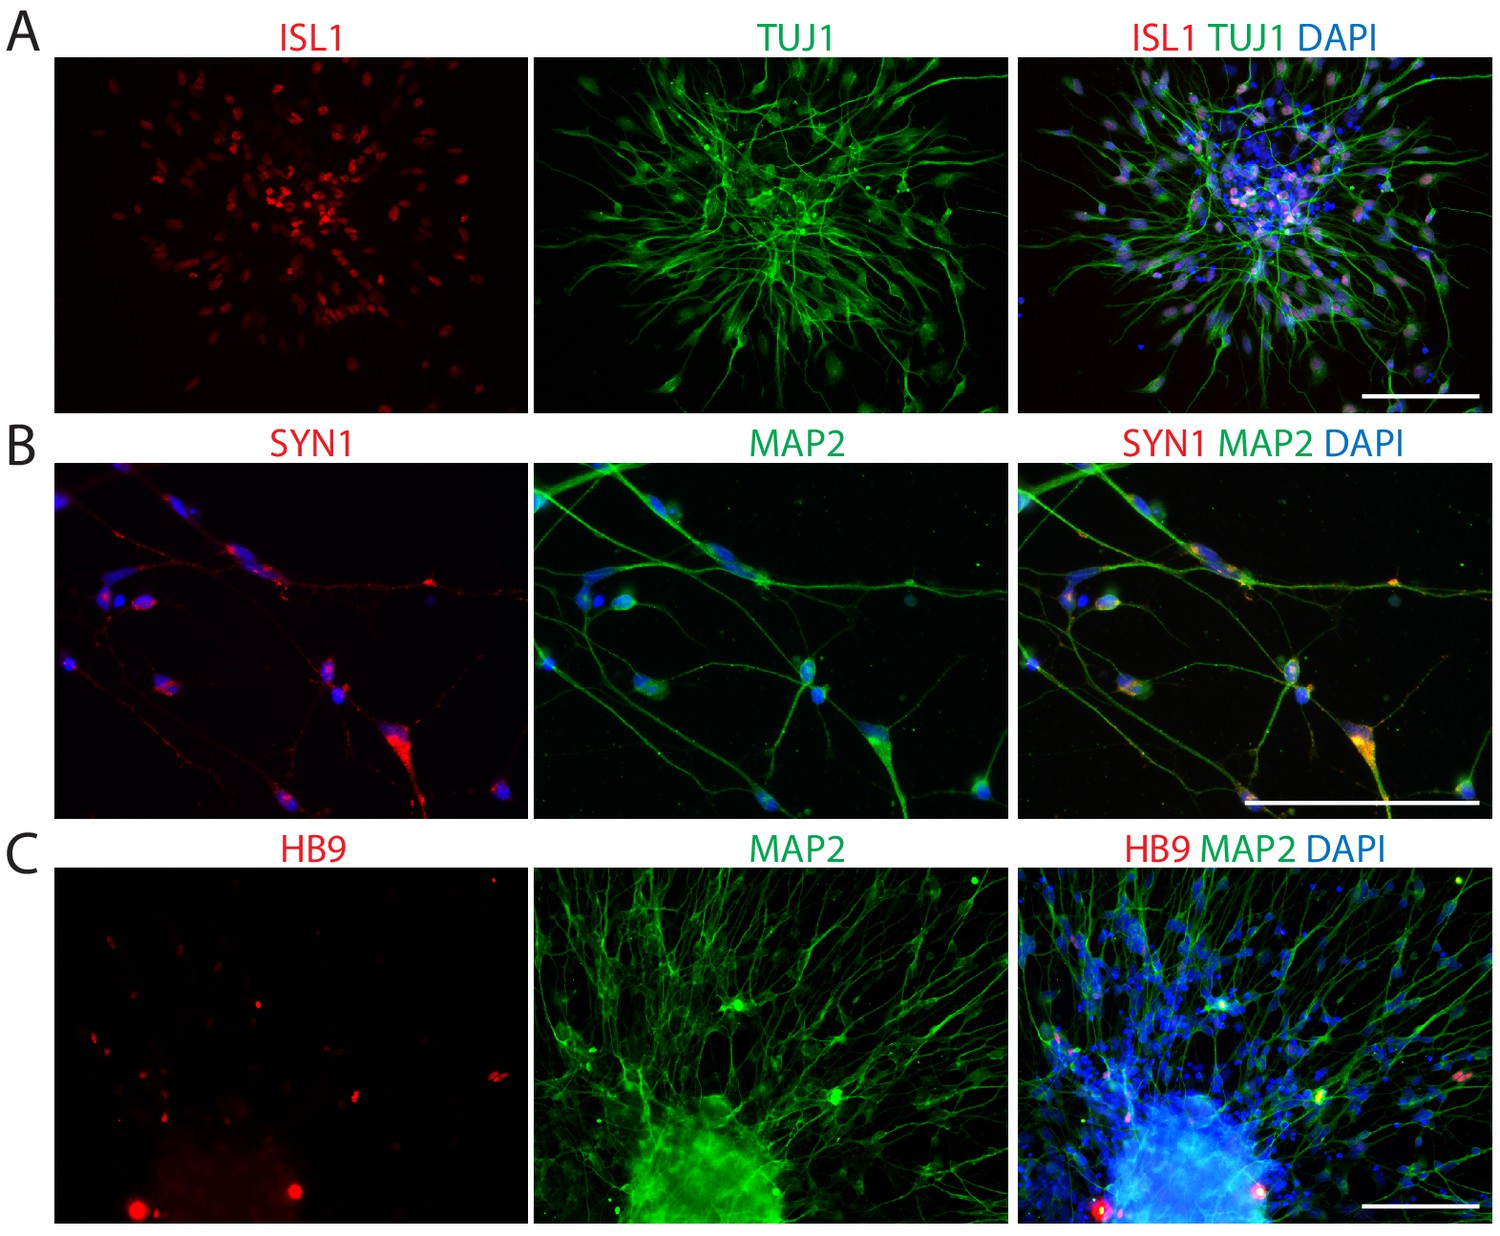
Characterization of iMNs converted by POU5F1(OCT4) alone.
(A–C) Immunofluorescence images of iMNs generated through POU5F1(OCT4) transduction. The cells were stained by using antibodies against ISL1, TUJ1 (A), SYN1, MAP2 (B), and HB9, MAP2 (C). The nuclei were counterstained with DAPI. Scale bars, 125 μm.
Figure 1—figure supplement 4
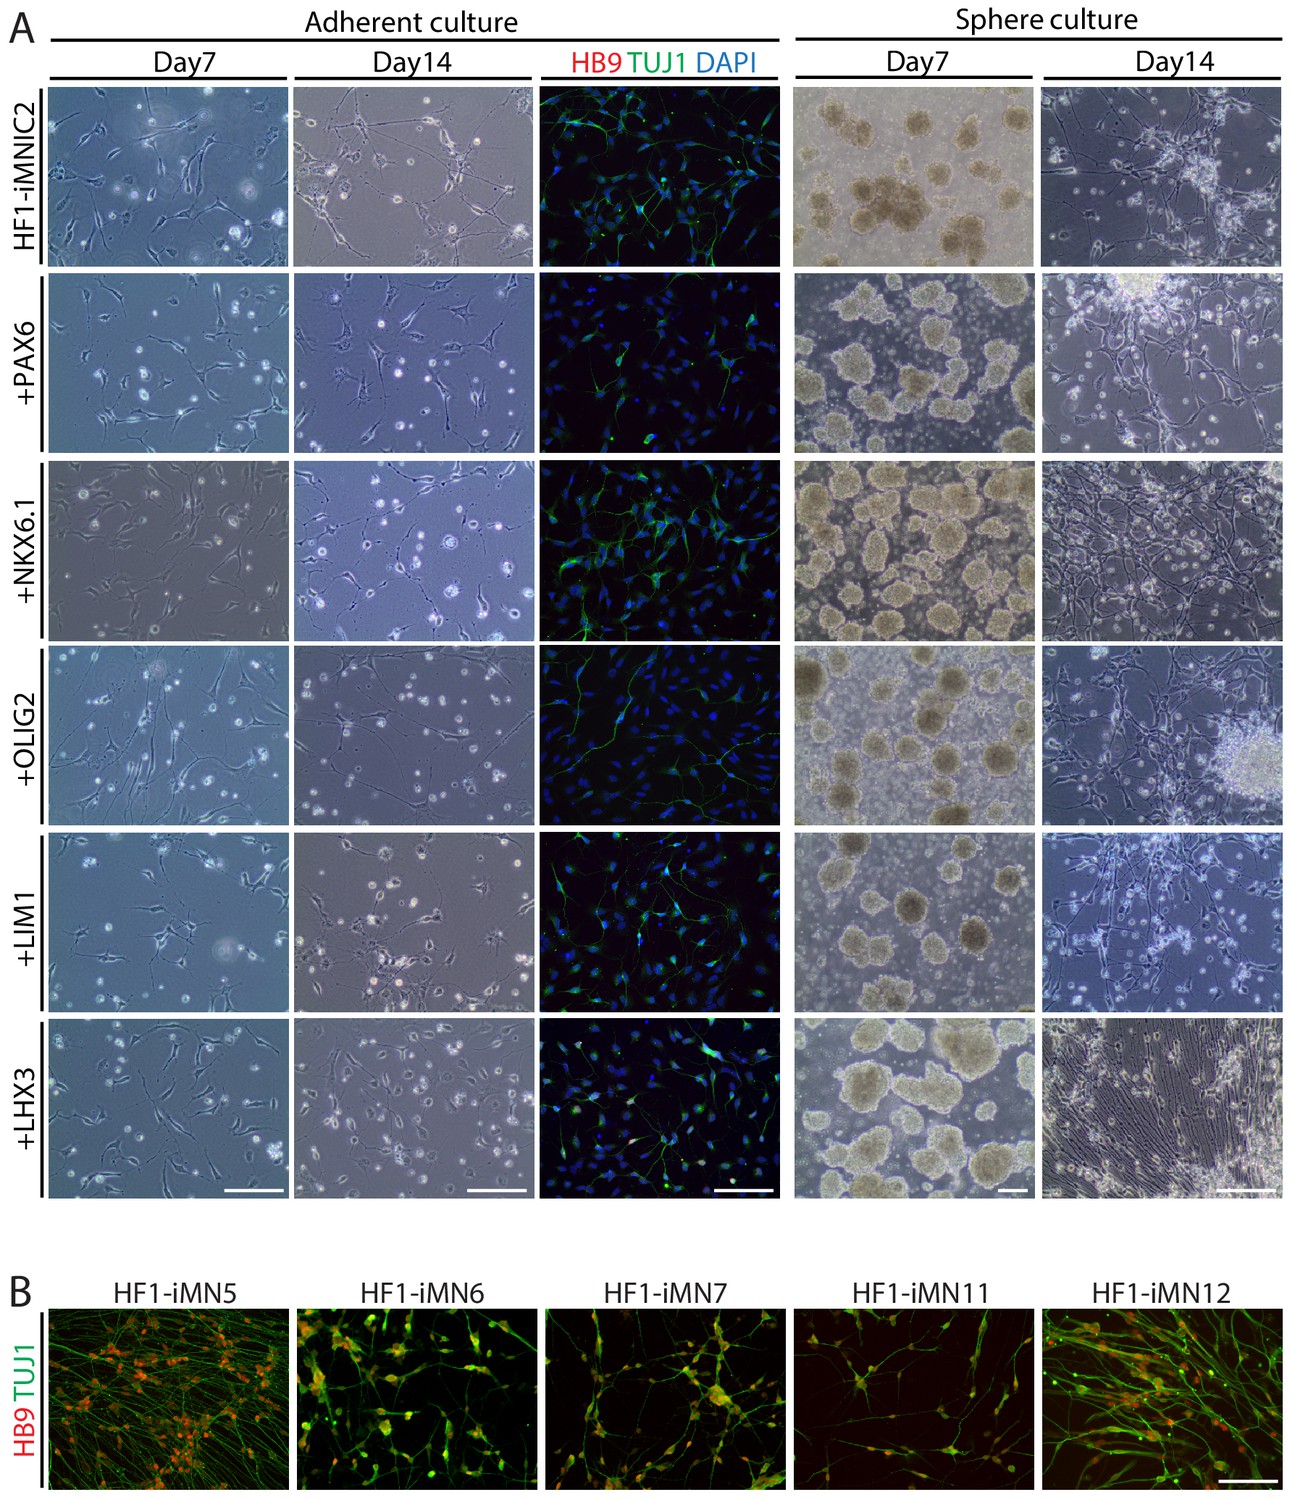
Screening transcription factor and optimization of culture condition for generating iMNs from iMNIC clones.
(A) Morphological changes of iMNICs (HF1-iMNIC2) at day 7 and 14 after transduction of each motor neuron specification transcription factor in adherent culture and sphere culture, respectively. Immunofluorescence images of the cells under adherent condition for 14 days were stained with HB9 (red) and TUJ1 (green). The nuclei were counterstained with DAPI. Scale bars, 125 μm. (B) Immunofluorescence images of HB9+TUJ1+ iMNs generated from iMNIC clones (HF1-iMN5, 6, 7, 11 and 12). Scale bars, 125 μm.
Figure 1—figure supplement 5
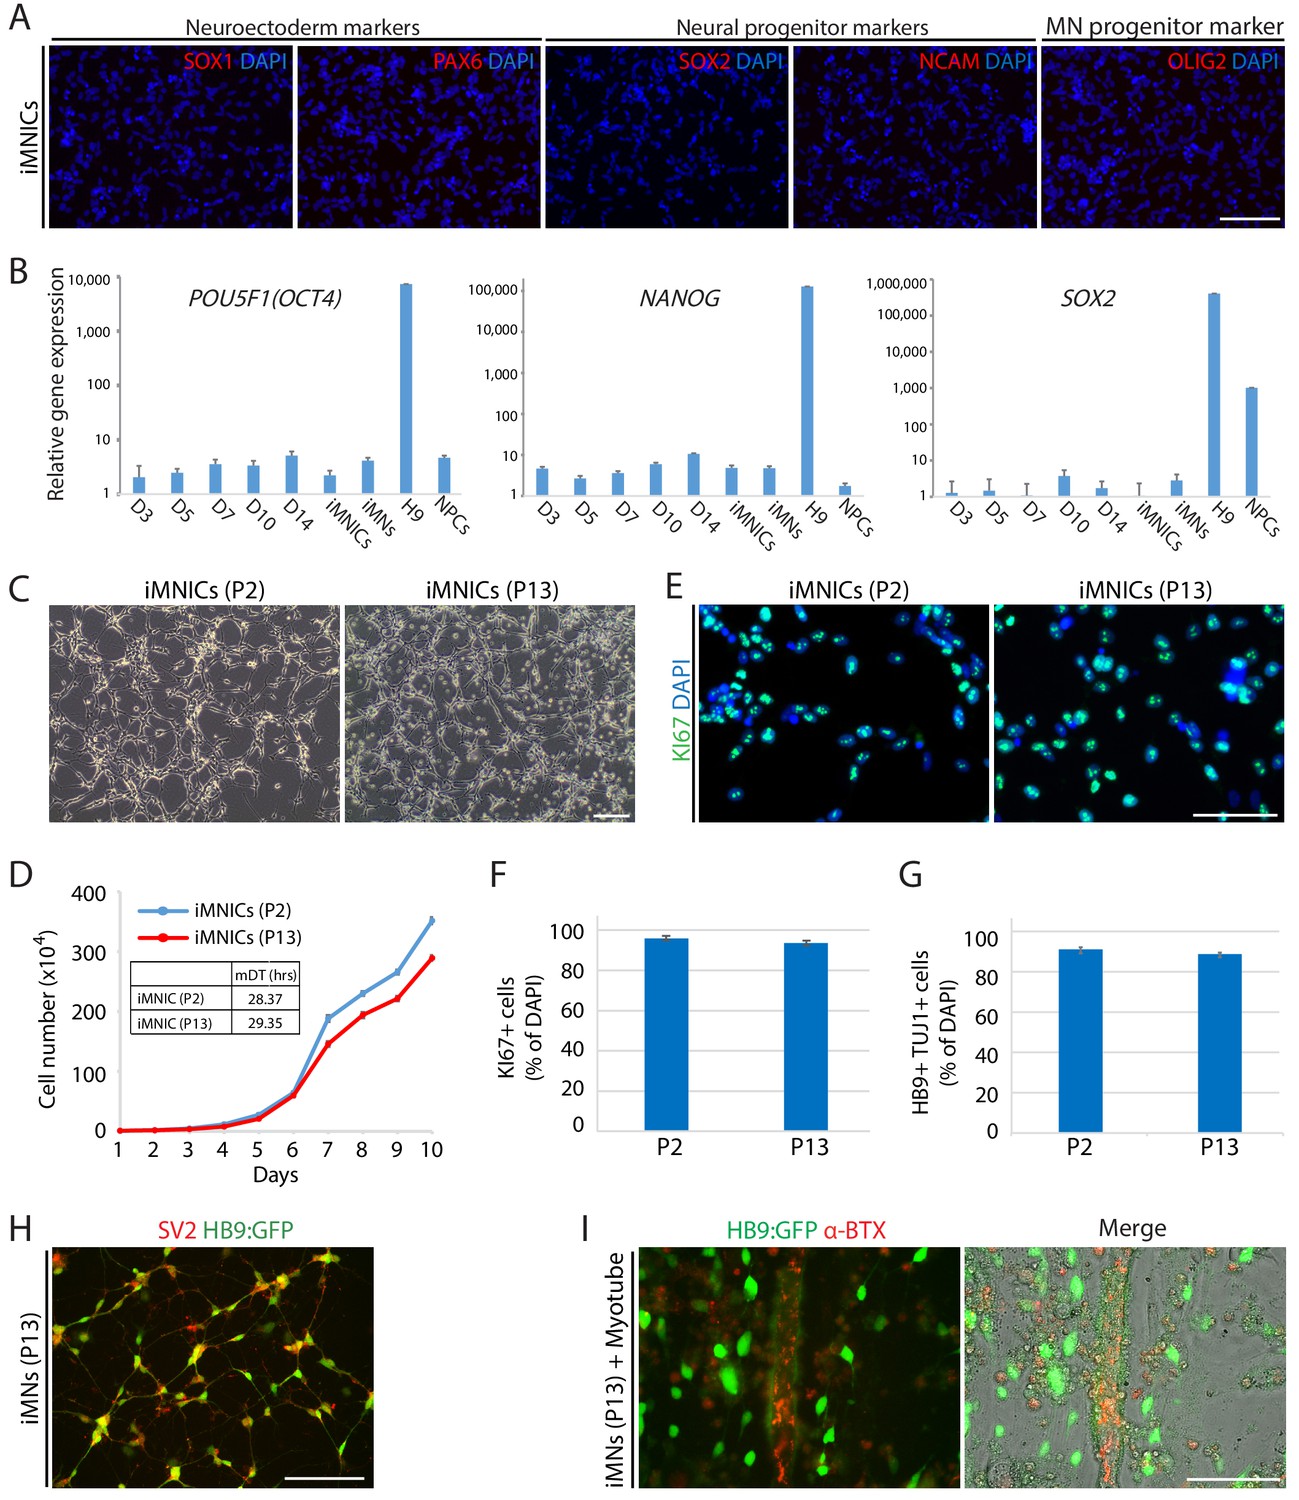
iMNICs possess self-renewal capacity and do not transit neither pluripotent state nor neural progenitor state.
(A) Immunofluorescence images of iMNICs stained with neuroectoerm markers (SOX1 and PAX6), neural progenitor markers (SOX2, and NCAM), and MN progenitor markers (OLIG2). The nuclei were counterstained with DAPI. Scale bars, 125 µm. (B) qRT-PCT analysis of endogeneous expression of pluripotent genes (POU5F1(OCT4) and NANOG) and neural progenitor gene (SOX2) in the cells at day 3, 5, 7, 10, 14 after POU5F1(OCT4) induction, iMNICs, iMNs, H9 ESCs and NPCs. Graphs present fold changes relative to fibroblasts after normalization to GAPDH. Data are presented as mean ± SD, and represent experimental replicates (n = 3). (C) Morphology of iMNICs at early passage (passage 2; P2) and late passage (passage 13;P13). Scale bars, 125 µm. (D) Proliferation rate of iMNICs at P2 and P13. Each point refers to the number of cells every 24 hr. Data are presented as mean ± SD, and represent experimental replicates (n = 4). (E) Immunofluorescence images of iMNICs at P2 and P13 stained with proliferative marker, KI67. The cells were counterstained with DAPI. Scale bars, 75 µm. (F) Quantification of KI67+ iMNICs at P2 and P13. Scale bars, 50 µm. Data are presented as mean ± SD, and represent experimental replicates (n = 3). (G) Conversion efficiency of HB9+TUJ1+ iMNs generated from iMNICs at P2 and P13. Data are presented as mean ± SD, and represent experimental replicates (n = 3). (H) Immunofluorescence images of iMNs at P13 stained with synaptic markers, SV2. Scale bars, 125 μm. (I) Immunofluorescent analysis of NMJs formed between iMNs at P13 and C2C12 myotubes in co-culture. NMJs are labeled with α-bungarotoxin conjugated with Alexa 555. Scale bars, 75 μm.
Figure 1—figure supplement 6
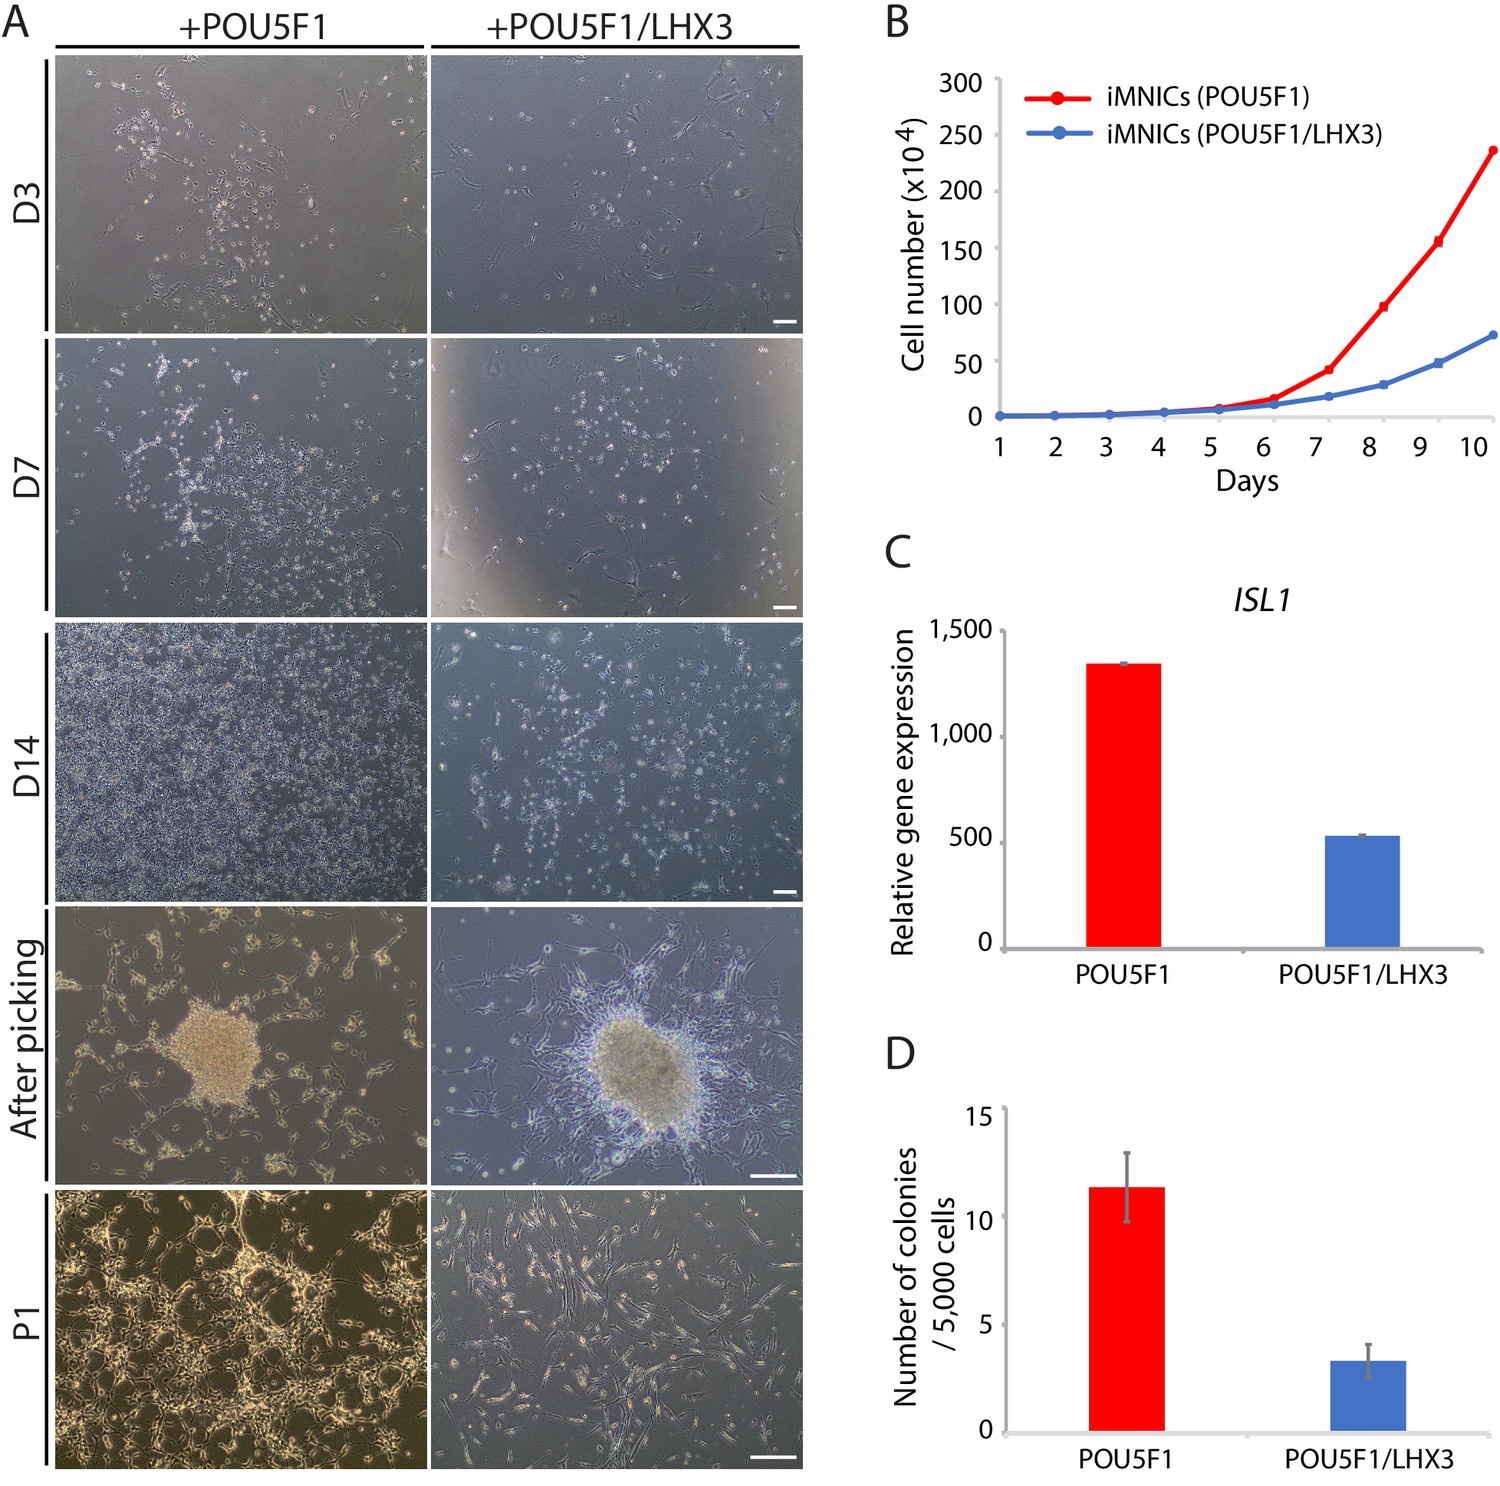
Primary induction of POU5F1(OCT4) outperforms simultaneous induction of POU5F1(OCT4) and LHX3.
(A) Representative images of the cells after POU5F1(OCT4) and POU5F1(OCT4)/LHX3 transduction, respectively. The morphological changes of the cells are shown at day 3, 7, 14, after picking, and at passage 1 (P1). Scale bars, 125 µm. (B) Proliferation rate of iMNICs induced by POU5F1(OCT4) and POU5F1(OCT4)/LHX3 transduction. Each point refers to the number of cells every 24 hr. Data are presented as mean ± SD, and represent experimental replicates (n = 4). (C) qRT-PCR analysis of mRNA expression level for ISL1 in iMNICs induced by POU5F1(OCT4) and POU5F1(OCT4)/LHX3 transduction. Graphs are normalized by GAPDH. Data are presented as mean ± SD, and represent experimental replicates (n = 3). (D) The number of colonies emerged after transduction of POU5F1(OCT4) or POU5F1(OCT4)/LHX3 were quantified. Data are presented as mean ± SD, and represent experimental replicates (n = 4).
Figure 2 with 1 supplement
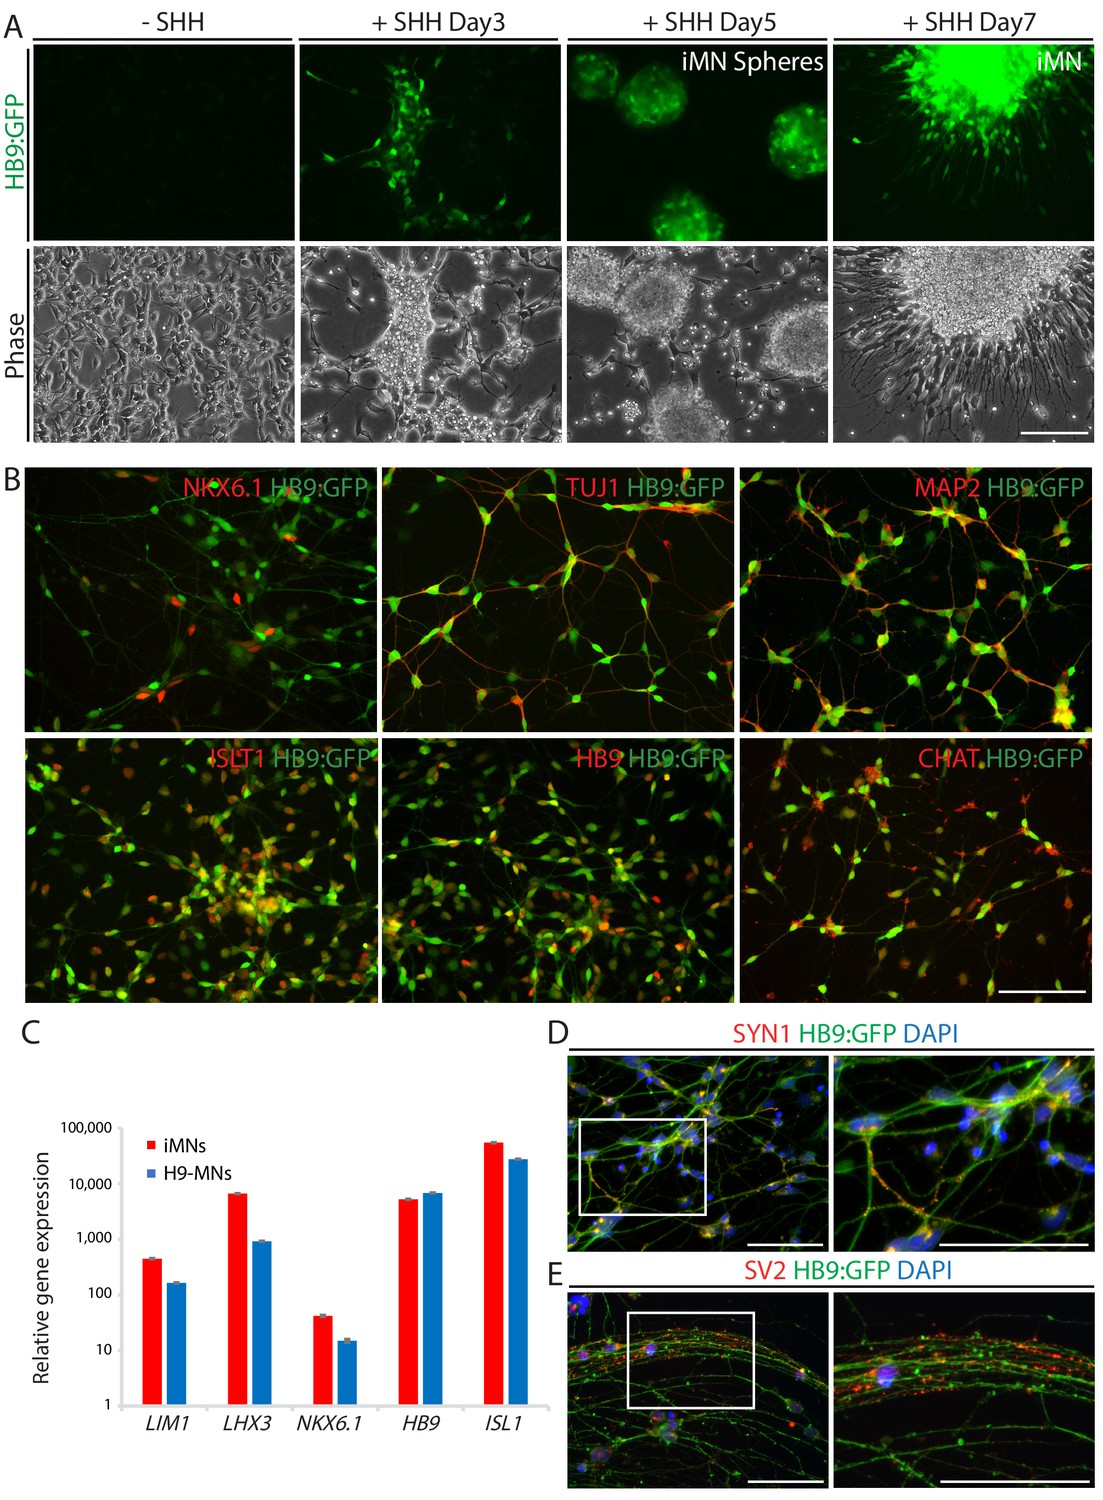
iMNs exhibits typical MN characteristics.
(A) The emergence of HB9:GFP+ cells depending on SHH stimulation during the MN induction. The morphologies of the cells at day 3, 5 and 7 are shown in phase contrast. Scale bars, 125 μm. (B) Immunofluorescence images of HB9:GFP+ iMNs co-expressing MN specific markers (NKX6.1, TUJ1, MAP2, ISLT1, HB9 and CHAT). Scale bars, 125 μm. (C) MN genes (LIM1, LHX3, NKX6.1, HB9, and ISL1) are upregulated in iMNs relative to fibroblasts as analyzed by qRT-PCR. MNs derived from H9 ESC (H9-MNs) are used as control. Graphs are presented with fold change after normalization by GAPDH. Data are presented as mean ± SD, and represent experimental replicates (n = 3). (D-E) Immunofluorescence images of HB9:GFP+ iMNs stained with presynaptic markers, SYN1 (D) and SV2 (E). Zoomed images of the square in the figures show punctate patterns of synaptic terminals. Scale bars, 125 μm. Related data can be found in Figure 2—figure supplement 1.
-
Figure 2—source data 1
qRT-PCR analysis of MN gene expressions in iMNs.
- https://cdn.elifesciences.org/articles/52069/elife-52069-fig2-data1-v1.xlsx
Figure 2—figure supplement 1
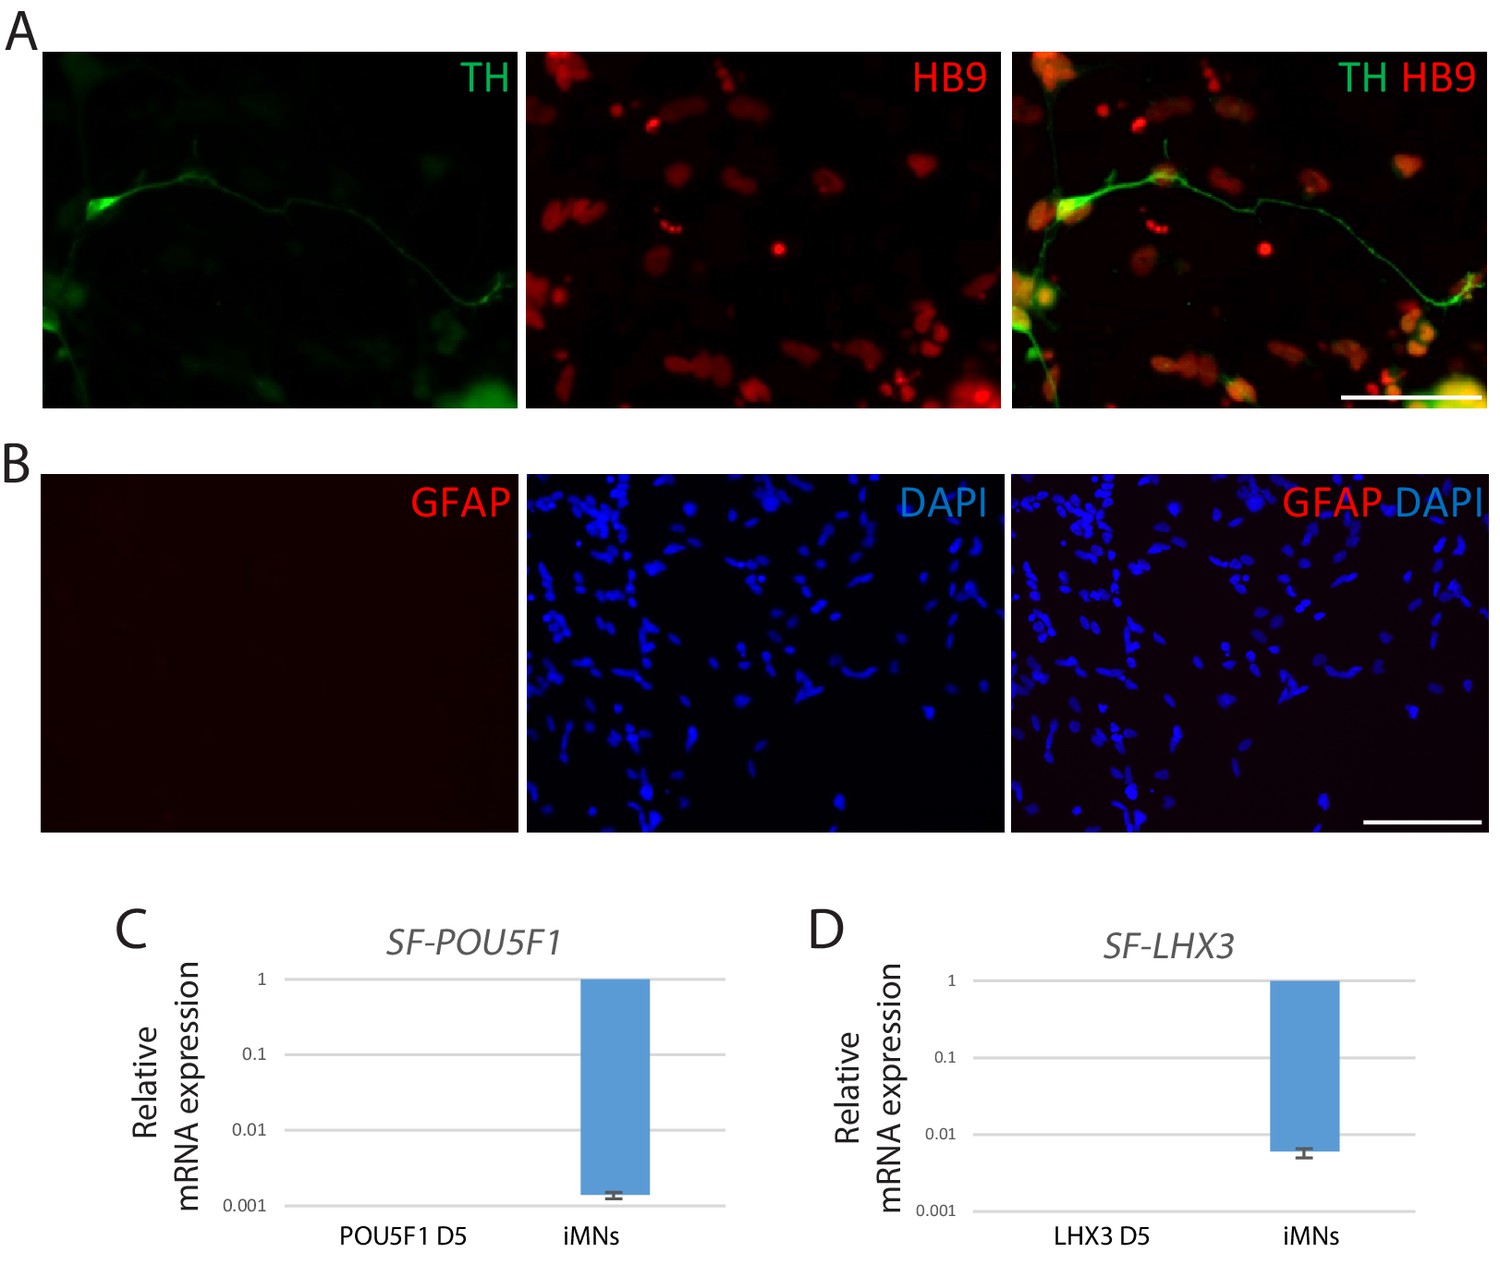
Characterization of iMNs.
(A) Immunofluorescence images of iMNs co-stained with HB9 (red) and dopaminergic neuron marker, tyrosine hydroxylase (TH) (green). The nuclei were counterstained with DAPI. Scale bars, 75 µm. (B) Immunofluorescence images of iMNs for astrocyte marker, GFAP (red). The nuclei were counterstained with DAPI. Scale bars, 125 µm. (C–D) Silencing of the exogenous transgenes POU5F1(OCT4) (C) and LHX3 (D) in iMNs relative to the cells at 5 days post-infection (POU5F1 D5 and LHX3 D5 respectively). Bars are presented with fold changes and normalized to GAPDH. Data are presented as mean ± SD, and represent experimental replicates (n = 3).
Figure 3 with 1 supplement
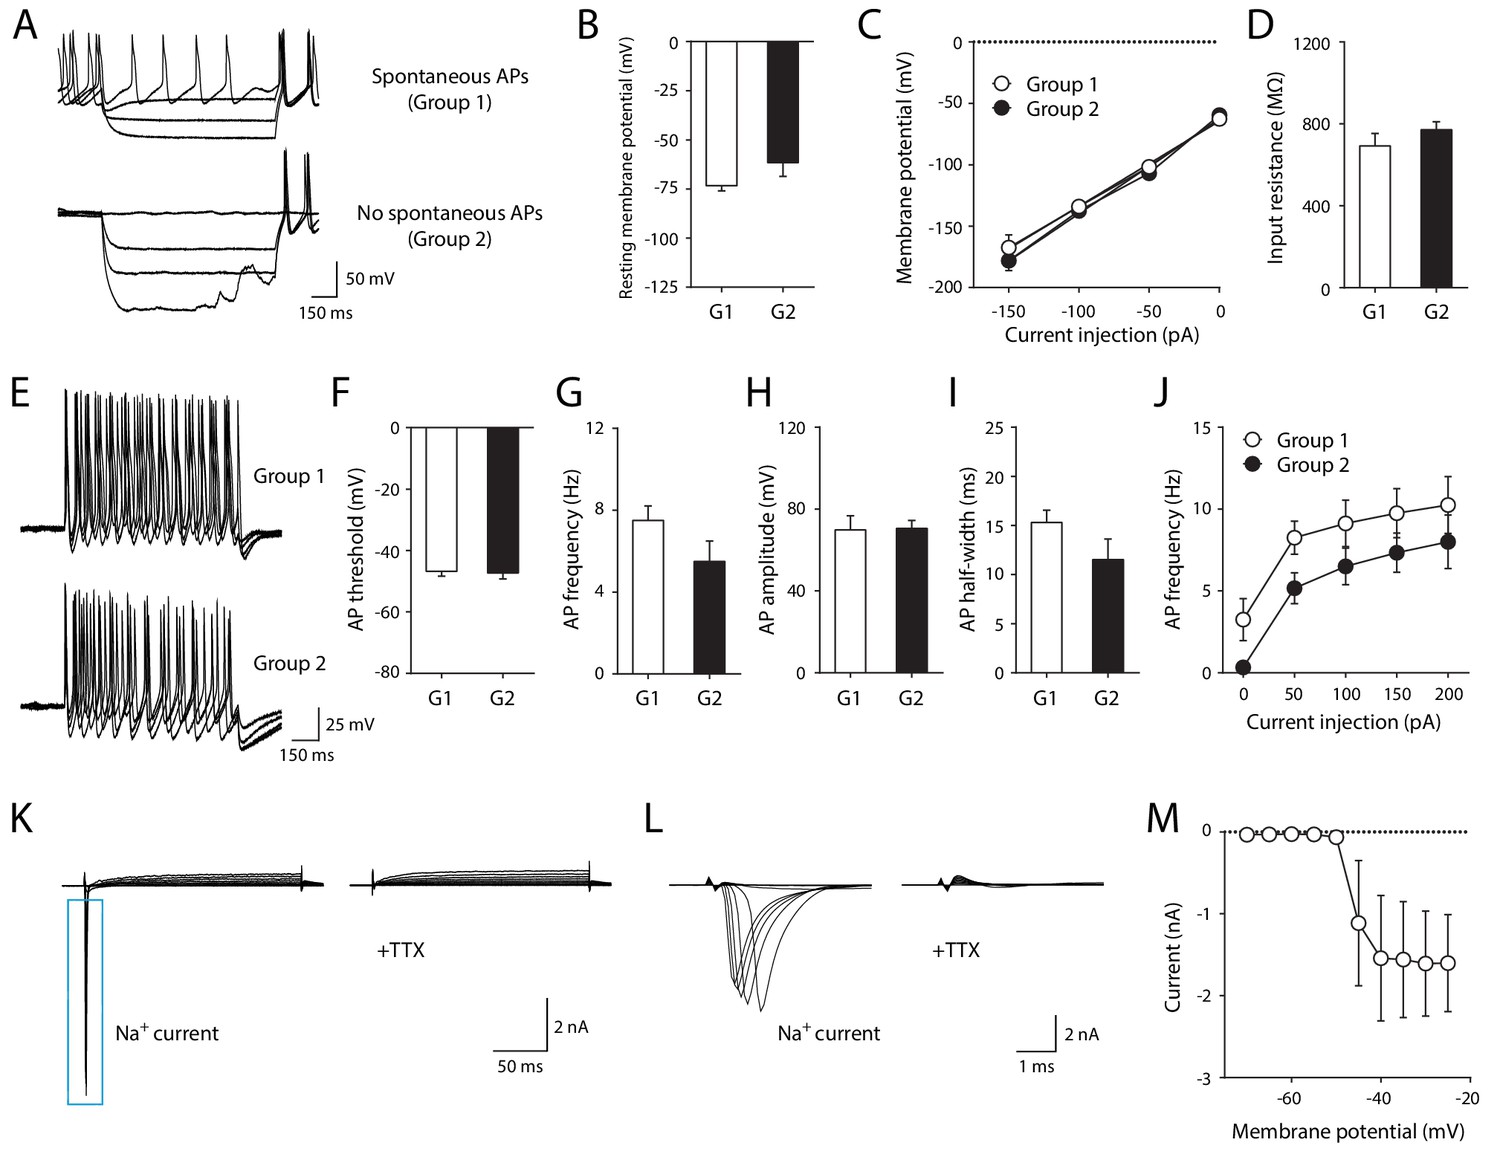
Electrophysiological properties of iMNs.
(A) Representative recording traces of iMNs by hyperpolarizing current injection under current clamp-mode. (B) Resting membrane potential (Group1, −73.29 ± 2.65 mV, n = 8; Group2, −61.57 ± 7.04 mV, n = 6; unpaired t-test, t12 = 1.7330, p=0.1086). (C) Current (I) - voltage (V) relationship in iMNs by hyperpolarizing current step (repeated measures two-way ANOVA, n = 8 for Group1, n = 6 for Group 2; group effect, F1, 12 = 0.5074, p=0.4899; interaction, F3, 36 = 0.6432, p=0.5923). (D) Input resistance of iMNs (Group1, 692.89 ± 60.60 MΩ, n = 8; Group2 = 771.43 ± 39.09 MΩ, n = 6; unpaired t-test, t12 = 1.0050, p=0.3349). (E) Representative recording traces of iMNs by depolarizing current injection under current clamp-mode. (F) AP threshold (Group1, −46.76 ± 1.58 mV, n = 8; Group2, −47.30 ± 1.94 mV, n = 6; unpaired t-test, t12 = 0.2187, p=0.8305). (G) AP frequency (Group1, 7.50 ± 0.71 Hz, n = 8; Group2, 5.50 ± 0.99 Hz, n = 6; unpaired t-test, t12 = 1.6920, p=0.1165). (H) AP amplitude (Group1, 69.81 ± 6.97 mV, n = 8; Group2, 70.55 ± 3.91 mV, n = 6; unpaired t-test, t12 = 0.0840, p=0.9345). (I) AP half-width (Group1, 15.30 ± 1.25 ms, n = 8; Group2 = 11.53 ± 2.09 ms, n = 6; unpaired t-test, t12 = 1.6390, p=0.1271). (J) Neuronal excitability of iMNs (repeated measures two-way ANOVA, n = 8 for Group1, n = 6 for Group 2; group effect, F1, 12 = 2.9410, p=0.1120; interaction, F4, 48 = 0.0774, p=0.9888). (K–L) Representative TTX-sensitive sodium currents (K) of iMNs (TTX, 1 μM). (L) Zoomed-in view of TTX-sensitive sodium currents shown in (K). (M) Averaged current (I)/voltage (V) curve of sodium currents (n = 11). Mean ± SEM is used for all the data described in the figure. Related data can be found in Figure 3—figure supplement 1.
Figure 3—figure supplement 1
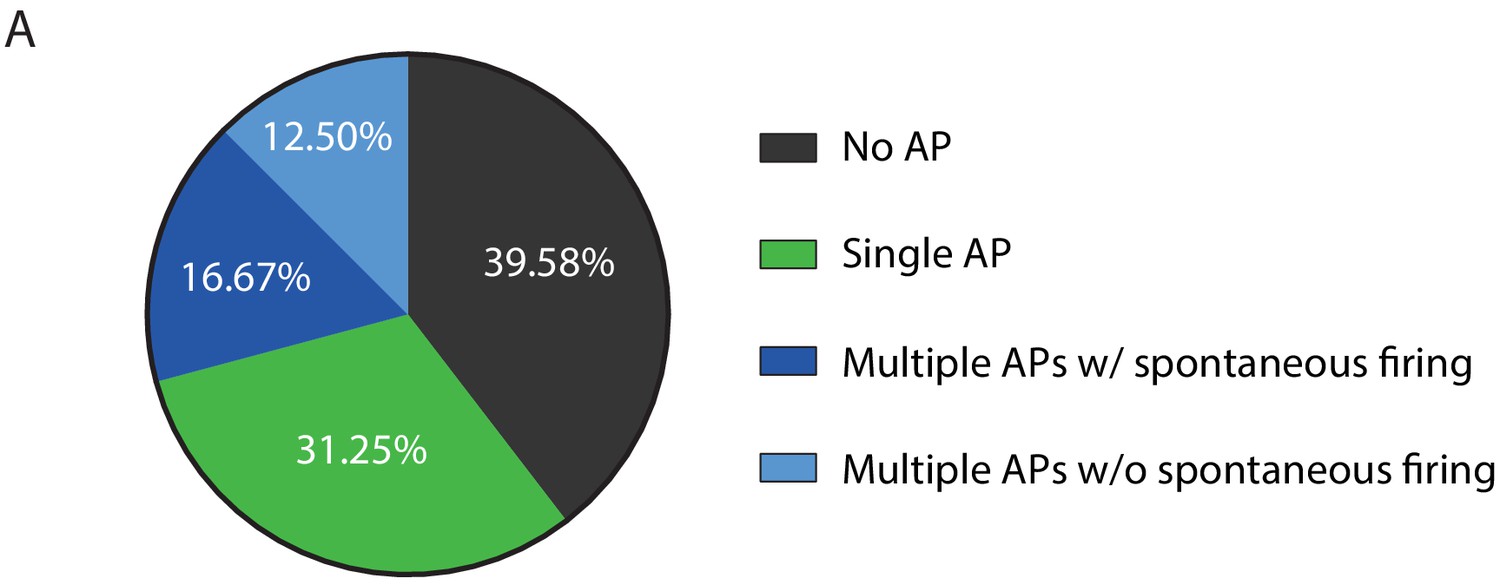
Physiological properties of iMNs.
(A) All five AP firing patterns were observed in recordings from iMNs with 39.58% exhibiting no AP, 31.25% single AP, 16.67% multiple APs with spontaneous firing, and 12.50% multiple APs without spontaneous firing.
Figure 4 with 1 supplement
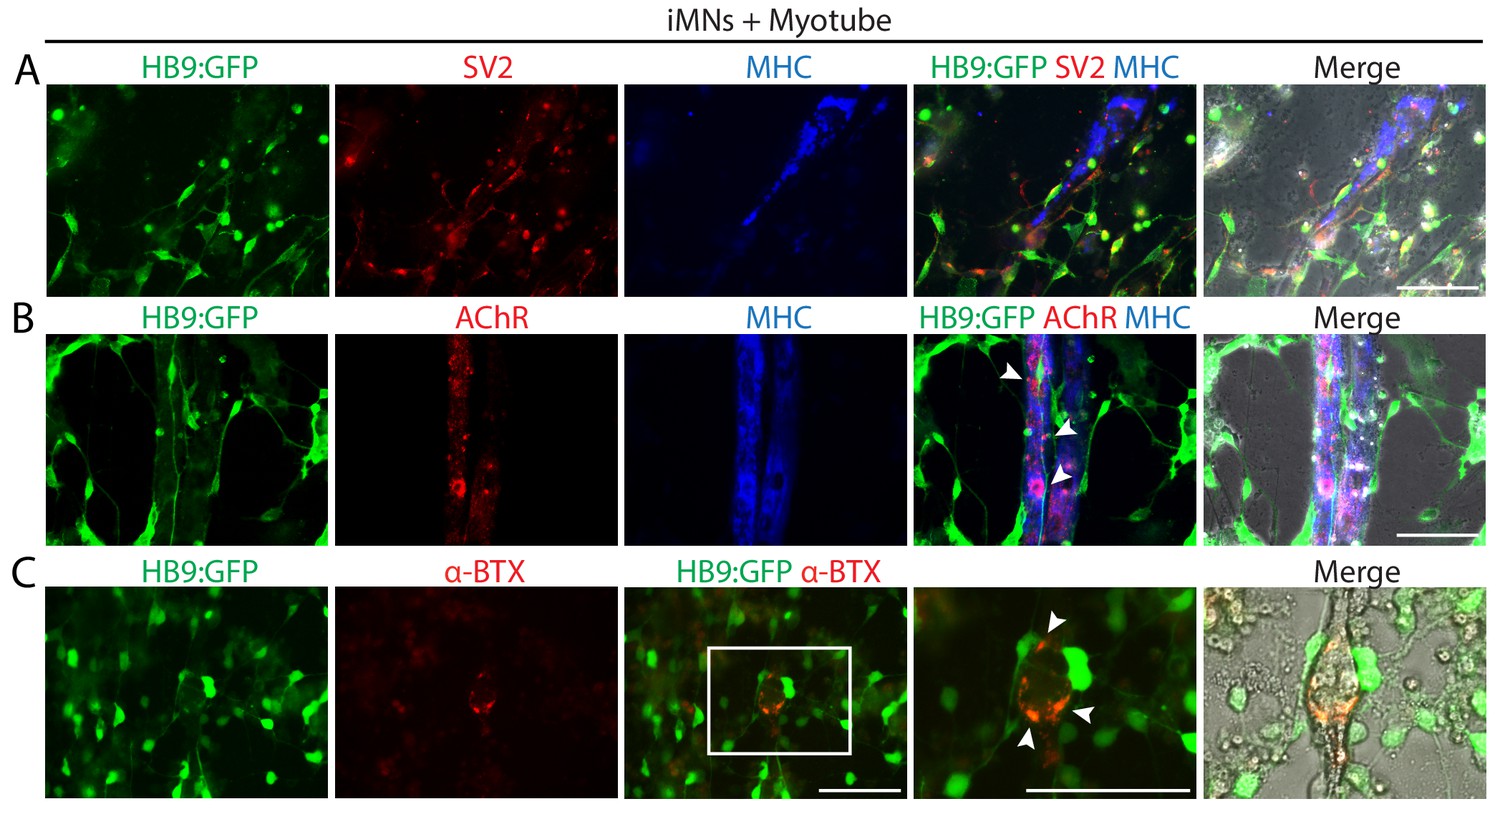
iMNs form neuromuscular junctions with myotubes.
(A–C) Representative immunofluorescent analysis of neuromuscular junctions (NMJs) formed between HB9:GFP+ iMNs and C2C12 myotubes in co-culture. Presynaptic axons and post-synaptic acetylcholine receptor (AChR) are stained with antibodies against SV2 (A) and AChR (B), and the multinucleated myotubes are stained with myosin heavy chain (MHC). (C) NMJs are labeled with α-bungarotoxin conjugated with Alexa 555. Zoomed images of the square in (C) show the NMJs, indicated by white arrows. Scale bars, 75 μm. Related data can be found in Figure 4—figure supplement 1.
Figure 4—figure supplement 1

Generation of iMNs from additional human fibroblasts (HF2).
(A) The morphological changes of additional human fibroblast line (HF2) into iMNs (HF2-iMNs) during MN direct conversion process. Scale bars, 125 μm. (B) Immunofluorescence images of HB9:GFP+ HF2-iMNs (HF2-iMN6) co-expressing MN specific markers (ISLT1, HB9, MAP2, and CHAT). Scale bars, 125 μm. (C) Immunofluorescence images of HF2-iMN6 stained with TUJ1 and synaptic markers, SYN1 and SV2. Scale bars, 125 μm. (D) Immunofluorescence images of HB9:GFP+ HF2-iMN6 labeled with α-bungarotoxin-alexa555, showing formation of NMJs with myotubes. Scale bars, 75 μm. (E) Morphologies of established HF2-iMNIC clones (HF2-iMNIC1, 2, 4 and 8). Scale bars, 125 μm. (F) qRT-PCR analysis of ISL1 gene expression in HF2-iMNIC clones relative to fibroblasts. Graphs present fold changes after normalization to GAPDH. Data are presented as mean ± SD, and represent experimental replicates (n = 3). (G) The emergence of HB9:GFP+ iMNs (HF2-iMN1, 2, 4 and 8) converted from HF2-iMNIC clones. The morphologies of the cells are shown in phase contrast. Scale bars, 125 μm.
Figure 5 with 1 supplement

Global gene expression profiles of iMNICs and iMNs.
(A) Heatmap analysis of global gene expression profiles in HF-1, HF-2, NPCs, HF1-iMNICs, HF2-iMNICs, HF1-iMNs, HF2-iMNs, wtMN-1 and wtMN-2 as determined by RNA-seq. The color bar codifies the gene expression in log2 scale. Red indicates upregulated genes and blue indicates downregulated genes. (B) Hierarchical clustering of HF2, HF1, NPCs, HF2-iMNICs, HF1-iMNICs, wtMN-2, wrMN-1, HF2-iMNs and HF1-iMNs. (C) PCA of global gene expression in HF1, HF2, HF1-iMNICs, HF2-iMNICs, HF1-iMNs, HF2-iMNs, NPCs, wtMN-1 and wtMN-2. (D) Pairwise scatter plots of global gene expression of Fetal-SC vs HF1-iMNICs/HF2-iMNICs, wtMN-1 vs HF1-iMNs/HF2-iMNs and NPCs vs HF1-iMNICs/HF2-iMNICs. The HOX genes (HOXC4, HOXC6, HOXC8, HOXC9, HOXA9 and HOXD9), MN genes (HB9, ISL1, NKX6.1 MAP2, TUJ1 and CHAT), fibroblast genes (COL5A1 and COL1A1) and NPC genes (SOX2, OLIG2, PAX6 and SOX1) are highlighted with yellow circles. The black lines indicate the boundaries of 4-fold changes in log2 scale. (E and F) Heatmap analysis of (E) HOX genes, (F) MN genes, NPC genes and fibroblast genes in HF1, HF2, NPCs, HF1-iMNICs, HF2-iMNICs, HF1-iMNs, HF2-iMNs and wtMN-1. The color bar codifies the gene expression in log2 scale. Red indicates upregulated genes and blue indicates downregulated genes. (G) qRT-PCR analysis of mRNA expression level for cervical HOX genes (HOXC4, HOXC5, HOXC6, HOXA7 and HOXC8) and thoracic HOX genes (HOXA9 and HOXC9) in HF1-iMNINs, HF1-iMNs, H9-MNs and NPCs. Bars represent fold changes relative to fibroblasts after normalization to GAPDH. Data are presented as means ± SD (n = 3). Related data can be found in Figure 5—figure supplement 1.
-
Figure 5—source data 1
qRT-PCR analysis of cervical and thoracic HOX genes.
- https://cdn.elifesciences.org/articles/52069/elife-52069-fig5-data1-v1.xlsx
Figure 5—figure supplement 1
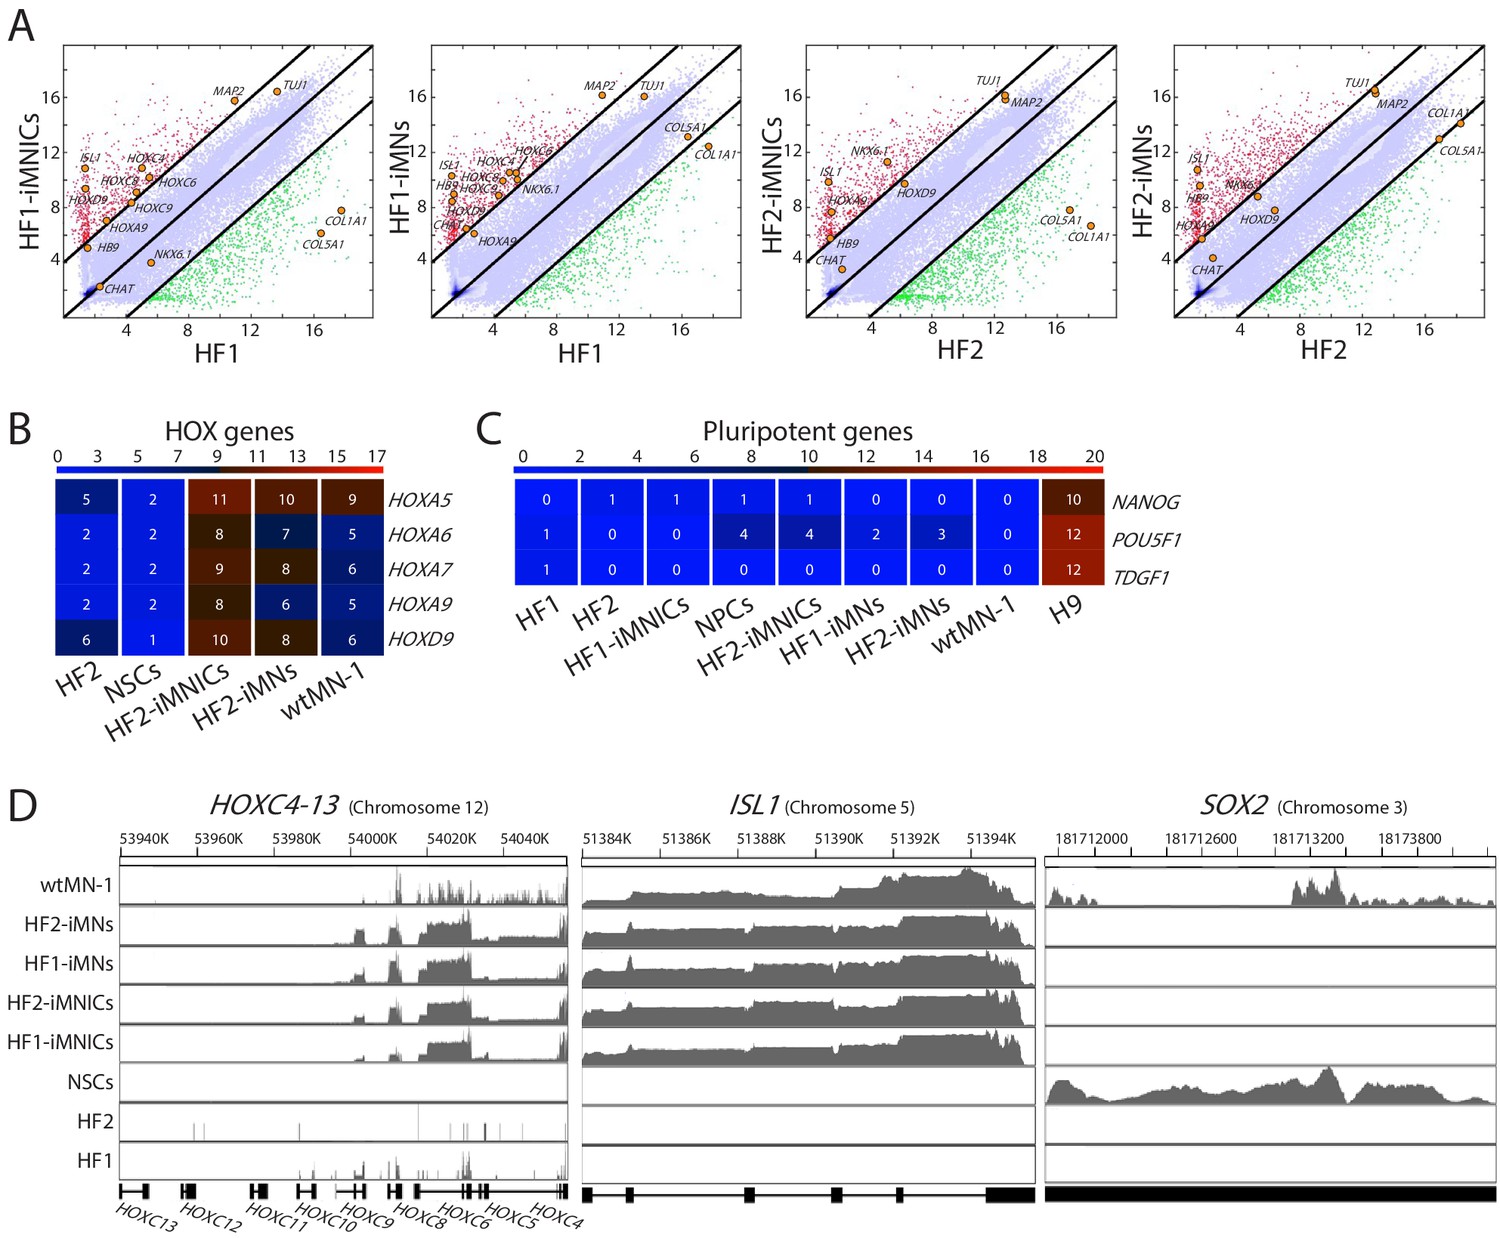
RNA-seq analysis of iMNICs and iMNs.
(A) Pairwise scatter plots of global gene expression of HF1 vs HF1-iMNICs/HF1-iMNs, HF2 vs HF2-iMNICs/HF2-iMNs. The HOX genes (HOXC4, HOXC6, HOXC8, HOXC9, HOXA9 and HOXD9), MN genes (HB9, ISL1, NKX6.1 MAP2, TUJ1 and CHAT) and fibroblast genes (COL5A1 and COL1A1) are highlighted with yellow circles. The black lines indicate the boundaries of four fold changes in log2 scale. (B) Heatmap analysis of HOX genes in HF2, NPCs, HF2-iMNICs, HF2-iMNs and wtMN-1. (C) Heatmap analysis of pluripotent genes in HF1, HF2, NPCs, HF1-iMNICs, HF2-iMNICs, HF1-iMNs, HF2-iMNs, wtMN-1 and H9. The color bar codifies the gene expression in log2 scale. Red indicates upregulated genes and blue indicates downregulated genes. (D) Gene-coverage count track plots of HOXC clusters, ISL1 and SOX2 in HF1, HF2, NPCs, HF1-iMNICs, HF2-iMNICs, HF1-iMNs, HF2-iMNs and wtMN-1.
Figure 6 with 1 supplement
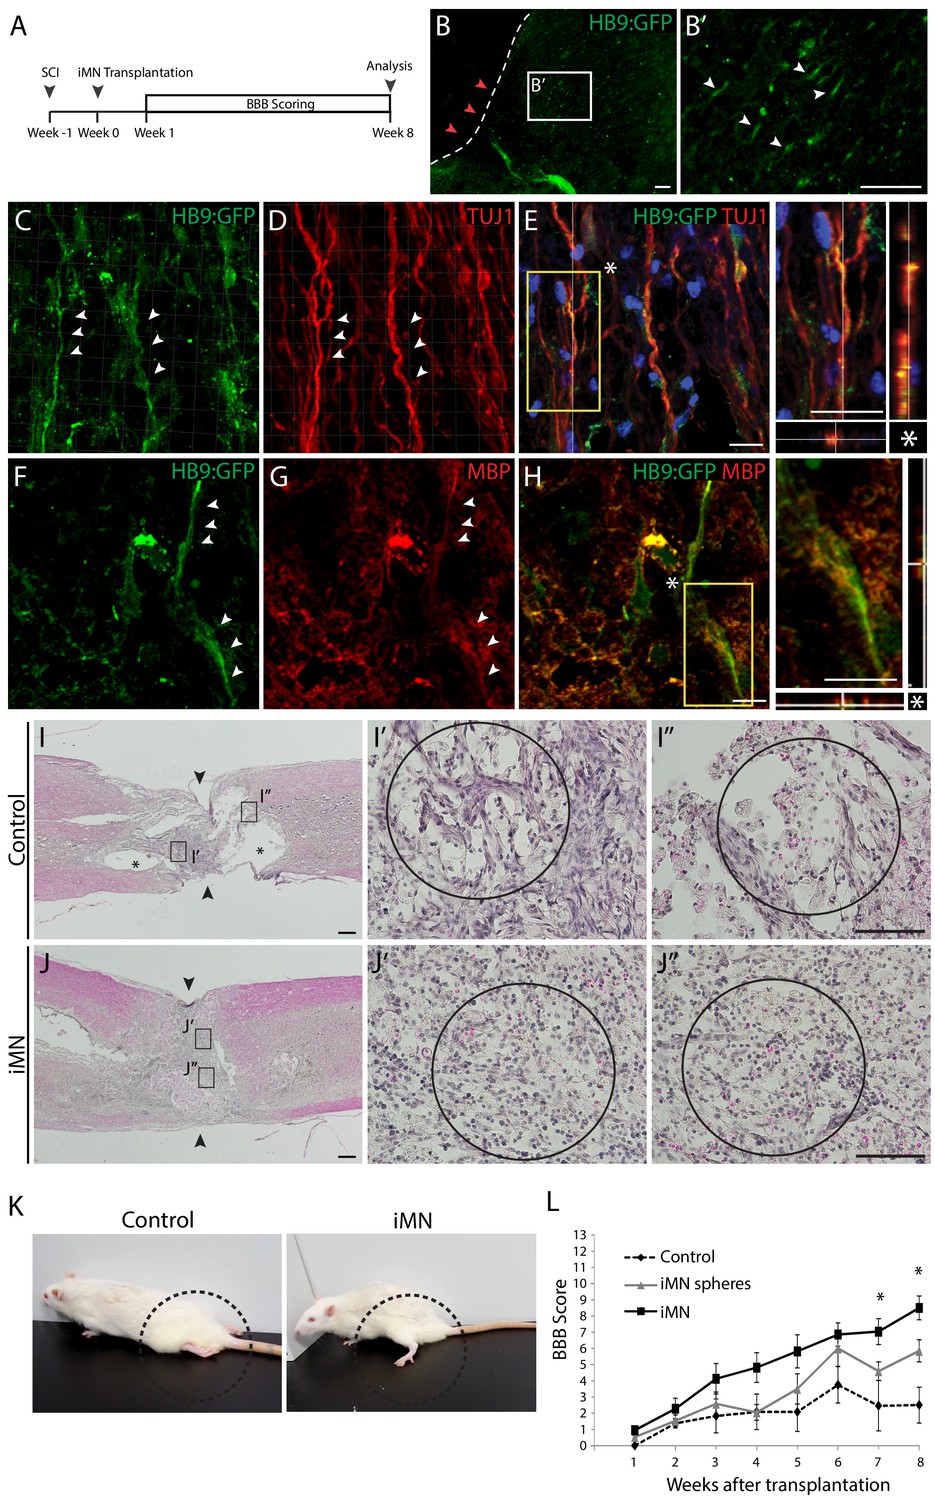
Therapeutic effects of iMNs in rat spinal cord injury model in vivo.
(A) The experimental scheme of in vivo study. (B) Immunofluorescence image of transplanted iMNs in sagittal section of spinal cord. (B’) Zoomed image presents integration of transplanted cells. Scale bars, 125 μm. (C–E) Confocal images of iMNs after transplantation. HB9:GFP+ cells co-express neuronal marker, TUJ1 (white arrowheads). (F–H) iMNs are surrounded by host MBP+ myelinating cells forming ensheathment (white arrowheads). Scale bars, 30 μm. (I-J. H and E staining analysis of spinal cords after 8 weeks of transplantation (I; Control, J; iMN-transplanted) (I,J; Scale bars, 400 μm, I’,I’’,J’,J’’; Scale bars, 125 μm). (K) The position of hindlimbs in control rat and iMN-transplanted rat after 8 weeks of transplantation. (L) BBB score evaluation of hindlimbs during 8 weeks after transplantation. Data are presented as mean ± SD, and represent experimental replicates (Control; n = 6, iMN sphere; n = 9, iMN; n = 10). *p<0.05, one-way ANOVA. Related data can be found in Figure 6—figure supplement 1.
Figure 6—figure supplement 1
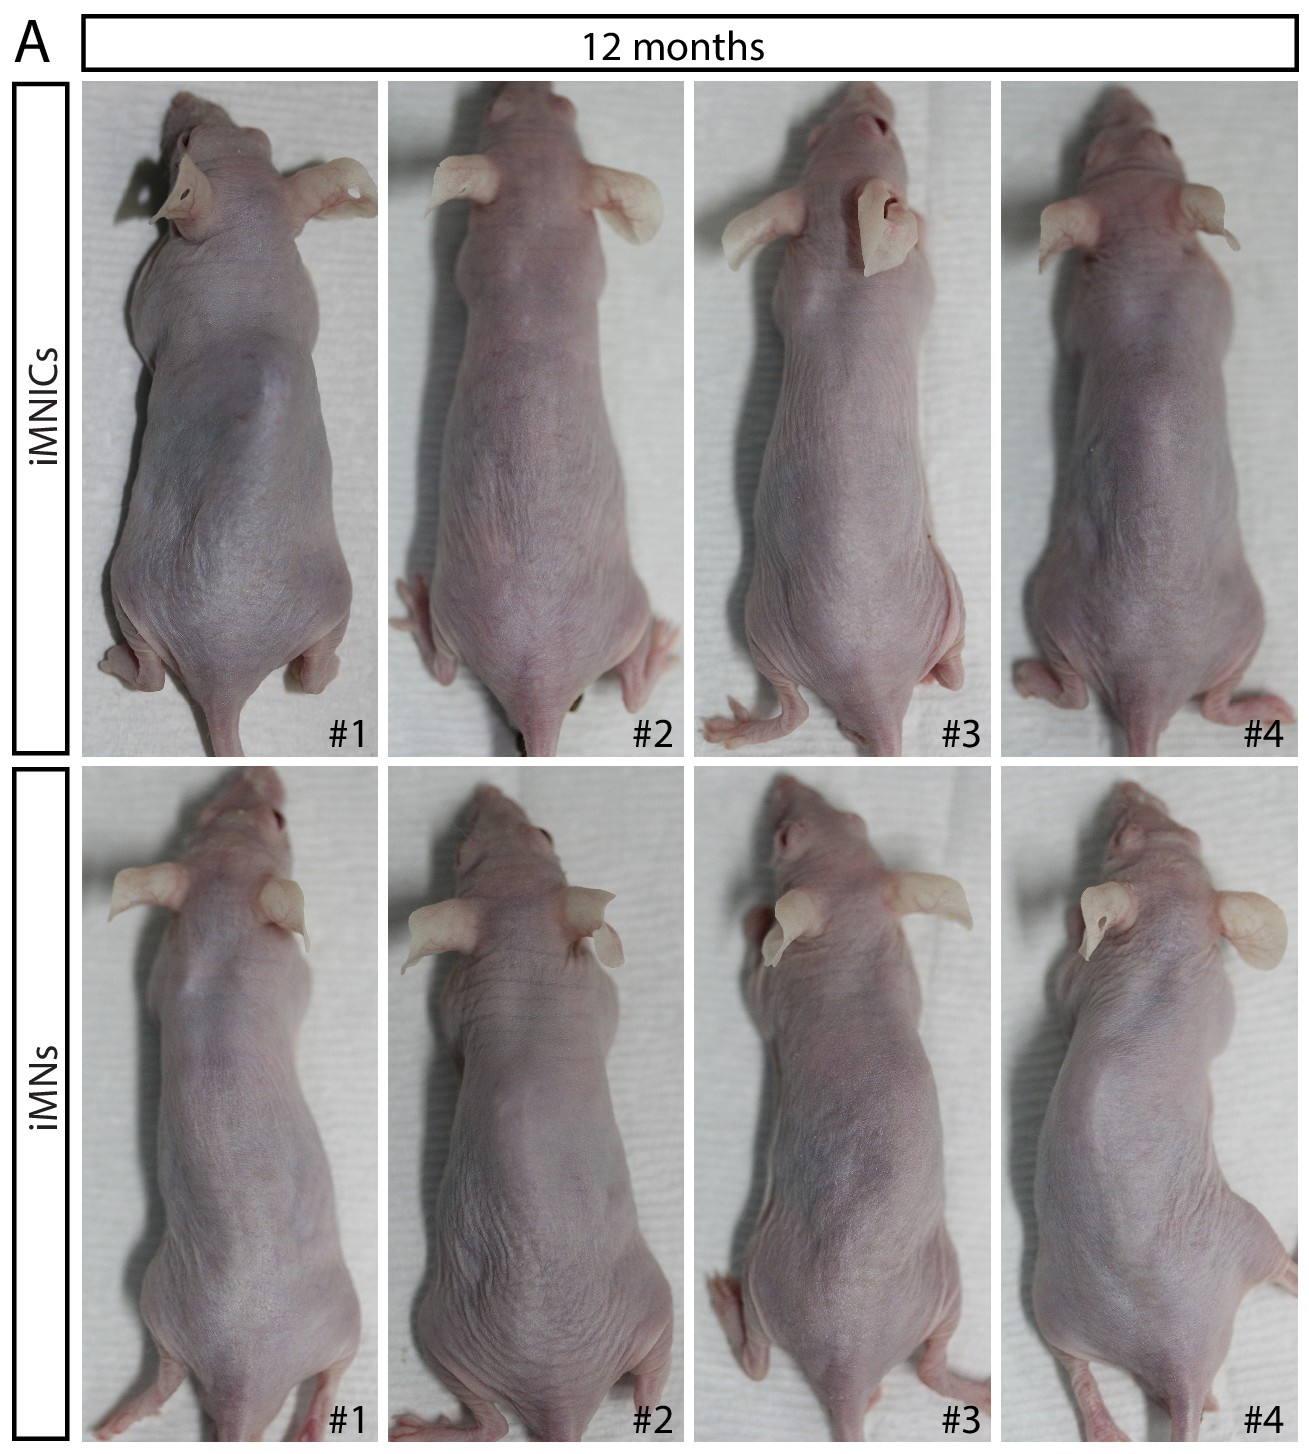
Tumor formation analysis of iMNICs and iMNs in vivo.
(A) Images of nude mice at 12 months after subcutaneous injection of iMNICs and iMNs into the dorsal flanks (n = 4).
Videos
Video 1
Contraction of C2C12 myotubes co-cultured with iMNs.
C2C12 myotubes started rhythmic contraction after co-culture with iMN for 3 weeks. To block the acetylcholine receptor on the myotubes specifically, 100 μM curare (final concentration) was added to the culture.
Video 2
Functional recovery after iMN transplantation in rat SCI model.
Transplantation of iMNs facilitated the recovery of hindlimb motor functions after 8 weeks in rat SCI model. PBS injected control group exhibited no hindlimb movement.
Tables
Key resources table
| Reagent type (species) or resource | Designation | Source or reference | Identifiers | Additional information |
|---|---|---|---|---|
| Cell line (Homo sapiens) | H9 | WiCell | Cat.# WA09 RRID:CVCL_9773 | Control |
| Cell line (Homo sapiens) | NPCs | DOI:10.1038/nature08436, Kim et al., 2009a | Control | |
| Cell line (Homo sapiens) | HF1 (Female) | DOI:10.4172/2157-7633.1000336 Singhal et al., 2016 | Parental cells | |
| Cell line (Homo sapiens) | HF2 (Male) | DOI:10.4172/2157-7633.1000336. Singhal et al., 2016 | Parental cells | |
| Antibody | Anti-HB9 (Mouse Monoclonal) | DSHB | Cat.# 81.5C10 RRID:AB_2145209 | ICC(1:100) |
| Antibody | Anti-ISLT1/2 (Mouse Monoclonal) | DSHB | Cat.# 39.4D5 RRID:AB_2314683 | ICC(1:300) |
| Antibody | Anti-SV2 (Mouse Monoclonal) | DSHB | Cat.# SV2 RRID:AB_2315387 | ICC(1:100) |
| Antibody | Anti-beta III Tubulin (Rabbit polyclonal) | Millipore | Cat.# ab18207 RRID:AB_444319 | ICC(1:500) |
| Recombinant DNA reagent | Lenti-HB9:GFP(plasmid) | Addgene | ID# 37080 RRID:Addgene_37080 | |
| Recombinant DNA reagent | PAX2 (plasmid) | Addgene | ID# 12260 RRID:Addgene_12260 | |
| Recombinant DNA reagent | VSVG (plasmid) | Addgene | ID# 8454 RRID:Addgene_8454 | |
| Recombinant DNA reagent | Lenti-hOCT4 | Addgene | ID# 130692 RRID:Addgene_130692 | |
| Recombinant DNA reagent | Lenti-hLHX3 | Addgene | ID# 120456 RRID:Addgene_120456 | |
| Recombinant DNA reagent | Lentiviral backbone | Addgene DOI:10.1038 Warlich et al., 2011 | ID# 12252 RRID:Addgene_12252 | |
| Peptide, recombinant protein | SHH | Peprotech | Cat.# 100–45 | 100 ng/ml |
| Peptide, recombinant protein | bFGF | Peprotech | Cat.# 100-18B | 20 ng/ml |
| Peptide, recombinant protein | EGF | Peprotech | Cat.# AF-100–15 | 10 ng/ml |
| Peptide, recombinant protein | IGF-1 | Peprotech | Cat.# 100–11 | 10 ng/ml |
| Peptide, recombinant protein | NT3 | Peprotech | Cat.# 450–03 | 10 ng/ml |
| Peptide, recombinant protein | BDNF | Peprotech | Cat.# 450–02 | 10 ng/ml |
| Peptide, recombinant protein | GDNF | Peprotech | Cat.# 450–10 | 10 ng/ml |
| Peptide, recombinant protein | CNTF | Peprotech | Cat.# 450–13 | 10 ng/ml |
| Other | α-Bungarotoxin | Invitrogen | Cat.# B35451 | 1:200 |
| Software, algorithm | Matlab | RRID:SCR_001622 |
Additional files
-
Supplementary file 1
Primary antibodies used for ICC and IHC.
- https://cdn.elifesciences.org/articles/52069/elife-52069-supp1-v1.docx
-
Supplementary file 2
Primers used for quantitative RT-PCT and genomic PCR.
- https://cdn.elifesciences.org/articles/52069/elife-52069-supp2-v1.docx
-
Supplementary file 3
Summary of iMNIC induction from human fibroblast lines.
- https://cdn.elifesciences.org/articles/52069/elife-52069-supp3-v1.docx
-
Supplementary file 4
Characterization of established clones.
- https://cdn.elifesciences.org/articles/52069/elife-52069-supp4-v1.docx
-
Supplementary file 5
RNA seq data sequence summary.
- https://cdn.elifesciences.org/articles/52069/elife-52069-supp5-v1.xlsx
-
Supplementary file 6
Code for alignment and obtained alignment rates.
- https://cdn.elifesciences.org/articles/52069/elife-52069-supp6-v1.docx
-
Supplementary file 7
Code for obtaining genes counts and obtained statistics.
- https://cdn.elifesciences.org/articles/52069/elife-52069-supp7-v1.docx
-
Transparent reporting form
- https://cdn.elifesciences.org/articles/52069/elife-52069-transrepform-v1.docx
Download links
A two-part list of links to download the article, or parts of the article, in various formats.
Downloads (link to download the article as PDF)
Open citations (links to open the citations from this article in various online reference manager services)
Cite this article (links to download the citations from this article in formats compatible with various reference manager tools)
Sequentially induced motor neurons from human fibroblasts facilitate locomotor recovery in a rodent spinal cord injury model
eLife 9:e52069.
https://doi.org/10.7554/eLife.52069


