Modelling the climatic suitability of Chagas disease vectors on a global scale
- Goethe University, Institute for Ecology, Evolution and Diversity, Germany
- Senckenberg Biodiversity and Climate Research Centre, Senckenberg Gesellschaft für Naturforschung, Germany
Figures
Figure 1
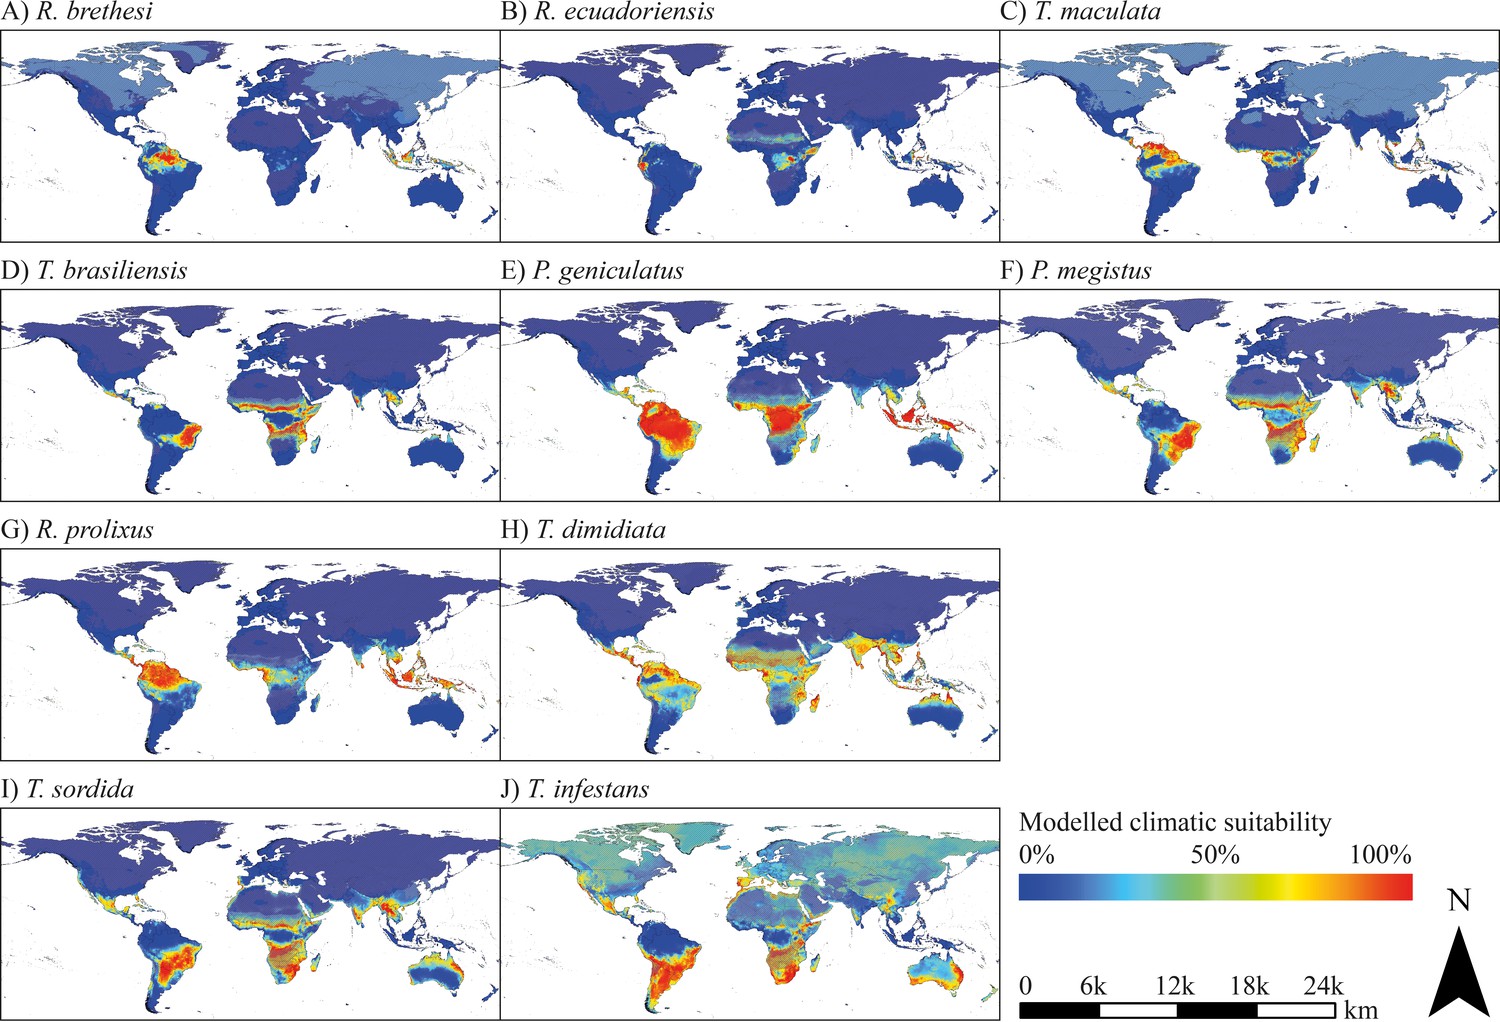
Modelled current climatic suitability.
(A–J) Modelled climatic suitability (consensus map) of 10 triatomine species under current climate conditions. Hatched areas indicate regions where the projection is uncertain. Maps were built using WGS 84 as geographical system and ESRI ArcGIS (ESRI, 2018).
Figure 2
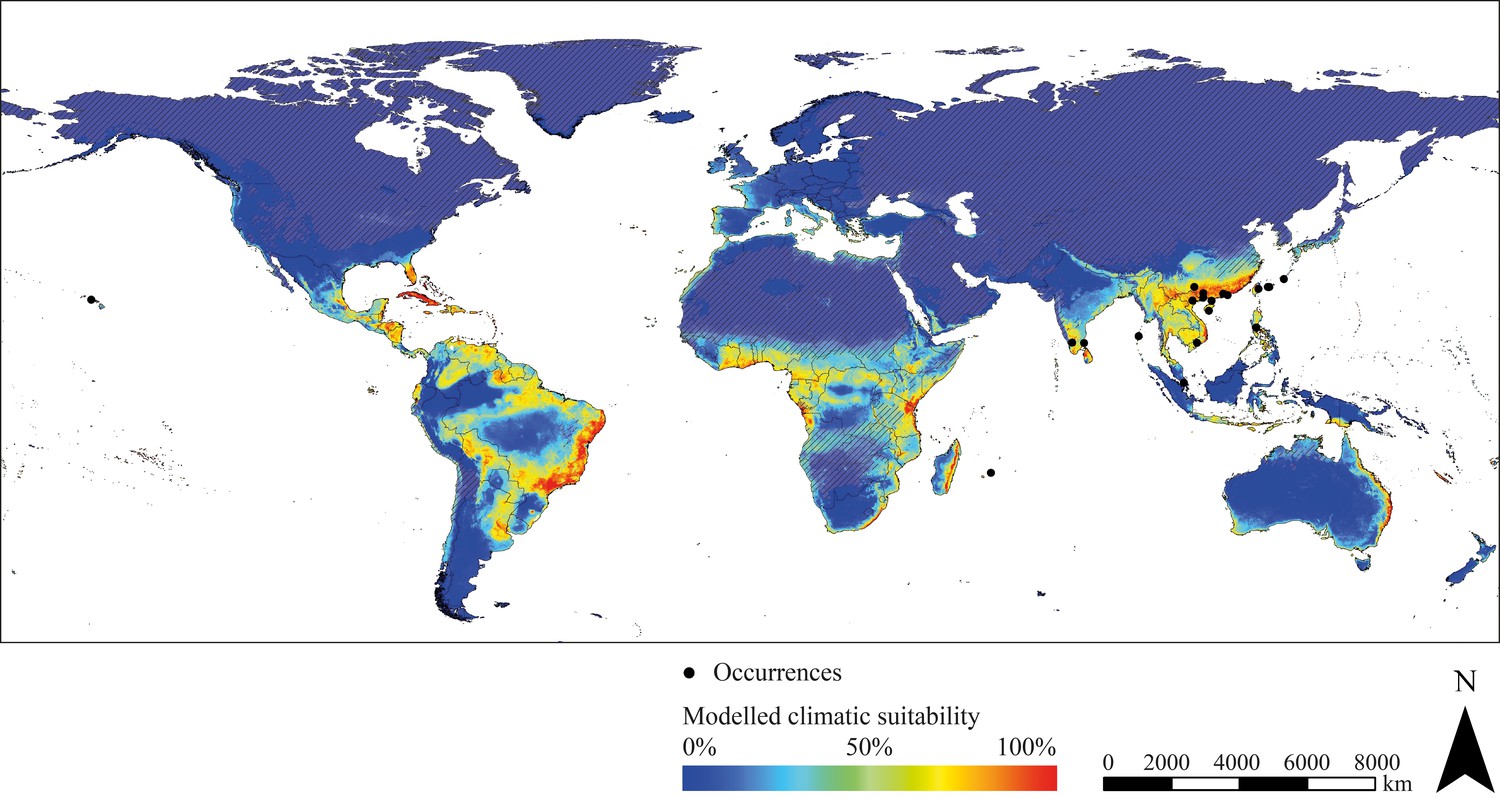
Modelled current climatic suitability of T. rubrofasciata (consensus map) and observed occurrence records outside the Americas.
Hatched areas indicate regions where the projection is uncertain. Maps were built using WGS 84 as geographical system and ESRI ArcGIS (ESRI, 2018).
Figure 3
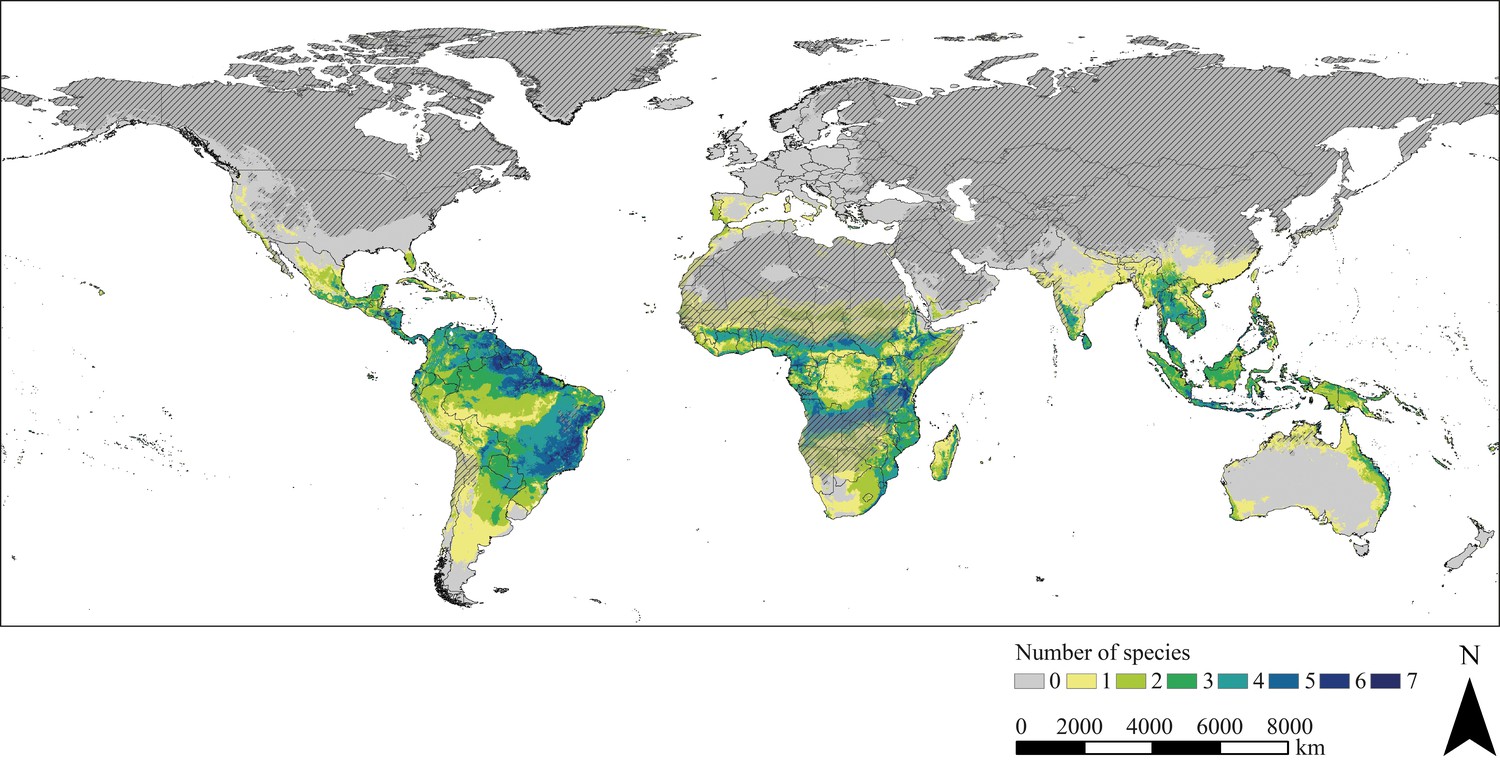
Species diversity.
The map is based on the combined binary modelling results highlighting potential hotspots of triatomine species diversity. Hatched areas indicate regions where the projection is uncertain. Maps were built using WGS 84 as geographical system and ESRI ArcGIS (ESRI, 2018).
Tables
Key resources table
| Reagent type (species) or resource | Designation | Source or reference | Identifiers | Additional information |
|---|---|---|---|---|
| Software, algorithm | RStudio | R Development Core Team, 2019 | RRID:SCR_000432 | |
| Software, algorithm | ArcGIS for Desktop | ESRI, 2018 | RRID:SCR_011081 | |
| Software, algorithm | biomod2 package | Thuiller et al., 2019 | Available at https://cran.r-project.org/package=biomod2 |
Table 1
Model specifications.
Occurrence points for all considered species used for modelling and model evaluation (AUC).
| Species | Occurrence records | AUC ensemble models |
|---|---|---|
| Panstrongylus geniculatus | 1180 | 0.985 |
| Panstrongylus megistus | 401 | 0.976 |
| Rhodnius brethesi | 85 | 0.991 |
| Rhodnius ecuadoriensis | 31 | 0.989 |
| Rhodnius prolixus | 540 | 0.981 |
| Triatoma brasiliensis | 178 | 0.994 |
| Triatoma dimidiata | 300 | 0.962 |
| Triatoma infestans | 631 | 0.977 |
| Triatoma maculata | 132 | 0.992 |
| Triatoma rubrofasciata | 268 | 0.98 |
| Triatoma sordida | 409 | 0.978 |
| Total | 4155 |
Additional files
-
Source code 1
Source code for species distribution modelling executed in the R environment (R Development Core Team, 2019) using the biomod2 package (Thuiller et al., 2019).
- https://cdn.elifesciences.org/articles/52072/elife-52072-code1-v2.docx
-
Supplementary file 1
Modelled climatic suitability [%] for all occurrences of T. rubrofasciata outside of the Americas.
- https://cdn.elifesciences.org/articles/52072/elife-52072-supp1-v2.docx
-
Supplementary file 2
AUC values of all algorithms for all considered species.
- https://cdn.elifesciences.org/articles/52072/elife-52072-supp2-v2.docx
-
Supplementary file 3
Sensitivity and specificity metrics of the South American training dataset for all considered species and the independent global sensitivity analysis of T. rubrofasciata.
- https://cdn.elifesciences.org/articles/52072/elife-52072-supp3-v2.docx
-
Supplementary file 4
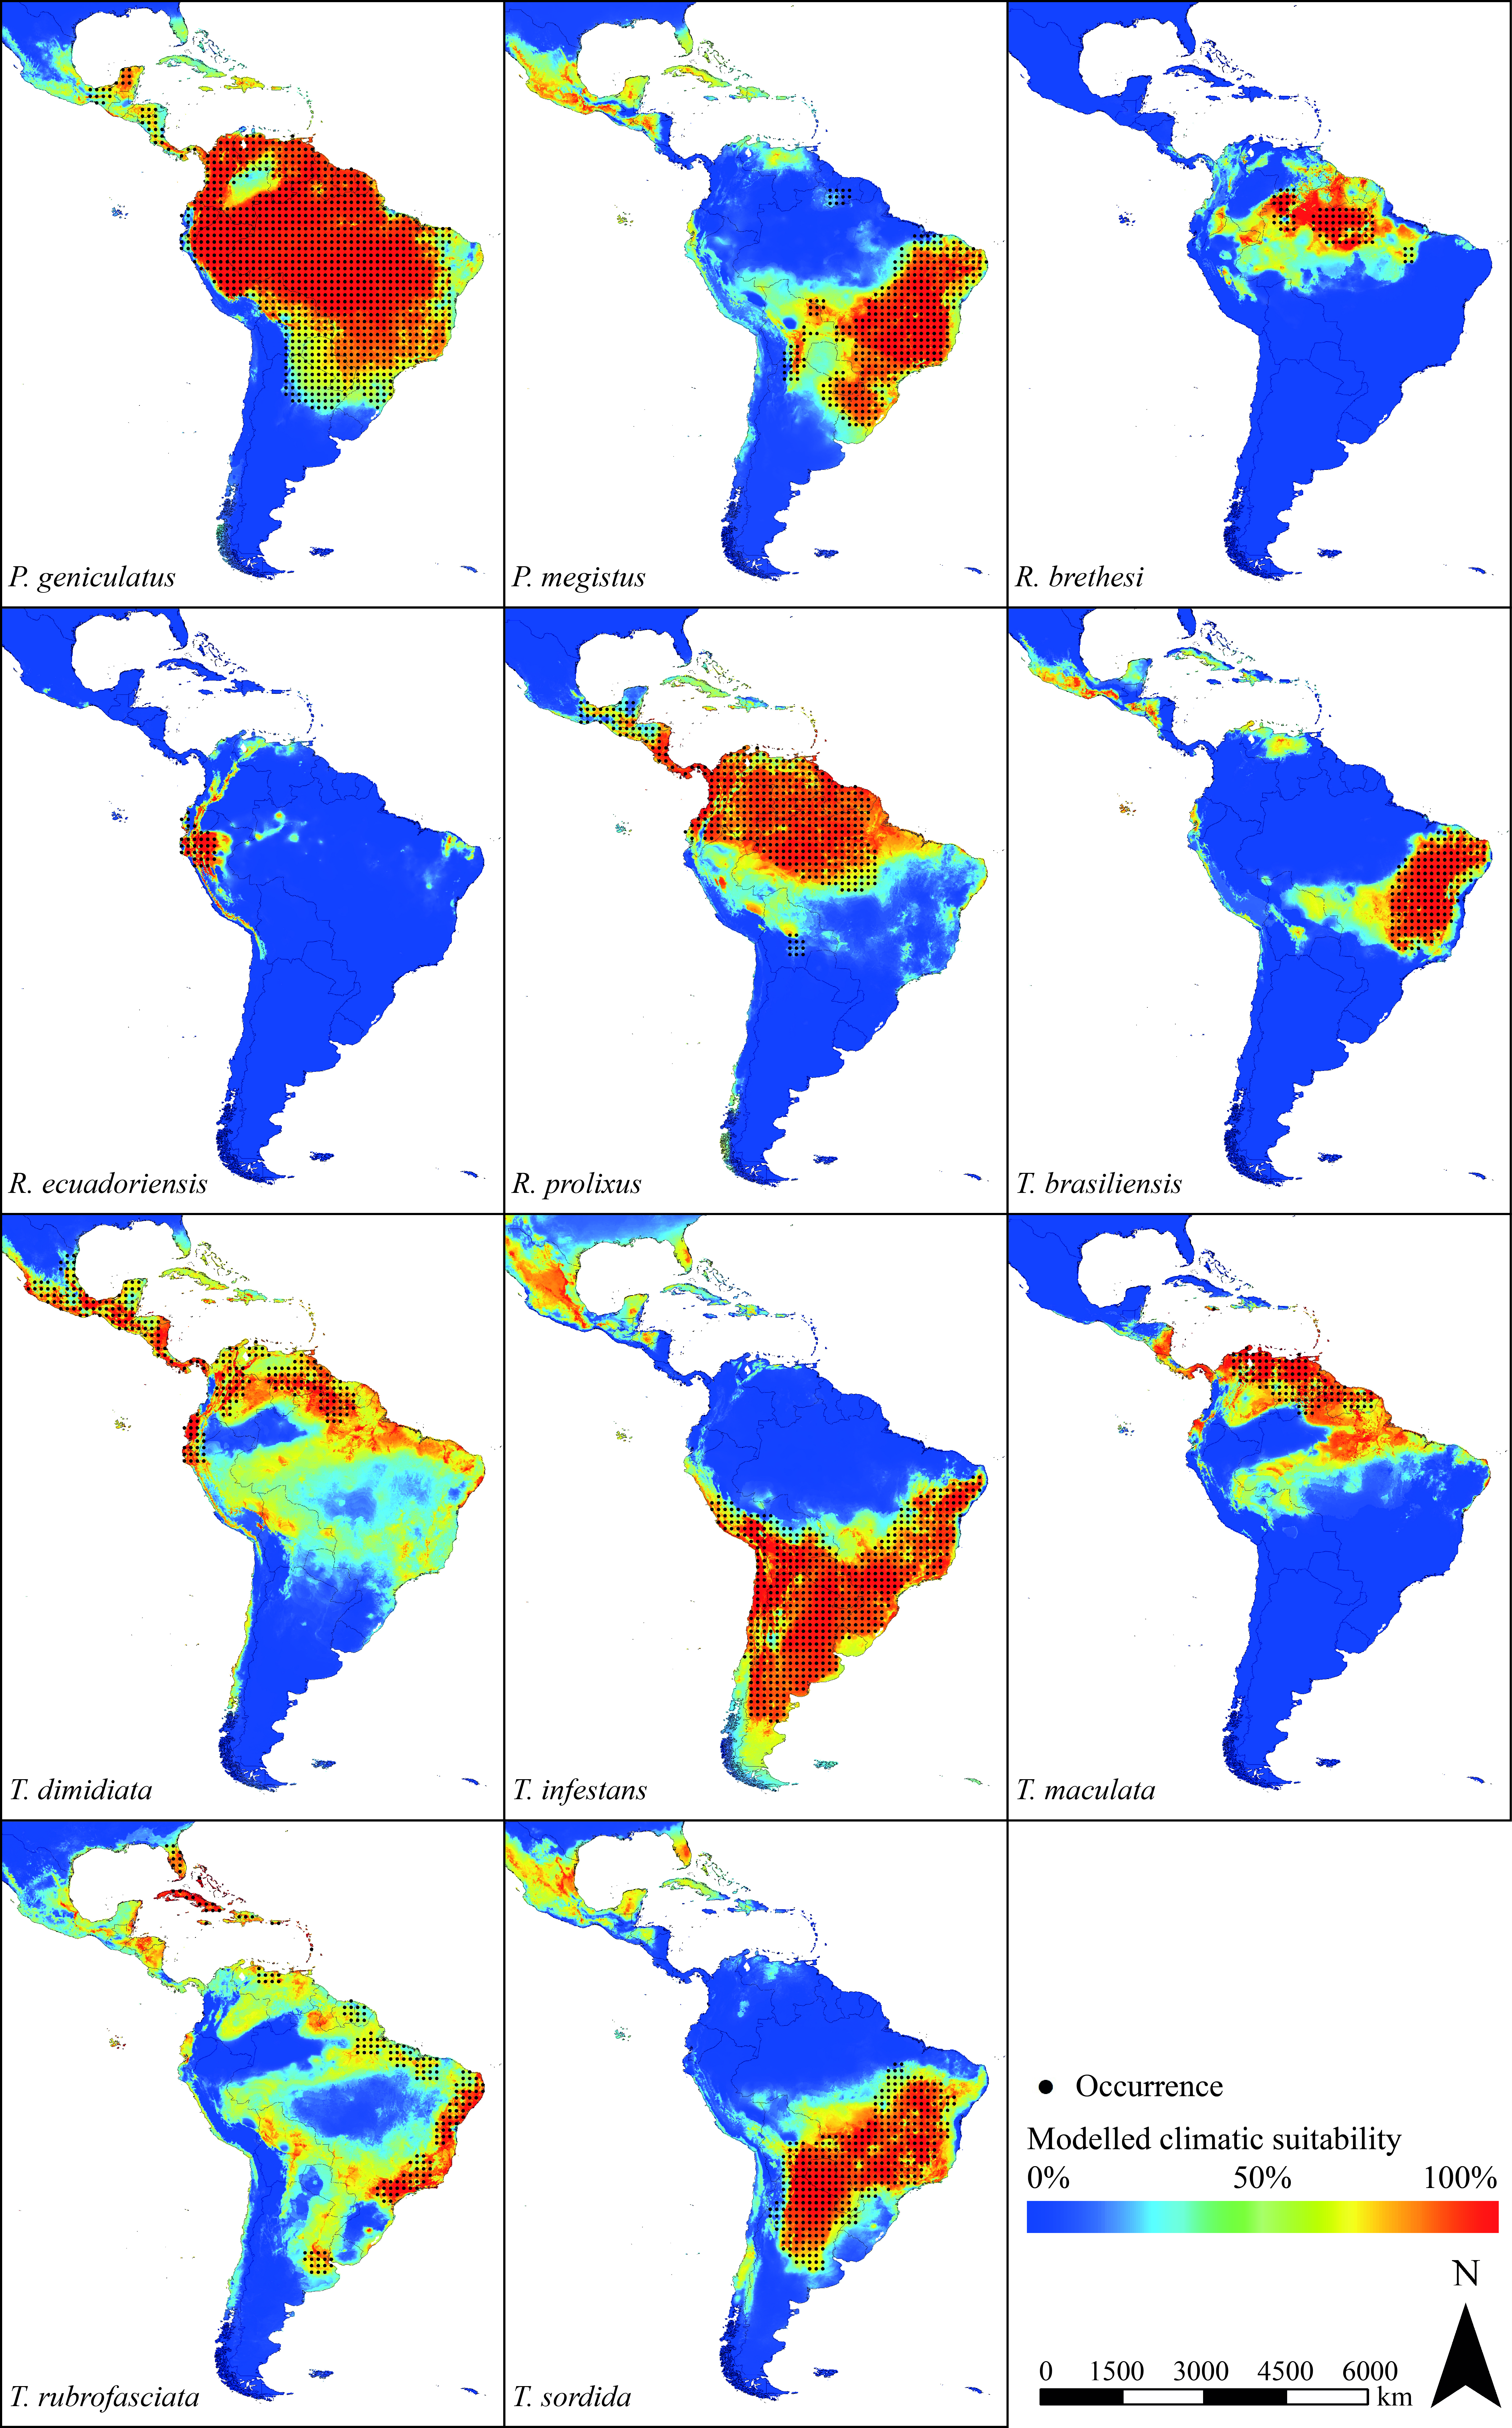
Modelled current climatic suitability and occurrence data from all considered species in South and Central America (Carcavallo et al., 1998; Fergnani et al., 2013).
- https://cdn.elifesciences.org/articles/52072/elife-52072-supp4-v2.jpg
-
Supplementary file 5
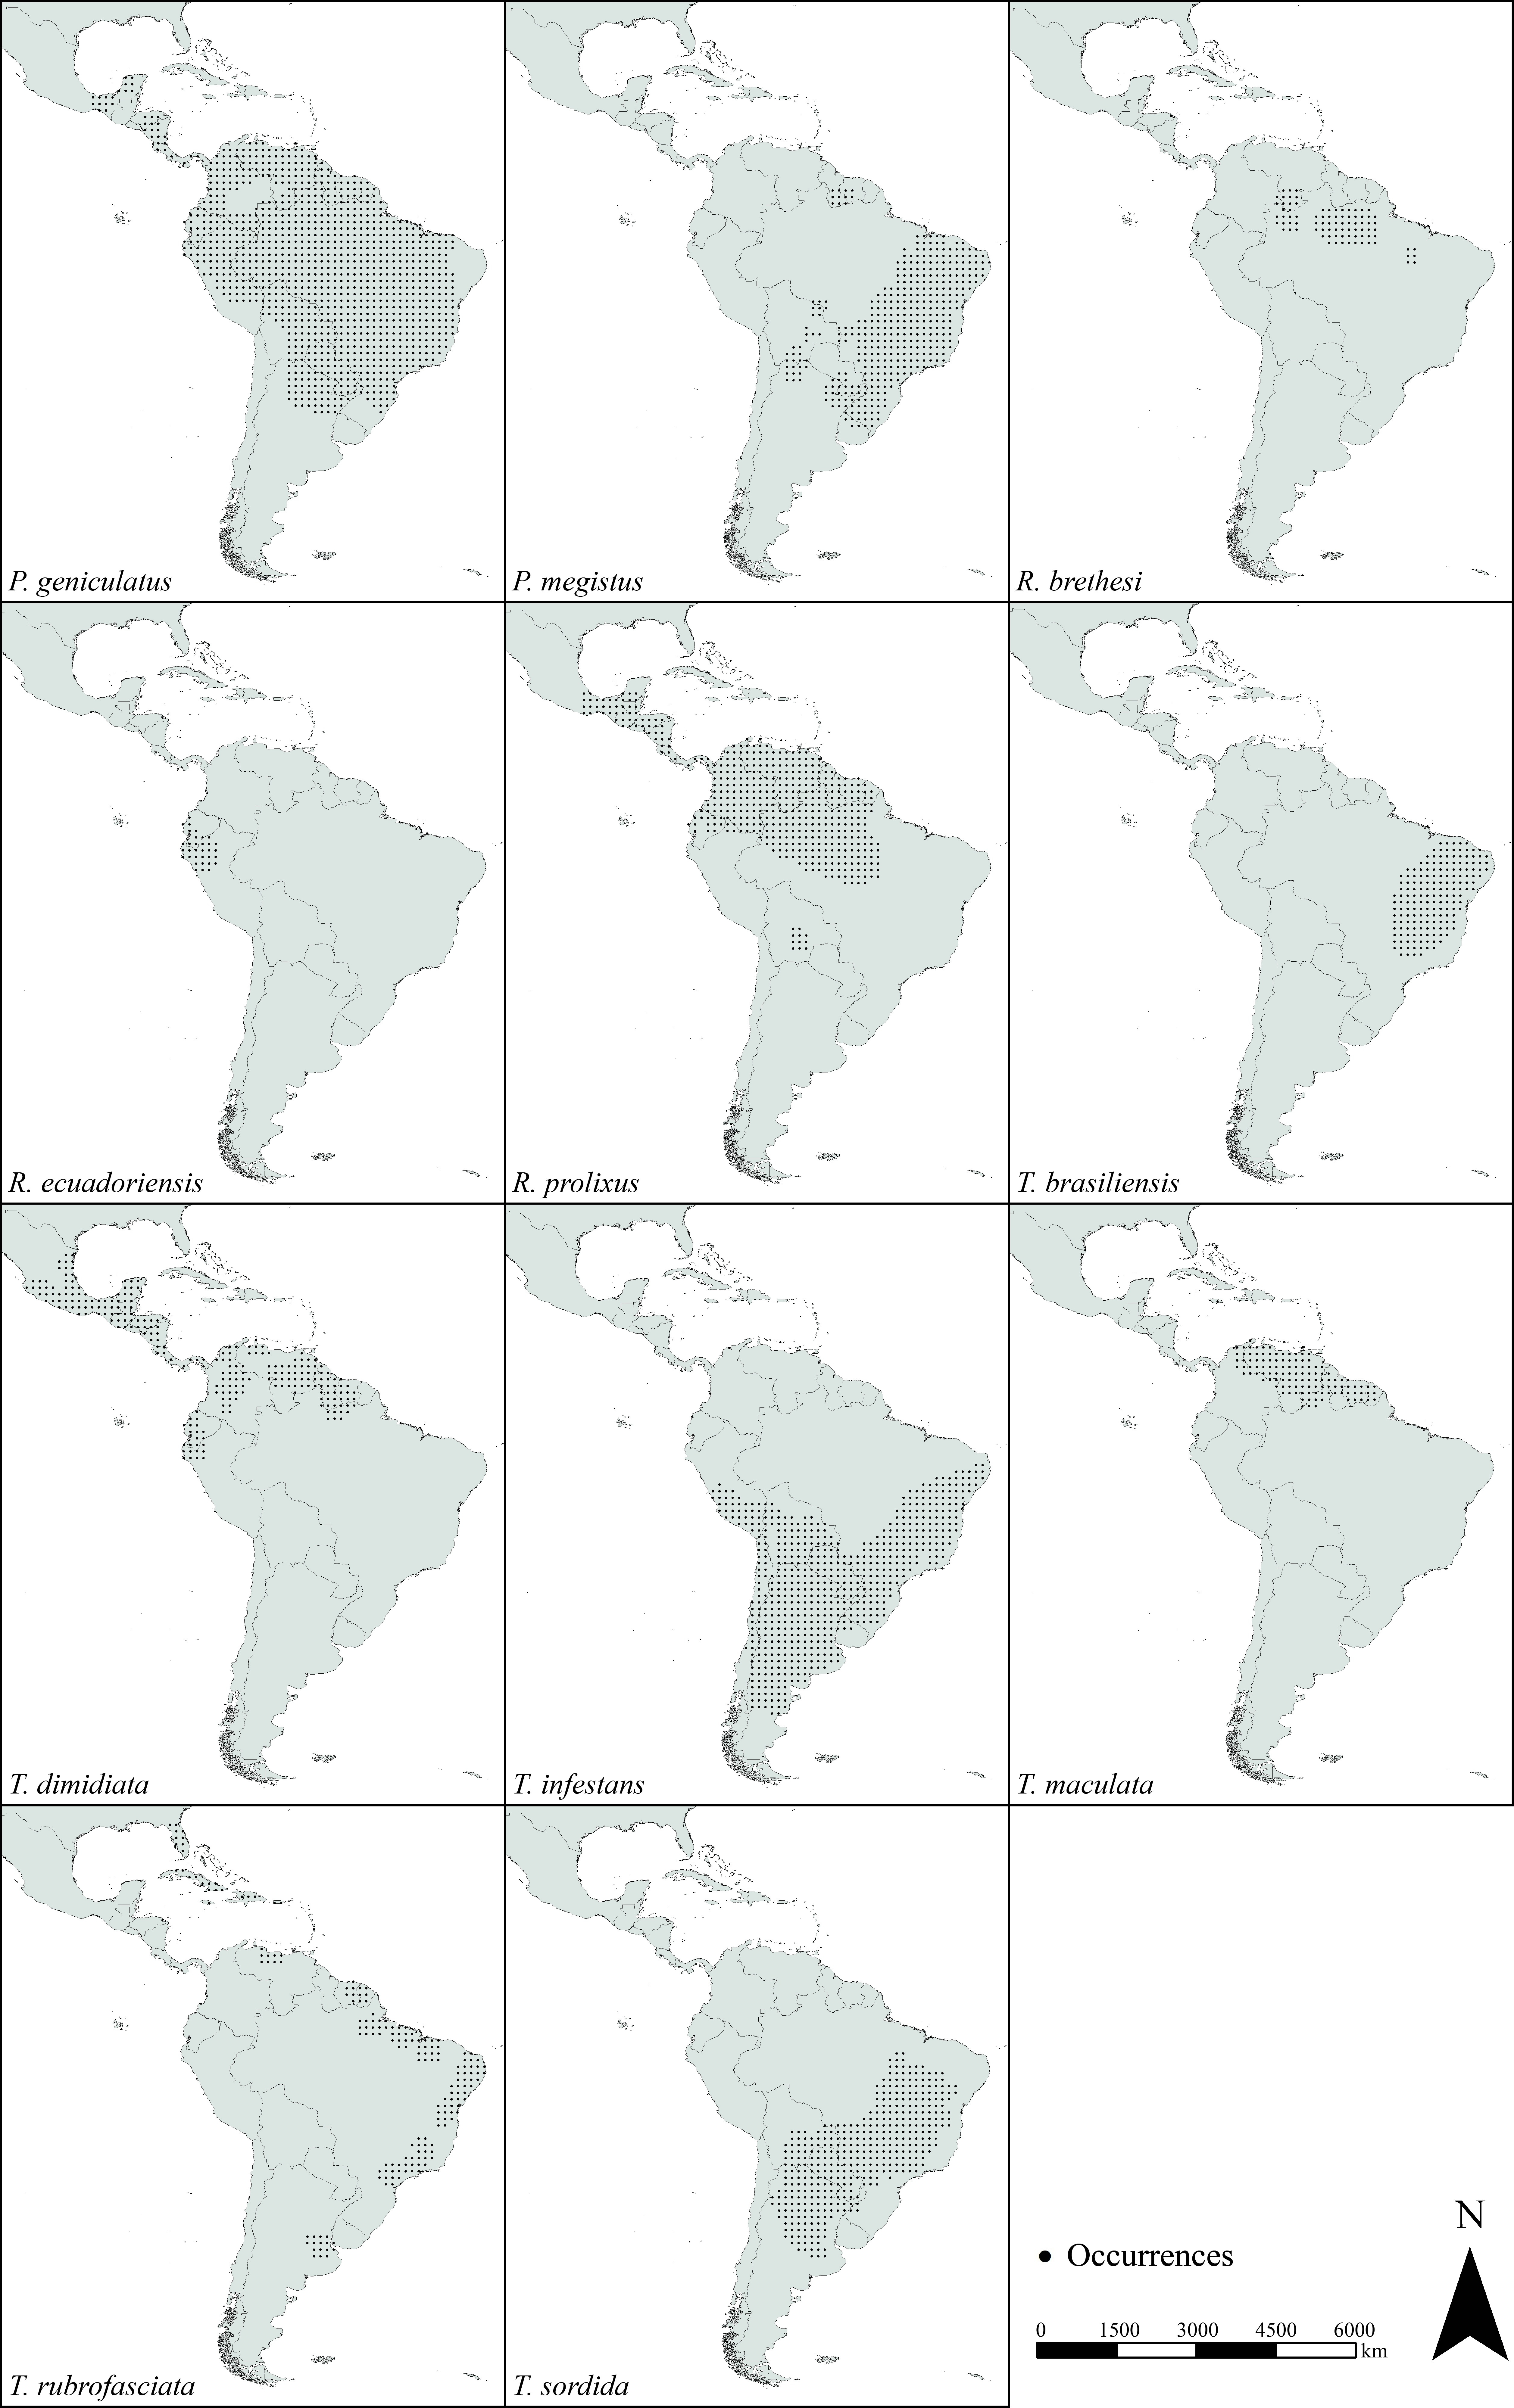
Distribution of all considered species in South and Central America as extracted from the ‘Atlas of Chagas disease vectors in America’ (Carcavallo et al., 1998; Fergnani et al., 2013).
- https://cdn.elifesciences.org/articles/52072/elife-52072-supp5-v2.jpg
-
Supplementary file 6
Juxtaposition of the occurrence data obtained from the ‘Atlas of Chagas disease vectors’ (Carcavallo et al., 1998; Fergnani et al., 2013) (black dots), Ceccarelli et al., 2018 (blue triangles) and (GBIF.org, 2019b; GBIF.org, 2019c; GBIF.org, 2019d; GBIF.org, 2019e; GBIF.org, 2019f; GBIF.org, 2019g; GBIF.org, 2019h; GBIF.org, 2019i; GBIF.org, 2019j; GBIF.org, 2019k; GBIF.org, 2019l) (red triangles) of all considered species.
- https://cdn.elifesciences.org/articles/52072/elife-52072-supp6-v2.jpg
-
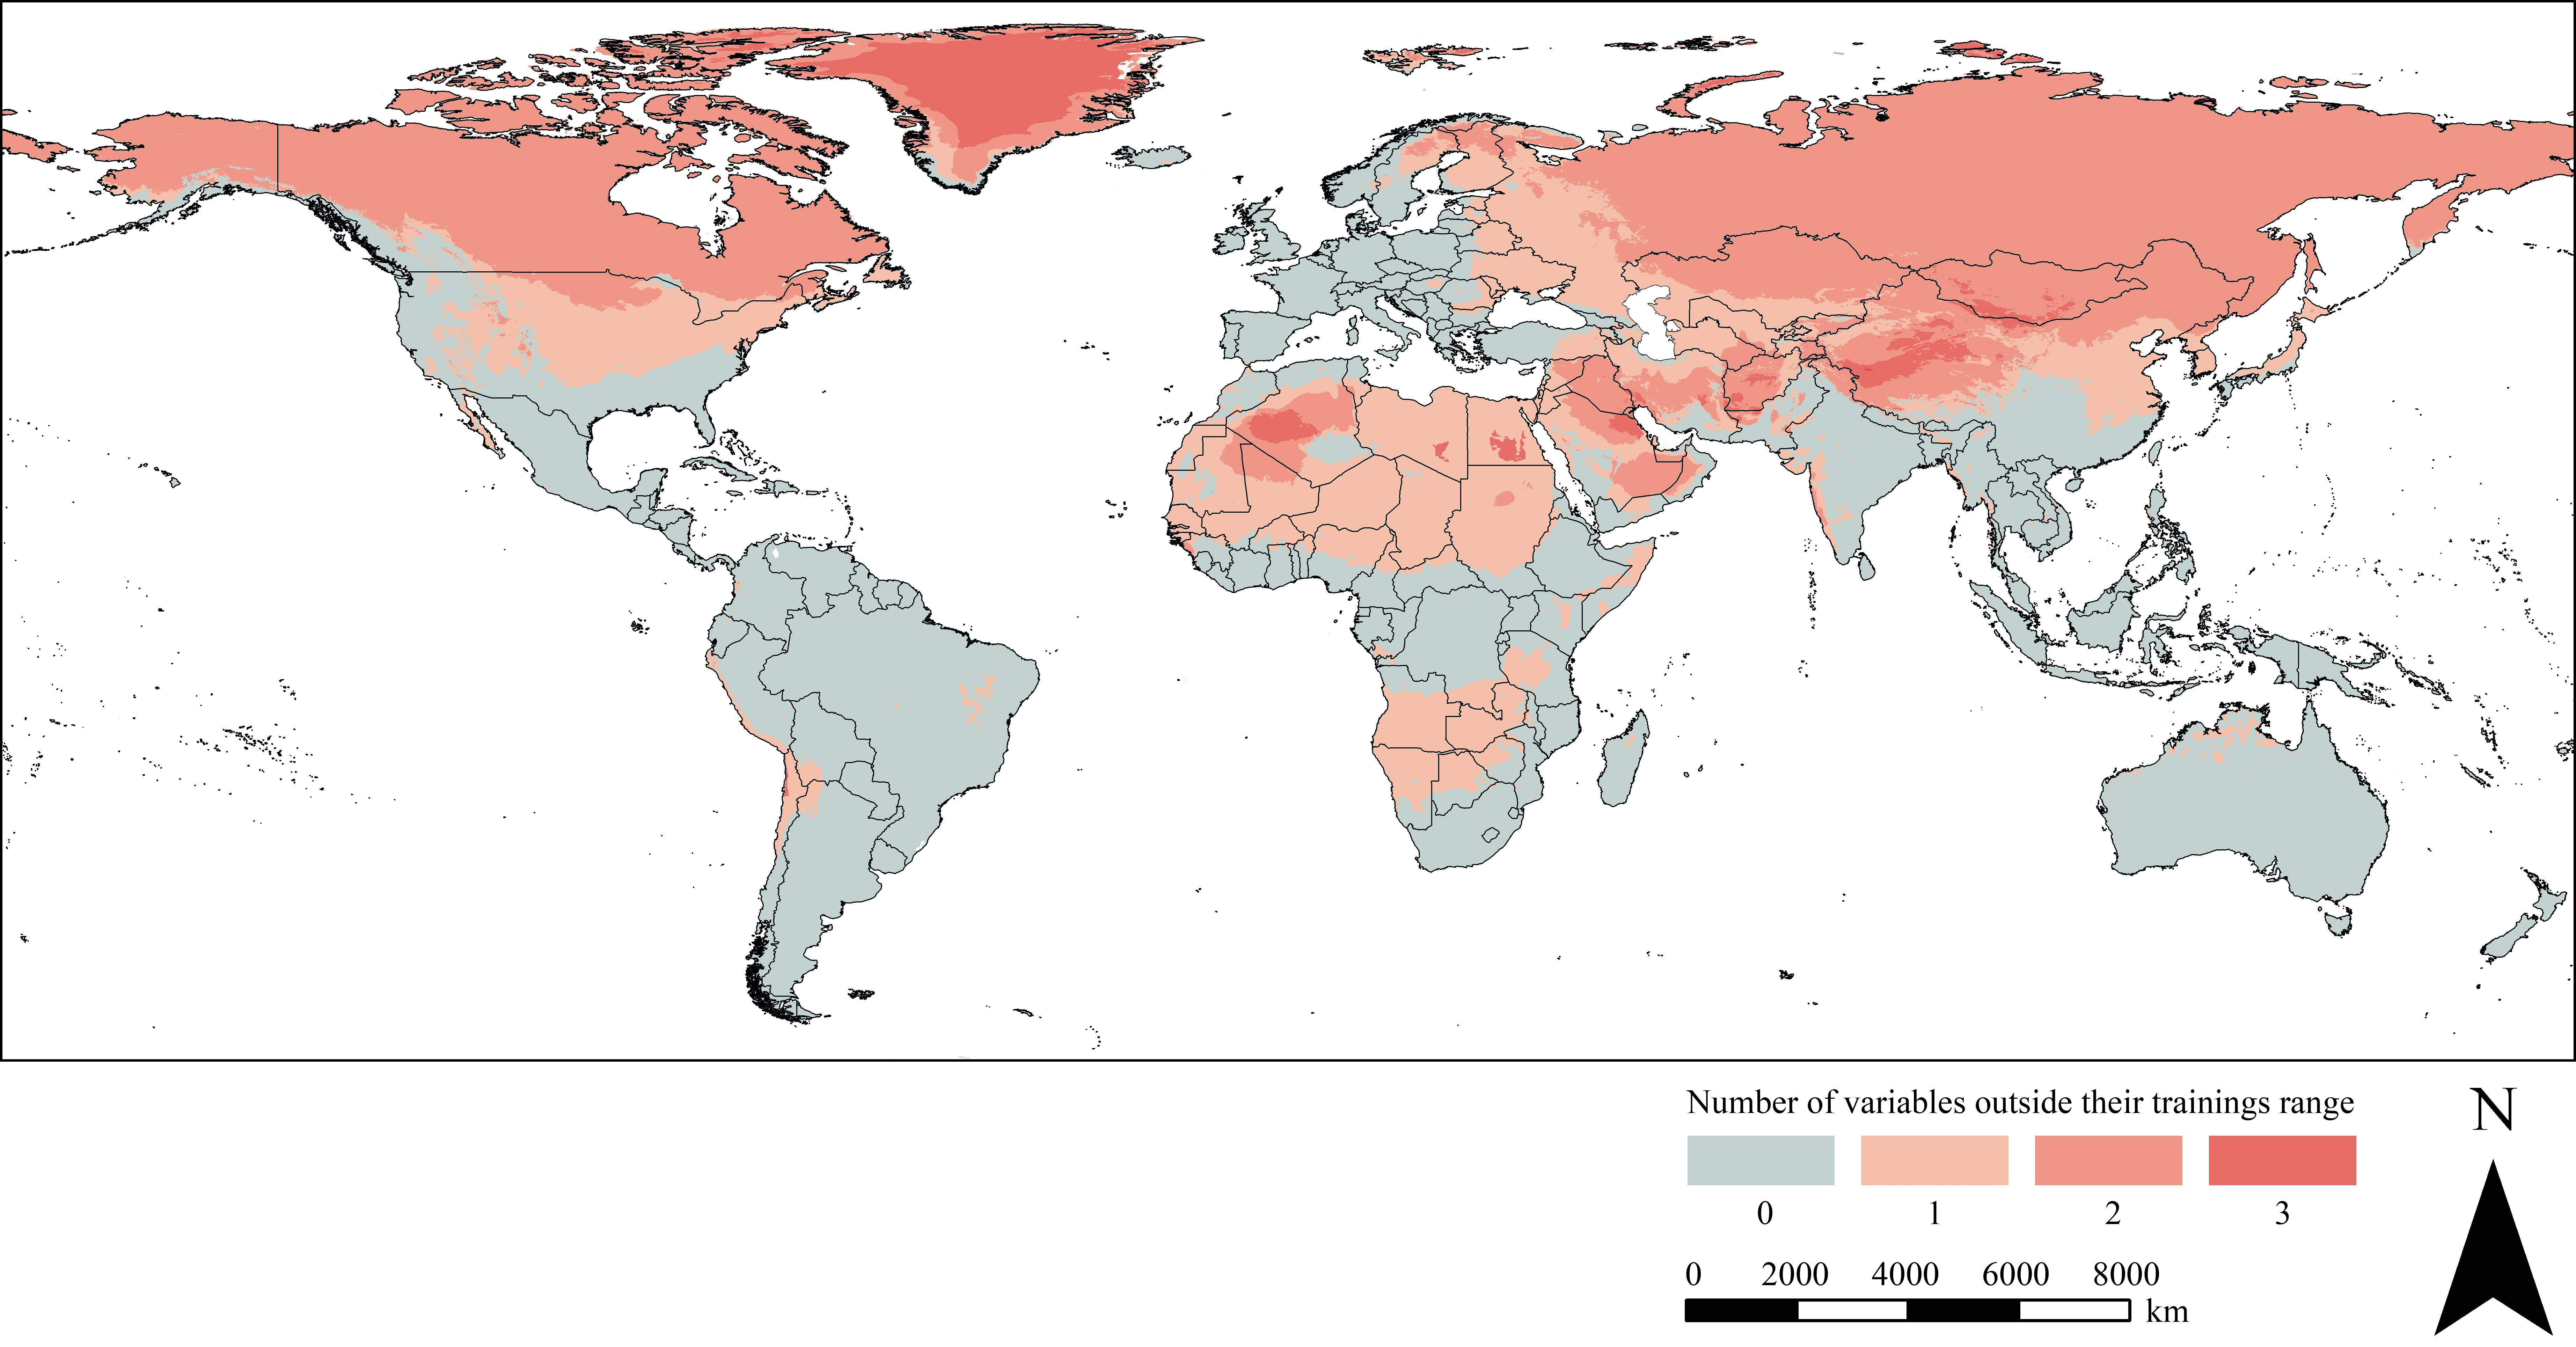
Supplementary file 7
Clamping mask indicating areas in which one or more environmental variables are outside the values of their training range.
The climatic suitability projections in these areas can be regarded as uncertain.
- https://cdn.elifesciences.org/articles/52072/elife-52072-supp7-v2.jpg
-
Supplementary file 8
Sensitivity and specificity metrics of all algorithms for all considered species.
- https://cdn.elifesciences.org/articles/52072/elife-52072-supp8-v2.docx
-
Transparent reporting form
- https://cdn.elifesciences.org/articles/52072/elife-52072-transrepform-v2.pdf
Download links
A two-part list of links to download the article, or parts of the article, in various formats.
Downloads (link to download the article as PDF)
Open citations (links to open the citations from this article in various online reference manager services)
Cite this article (links to download the citations from this article in formats compatible with various reference manager tools)
Modelling the climatic suitability of Chagas disease vectors on a global scale
eLife 9:e52072.
https://doi.org/10.7554/eLife.52072


