Hippocampal theta coordinates memory processing during visual exploration
- Department of Medical Social Sciences, Northwestern University Feinberg School of Medicine, United States
- Department of Neurology, Northwestern University Feinberg School of Medicine, United States
- Department of Neurological Surgery, Northwestern University Feinberg School of Medicine, United States
Figures
Figure 1
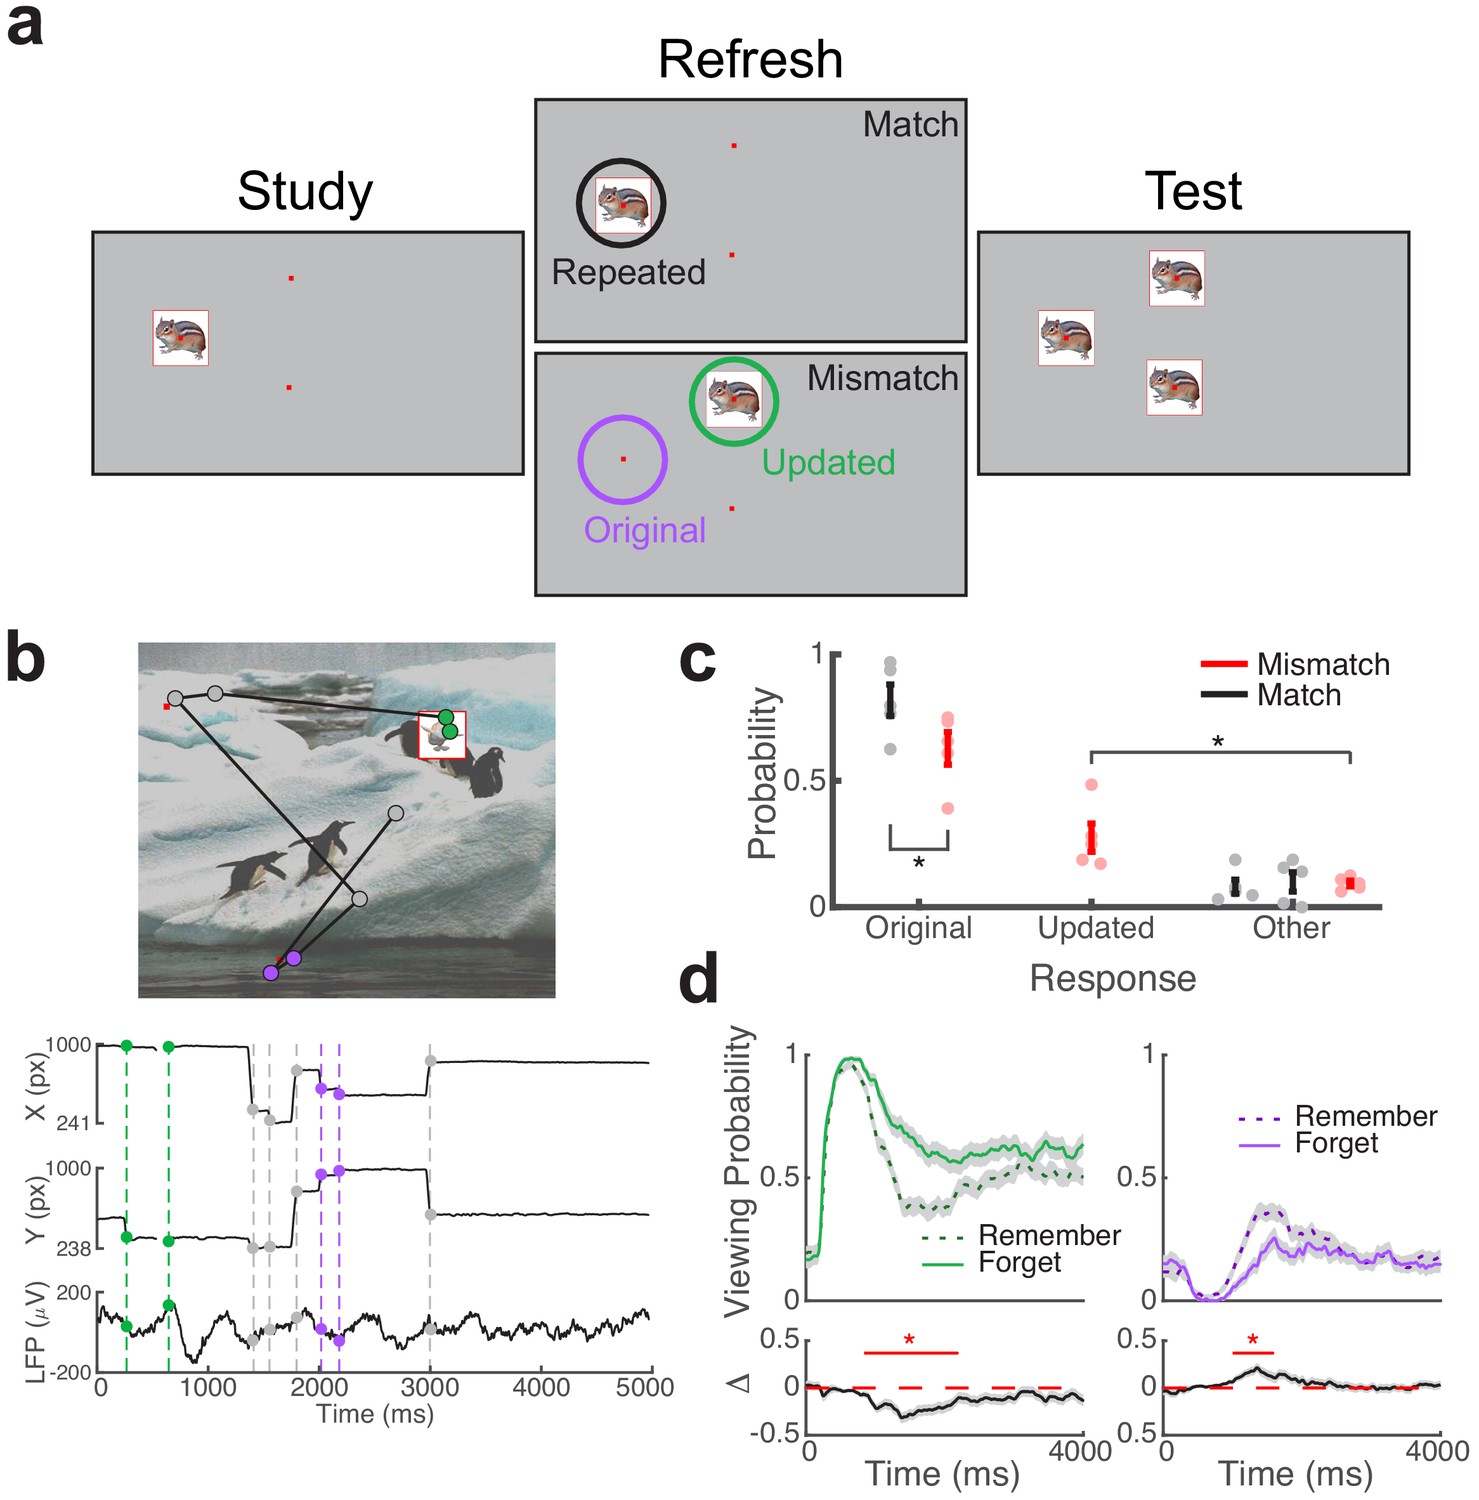
Direct brain recordings during memory-driven eye movements.
(a) Spatial memory task. Example stimuli presented during each phase of the task. Viewing regions of interest (ROIs) for each trial type are indicated by circles on the Refresh phase. (b) Simultaneous recording of gaze position and hippocampal field potential during an example trial. Above, viewing scan path overlaid on the stimulus display for a Mismatch trial. Below, gaze position and concurrent signal for an electrode in the hippocampus. The onset of fixations to viewing ROIs are denoted by colored circles. (c) Behavioral performance. Response proportions on the final recognition test for each viewing condition. Each point denotes a subject average; lines denote one SEM. (d) Viewing behavior on Mismatch trials predicts memory outcomes. The probability of viewing the updated (left) or original (right) object-location was compared on trials in which the original location was subsequently remembered or forgotten. Below, a subsequent memory effect was computed as the difference in viewing probability. Shaded areas depict ± SEM. Lines depict significant clusters (PFWE < 0.05).
-
Figure 1—source data 1
MATLAB code and source files to reproduce data in Figure 1.
- https://cdn.elifesciences.org/articles/52108/elife-52108-fig1-data1-v1.zip
Figure 2 with 3 supplements
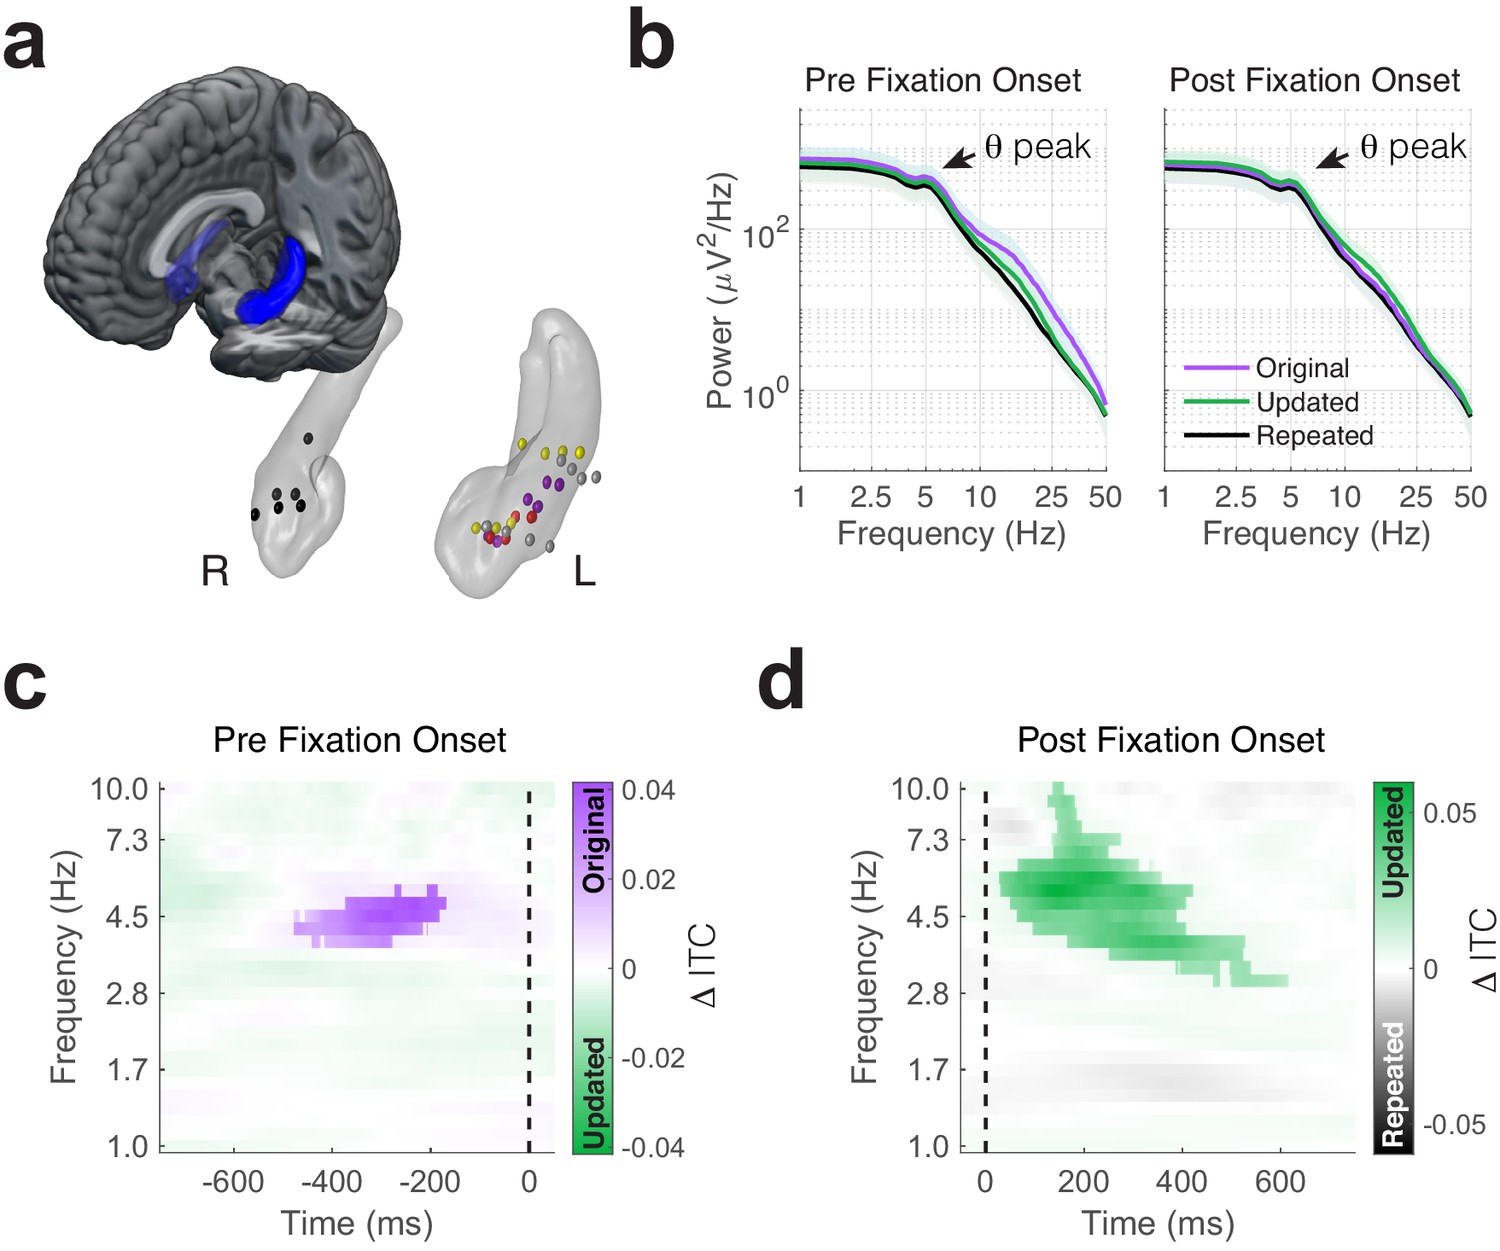
Phase-locking of memory-dependent eye movements to hippocampal theta.
(a) Location of hippocampal electrodes in MNI space. (b) Mean power spectra in peri-fixation epochs. Spectral peaks in the 4 to 6 Hz range are shown in epochs preceding and following fixations to all regions of interest. (c) Increased phase-locking precedes retrieval-dependent fixations. Significant differences (cluster PFWE < 0.05) in inter-trial phase clustering (ITC) between fixations (indicated by the dashed line) to original vs. updated object-locations on Mismatch trials are highlighted. (d) Novelty related modulations in hippocampal phase. Significant differences in ITC following fixations to the updated object-location on Mismatch trials and the repeated object-location on Match trials.
-
Figure 2—source data 1
MATLAB code and source files to reproduce data in Figure 2.
- https://cdn.elifesciences.org/articles/52108/elife-52108-fig2-data1-v1.zip
Figure 2—figure supplement 1
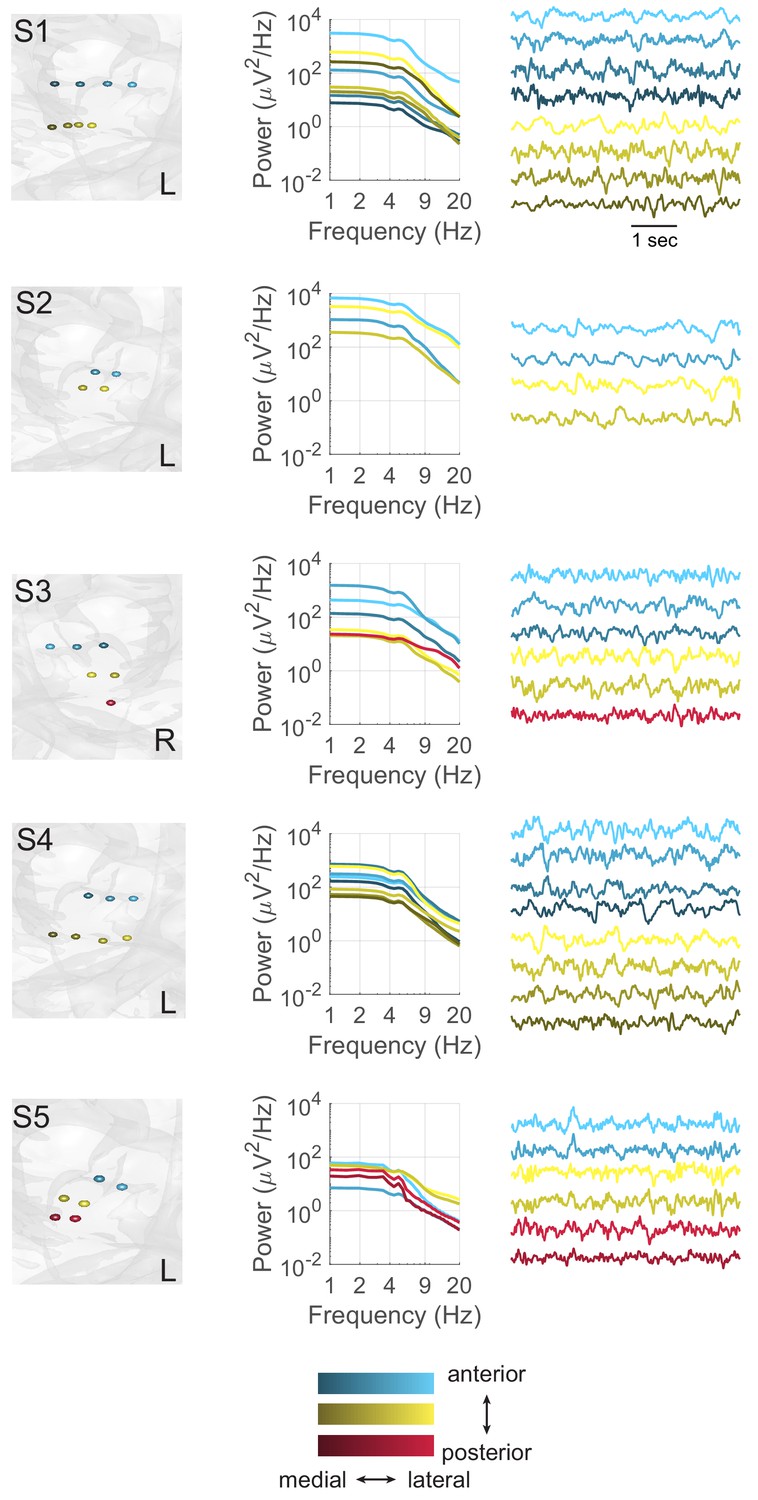
Theta oscillations at individual hippocampal electrodes.
Each panel depicts the arrangement of electrodes (left) and power spectra (right) for each subject (S). Contacts along a single depth electrode are matched in color, with darker contacts located distally. Power spectra are displayed for all bipolar pairs that contain at least one hippocampal contact.
-
Figure 2—figure supplement 1—source data 1
MATLAB code and source files to reproduce data in Figure 2—figure supplement 1.
- https://cdn.elifesciences.org/articles/52108/elife-52108-fig2-figsupp1-data1-v1.zip
Figure 2—figure supplement 2
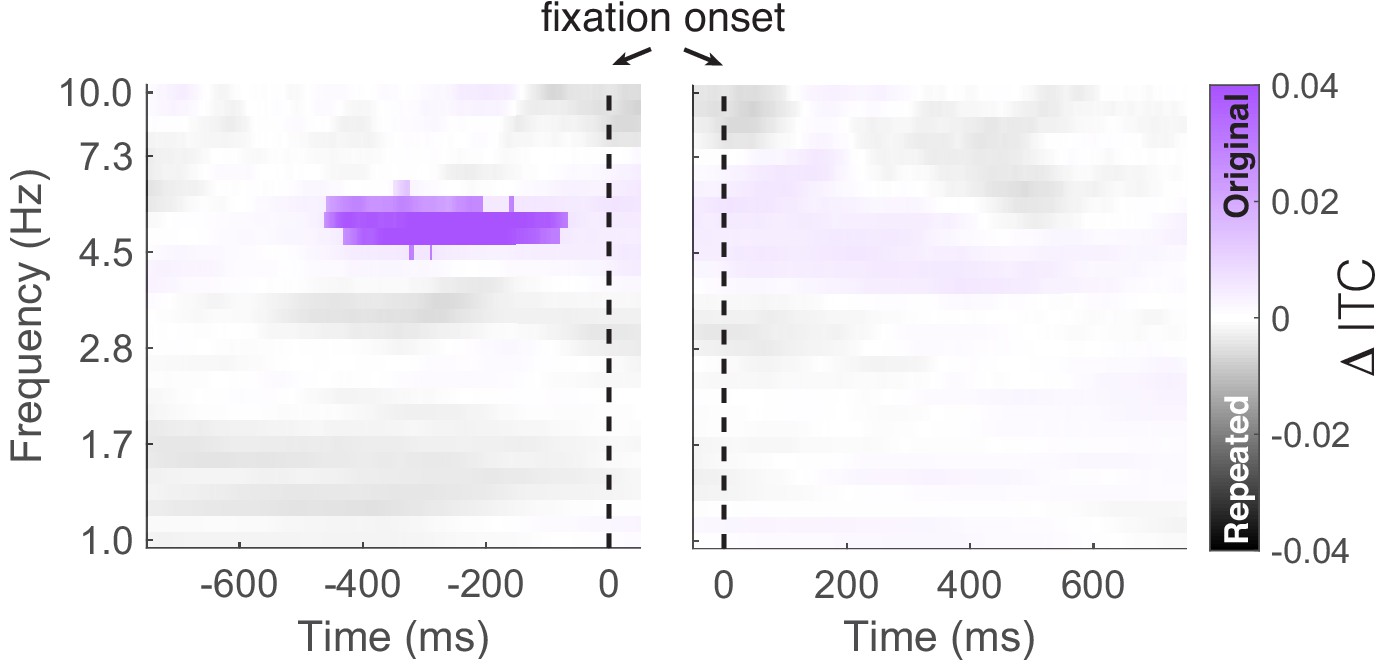
Comparison of inter-trial phase coherence (ITC) between fixations to repeated and original object-locations.
We found significantly (PFWE = 0.04, nonparametric cluster correction) increased ITC preceding fixations to the original vs. repeated object-location. The vertical dashed line indicates the time of fixation onset.
-
Figure 2—figure supplement 2—source data 1
MATLAB code and source files to reproduce data in Figure 2—figure supplement 2.
- https://cdn.elifesciences.org/articles/52108/elife-52108-fig2-figsupp2-data1-v1.zip
Figure 2—figure supplement 3
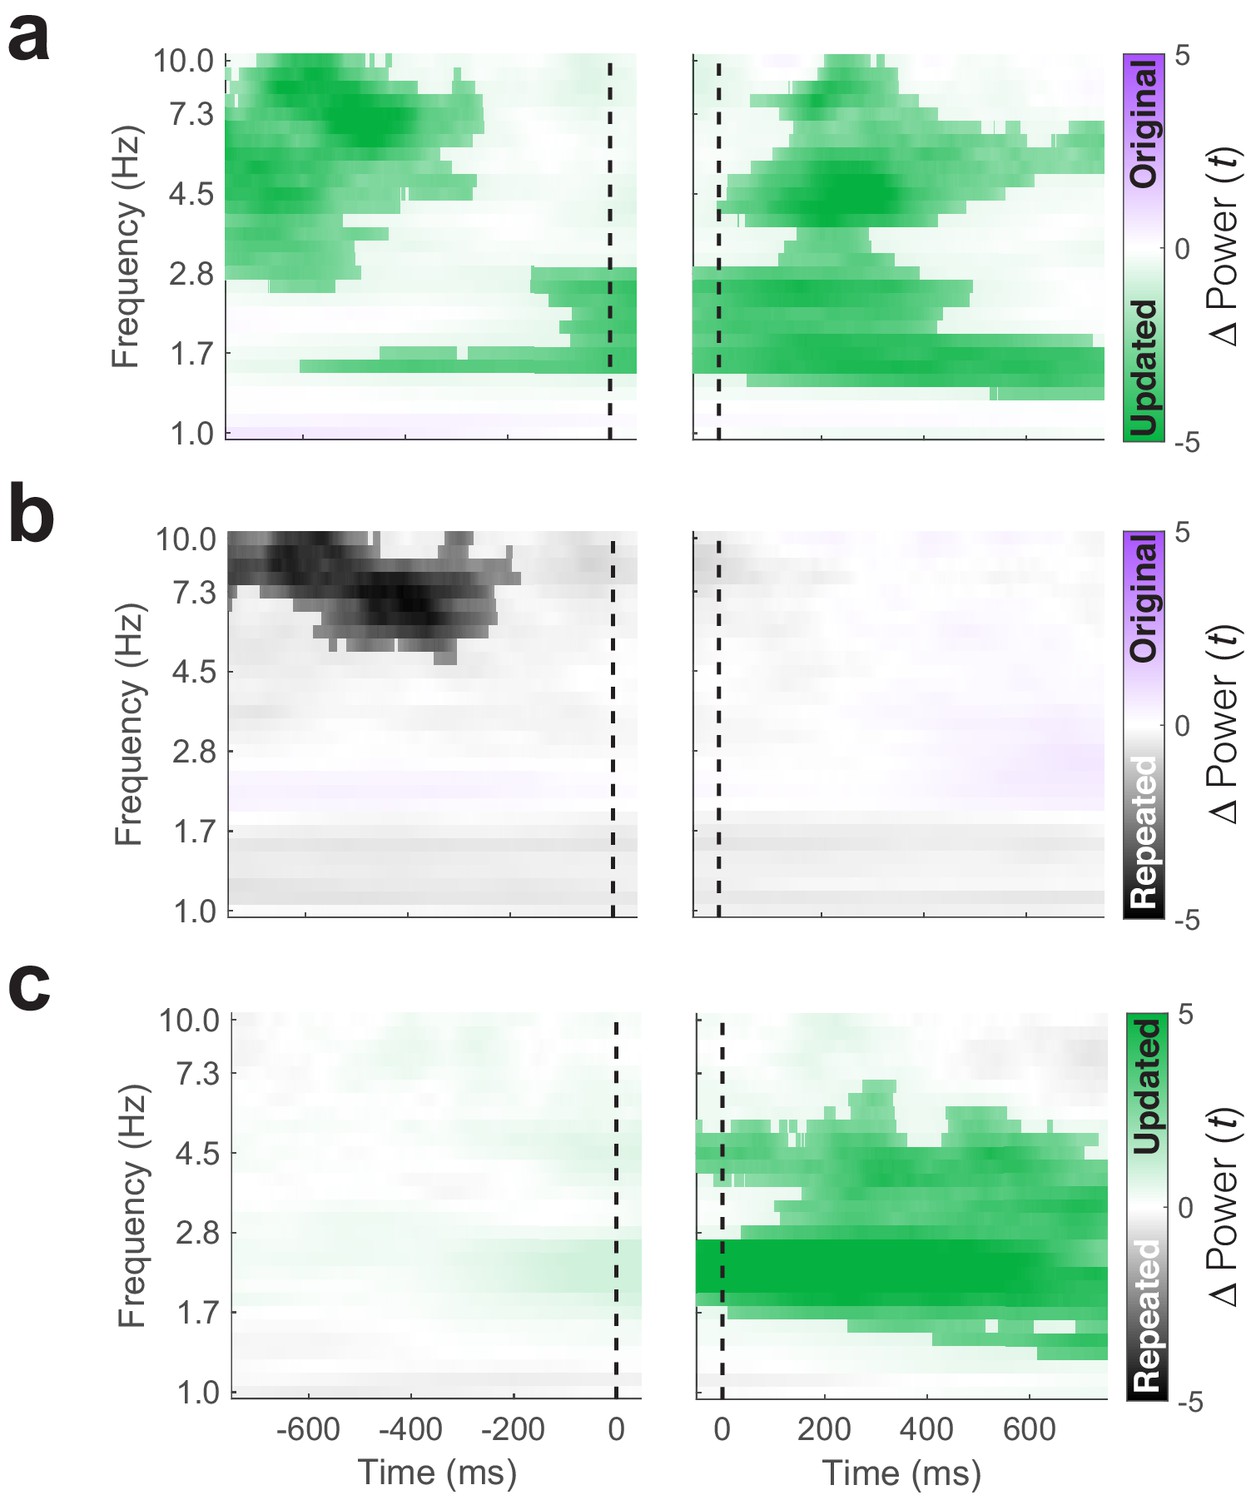
Eye-movement related changes in theta power.
(a) Increased theta power precedes (left) and follow (right) fixations to the updated compared to the original object-location. (b) Same as a, but a contrast of theta power during fixations to the original object-location on Mismatch trials to the repeated object-location on Match trials. (c) Same as in a but focusing on novelty-related changes in power. Increased low-frequency power is identified following fixations to updated versus repeated object-locations. The vertical dashed line indicates the time of fixation onset. Significant clusters (PFWE < 0.05, nonparametric cluster correction) are highlighted.
-
Figure 2—figure supplement 3—source data 1
MATLAB code and source files to reproduce data in Figure 2—figure supplement 3.
- https://cdn.elifesciences.org/articles/52108/elife-52108-fig2-figsupp3-data1-v1.zip
Figure 3

Distinct phases of theta phase are associated with retrieval and associative novelty.
(a) Timecourse of inter-trial coherence (ITC) for theta (5 Hz) phase during Mismatch trials. Pre- and post-fixation time-periods of interest are indicated by vertical bars. Shaded regions depict ± SEM. (b) Theta phase distributions for an example Mismatch trial. Left, the local field potential measured across an electrode (low-pass filtered at 20 Hz for display) is plotted above the prominent theta (4 to 6 Hz bandpass filtered) timeseries. Time zero denotes the start of the trial. Right, polar histograms show the corresponding distributions of phase angles in the Pre and Post fixation periods for fixations to the original (top panels) and updated (bottom panels) object-locations. (c) Theta phase distributions for a left (L) hippocampal electrode from subject 5 (S5) . Histograms show phase distributions during each time period of interest, aggregated across all fixations of interest during Mismatch trials. (d) Differences in theta phase distributions across all electrodes. Left, polar histograms show the distribution of theta phases across electrodes, averaged for each fixation target. Right, retrieval and novelty-related clustering are associated with distinct phases of theta. Dots depict the average phase angle for each electrode, with 95% confidence intervals indicated by heavy lines.
-
Figure 3—source data 1
MATLAB code and source files to reproduce data in Figure 3.
- https://cdn.elifesciences.org/articles/52108/elife-52108-fig3-data1-v1.zip
Figure 4 with 2 supplements
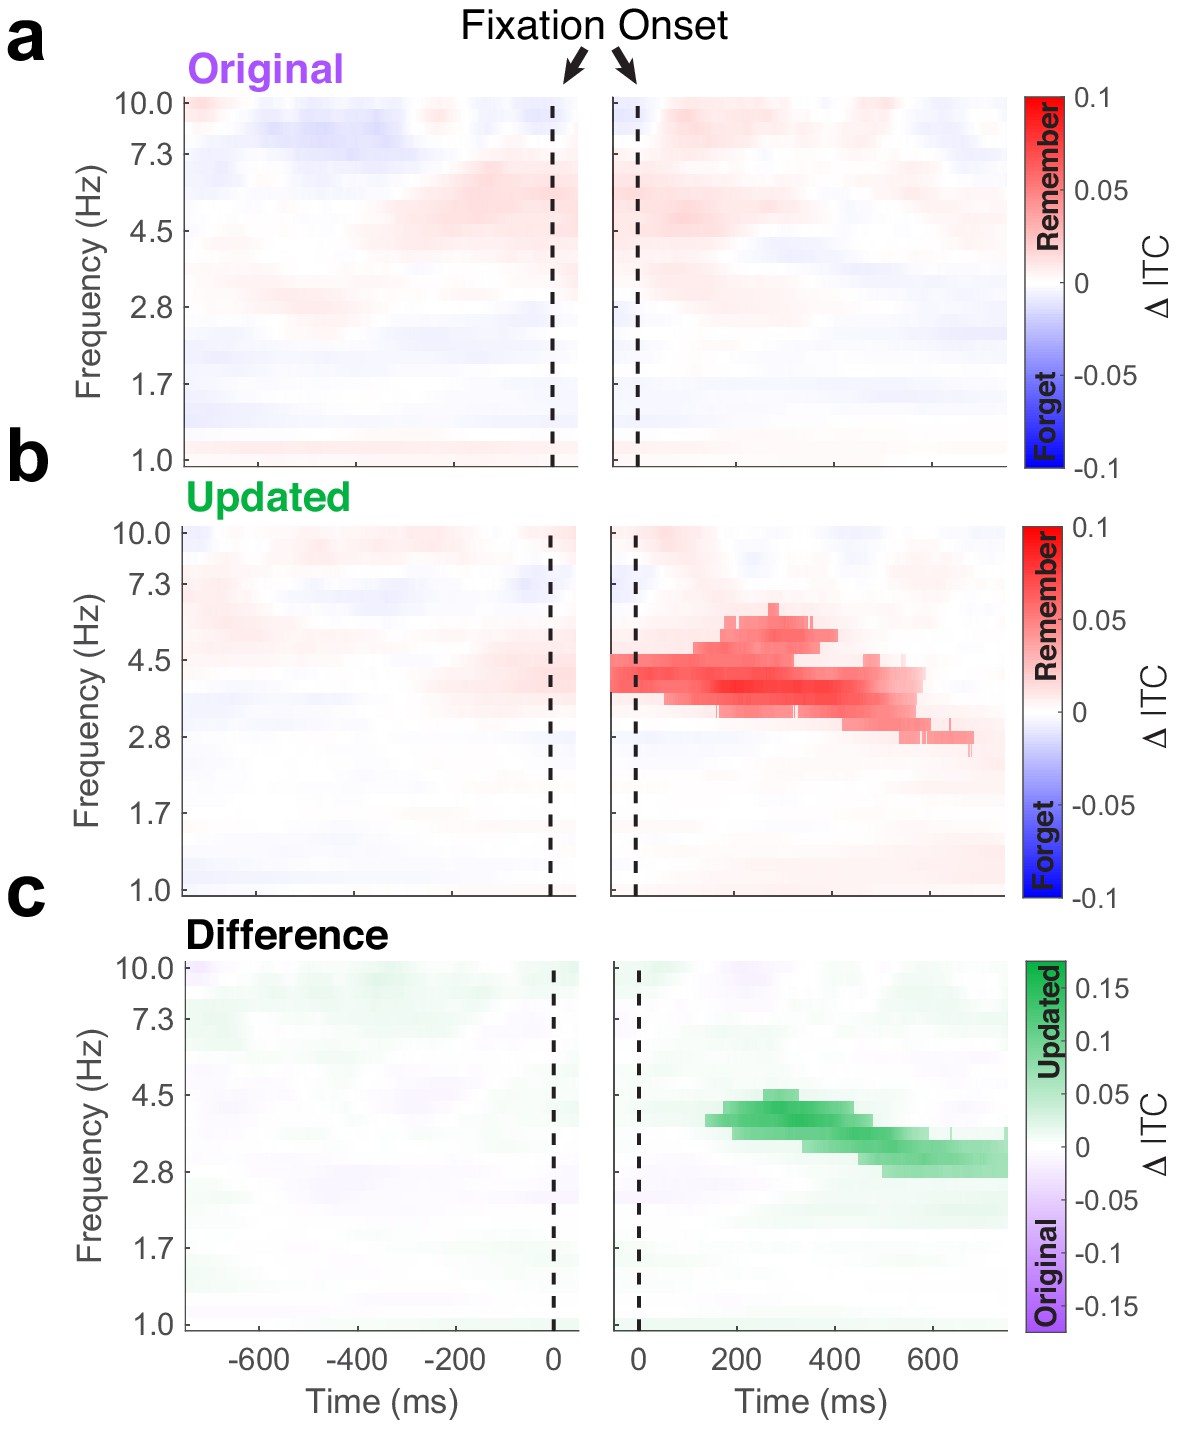
Phase-locking of hippocampal theta predicts subsequent memory.
Time-frequency plots depict differences in inter-trial phase coherence (ITC) between subsequently remembered and forgotten Mismatch trials. (a) No subsequent memory effects were present during fixations to the original object-location. (b) Significant (PFWE < 0.05, nonparametric cluster corrected) increases in phase-locking were associated with memory following the fixations to the updated object-location. (c) Subsequent memory effects were specific to updated object-locations, as revealed by the significant (PFWE < 0.05, nonparametric cluster corrected) interaction following fixation onset.
-
Figure 4—source data 1
MATLAB code and source files to reproduce data in Figure 4.
- https://cdn.elifesciences.org/articles/52108/elife-52108-fig4-data1-v1.zip
Figure 4—figure supplement 1

Impact of saccades in pre- and post-fixation windows on inter-trial phase clustering.
(a) Time-frequency plots show consistent increases in ITC preceding fixations to the original object-location related to memory retrieval, after excluding fixations with extraneous saccades occurring in the preceding 100 (top), 200 (middle), or 400 (bottom) ms. (b) Increased ITC after fixations to updated vs. repeated object-locations persists after excluding fixations in which additional saccades occur within 100 (top), 200 (middle), or 400 (bottom) ms. (c) After fixations to updated object-locations, increased ITC is associated with memory for the original object-location even when excluding fixations with saccades in the initial 100, 200, or 400 ms. Plotting convention follows panel b. Clusters with marginal significance (0.05 < PFWE < 0.1) are noted in each panel. All other clusters are significant (PFWE < 0.05). Yellow lines on the x-axis denote the time period free of additional saccades. Vertical shaded regions indicate consistent time windows across comparisons.
-
Figure 4—figure supplement 1—source data 1
MATLAB code and source files to reproduce data in Figure 4—figure supplement 1.
- https://cdn.elifesciences.org/articles/52108/elife-52108-fig4-figsupp1-data1-v1.zip
Figure 4—figure supplement 2
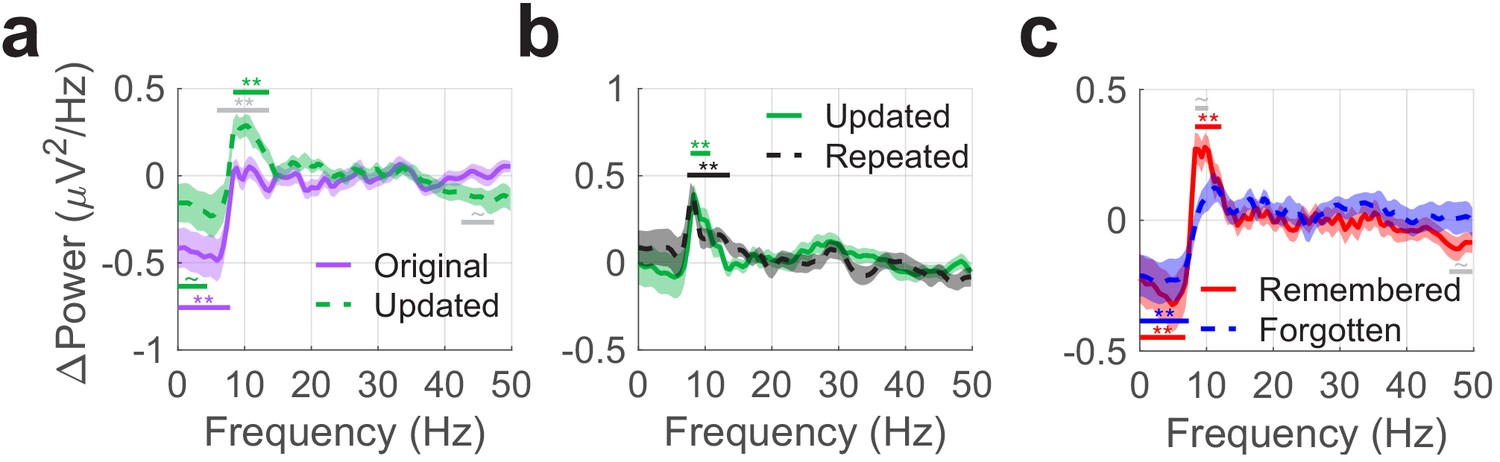
Theta phase resets follow fixations to objects and predict subsequent memory.
Each panel depicts differences in mean ERP power post- vs. pre-fixation to identify phase alignment across trials. (a) Phase resets occurred following fixations to updated vs. original object-locations from 8 to 13 Hz. On the other hand, ERP power was slightly greater for fixations to the original object-location during the pre-fixation period between 0.5 to 4 Hz. (b) The magnitude of phase resets was consistent following fixations to objects presented in updated and repeated viewing conditions. (c) Phase resets following fixations to updated object-locations were associated with intact memory for the original object-location. Colored bars denote significant differences vs. zero for each condition. Grey bars denote significant differences between conditions. Shaded regions denote standard error of the mean (across subjects). ** PFWE < 0.05, ~ PFWE < 0.1.
-
Figure 4—figure supplement 2—source data 1
MATLAB code and source files to reproduce data in Figure 4—figure supplement 2.
- https://cdn.elifesciences.org/articles/52108/elife-52108-fig4-figsupp2-data1-v1.zip
Figure 5
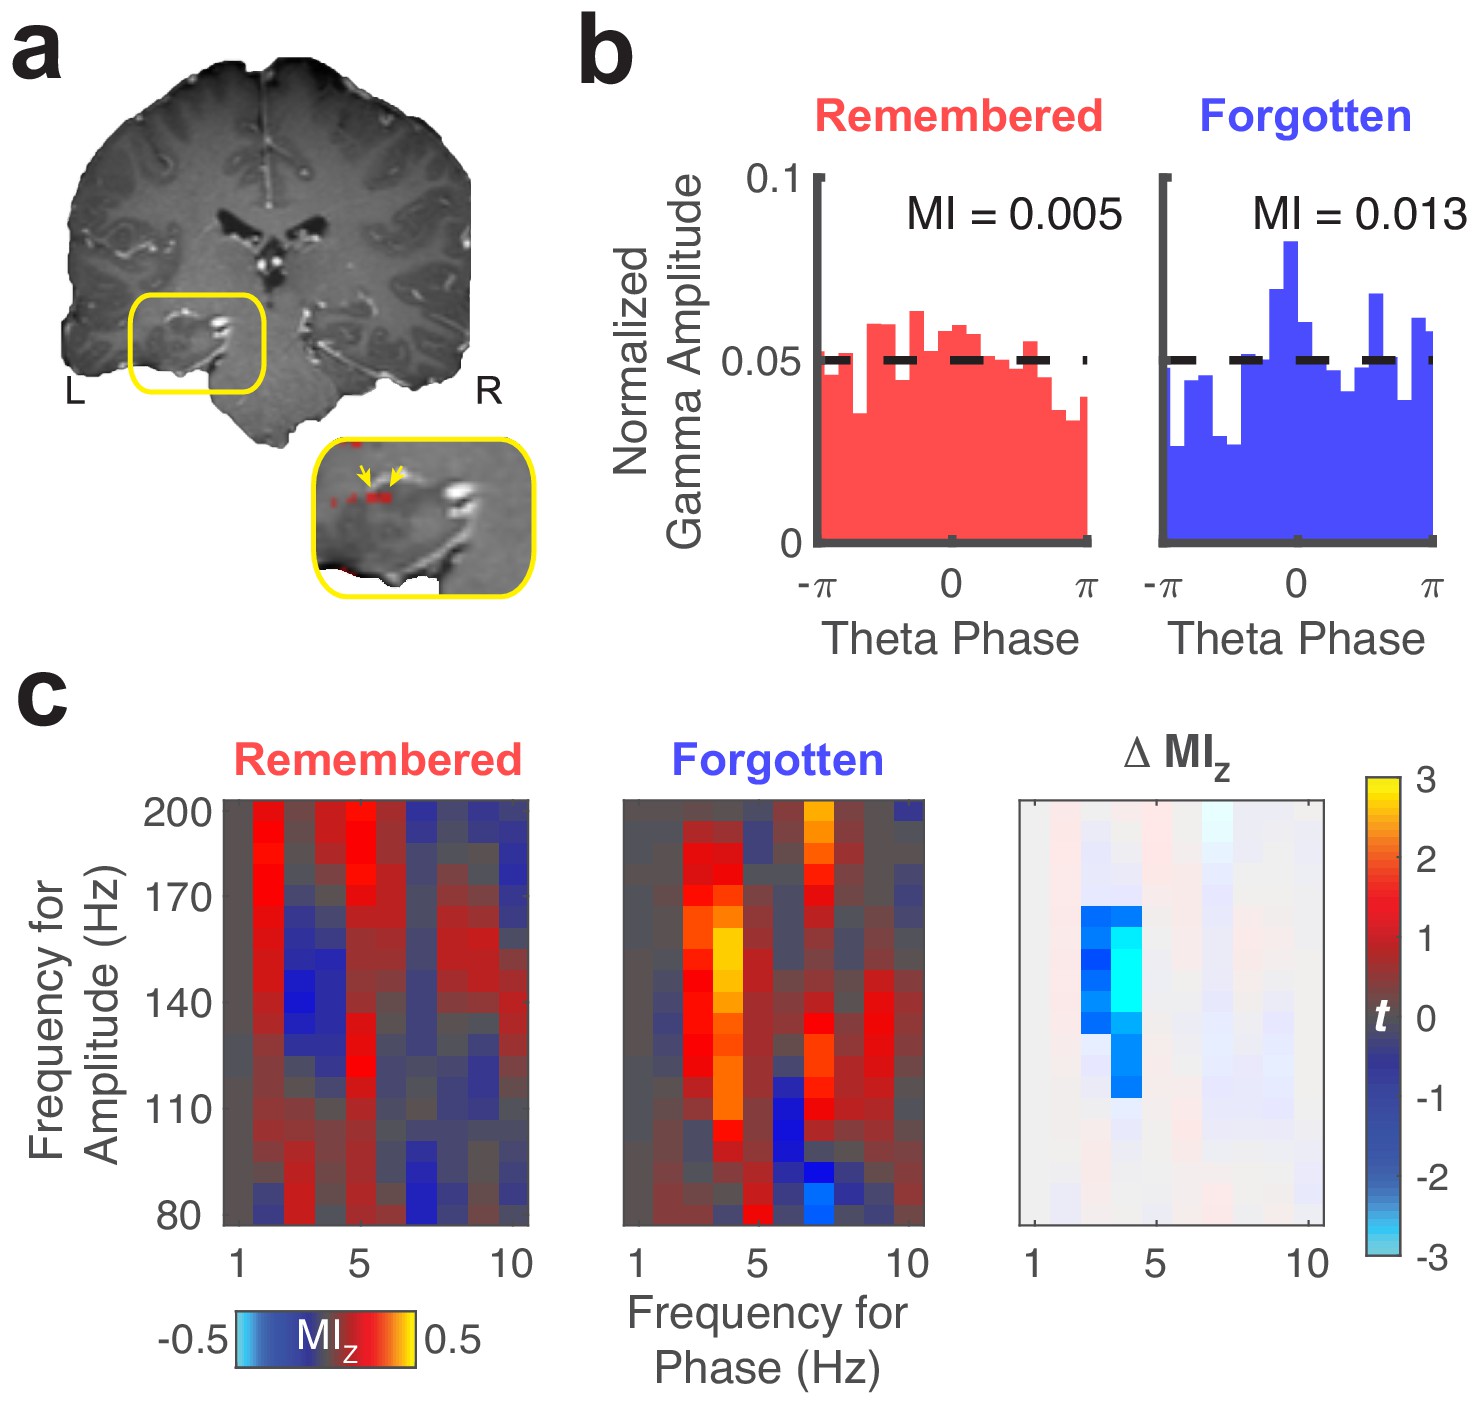
Representative theta to gamma phase amplitude coupling at an individual electrode.
(a) Re-referenced bipolar recording from contacts in the left hippocampus and adjacent white matter. (b) Normalized amplitude distributions reveal memory-related modulation of gamma (150 Hz) amplitude by theta (4 Hz) phase at this recording site. MI, modulation index. Dashed line denotes normalized gamma amplitude under a uniform distribution. (c) Left, comodulograms depict increased PAC (z-scored MI, constructed from trial-shuffled surrogate data) during fixations to updated object-locations when memory for the original object-location was forgotten. Right, the statistical map depicts a cluster of significant (PFWE < 0.05, nonparametric cluster corrected) cross-frequency interactions.
-
Figure 5—source data 1
MATLAB code and source files to reproduce data in Figure 5.
- https://cdn.elifesciences.org/articles/52108/elife-52108-fig5-data1-v1.zip
Figure 6
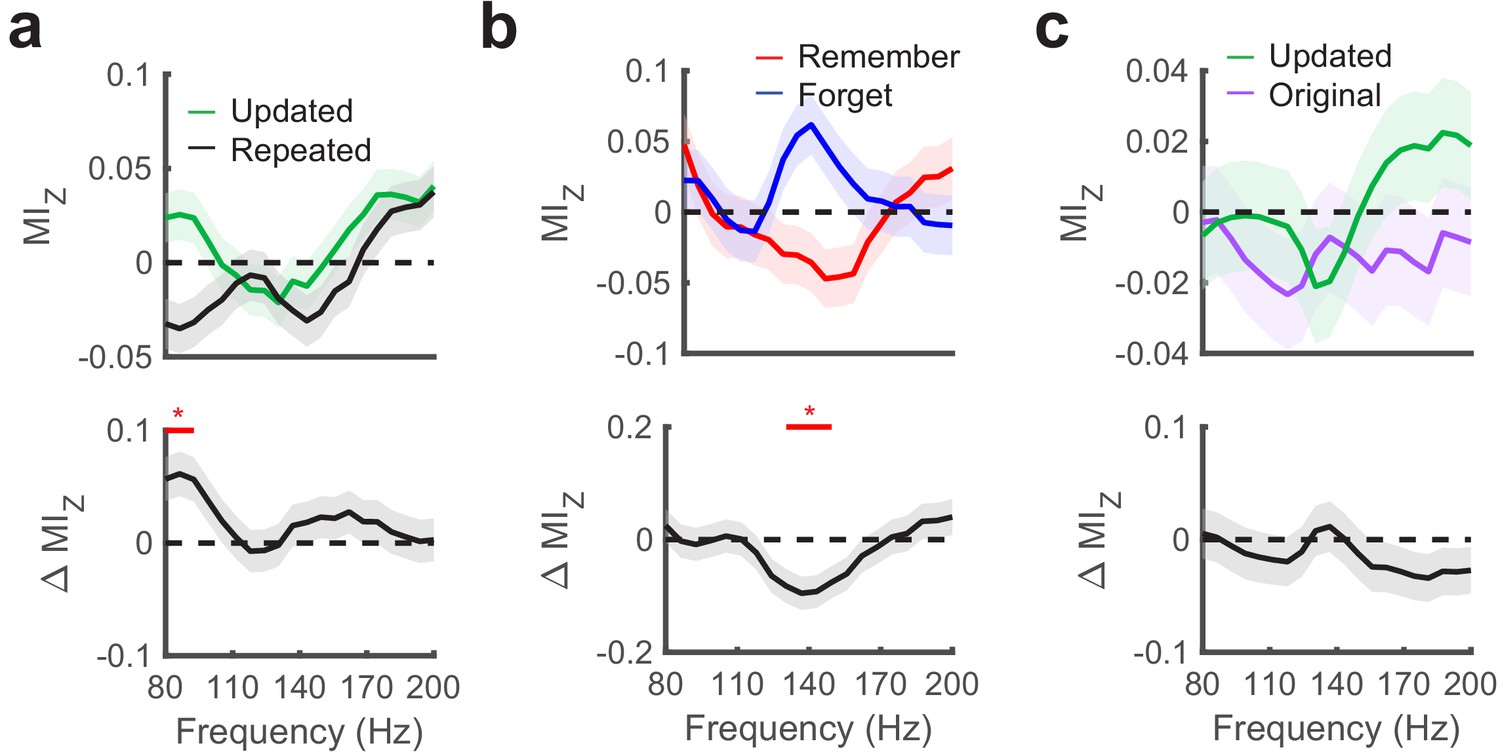
Hippocampal phase amplitude coupling predicts novelty detection and memory updating.
(a) Top, post-saccade changes in PAC following (−50 ms to 750 ms) fixations to updated and repeated object-locations are displayed for a range of gamma amplitudes. Below, significant (PFWE < 0.05, nonparametric cluster corrected) increases in PAC related to novelty are indicated. (b) Theta to gamma PAC during (−50 ms to 750 ms) fixations to updated object-locations varies with memory outcome. A significant (PFWE < 0.05, nonparametric cluster corrected), negative subsequent memory effects is depicted in the bottom panel. (c) PAC did not differ in the moments leading up to (−750 ms to 50 ms) fixations to updated and original object-locations during Mismatch trials. List of Tables.
-
Figure 6—source data 1
MATLAB code and source files to reproduce data in Figure 6.
- https://cdn.elifesciences.org/articles/52108/elife-52108-fig6-data1-v1.zip
Author response image 1

Mean event related potentials (ERPs) across all patients and electrodes.
Shaded regions indicate SEM.
Tables
Table 1
Task-related eye movement behavior.
| Mismatch | Match | |||||
|---|---|---|---|---|---|---|
| Original | Updated | Other | Repeated | Other | Other | |
| Fixations per trial (N) | 2.4 (0.3) | 4.6 (0.4) | 1.4 (0.3) | 5.3 (0.4) | 1.7 (0.4) | 1.4 (0.3) |
| Fixation SME (t) | 1.4 | −4.6* | −0.3 | 3.7* | −0.4 | −1.7 |
| Fixation duration (ms) | 210 (11) | 388 (59) | 212 (14) | 342 (39) | 199 (11) | 206 (6) |
| Duration SME (t) | 0.5 | 1.1 | 1.4 | −1.6 | −2.4 | −0.6 |
-
Group-level description of eye movement behavior to six viewing regions of interest. The subsequent memory effect (SME) for each measure was assessed by a one-sample t-test, across subjects (n = 5). *P < 0.05. Parentheses denote standard error of the mean.
Table 2
Proportion of electrodes showing theta (4 to 6 Hz) oscillations.
| Pre fixation | Post fixation | ||||||
|---|---|---|---|---|---|---|---|
| N | Original | Updated | Repeated | Original | Updated | Repeated | |
| S1 | 8 | 0.75* | 0.75* | 0.38* | 0.25 | 0.5* | 0.5* |
| S2 | 4 | 0 | 0.25 | 0.75* | 0 | 0.5 | 0.75* |
| S3 | 6 | 1.0* | 1.0* | 1.0* | 0.67* | 1.0* | 1.0* |
| S4 | 8 | 1.0* | 1.0* | 1.0* | 1.0* | 1.0* | 1.0* |
| S5 | 6 | 0.83* | 0.83* | 0.83* | 0.5* | 0.67* | 0.67* |
| Group | 32 | 0.78* | 0.81* | 0.78* | 0.53* | 0.75* | 0.78* |
-
Proportion of electrodes showing significant theta oscillations, before (Pre, −750 to 50 ms) and after (Post, −50 to 750 ms) fixations to locations of interest. p-Values were computed using a binomial test, based on the total number of electrodes (N) for a subject or group. *p < 0.05, Bonferroni corrected across locations and time intervals.
Table 3
Proportion of electrodes showing significant theta phase-locking effects
| N | Retrieval | Associative novelty | Subsequent memory | |
|---|---|---|---|---|
| S1 | 8 | 0.13 | 0.5* | 0.63* |
| S2 | 4 | 0 | 0.75* | 0.5* |
| S3 | 6 | 0.5* | 0.5* | 0.33 |
| S4 | 8 | 0.5* | 0.75* | 0.75* |
| S5 | 6 | 0.5* | 0.33 | 0.33 |
| Group | 32 | 0.34* | 0.56* | 0.53* |
-
Proportion of electrodes showing significant phase-locking effects. p-Values were computed using a binomial test, based on the total number of electrodes (N) for a subject or group. *p < 0.05, Bonferroni corrected across three conditions.
Table 4
Proportion of electrodes showing changes in PAC due to theta waveform properties while viewing all objects during refresh.
| N | Power | Sin(θ) | Cos(θ) | Speak | STrough | Asym | Full | |
|---|---|---|---|---|---|---|---|---|
| S1 | 8 | 0 | 0.13 | 0 | 0 | 0.13 | 0 | 0.13 |
| S2 | 4 | 0.50* | 0 | 0 | 0.25 | 0 | 0 | 0 |
| S3 | 6 | 0 | 0.33 | 0 | 0 | 0 | 0 | 0.17 |
| S4 | 8 | 0.25 | 0.13 | 0 | 0 | 0 | 0.25 | 0.13 |
| S5 | 6 | 0.17 | 0.17 | 0 | 0.17 | 0.17 | 0.17 | 0.17 |
| Group | 32 | 0.16 | 0.16 | 0 | 0.06 | 0.06 | 0.09 | 0.13 |
-
Proportion of electrodes showing significant modulation of PAC by properties of theta, including power, single-trial measures of phase-locking, peak and trough sharpness, and waveform asymmetry. Each column denotes the parameters included in each regression. Model significance was determined with the F-statistic. *p < 0.05, Bonferroni corrected across seven tests.
Table 5
Proportion of electrodes showing changes in PAC due to theta waveform properties while viewing Mismatch objects.
| N | Power | Sin(θ) | Cos(θ) | SPeak | STrough | Asym | Full | |
|---|---|---|---|---|---|---|---|---|
| S1 | 8 | 0.25 | 0 | 0.13 | 0 | 0.13 | 0.38* | 0.13 |
| S2 | 4 | 0 | 0.25 | 0.25 | 0.25 | 0 | 0 | 0.25 |
| S3 | 6 | 0.33 | 0 | 0 | 0 | 0 | 0.17 | 0 |
| S4 | 8 | 0.13 | 0 | 0 | 0 | 0.25 | 0.13 | 0 |
| S5 | 6 | 0.33 | 0.17 | 0 | 0 | 0 | 0 | 0.17 |
| Group | 32 | 0.22* | 0.06 | 0.06 | 0.03 | 0.09 | 0.16 | 0.09 |
-
Proportion of electrodes showing significant modulation of PAC by properties of theta, including power, single-trial measures of phase-locking, peak and trough sharpness, and waveform asymmetry. Each column denotes the parameters included in each regression. Model significance was determined with the F-statistic. *p < 0.05, Bonferroni corrected across seven tests.
Table 6
Subject demographics.
| S1 | S2 | S3 | S4 | S5 | |
|---|---|---|---|---|---|
| Age (years) | 20 | 34 | 53 | 25 | 44 |
| Sex | M | M | M | F | F |
| Full-scale IQ | 94 | 109 | 105 | 121 | 92 |
| Implanted Hemisphere | Left | Left | Right | Left | Left |
| Epileptic Focus | Basal temporal | Basal temporal | Middle hippocampus | Basal temporal | Amygdala |
| Etiology | Cortical dysplasia | Dysembryoplastic neuroepithelial tumor | Focal cortical dysplasia | Low grade glioma | Mesial temporal sclerosis |
| Duration of epilepsy (years) | 10 | 10 | 8 | 3 | 41 |
| Hippocampal contacts (n) | 8 | 4 | 6 | 7 | 6 |
Additional files
-
Supplementary file 1
Number of fixations for each comparison of interest.
- https://cdn.elifesciences.org/articles/52108/elife-52108-supp1-v1.docx
-
Transparent reporting form
- https://cdn.elifesciences.org/articles/52108/elife-52108-transrepform-v1.docx
Download links
A two-part list of links to download the article, or parts of the article, in various formats.
Downloads (link to download the article as PDF)
Open citations (links to open the citations from this article in various online reference manager services)
Cite this article (links to download the citations from this article in formats compatible with various reference manager tools)
Hippocampal theta coordinates memory processing during visual exploration
eLife 9:e52108.
https://doi.org/10.7554/eLife.52108


