Cryo-EM structure of the KvAP channel reveals a non-domain-swapped voltage sensor topology
- The Rockefeller University, Howard Hughes Medical Institute, United States
Figures
Figure 1
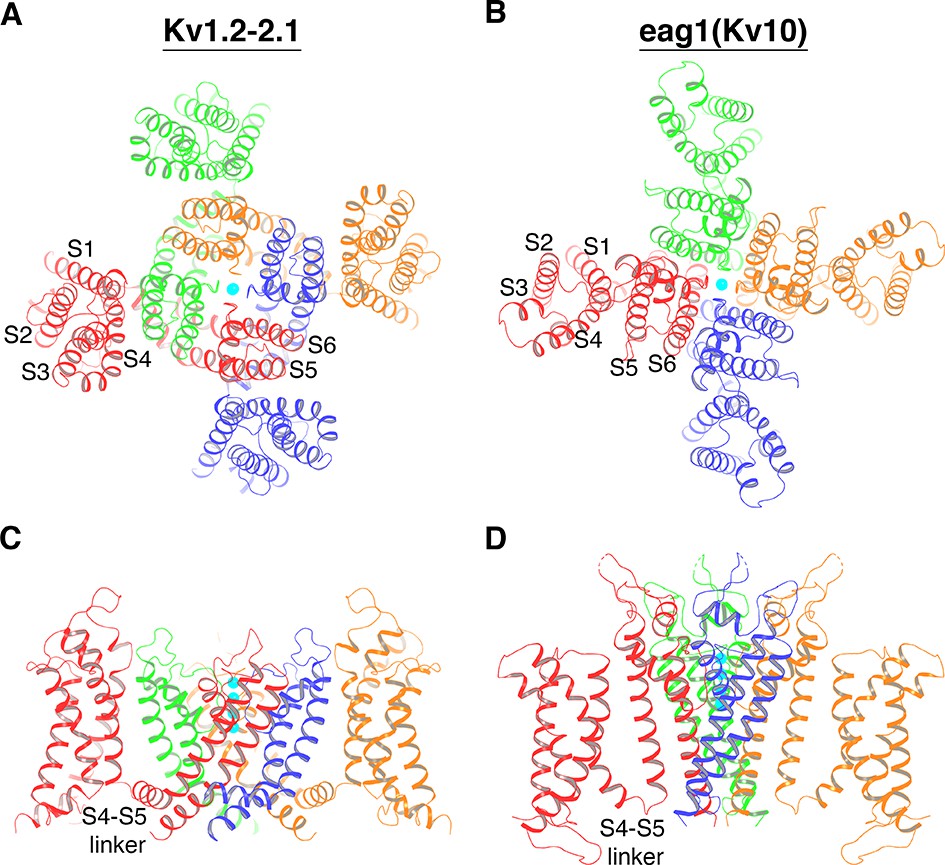
Two distinct topological connections between the voltage sensors and the ion channel pore exemplified by Kv1.2–2.1 paddle chimera (PDB: 2R9R) (A, C) and eag1 (Kv10) (PDB: 5K7L) (B, D) channel, viewed along the 4-fold axis from the extracellular side (A, B) or parallel to the membrane with the extracellular side up (C, D).
The channels are shown as ribbons and each subunit of a tetramer is colored uniquely. In panels C and D, voltage sensors of the front and back subunit are omitted for clarity. K+ ions are shown as cyan spheres.
Figure 2 with 5 supplements
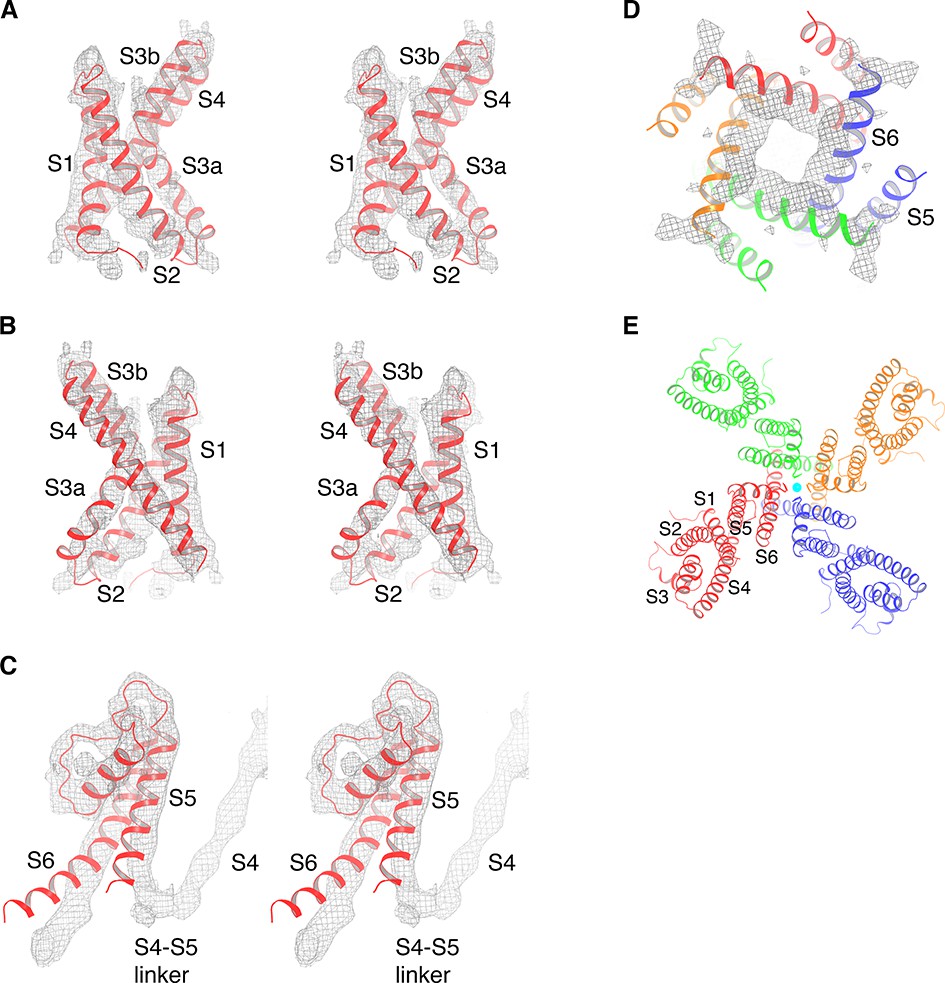
Cryo-EM map of KvAP and model generation.
(A) The isolated KvAP voltage sensor crystal structure (PDB: 1ORS, shown as red ribbons) docked into the cryo-EM map (gray mesh), viewed in stereo, parallel to the membrane with the extracellular side up. (B) Same representation as panel (A), rotated 180° around the vertical axis. (C) The pore domain of a single subunit from the crystal structure of the full-length KvAP (PDB: 1ORQ, shown as red ribbons) docked into the cryo-EM map (gray mesh), viewed in stereo, parallel to the membrane with the extracellular side up. (D) The pore domain of the full-length KvAP crystal structure (PDB: 1ORQ, shown as ribbons with each subunit colored uniquely) docked into the cryo-EM map (gray mesh), viewed from the cytoplasmic side. (E) Overall structure of KvAP, viewed along the 4-fold axis, from the extracellular side. The channel is shown as ribbons and each subunit of the tetramer is colored uniquely. K+ ions are shown as cyan spheres.
Figure 2—figure supplement 1
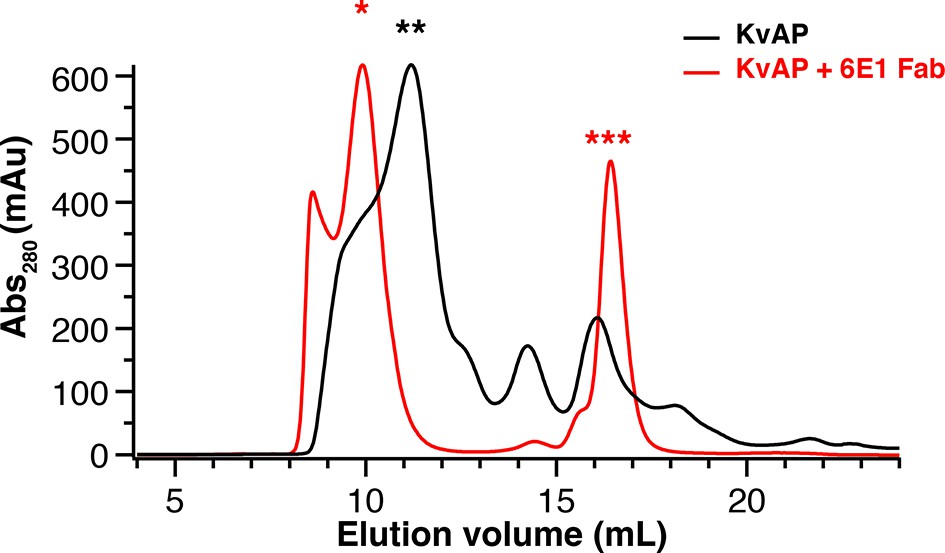
Purification of KvAP-Fab complex.
Size exclusion chromatography of KvAP alone (black trace) and KvAP-6E1 Fab (red trace). The three peaks indicated by the stars above represent KvAP-6E1 Fab complex (red *), KvAP alone (black **) and Fab alone (red ***).
Figure 2—figure supplement 2
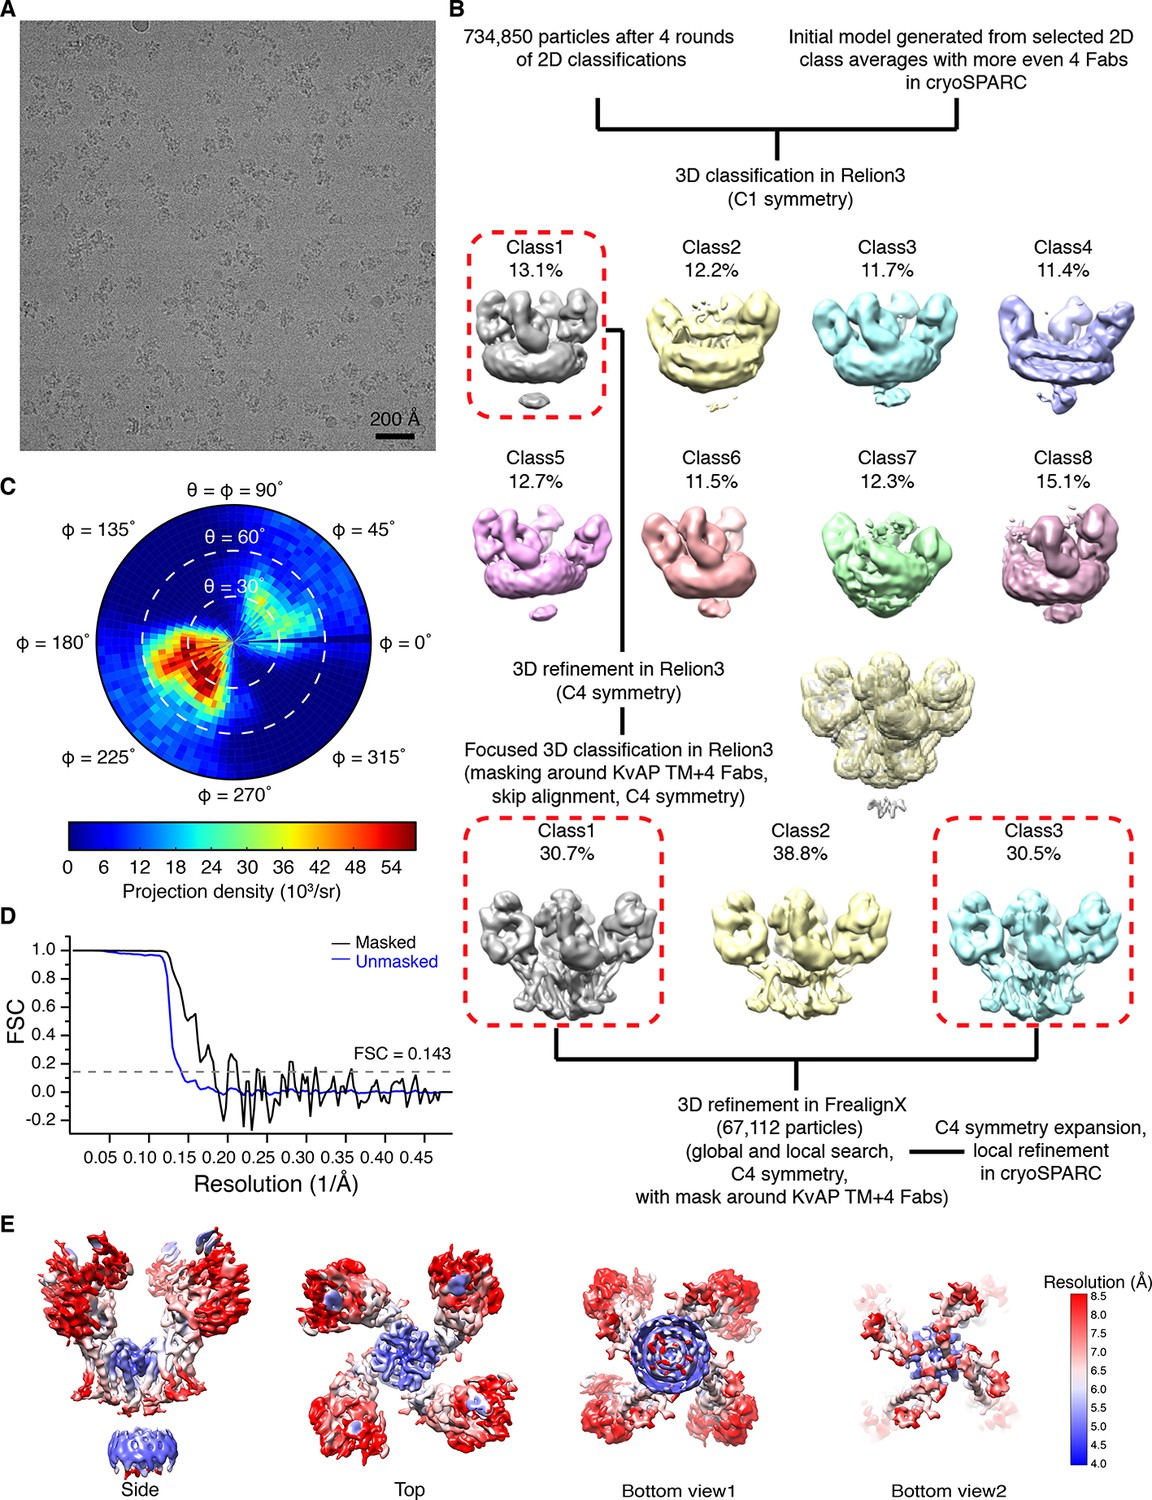
Structure determination of KvAP using cryo-EM.
(A) Representative raw micrograph. (B) Summary of image processing. (C) Euler angle distribution of particles for the final 3D reconstruction. (D) Fourier shell correlation (FSC) curves between the two half maps before (blue) and after (black) postprocessing. (E) Local resolution of the final reconstruction estimated by cryoSPARC (Punjani et al., 2017).
Figure 2—figure supplement 3
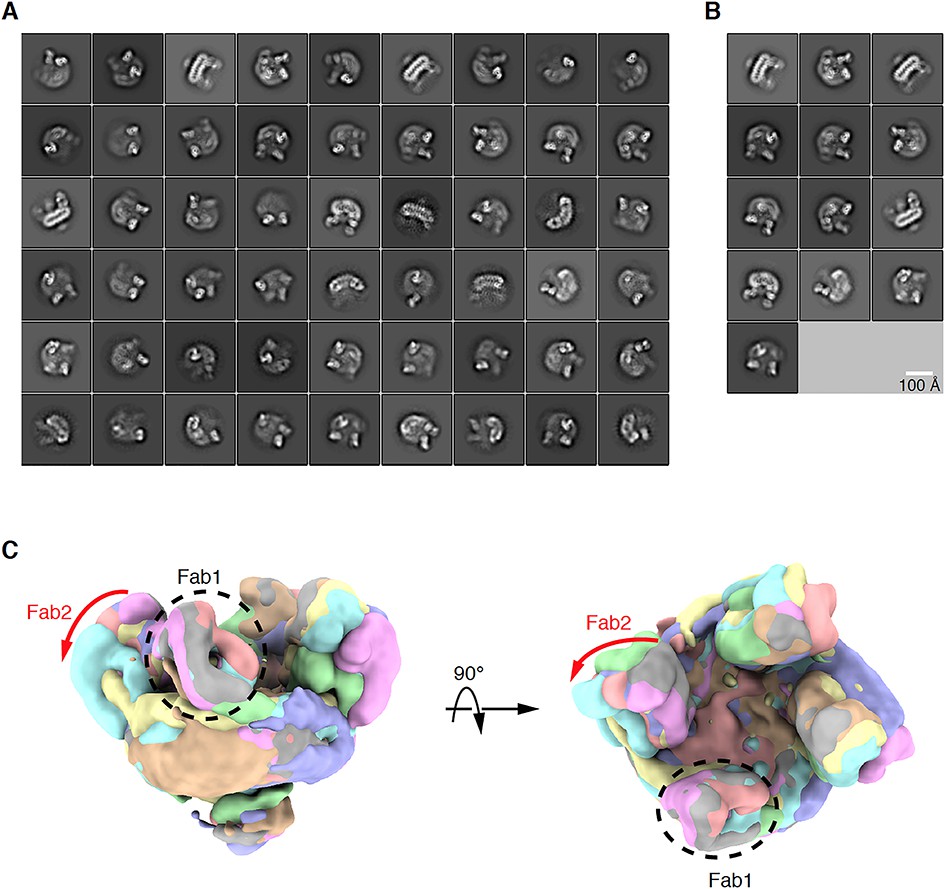
Positional variability of the Fabs.
(A) 2D class averages of all the particles after removing false positives. (B) 2D class averages of the particles used for initial model generation. (C) Overlay of the eight classes after first round of 3D classification showed variation in Fab orientation.
Figure 2—figure supplement 4
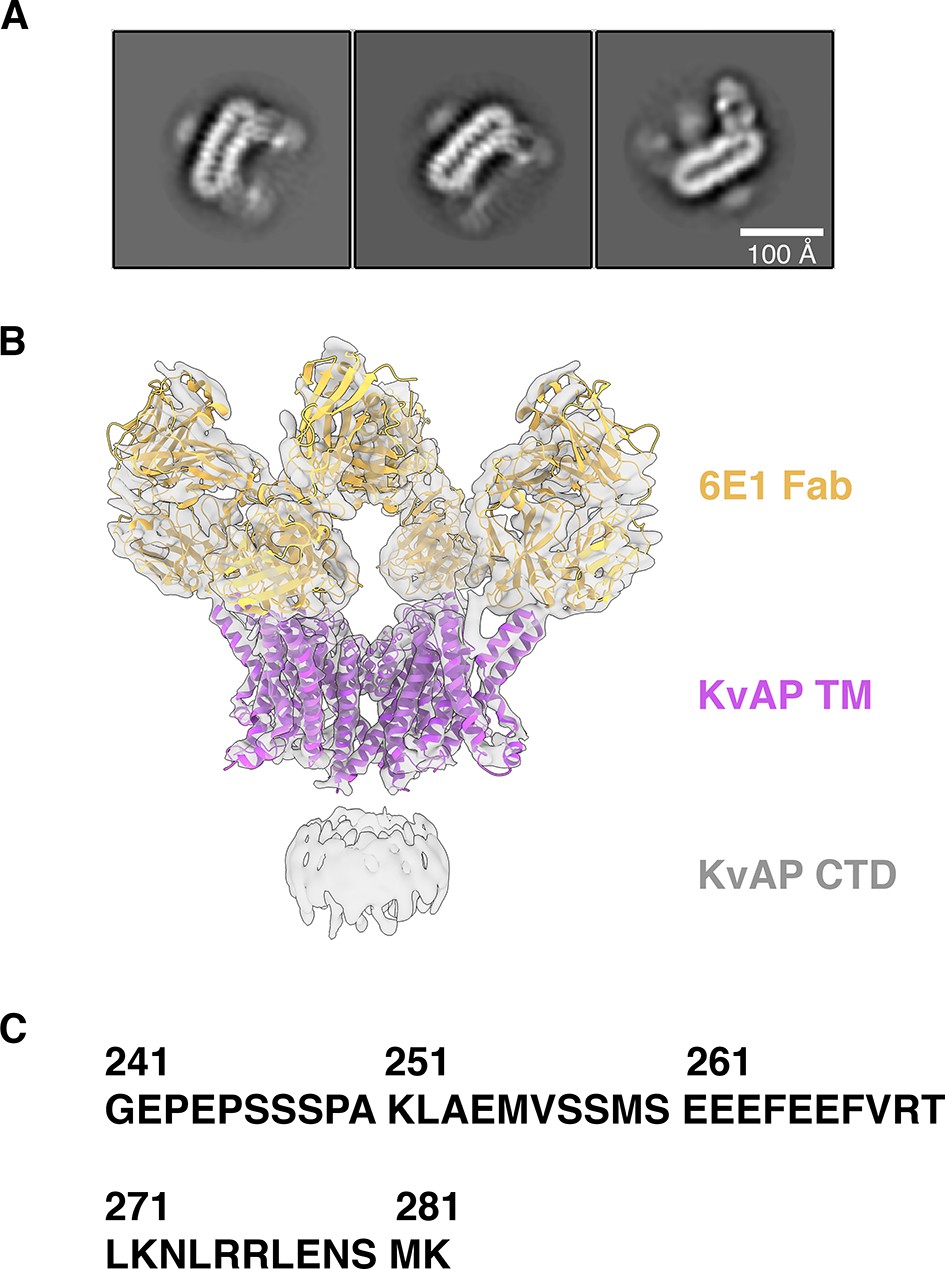
Cryo-EM density map of KvAP reveals the presence of a cytoplasmic domain (CTD).
(A) 2D class averages showing the presence of a cytoplasmic domain. (B) The final 3D reconstruction (gray) with KvAP (purple ribbons) and Fab (gold ribbons) models docked into the density. (C) The amino acid sequence of the cytoplasmic domain.
Figure 2—figure supplement 5
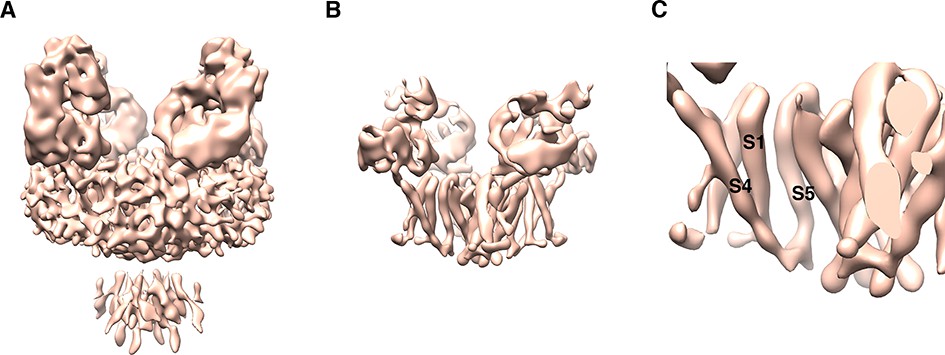
Cryo-EM map from Relion at earlier processing stages.
(A) Postprocessed 3D cryo-EM map in Relion at a nominal resolution of 8 Å. Threshold is set at a relatively low level to show the micelle, CTD and Fab density, viewed parallel to the membrane with the extracellular side up. (B) The same map with threshold set at a much higher level shows clear non-domain-swapped S4-S5 linker density. (C) Zoomed-in view of panel (B).
Figure 3

Comparison of KvAP and eag1 structures.
(A) Overlay of KvAP (colored red) and eag1 (PDB: 5K7L, colored blue), viewed along the 4-fold axis, from the extracellular side. The two channels are aligned with respect to the pore domain (shown as Cα traces) and the VSDs are shown as surfaces. For eag1, only the transmembrane region is shown for clarity. (B) Ribbon representation of a single subunit of KvAP, viewed in stereo, parallel to the membrane with the extracellular side up. (C) Ribbon representation of a single subunit of eag1, viewed in stereo, parallel to the membrane with the extracellular side up. Only the transmembrane region is shown for clarity.
Figure 4
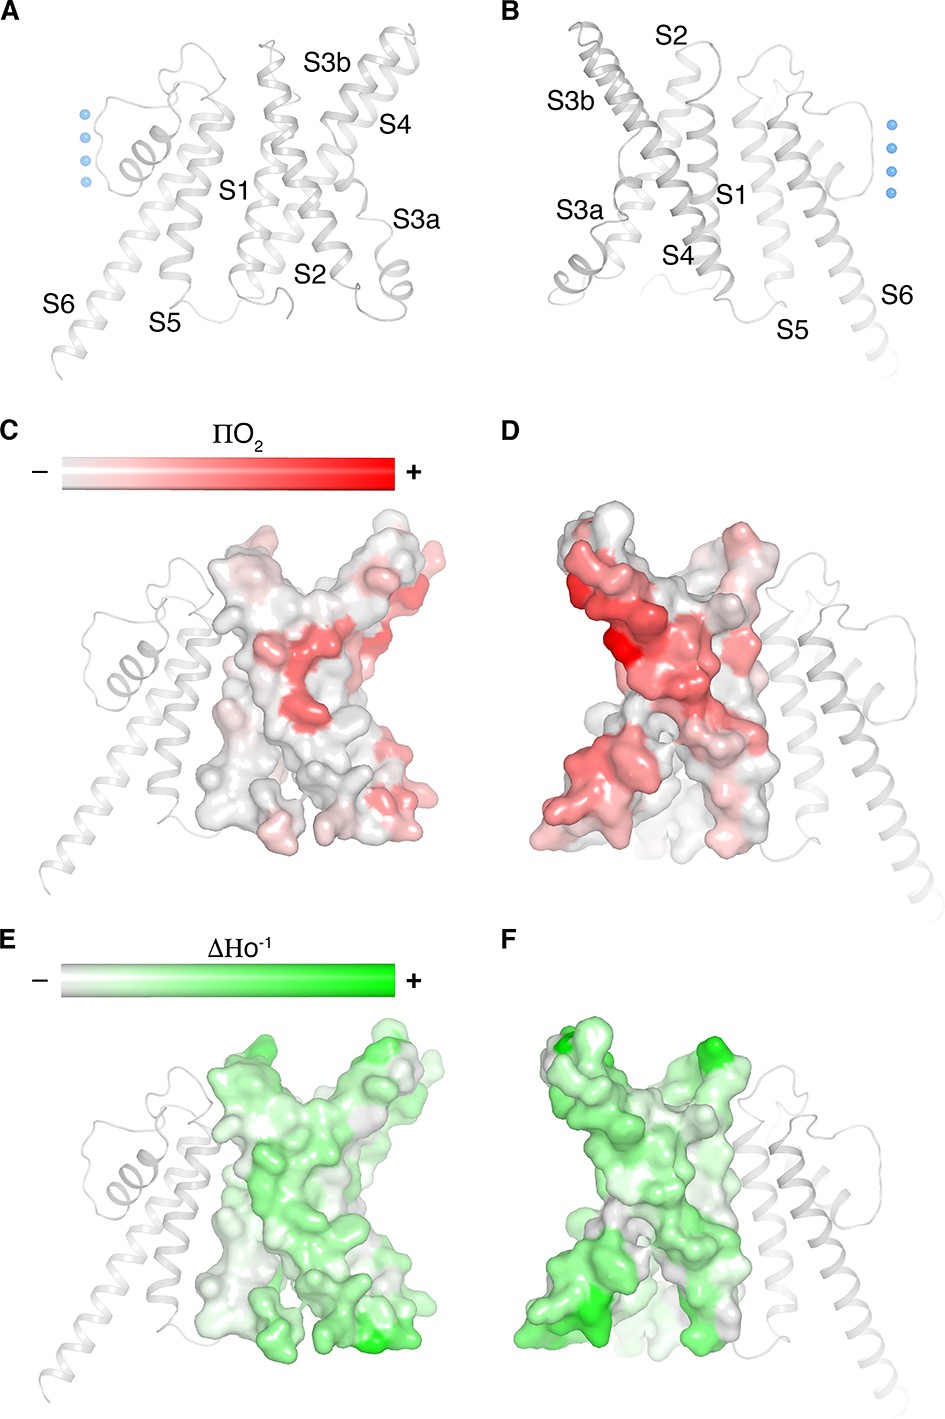
Cryo-EM structure of KvAP is consistent with the EPR data in lipid vesicles.
(A,B) Ribbon representation of a single subunit of KvAP, viewed parallel to the membrane with the extracellular side up. Panel B is rotated 180° from panel A around a vertical axis. (C–F) Remapping of EPR data digitized from Cuello et al. (2004) onto a single subunit of KvAP (pore domain as gray ribbons, voltage sensor domain as gray surface) in the same views as panels A and B (Cuello et al., 2004). Panels C and D show the O2 accessibility (red) and panels E and F show the mobility (green) from reconstituted full-length KvAP.
Figure 5 with 2 supplements
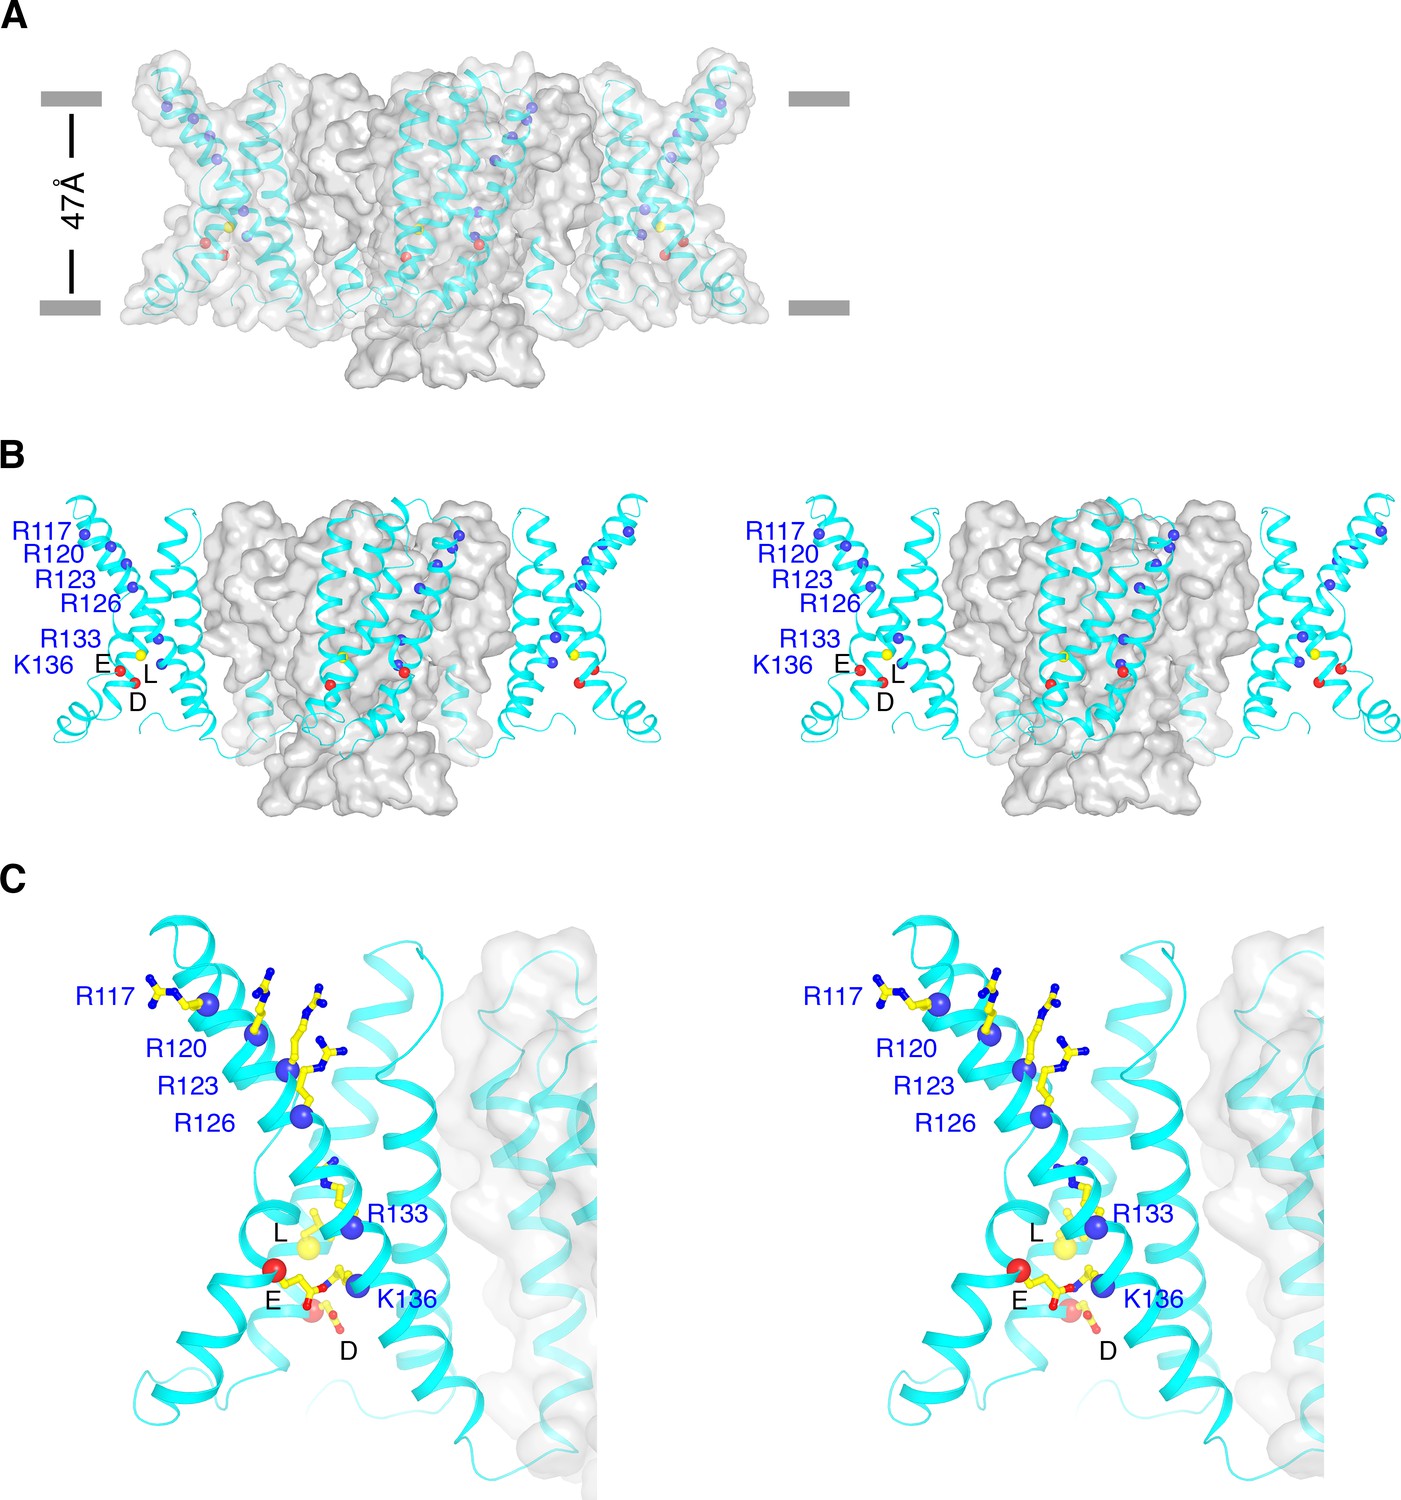
Conformational state of KvAP.
(A) Overall structure of KvAP viewed parallel to the membrane with the extracellular side up. The channel is demarcated by a gray translucent surface and voltage sensors, S4-S5 linkers and intracellular part of S5 are shown as cyan ribbons. Blue spheres show Cα positions of the six positive-charged residues on S4: R117, R120, R123, R126, R133 and K136 from top to bottom. Yellow and two red spheres indicate Cα positions of the gating charge transfer center (yellow: Leu69; Red: Asp72 and Glu93). Gray bars approximate the location of membrane surfaces. (B) Stereo view of KvAP in the same orientation as in panel (A), with the pore domain shown as a gray surface and the voltage sensor domains, the S4-S5 linkers and the intracellular part of S5 as cyan ribbons. (C) Zoomed-in view of one voltage sensor in the same representation as panel (B). Side-chains of the six positive-charged residues as well as the gating charge transfer center are shown as sticks and colored according to atom type.
Figure 5—figure supplement 1
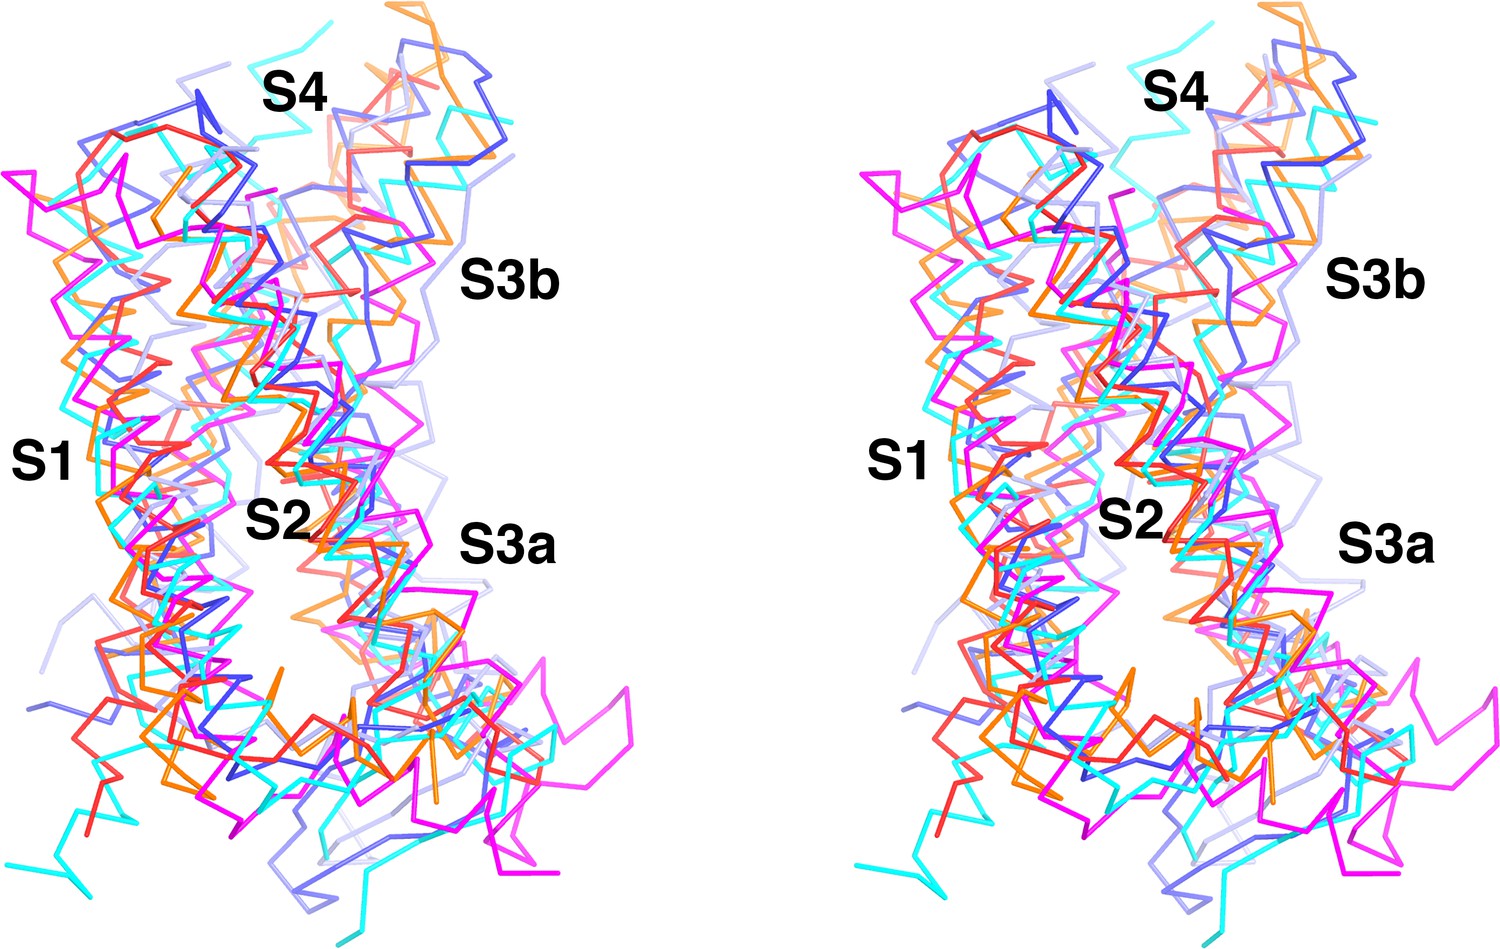
KvAP voltage sensor domain conformation is very similar to other depolarized VSDs.
Overlay of voltage sensor domains from KvAP (red), eag1 (Kv10.1, PDB: 5K7L, blue), Herg (Kv11.1, PDB: 5VA1, light purple), HCN (PDB: 5U6O, cyan), Kv1.2-Kv2.1 paddle chimera (PDB: 2R9R, orange) and Kv7.1 (PDB: 5VMS, magenta) in stereo view.
Figure 5—figure supplement 2
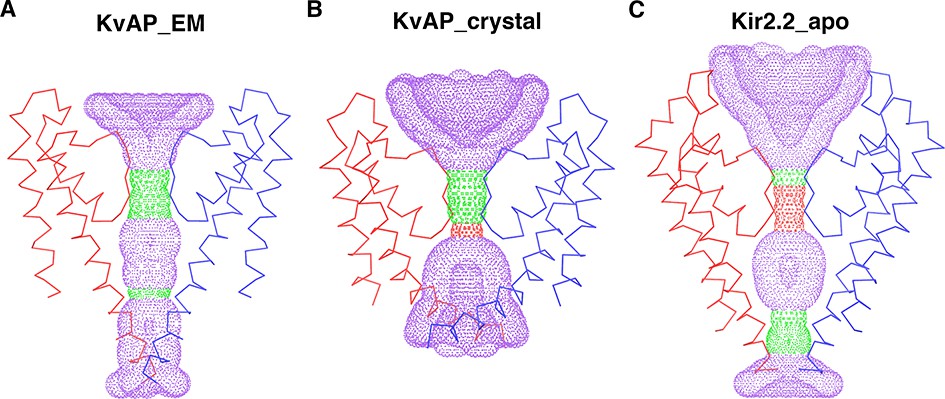
The central conduction pore of the cryo-EM structure of (A) KvAP (KvAP_EM), (B) the crystal structure of KvAP (KvAP_crystal, PDB: 1ORQ), and (C) the Kir2.2 apo crystal structure (Kir2.2_apo, PDB: 3JYC), generated with Hole (Smart et al., 1996).
The channels are shown as Cα traces and only two opposing subunits (colored blue and red) are shown for clarity. The cytoplasmic region of Kir2.2 is omitted.
Figure 6 with 1 supplement

Remapping of biotin-avidin accessibility data onto the KvAP cryo-EM structure.
Previous data on tethered biotin-avidin accessibility with 1 Å effective tether length is remapped onto the cryo-EM structure of KvAP (Ruta et al., 2005; Banerjee and MacKinnon, 2008). Only two opposing subunits (gray and orange ribbons) are shown for clarity. Red and blue spheres represent positions accessible to the extracellular and intracellular sides of the membrane, respectively. Black spheres represent positions inaccessible to either side of the membrane.
Figure 6—figure supplement 1

Remapping biotin-avidin accessibility data onto the KvAP cryo-EM structure.
(A,B) Remapping previous data on tethered biotin-avidin accessibility with 9–10 Å (panel A) and 17 Å (panel B) effective tether lengths onto the cryo-EM structure of KvAP (Ruta et al., 2005; Banerjee and MacKinnon, 2008). Only two opposing subunits (gray and orange ribbons) are shown for clarity. Red and blue spheres represent positions accessible to the extracellular and intracellular sides of the membrane, respectively. Black spheres represent positions inaccessible to either side of the membrane. Yellow spheres represent positions accessible to both sides of the membrane.
Tables
Key resources table
| Reagent type (species) or resource | Designation | Source or reference | Identifiers | Additional information |
|---|---|---|---|---|
| Gene (Aeropyrum pernix) | KvAP | synthetic | Synthesized at GeneWiz. | |
| Recombinant DNA reagent | pET28a | Novagen | 69864 | |
| Strain, strain background (Escherichia coli) | BL21(DE3) | Invitrogen | C600003 | |
| Chemical compound, drug | 2,2-didecylpropane-1,3-bis-β-D-maltopyranoside (LMNG) | Anatrace | NG310 | |
| Chemical compound, drug | Cholesteryl hemisuccinate (CHS) | Anatrace | CH210 | |
| Chemical compound, drug | Digitonin | Sigma-Aldrich | D141 | |
| Antibody | anti-KvAP (mouse monoclonal, Fab) | DOI: 10.1038/nature01580 | 6E1 | KvAP teramer: 6E1 Fab = 1: 4.4 molar ratio |
| Commercial assay or kit | Talon metal affinity resin | Clontech | 635504 | |
| Commercial assay or kit | Superdex 200 Increase 10/300 GL | GE Healthcare Life Sciences | 28990944 | |
| Commercial assay or kit | R1.2/1.3 400 mesh Au holey carbon grids | Quantifoil | 1210627 | |
| Software, algorithm | SerialEM | DOI: 10.1016/j.jsb.2005.07.007 | http://bio3d.colorado.edu/SerialEM | |
| Software, algorithm | MotionCor2 | DOI: 10.1038/nmeth.4193 | https://msg.ucsf.edu/software | |
| Software, algorithm | Gctf | DOI: 10.1016/j.jsb.2015.11.003 | https://www.mrc-lmb.cam.ac.uk/kzhang/ | |
| Software, algorithm | Gautomatch | other | https://www.mrc-lmb.cam.ac.uk/kzhang/ | |
| Software, algorithm | RELION-3 | DOI: 10.7554/eLife.18722 | http://www2.mrc-lmb.cam.ac.uk/relion | |
| Software, algorithm | cryoSPARC | DOI: 10.1038/nmeth.4169 | http://www.cryosparc.com | |
| Software, algorithm | FrealignX | DOI: 10.1016/j.jsb.2013.07.005 | http://grigoriefflab.janelia.org/frealign | |
| Software, algorithm | COOT | DOI: 10.1107/S0907444910007493 | https://www2.mrc-lmb.cam.ac.uk/personal/pemsley/coot/ | |
| Software, algorithm | PHENIX | DOI: 10.1107/S2059798318006551 | https://www.phenix-online.org | |
| Software, algorithm | UCSF Chimera | DOI: 10.1002/jcc.20084 | https://www.cgl.ucsf.edu/chimera | |
| Software, algorithm | Pymol | PyMOL Molecular Graphics System, Schrödinger, LLC | http://www.pymol.org | |
| Software, algorithm | HOLE | DOI: 10.1016/s0263-7855(97)00009-x | http://www.holeprogram.org |
Additional files
Download links
A two-part list of links to download the article, or parts of the article, in various formats.
Downloads (link to download the article as PDF)
Open citations (links to open the citations from this article in various online reference manager services)
Cite this article (links to download the citations from this article in formats compatible with various reference manager tools)
Cryo-EM structure of the KvAP channel reveals a non-domain-swapped voltage sensor topology
eLife 8:e52164.
https://doi.org/10.7554/eLife.52164


