Fatal amyloid formation in a patient’s antibody light chain is caused by a single point mutation
- Center for Integrated Protein Science Munich at the Department Chemie, Technische Universität München, Germany
- Center for Integrated Protein Science Munich at the Department Physik, Technische Universität München, Germany
- Medical Department V, Amyloidosis Center, University of Heidelberg, Germany
- Institute of Human Genetics, University of Heidelberg, Germany
Figures
Figure 1 with 3 supplements
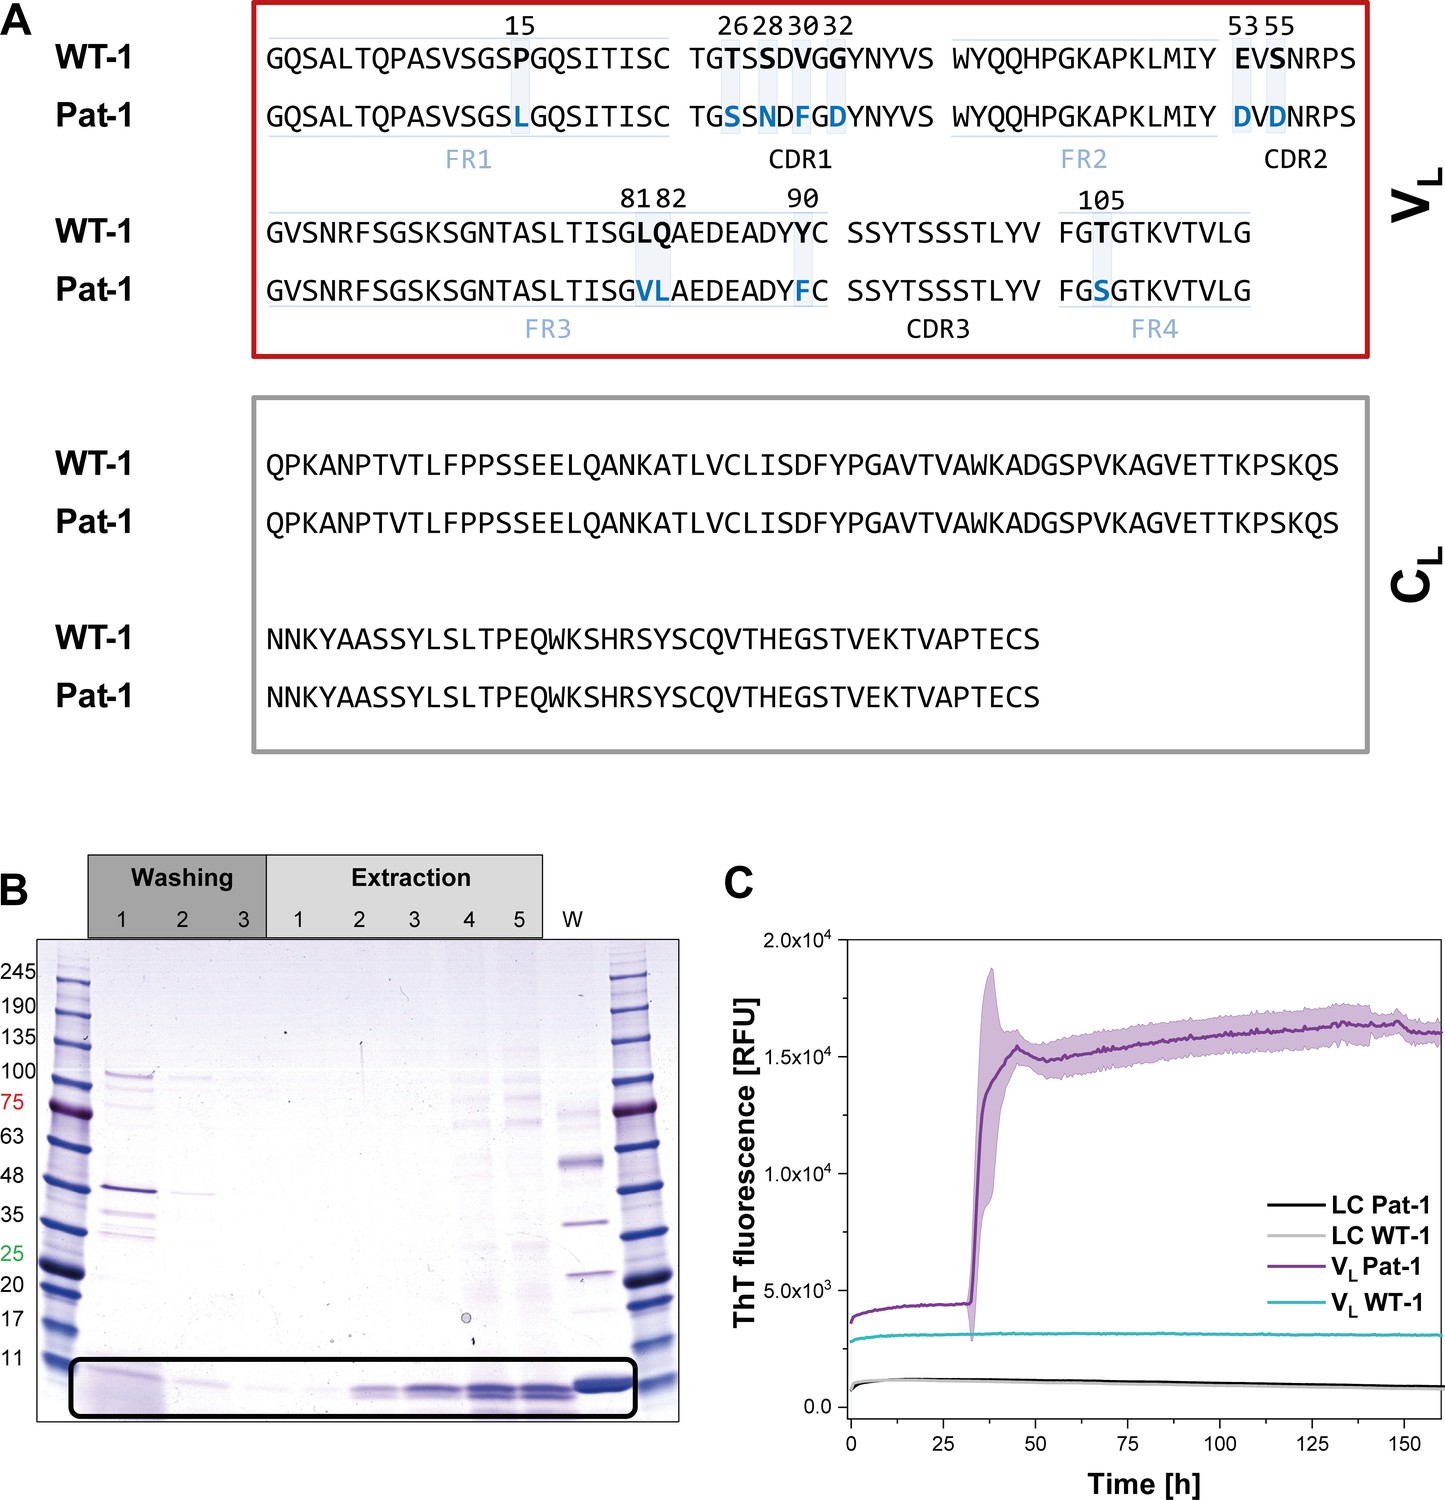
Identification of the VL domain as predominant fragment for fibrillation in the patient.
(A) Sequence alignment of the patient-derived Pat-1 LC with the corresponding germline WT-1. The Pat-1 sequence was obtained cDNA sequencing of the disease-causing bone marrow plasma cells, the WT-1 sequence was obtained by sequence comparison in Ig BLAST and abYsis. The VL and CL domain is surrounded by a red and gray box, respectively. The VL’s FRs and, CDRs were defined by Ig BLAST. The 11 point mutations are depicted in blue boxes. (B) Fibril extraction from abdominal fat tissue of the patient revealed the predominant deposition of LC truncations containing mostly the VL domain in the patient’s fibrils. The black box indicates the band of the VL domain at ~11 kDa. The first three steps correspond to washing steps, the next five to extraction steps, the last lane named ‘W’ corresponds to an initial tissue wash. (C) ThT fluorescence of the LC and VL domains of Pat-1 and WT-1 monitored over time. An increase in fluorescence indicates fibril formation. The assay was performed in PBS buffer containing 0.5 mM SDS at 37°C and shaking. The continuous lines show the mean value of triplicates with SD as transparent coloured background.
Figure 1—figure supplement 1
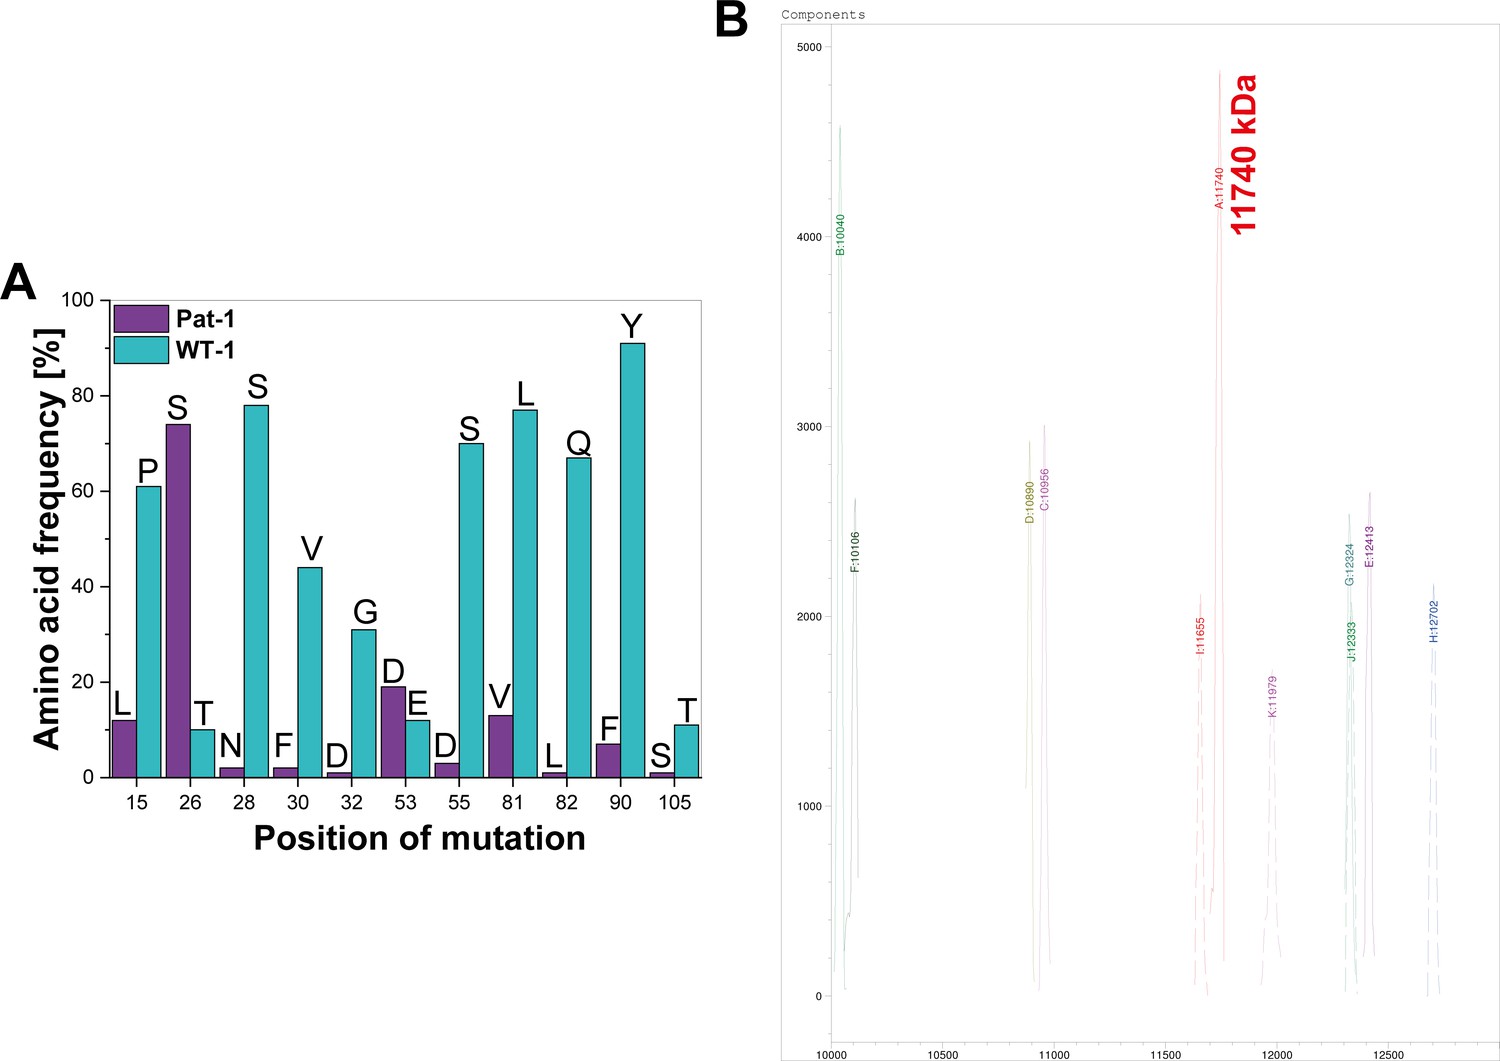
Analysis of sequence mutations and sequence truncation.
(A) Frequency of amino acids at the mutated positions of Pat-1 and WT-1. The frequency of the specific amino acid in the germline is shown in cyan, the corresponding residue in the patient mutant in purple. Calculation of frequencies was performed using the abYsis database. (B) Mass Spectrometry Analysis of fibril extraction from patient abdominal fat tissue. A mass of 11,740 Da was detected for the predominant species. Source data for the Kabat numbering can be found in Figure 1—figure supplement 1— source data 1.
-
Figure 1—figure supplement 1—source data 1
Frequencies of amino acids at the specific positions in WT-1 and Pat-1 according to the Kabat numbering scheme.
- https://cdn.elifesciences.org/articles/52300/elife-52300-fig1-figsupp1-data1-v1.xlsx
Figure 1—figure supplement 2
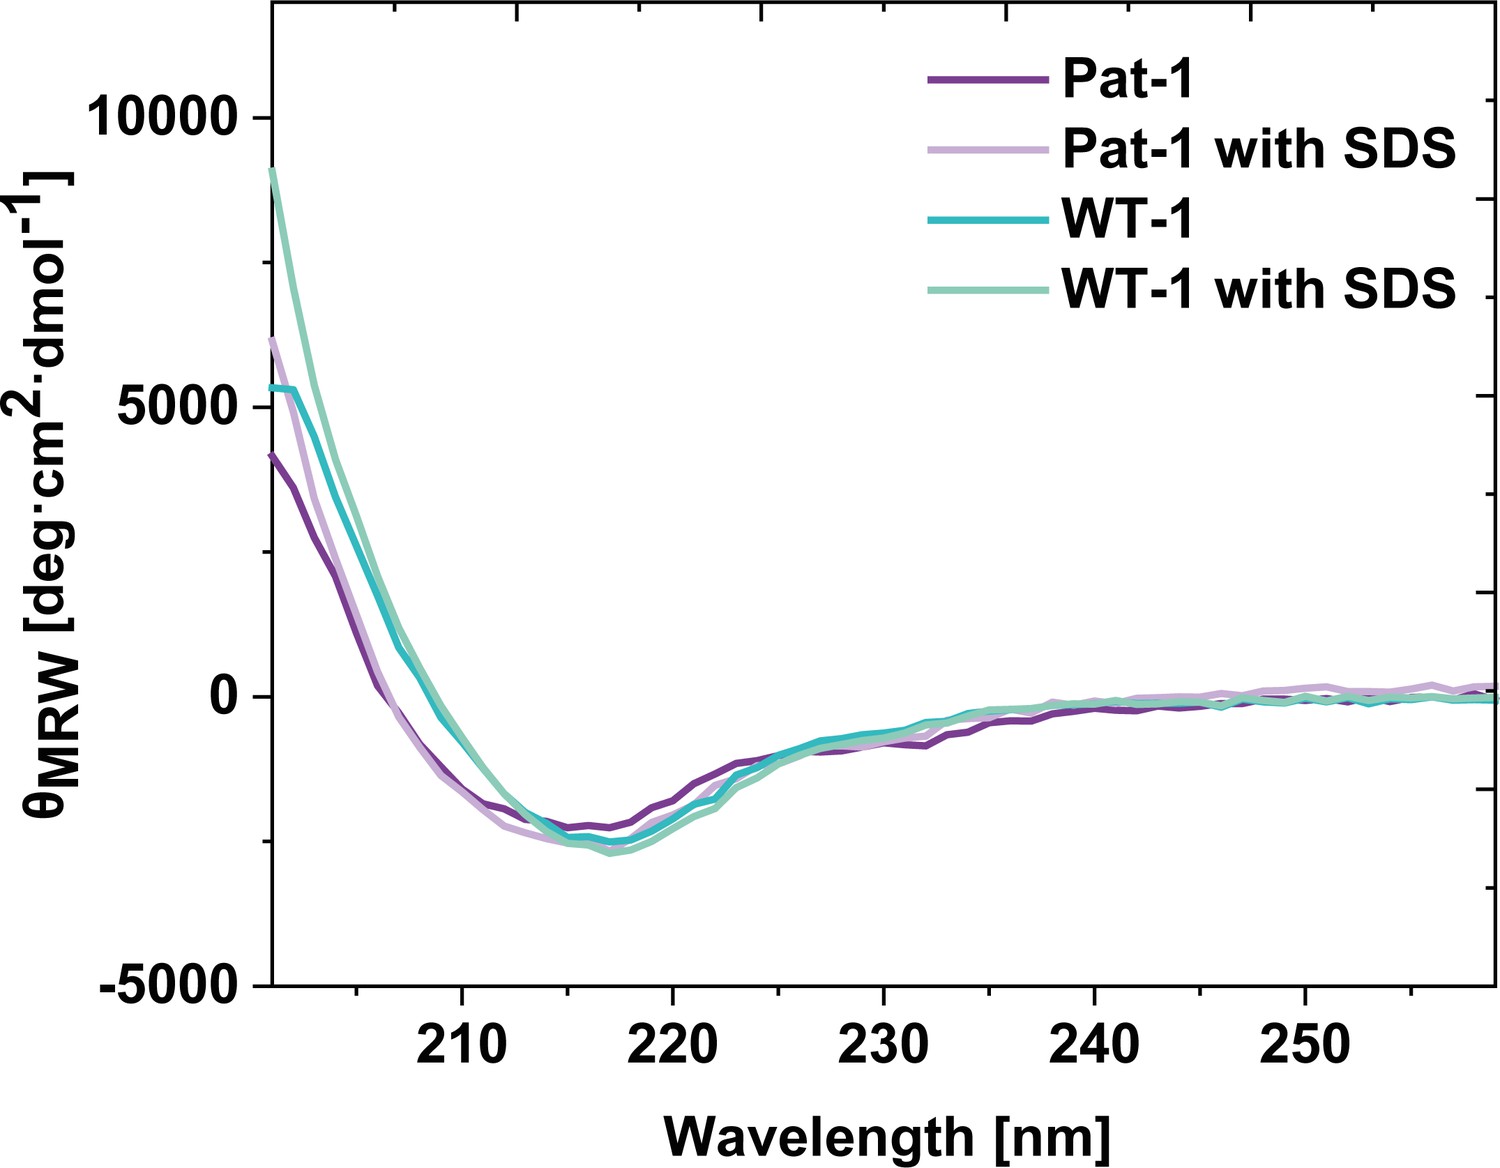
Comparison of far UV CD-spectra of Pat-1 and WT-1 with and without 0.5 mM SDS.
Far UV spectra were obtained at protein concentrations of 10 µM at 37°C in PBS buffer with or without 0.5 mM SDS.
Figure 1—figure supplement 3
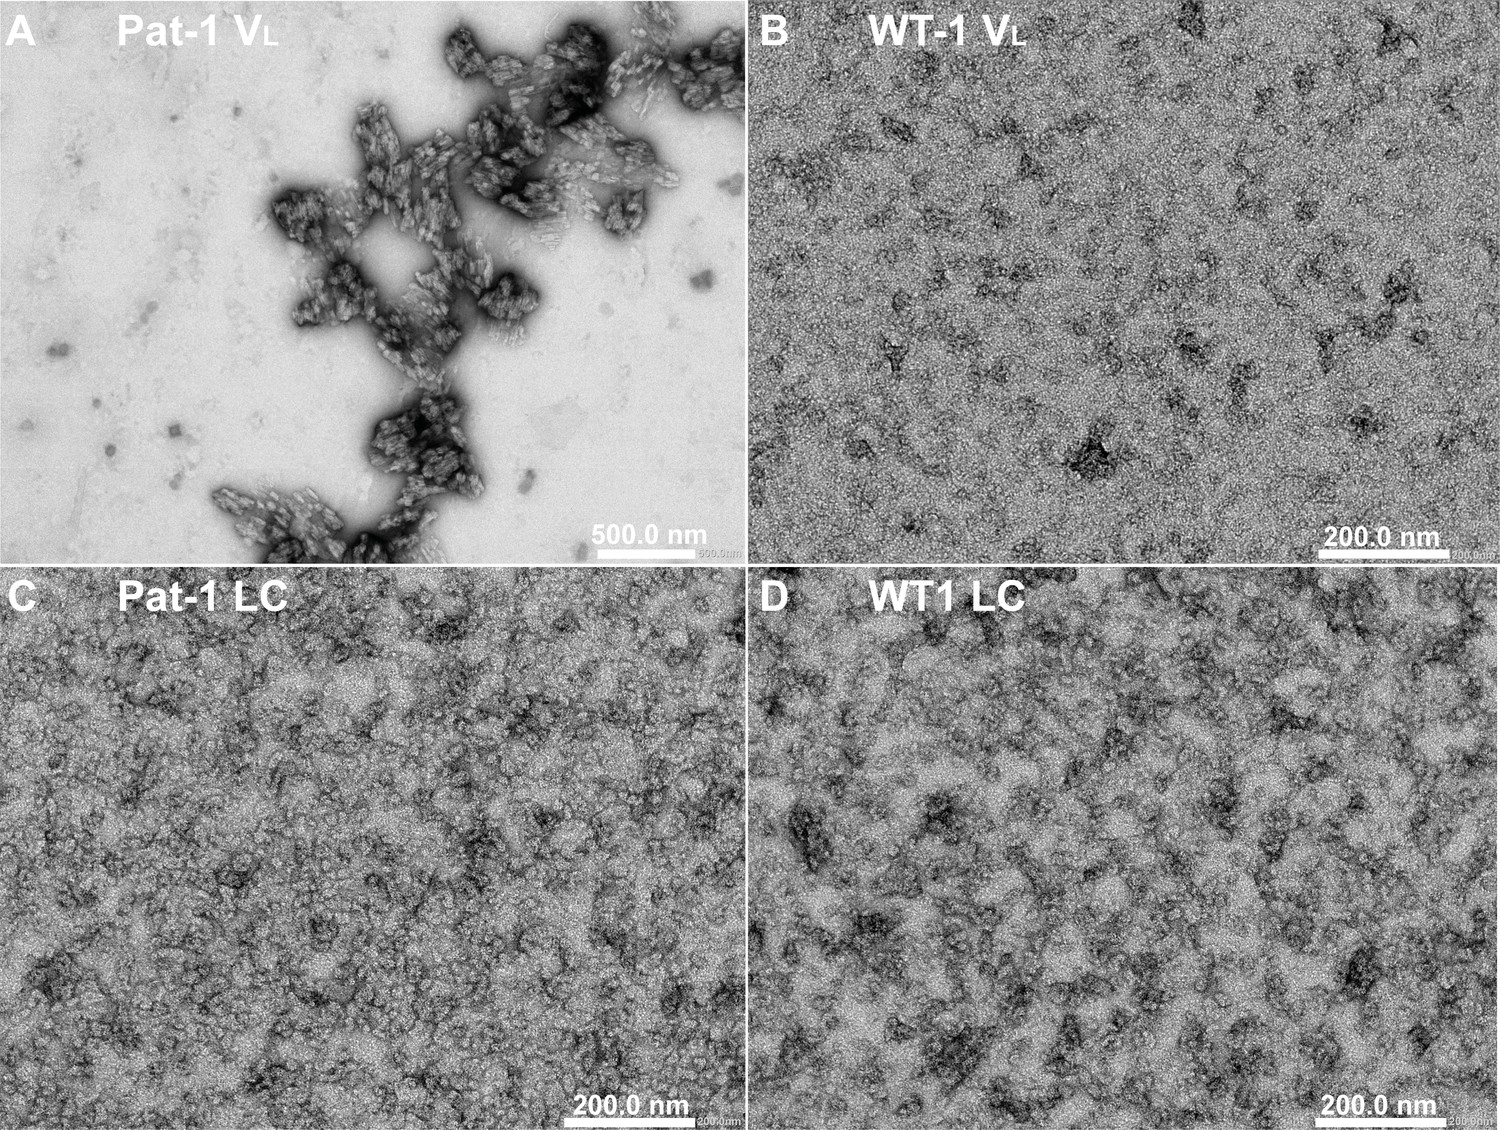
TEM micrographs of VLs of (A) Pat-1 and (B) WT-1 and LCs of (C) Pat-1 and (D) WT-1.
The presence (VL Pat-1) or absence (VL WT-1, LC Pat-1 and LC WT-1) of fibrils was monitored by negative stain TEM.
Figure 2 with 1 supplement

Structural characterization and stability comparison of the VL domains Pat-1 and WT-1.
The pathogenic VL Pat-1 is highlighted in purple, the germline VL in cyan. (A) Crystal structure of the VLs (PDB IDs: 6SM1, 6SM2). The intramolecular disulfide bond is shown as yellow sticks. The nine point mutations are depicted as black sticks. (B) Analytical ultracentrifugation sedimentation velocity runs with Svedberg values of ~1.6 s for both VLs. The data were analyzed using the continuous c(S) distribution mode of SEDFIT. (C) Temperature-induced unfolding transitions of Pat-1 and WT-1. The dots show the raw data, the continuous line shows the theoretical curves derived by fitting the data to a Boltzmann function. (D) GdmCl-induced unfolding transitions of both Pat-1 and WT-1 monitored by tryptophan fluorescence at 349 nm. The measurements were performed three times and the continuous lines shows the mean data fit to a two-state unfolding mechanism with SD. The significance corresponds to a p value of p=0.000996. Source files of the crystallographic data collection and refinement statistics are available in Figure 2—source data 1.
-
Figure 2—source data 1
Crystallographic data collection and refinement statistics for WT-1 and Pat-1.
- https://cdn.elifesciences.org/articles/52300/elife-52300-fig2-data1-v1.docx
Figure 2—figure supplement 1

Superposition of the crystal structures of Pat-1 and WT-1.
Alignment of both protein crystals reveal structural differences. The structures of Pat-1 and WT-1 are depicted in purple and cyan, respectively.
Figure 3 with 2 supplements
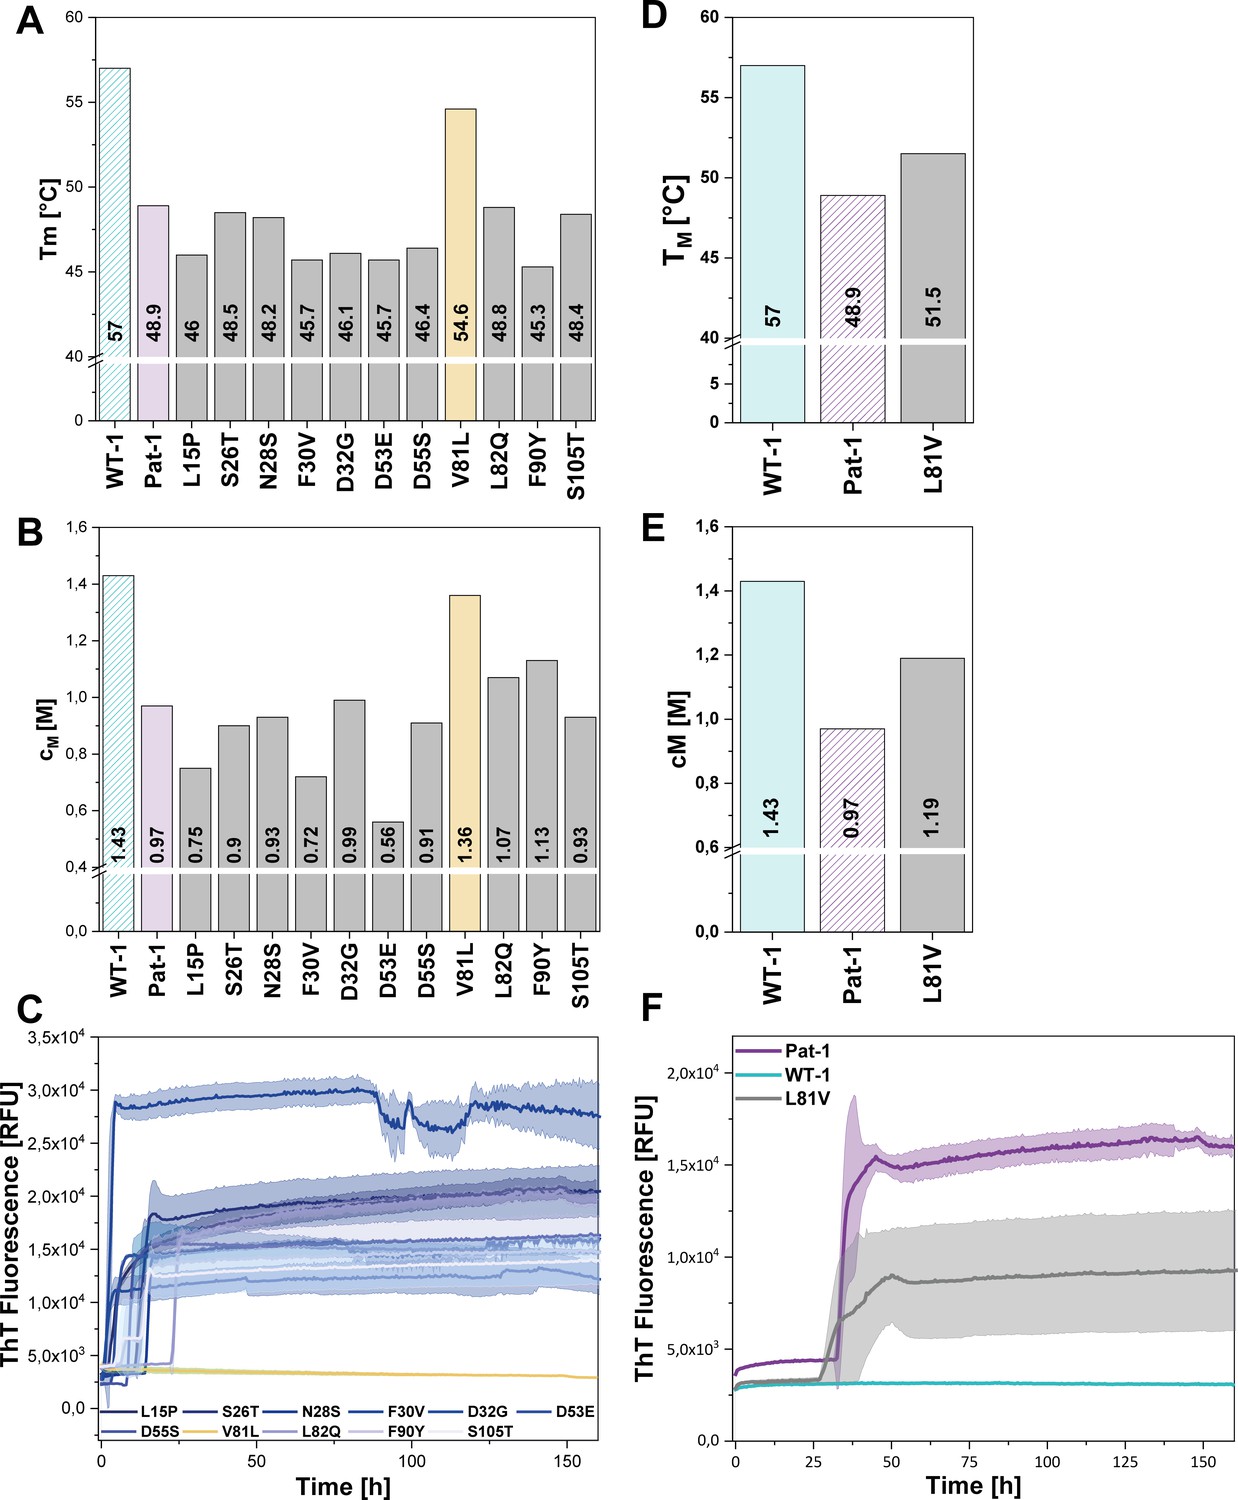
Impact of point mutations on the stability of Pat-1 and WT-1.
(A) Comparison of Tm and (B) cM values of Pat-1, WT-1 and single point mutants of Pat-1. The Tm values were derived from fitting the thermal-induced unfolding transition data to a Boltzmann function. cM values were obtained by fitting the chemical unfolding data according to a two-state unfolding model. (C) Fibril formation assay of single-point mutants followed by ThT fluorescence. (D) Comparison of Tm and (E) cM values of Pat-1, WT-1 and the single point mutant L81V. The Tm values were derived from fitting the thermal-induced unfolding transition data to a Boltzmann function. cM values were obtained by fitting the chemical unfolding data according to a two-state unfolding model. (F) Fibril formation assay followed by ThT fluorescence. The assay was performed in PBS buffer containing 0.5 mM SDS at 37°C and shaking. The continuous lines show the mean value of triplicates with SD as transparent coloured areas.
Figure 3—figure supplement 1

Impact of the V81I substitution on the thermal stability and fibril formation propensity of Pat-1.
(A) Thermal stabilities were determined by heating the protein (10 µM) from 20–90°C and following the change in CD signal at 205 nm. The thermal unfolding data were fit to a Boltzmann fit. (B) Fibril formation was initiated by incubating the protein (15 µM) at 37°C under continuous orbital shaking and followed by ThT fluorescence.
Figure 3—figure supplement 2
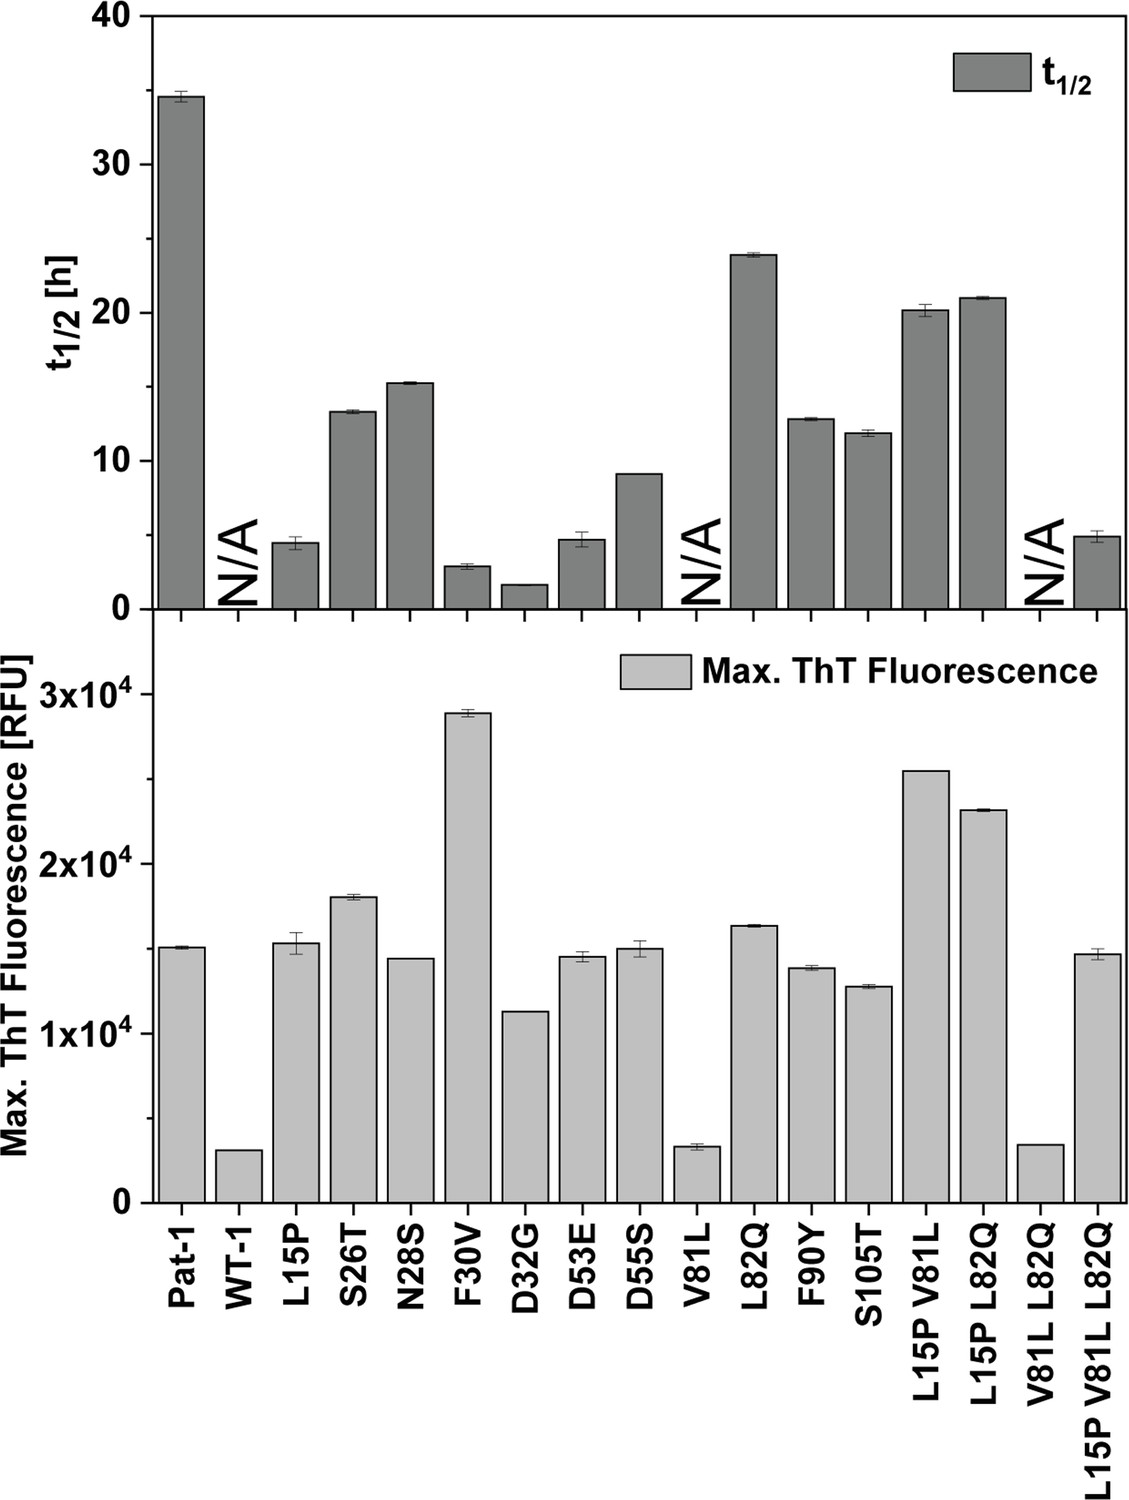
Comparison of t1/2 and maximal ThT fluorescence values of the VL variants.
t1/2 and maximal ThT fluorescence values were obtained by fitting the regions of interest to a Boltzmann function.
Figure 4 with 1 supplement

Influence of amino acid substitutions altering the hydrophobic of Pat-1.
(A) Surface representation of the crystal structures of Pat-1 and WT-1. The surface amino acids are colored according to their hydrophobicity. (B) Sequences of Pat-1 and WT-1 with the amino acids located in the hydrophobic surface patch of the VL domains highlighted in red. (C) Thermal and (D) chemical stabilities of WT-1, Pat-1 and the single, double and triple point mutants varying the hydrophobic surface of Pat-1. Thermal stabilities were obtained by fitting the thermal unfolding data to a Boltzmann fit. Chemical stabilities were obtained by fitting GdmCl unfolding data according to a two-state unfolding model. The measurement was performed three times and the mean was taken. (E) Fibril formation was followed by ThT fluorescence. The assay was performed in PBS buffer containing 0.5 mM SDS at 37°C and shaking. The continuous lines show the mean value of triplicates with SD as transparent colored areas.
Figure 4—figure supplement 1

TEM micrographs of hydrophobic mutants of Pat-1.
The presence or absence of fibrils of the hydrophobic surface altering VL variants was monitored by negative stain TEM.
Figure 5

Comparison of hydrogen-deuterium exchange rates of Pat-1 and WT-1.
(A) The magnitude of exchange of Pat-1 is shown in purple, for WT-1 in cyan. FRs are highlighted in light blue, CDRs in white. Pat-1 shows overall higher exchange rate. Strongly affected regions are highlighted in yellow. The Experiment was performed twice. (B) The relative change in fractional uptake is mapped on the Pat-1 crystal structure. Negative and positive relative change values in H/DX indicate more dynamic WT-1 and Pat-1 regions, respectively. Relative change of H/DX of Pat-1 segments with respect to WT-1 is color coded from blue (low) to red (high). Source files for the H/DX measurement sets are available in Figure 5—source datas 1–4.
-
Figure 5—source data 1
First set of HD/X values for WT-1.
- https://cdn.elifesciences.org/articles/52300/elife-52300-fig5-data1-v1.txt
-
Figure 5—source data 2
Second set of HD/X values for WT-1.
- https://cdn.elifesciences.org/articles/52300/elife-52300-fig5-data2-v1.txt
-
Figure 5—source data 3
Figure 5—source data 3. First set of HD/X values for Pat-1.
- https://cdn.elifesciences.org/articles/52300/elife-52300-fig5-data3-v1.txt
-
Figure 5—source data 4
Second set of HD/X values for Pat-1.
- https://cdn.elifesciences.org/articles/52300/elife-52300-fig5-data4-v1.txt
Figure 6

Hydrophobic networks of amino acids at position (A) 81 and (B) 15.
The amino acids included in the hydrophobic network are shown in red stick representation. The area of the network is highlighted in light red. Source file of the hydrophobic interaction patterns is available in Figure 6—source data 1.
-
Figure 6—source data 1
Hydrophobic interaction pattern of the three mutated amino acids at positions 15, 81 and 82, located in the altered hydrophobic surface area of the VLvariants Pat-1 and WT-1.
- https://cdn.elifesciences.org/articles/52300/elife-52300-fig6-data1-v1.docx
Figure 7 with 1 supplement
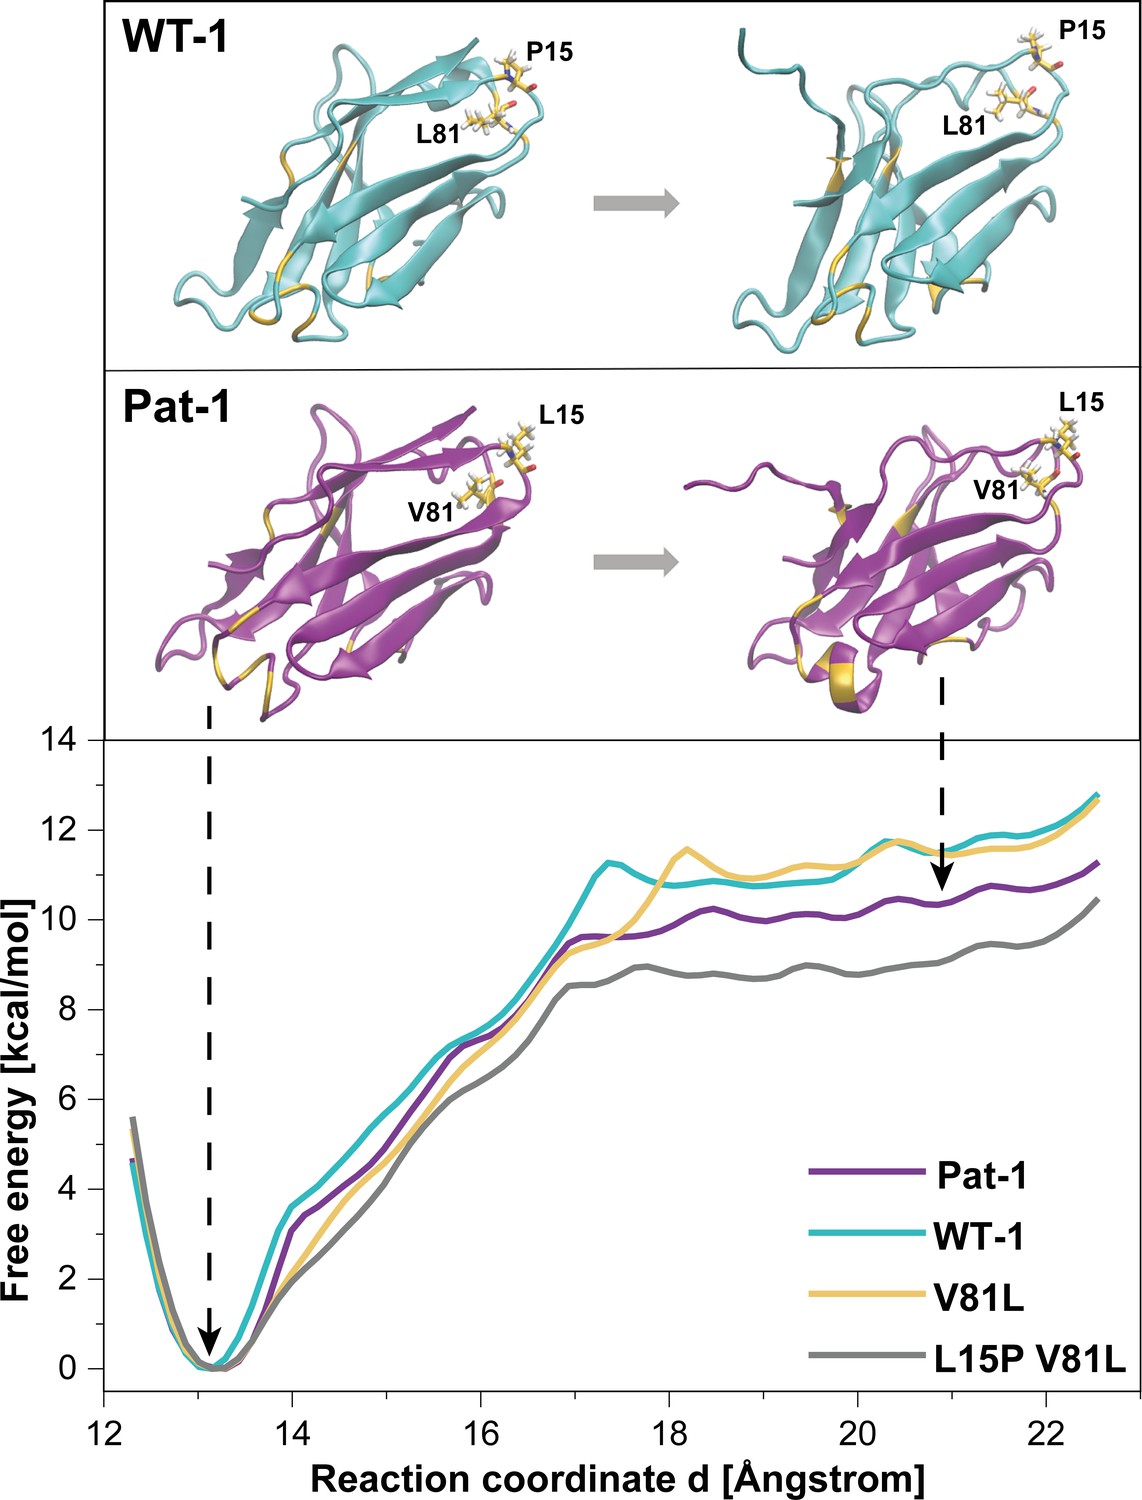
Potential of mean force (PMF) for the dissociation of the C-terminal segment.
The free energy along the reaction coordinate was calculated by means of umbrella sampling simulations (see Materials and methods section). The reaction coordinate corresponds to the distance between the center of mass of the α-carbons of the C-terminal (residues 103 to 109) and the α-carbons of the rest of the protein (residues 1 to 102). A distance of ~13 Å indicates the position of the C-terminal segment as observed in the native structure whereas distances >~17.5 Å indicate dissociation of the C-terminal segment. Representative snapshots in the folded and unfolded states of WT-1 and Pat-1 are represented above the corresponding section of the PMF. The 11 resides which vary from WT-1 to Pat-1 are represented in yellow. The licorice representation corresponds to residues 81 and 15. Source files for the MD analysis are available in Figure 7—source data 1.
-
Figure 7—source data 1
Reaction coordinate and free energy values from the MD simulation measurements.
- https://cdn.elifesciences.org/articles/52300/elife-52300-fig7-data1-v1.xlsx
Figure 7—figure supplement 1
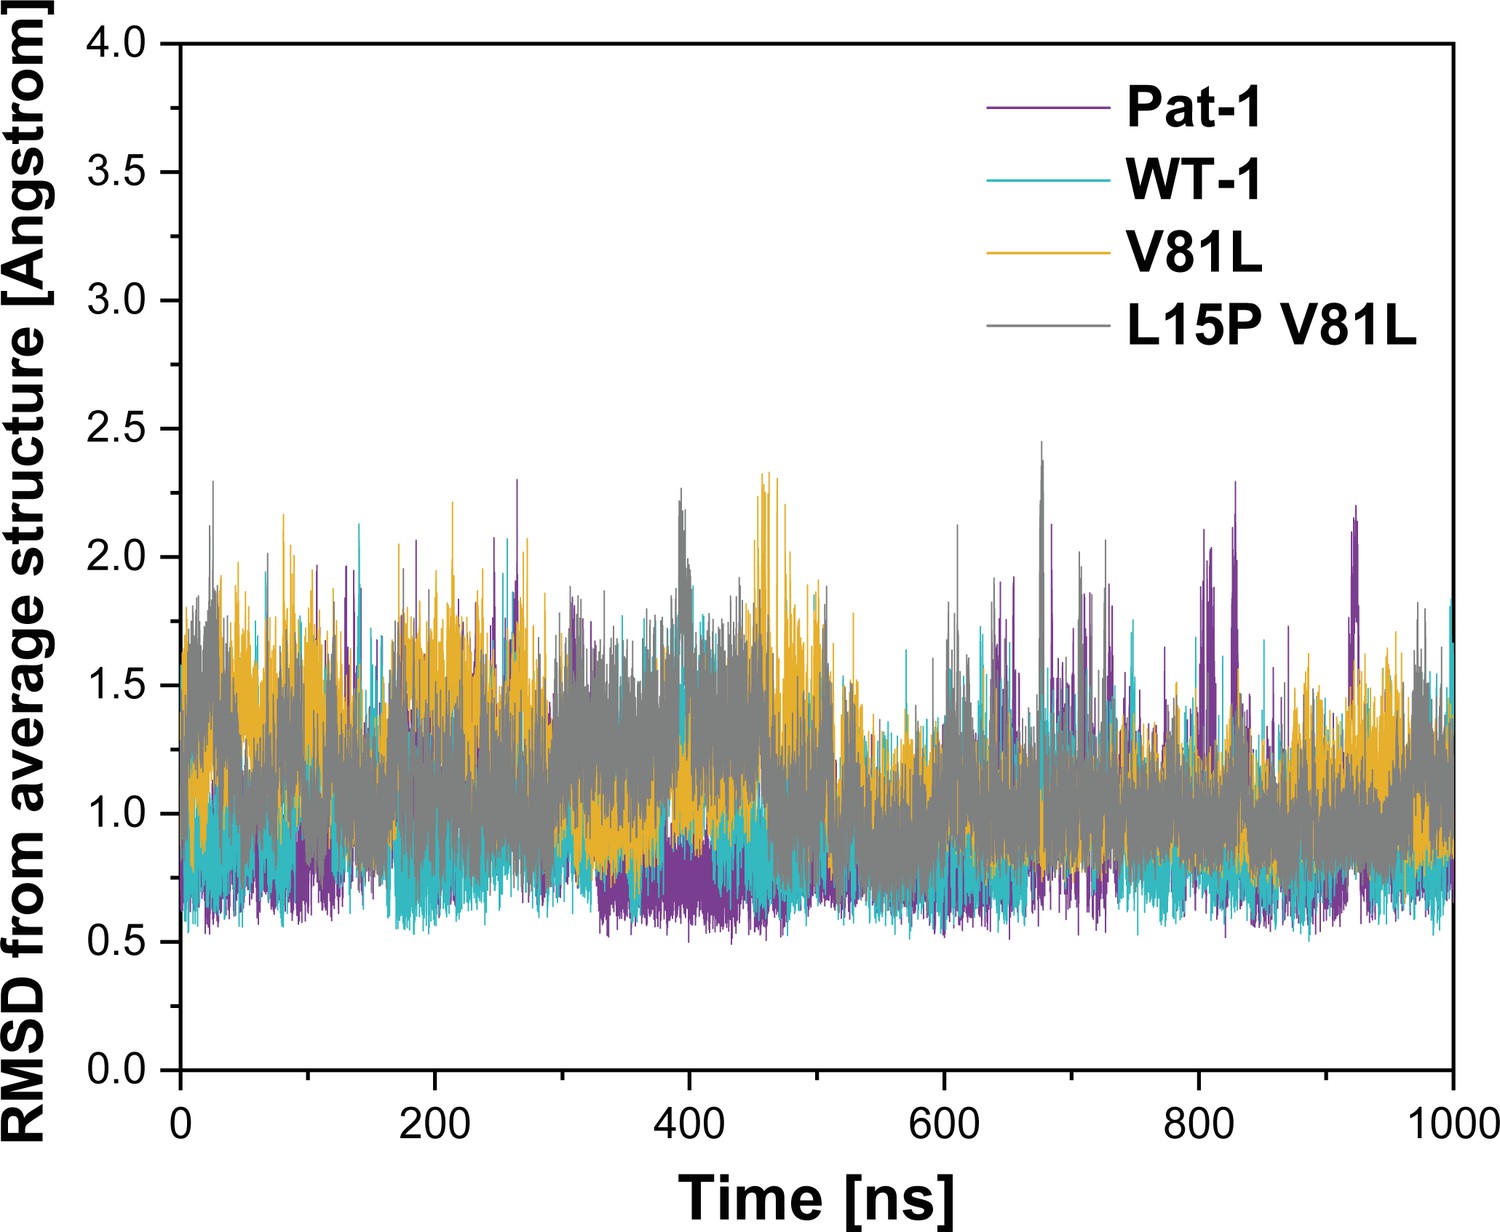
Root mean square deviation (RMSD) from corresponding time-averaged structures during MD Simulations.
The coordinate RMSD with respect to the time-averaged structure of the corresponding construct was calculated over a period of 1 µs of free MD simulations at 300 K. The high stability of the structures is reflected by a RMSD <2.5 Å for all conformations during the whole simulation period.
Tables
Key resources table
| Reagent type (species) or resource | Designation | Source or reference | Identifiers | Additional information |
|---|---|---|---|---|
| Gene (Homo sapiens) | WT-1 | Uniprot IGLV2-14 | Uniprot: P01704 | |
| Gene (Homo sapiens) | Pat-1 | This paper | GenBank: MK962887 | |
| Strain, strain background (E. coli) | BL21-codon+ (DE3)-RIL | Stratagene | ||
| Strain, strain background (E. coli) | XL1blue | Stratagene | ||
| Biological sample (Homo sapiens) | abdominal fat tissue | University hospital Heidelberg | ||
| Recombinant DNA reagent | pet28b-WT-1 | invitrogen | Point mutants obtained by site directed mutagenesis using NEBasechanger | |
| Recombinant DNA reagent | pet28b-Pat-1 | invitrogen | Point mutants obtained by site directed mutagenesis using NEBasechanger | |
| Recombinant protein | Pat-1 LC, Pat-1 VL, WT-1 LC, WT-1 VL, Pat-1 VL and WT-1 VLpoint mutants | This paper | Expression plasmids obtained from invitrogen (see: recombinant DNA reagent). Point mutant expression plasmids created using site directed mutagenesis (see: other). Protein purification according to Material and methods section | |
| Commercial assay or kit | Wizard Plus SV Mini-Prep DNA purification | Promega | A1460 | |
| Software, algorithm | Origin 2018b | OriginLab Corporation | ||
| Software, algorithm | SedFit | Peter Schuck | ||
| Software, algorithm | Discovery Studio | BIOVA | ||
| Software, algorithm | Pymol | Schrödinger, DeLano Scientific LLC | ||
| Software, algorithm | Adobe Illustrator | Adobe Inc | ||
| Software, algorithm | PLGS and DynamX | Waters.com | ||
| Other | NEBaseChanger | NEB | https://nebasechanger.neb.com | Primer design for site directed mutagenesis |
Additional files
Download links
A two-part list of links to download the article, or parts of the article, in various formats.
Downloads (link to download the article as PDF)
Open citations (links to open the citations from this article in various online reference manager services)
Cite this article (links to download the citations from this article in formats compatible with various reference manager tools)
Fatal amyloid formation in a patient’s antibody light chain is caused by a single point mutation
eLife 9:e52300.
https://doi.org/10.7554/eLife.52300


