Casein kinase 1 dynamics underlie substrate selectivity and the PER2 circadian phosphoswitch
- University of California Santa Cruz, United States
- Program in Cancer and Stem Cell Biology, Duke-NUS Medical School, Singapore
- University of California San Diego, United States
- Duke University Medical Center, United States
Figures
Figure 1 with 1 supplement
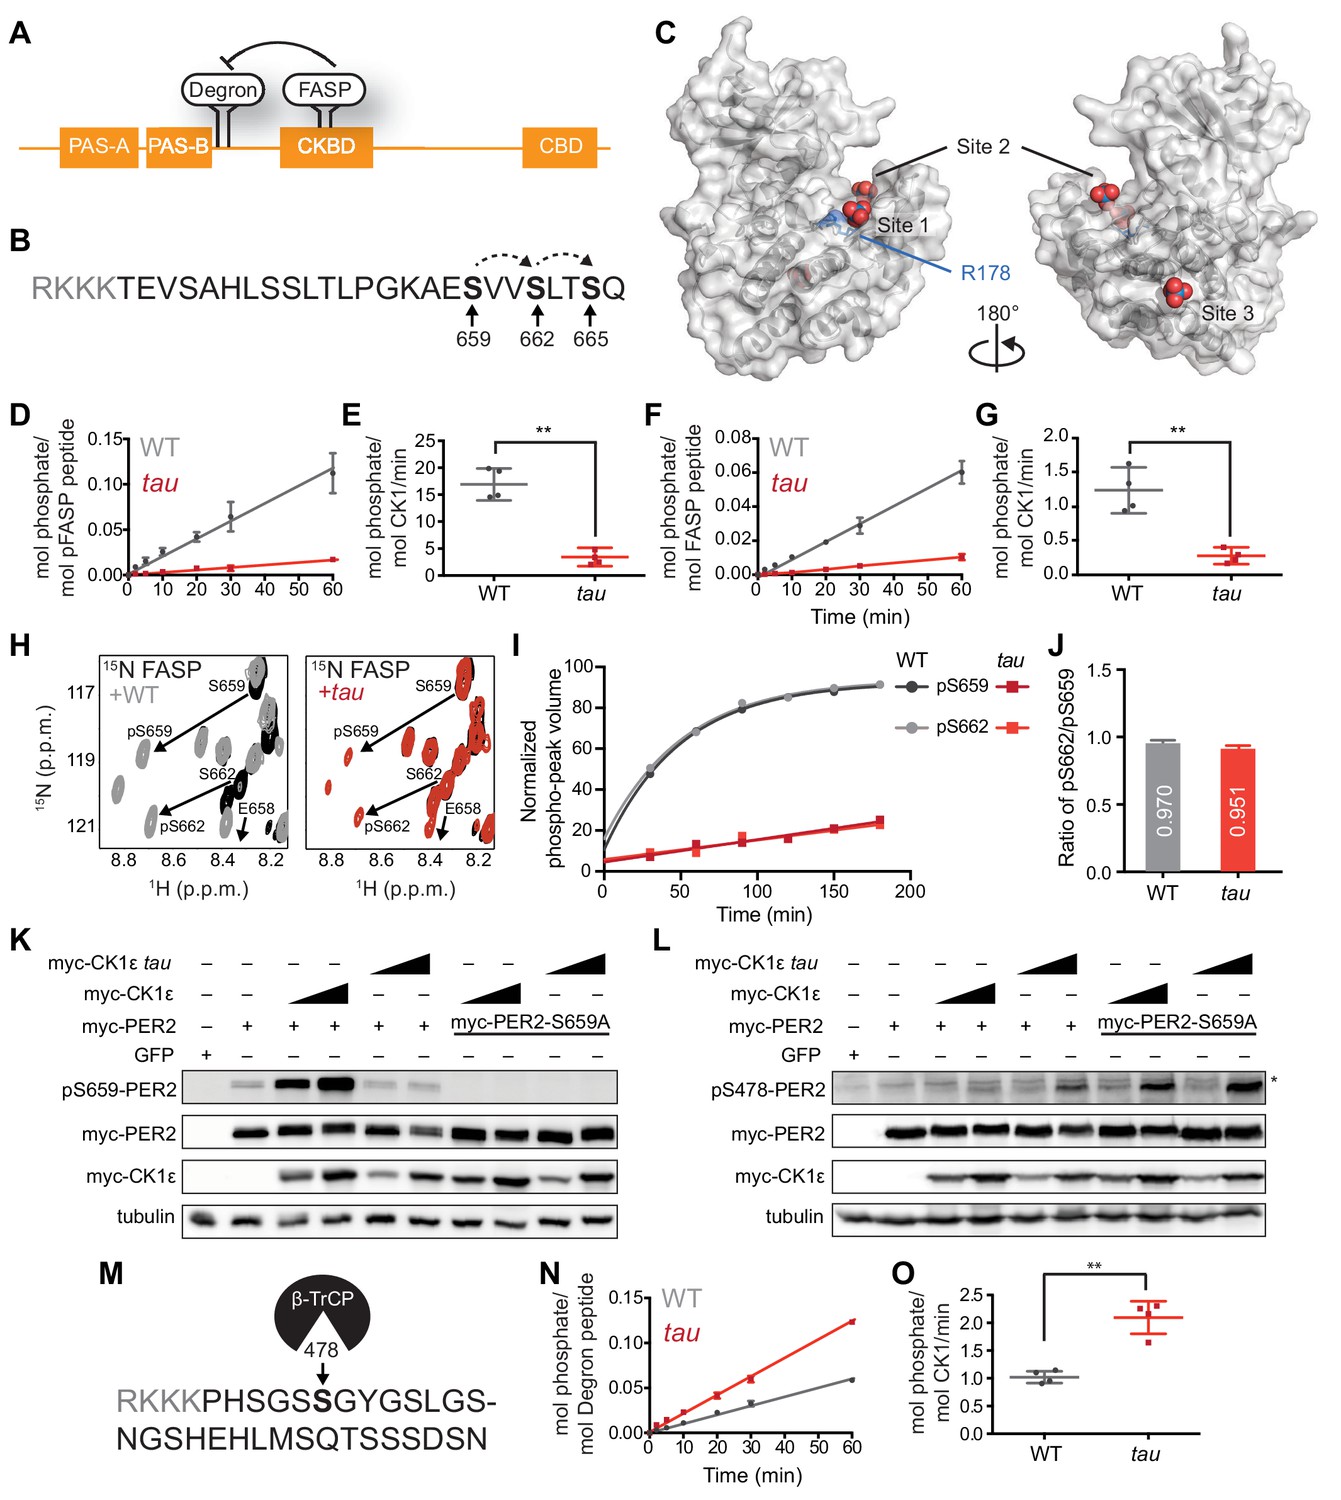
tau alters CK1 substrate selectivity on PER2 to enhance Degron phosphorylation.
(A) Domain map of PER2 with tandem PAS domains, Casein Kinase-binding domain (CKBD), CRY-binding domain (CBD) and CK1 phosphorylation sites. (B) Sequence of the mouse PER2 FASP peptide with the priming site (S659, bold) and two downstream phosphorylation sites (S662 and S665, bold) that are phosphorylated sequentially by CK1δ (dashed arrows). Gray, polybasic motif included for 32P kinase assay. (C) CK1δ kinase domain with three anion binding sites (PDB: 1CKJ with WO42- anions). R178, blue. D, Kinase assay with 20 nM CK1δ ΔC WT or tau on 200 µM of primed FASP peptide (pS659) (n = 4 with s.d.). (E) Phosphorylation rates on primed FASP (n = 4 with s.d.). Significance assessed by unpaired Student’s two-sided t-test: **, p<0.01. (F) Kinase assay as in D, but with 200 nM CK1δ ΔC WT or tau on 200 µM of unprimed FASP (n = 4 with s.d.). (G) Phosphorylation rates on the unprimed FASP peptide (n = 4 with s.d.). Significance assessed as above. (H) Overlaid 15N/1H HSQC spectra at 3 hr timepoint in the NMR kinase assay on 200 µM 15N FASP (black) ±1 μM WT (gray) or tau (red) CK1δ ΔC. Arrows, phospho-specific peaks corresponding to pS659 and pS662. (I) Phosphoserine peak intensities for pS659 and pS662 by WT and tau kinases from NMR kinase assay. (J) Ratio of consensus to priming activity on the FASP (pS662/pS659) in the NMR kinase assay. Errors were estimated from the standard deviation of the noise in the spectrum. (K-L) Western blot of FASP priming site, detecting pS659 (K) or the Degron, detecting pS478 (L) on mouse myc-PER2 in HEK293 cell lysates after transfection with indicated expression plasmids. Representative blot from n = 3 shown. Wedge, 10 or 50 ng of myc-CK1ε plasmid used. *, non-specific band. (M) Sequence of mouse PER2 Degron peptide with S478 (bold) and polybasic motif (gray). (N) Kinase assay with 200 nM kinase on 200 µM Degron peptide (n = 4 with s.d.). (O) Phosphorylation rates on Degron (n = 4 with s.d.). Significance assessed as above. See also Figure 1—figure supplement 1.
Figure 1—figure supplement 1
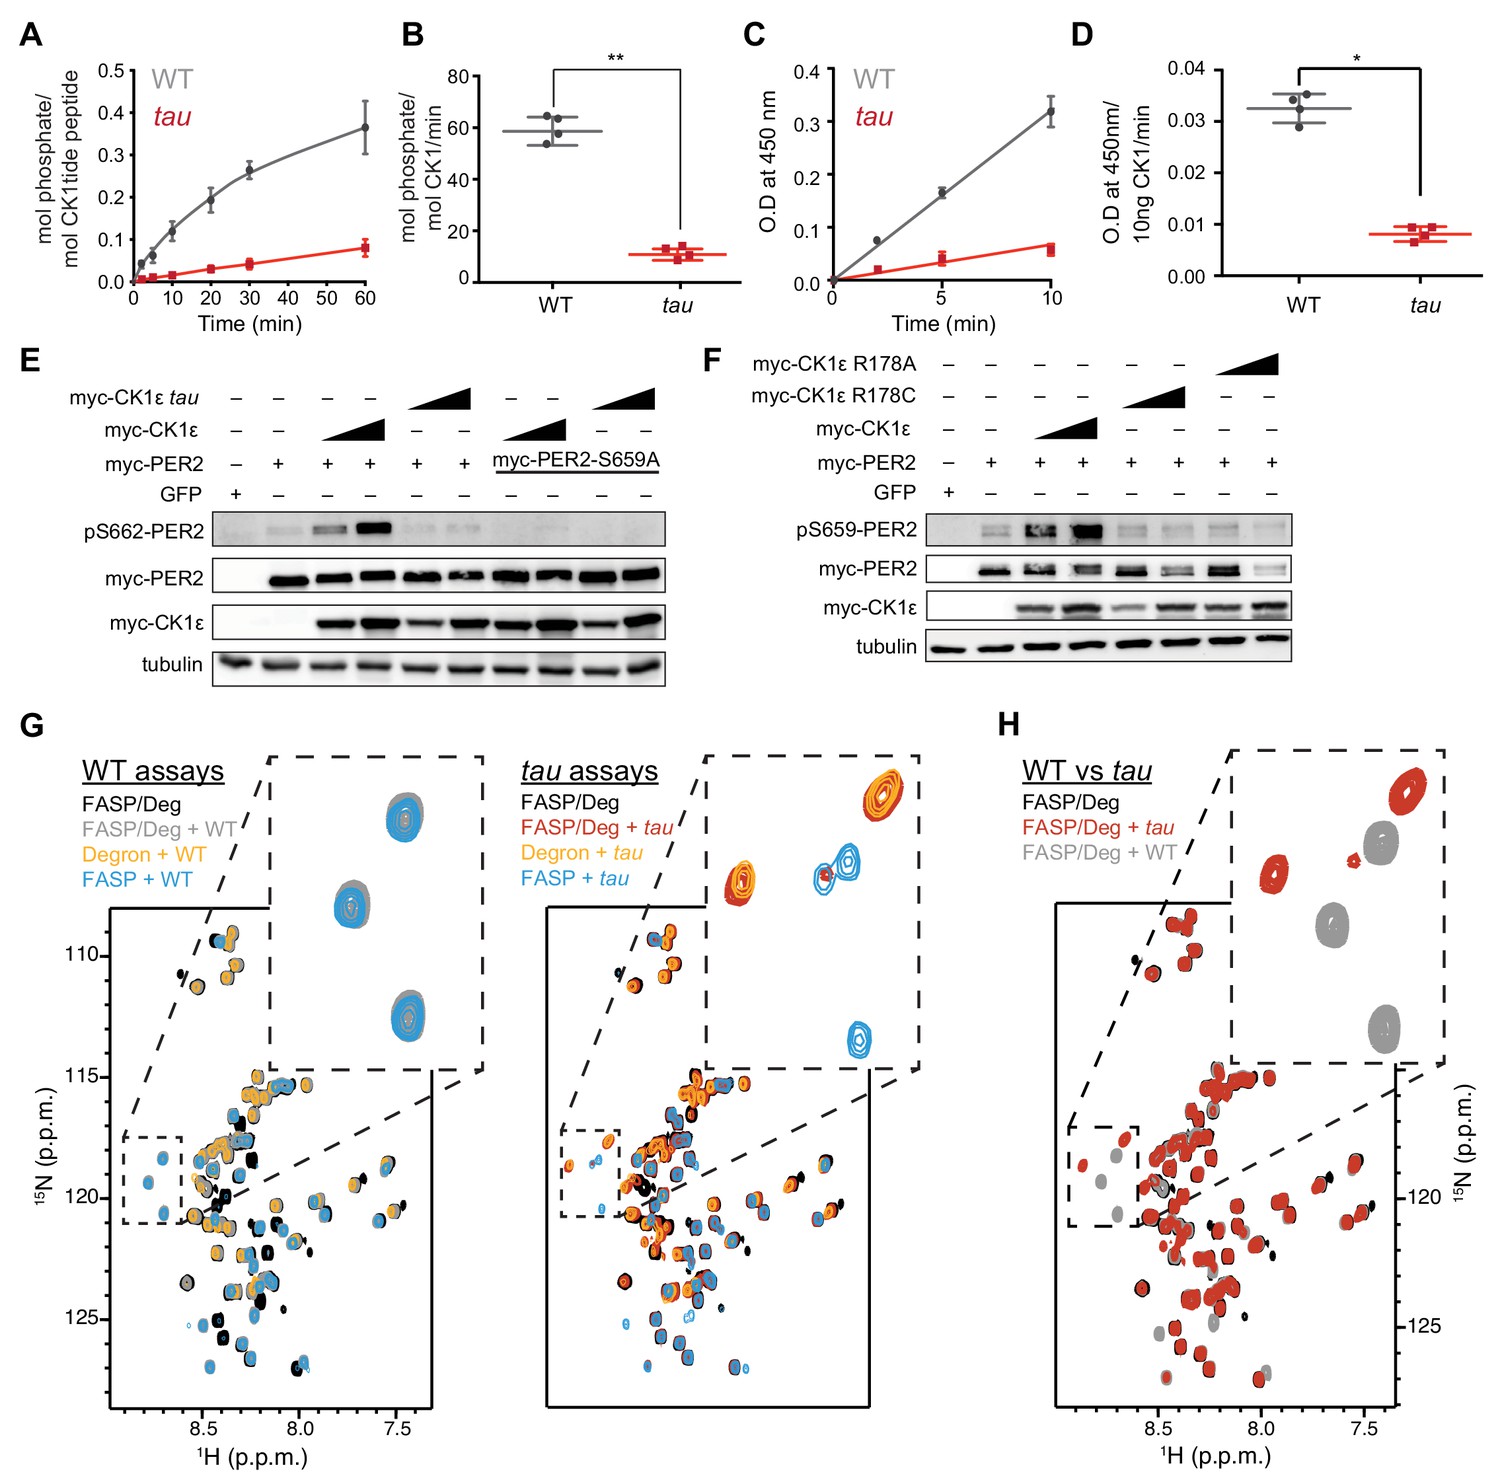
The tau mutation alters substrate selectivity.
(A) Kinase assay using 20 nM CK1δ ΔC of WT or tau on 200 µM of the synthetic primed substrate, CK1tide, KRRRALpSVASLPGL (n = 4 with s.d.). (B) Phosphorylation rate of kinases on CK1tide (n = 4 with s.d.). Significance assessed by Student’s two-sided t-test, **, p<0.01. (C) ELISA-based kinase assay on 200 µM of the mouse FASP peptide detected with the anti-pS659 antibody with 10 ng of CK1δ ΔC WT or tau (n = 4 with s.d.). (D) Rate of phosphorylation measured by optical density (O.D.) at 450 nm at the indicated timepoints (n = 4 with s.d.). Significance assessed by unpaired Student’s two-sided t-test: *, p<0.05. (E) Western blot of sequential phosphorylation of the FASP at S662 on mouse myc-PER2 in HEK293 cell lysates after transfection with indicated expression plasmids. Representative blot from n = 3 shown. Wedge, 10 or 50 ng of myc-CK1ε plasmid used. (F) Western blot of FASP priming phosphorylation at S659 on mouse myc-PER2 in HEK293 cell lysates after transfection with indicated expression plasmids as in panel E. Representative blot from n = 3 shown. (G) Overlaid 15N/1H SOFAST HMQC spectra of NMR kinase assays with 15N FASP, 15N Degron, or both. WT and tau kinases were assayed for activity with 200 µM of both substrates (WT kinase, gray; tau kinase, red; no kinase, black), or with FASP or Degron peptides alone (FASP, blue; Degron, orange). (H) Overlay of 15N/1H SOFAST HMQC spectra comparing WT and tau phosphorylation profiles for equimolar FASP/Degron substrate at 3 hr. Note the remarkably distinct substrate preferences for WT and tau kinases.
Figure 2 with 1 supplement
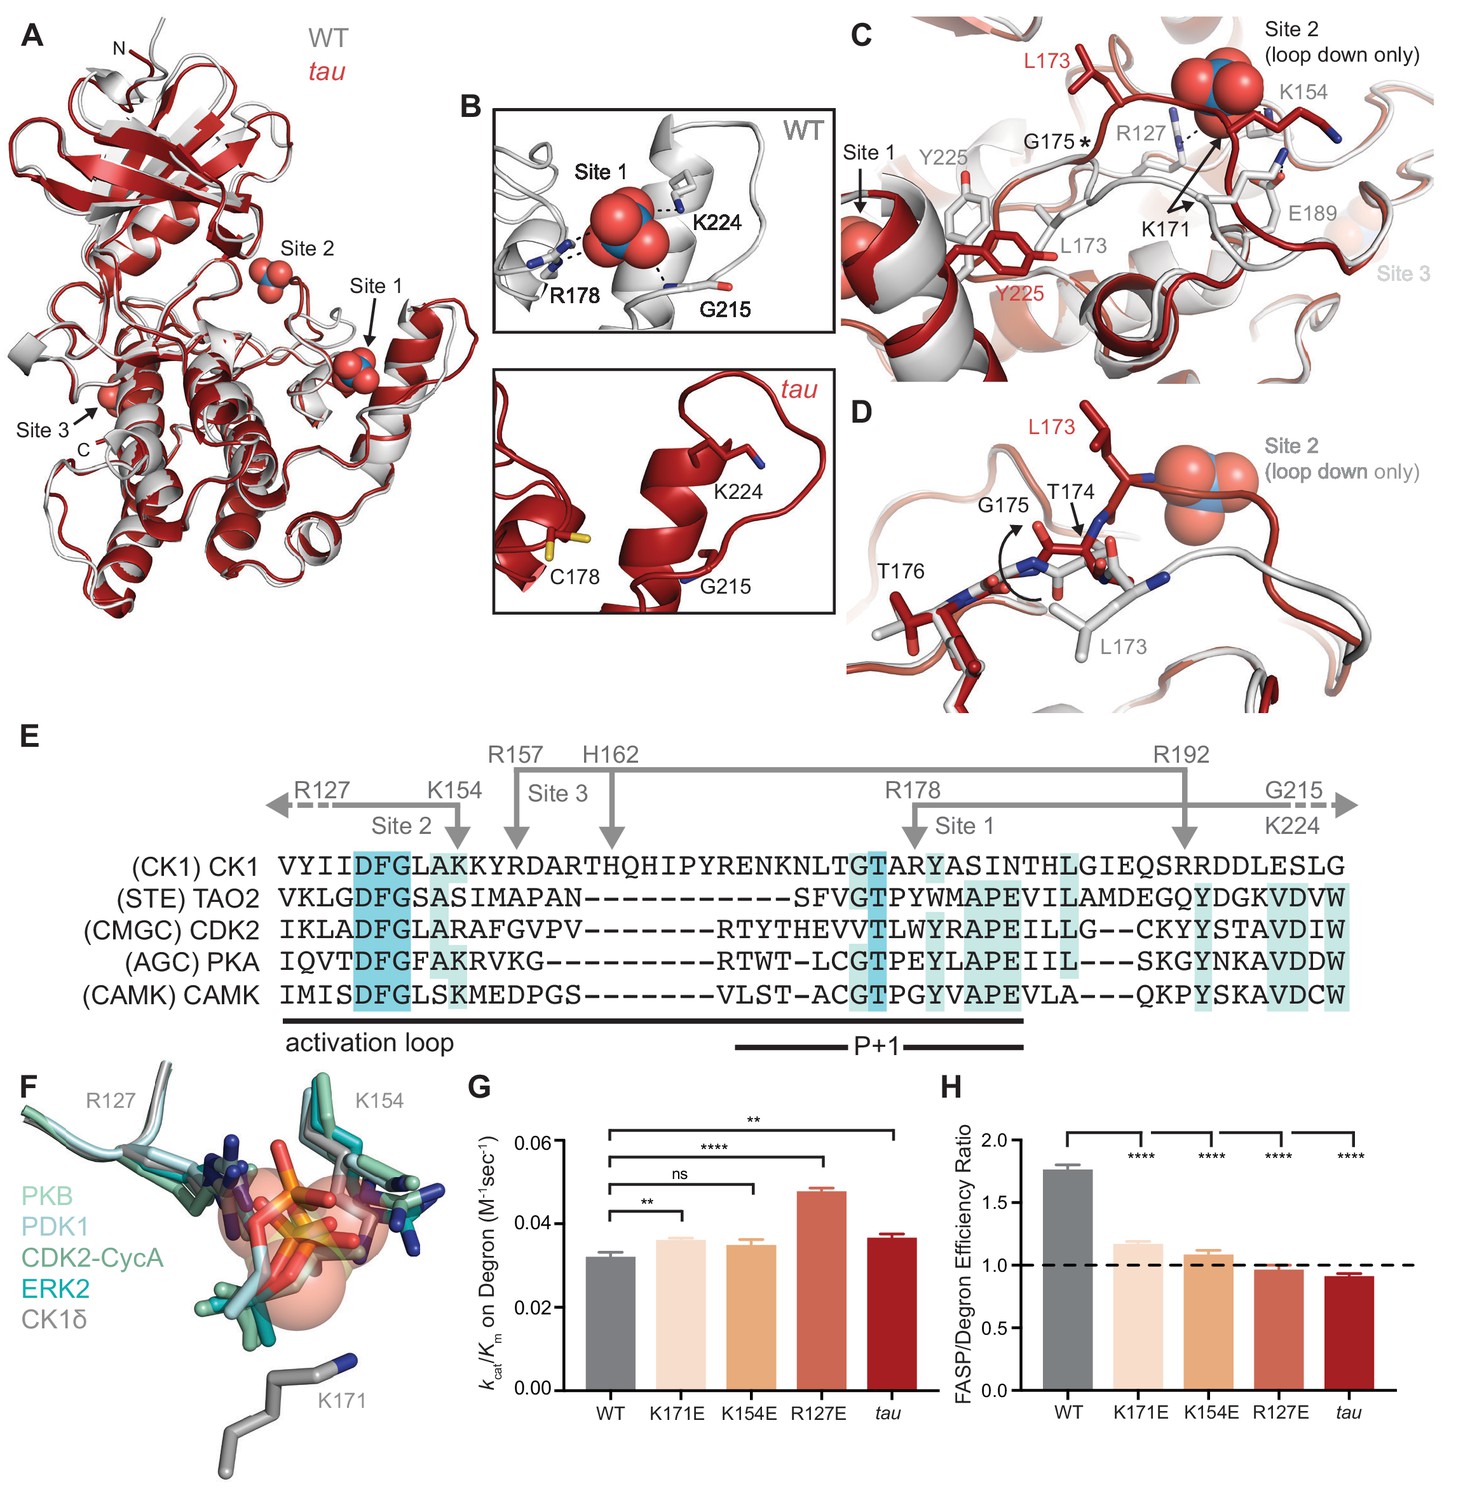
tau disrupts anion binding on CK1δ.
(A) Overlay of WT kinase domain (gray, PDB: 1CKJ, chain B) with tau (maroon, PDB: 6PXN, chain A). The 3 anion binding sites (WO42-, from 1CKJ) are labeled. (B) View of Site 1 in WT (top, gray) and tau (bottom, maroon). Polar interactions, dashed black lines. (C) Overlaid view of Site two in WT and tau as above. Polar interactions, dashed black lines. Asterisk, hinge point for conformational change at G175. Note: Site two anion is only bound in WT, as it is blocked by the activation loop in tau. (D) Representation depicting the left-hand configuration of G175 and subsequent rotation (solid arrow) of upstream residues T174 and L173. (E) Alignment of the activation loop of CK1δ with representatives of other serine/threonine kinase families. Residues that coordinate anion binding on CK1 are indicated above in gray. (F) Superposition of the Site two anion binding site in CK1 with the binding site for the phosphorylated activation loop of other serine/threonine kinases. Depicted are: PKB (PDB: 1O6K, pale cyan), PDK1 (1H1W, aquamarine), CDK2 (1QMZ, green cyan), ERK2 (2ERK, teal) and CK1δ (5 × 17, dark gray). Residues that coordinate the anion are depicted in sticks, as are phosphoserine or phosphothreonine residues from other kinases; the SO42- coordinated at Site two by CK1δ (PDB: 5 × 17) is shown in transparent spheres. (G) Enzymatic efficiency on the Degron (n = 3 with s.d.). Significance assessed relative to WT with an unpaired Student’s two-sided t-test: **, p<0.01; ***, p<0.001; ****, p<0.0001. (H) Ratio of enzymatic efficiency on FASP relative to Degron (n = 3 with s.d.). Equivalent activity on FASP and Degron, dashed line. Significance assessed as above. See also Figure 2—figure supplement 1.
Figure 2—figure supplement 1
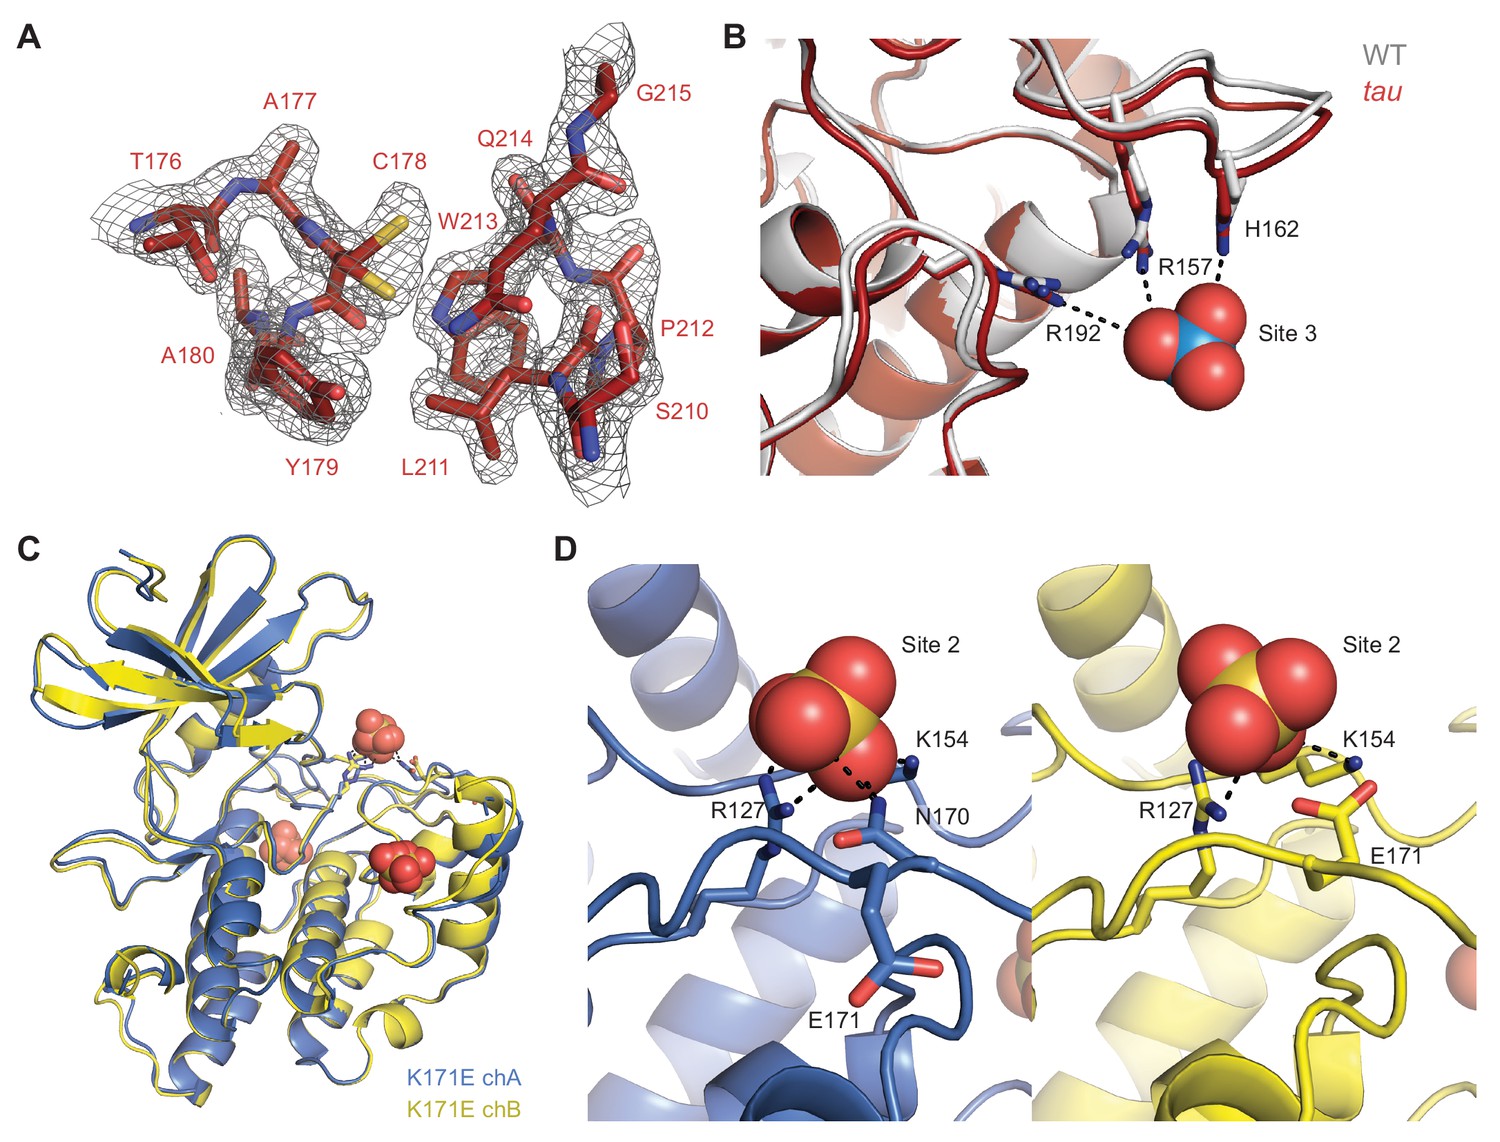
Details of CK1 crystal structures.
(A) 2Fo-Fc omit map of the Site 1 anion binding pocket in the tau mutant (maroon, PDB: 6PXN, chain A) contoured at 1 σ. (B) View of the Site 1 anion binding pocket with WT (gray, PDB: 1CKJ, chain B) and tau (maroon, PDB: 6PXN, chain A) structures overlaid. Polar interactions that coordinate the anion are depicted with dashed black lines. Note, the anions depicted at Site 1 and 2 here are only present in the WT structure. (C) Overlay of K171E CK1δ ΔC (PDB: 6PXP; chain A, blue; chain B, yellow). The three conserved anion binding sites (sulfate) are depicted. (D) Side-by-side overlaid view of the Site 2 anion binding pocket in the CK1δ ΔC K171E crystal structure showing polar contacts to the bound sulfate (dashed black lines) from chain A (blue, left) and chain B (yellow, right).
Figure 3 with 1 supplement

tau alters an intrinsic molecular switch in the activation loop of CK1δ.
(A) View of the activation loop switch in WT (PDB: 1CKJ, chains A (cyan) and B (gray)) and tau (PDB: 6PXN, chains A (maroon) and B (salmon)). (B) Position of L173 CD2 relative to either L152 CD2 or Y225 OH, reporting on the conformation of the activation loop in the ‘loop down’ (gray) or ‘loop up’ (cyan) conformation in WT CK1δ (PDB: 1CKJ). (C) Scatter plot of interatomic distances in Å (from panel B) measured in 68 chains from 26 different crystal structures of CK1δ ΔC. See Figure 3—figure supplement 1 and Supplementary file 1c for more information.
Figure 3—figure supplement 1
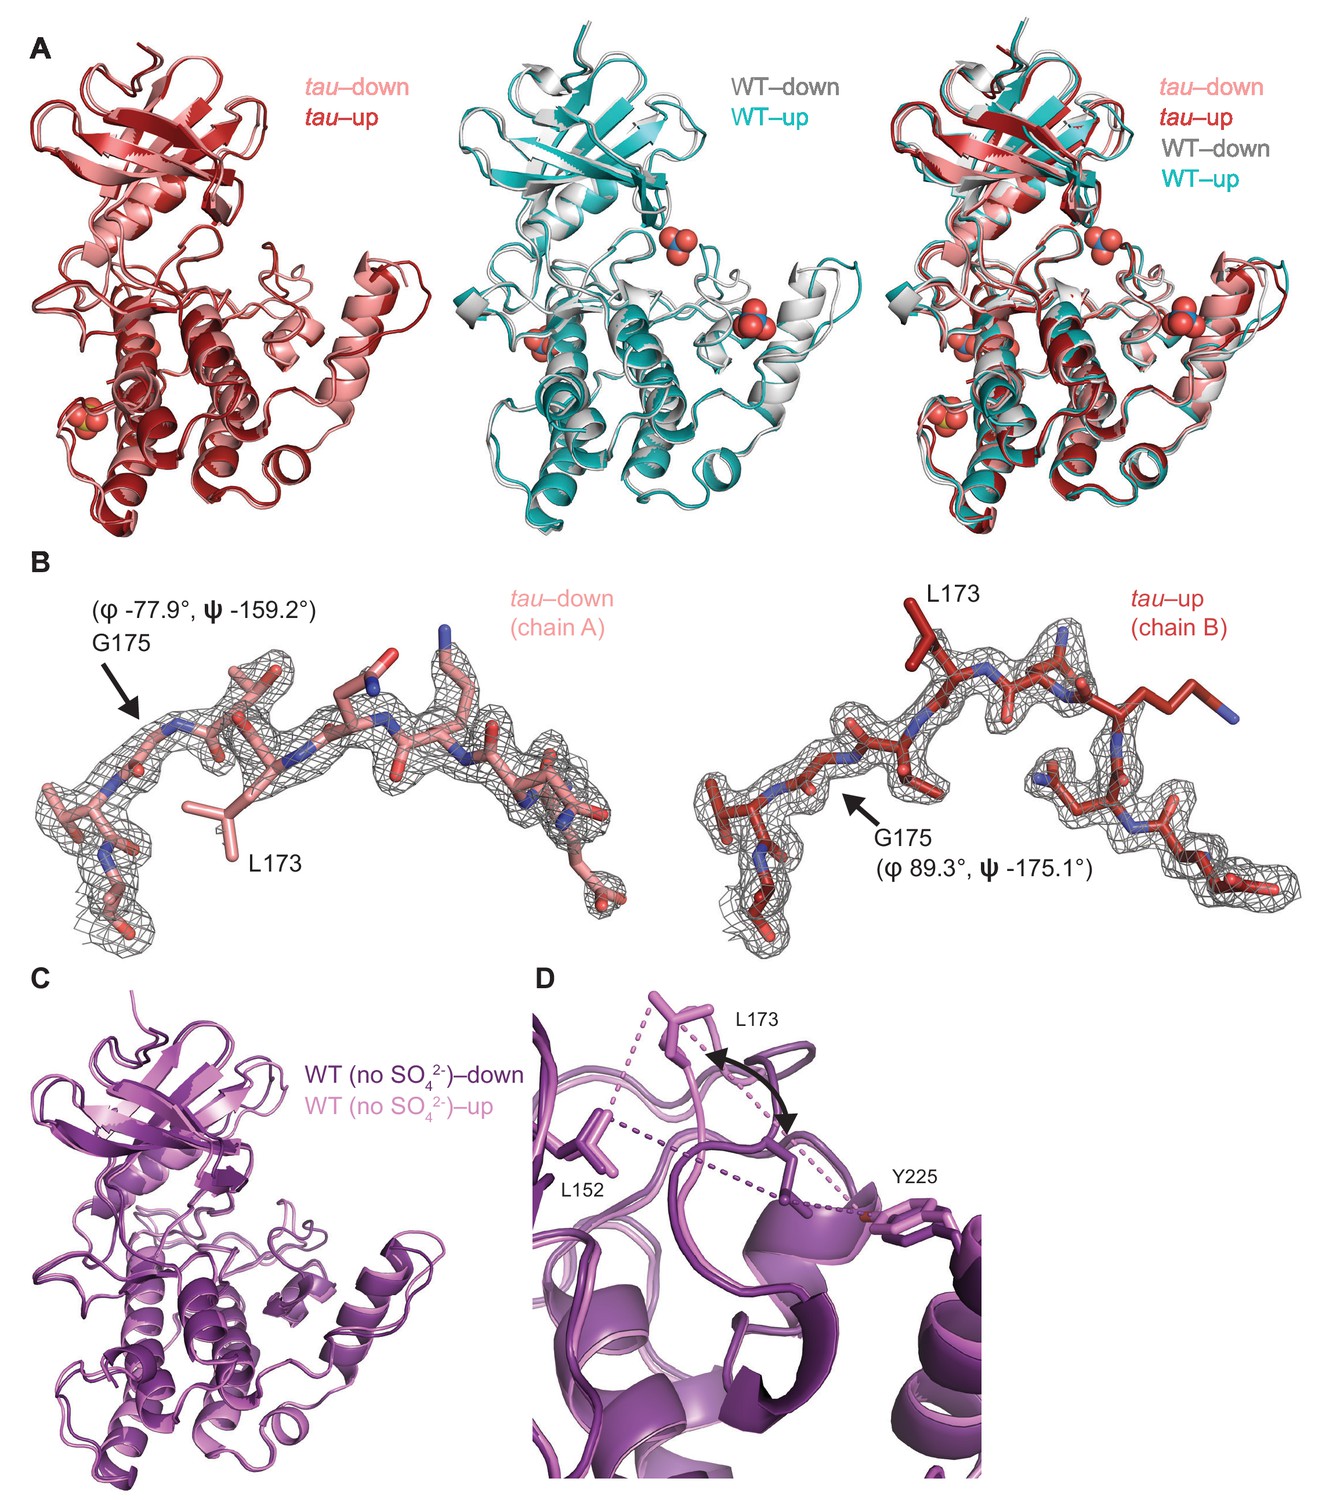
Crystallographic details of the CK1 activation loop switch.
(A) Overlay of the kinase domain of individual chains from tau (left, PDB: 6PXN, chains A (maroon) and B (salmon) with SO42-), WT (center, PDB: 1CKJ, chains A (cyan) and B (gray) with WO42-), and a comparison of all four (right). Note: Anion binding occurs at Site 1 in both chains of the WT kinase, while anion binding at Site 2 only occurs when the activation loop switch is in the down conformation of WT (chain B, gray). (B) 2Fo-Fc omit maps of the activation loop in tau chain A and B (residues 167–177) contoured at 1 σ. (C) Overlaid view of the activation loop switch in the two chains of WT CK1δ ΔC crystallized in sulfate-free conditions (PDB: 6PXO, chains A (purple) and B (violet)). (D) The position of L173 CD2 relative to either L152 CD2 or Y225 OH reports on the conformation of the activation loop in the ‘loop down’ (purple) or ‘loop up’ (violet) conformation in WT CK1δ grown in sulfate-free conditions (PDB: 6PXO).
Figure 4 with 1 supplement

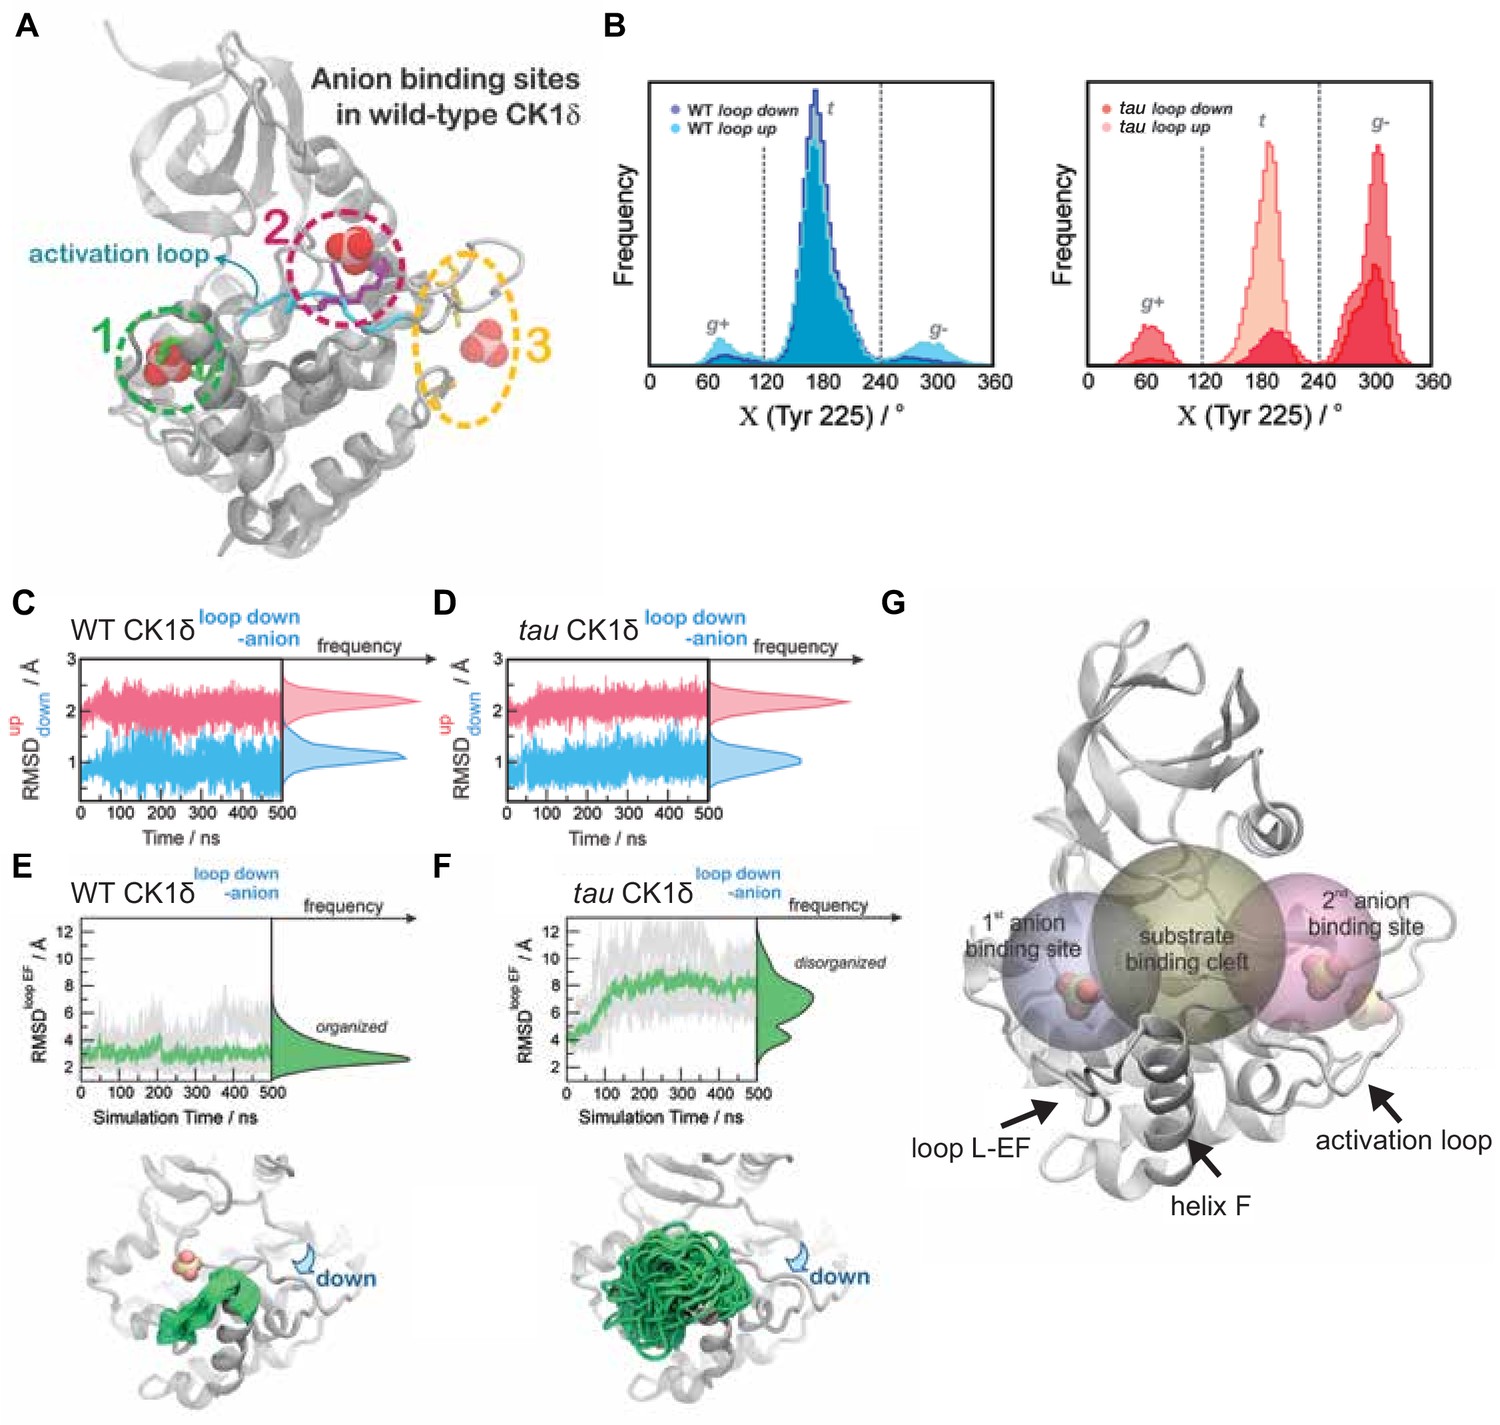
Probing the dynamics of CK1δ with GaMD simulations.
(A-D) Stability of the activation loop assessed by the RMSD of residues 168–175 with respect to the ‘loop down’ (RMSDdown, blue) or ‘loop up’ conformation (RMSDup, pink), as observed in the crystal structure. For each system, the RMSDs from all five MD replicas are superimposed. Panel A, WT CK1δloop down; (B) tau CK1δloop down; C, WT CK1δloop up; D, tau CK1δloop up. (E-H) Dynamics of the EF loop assessed by the RMSD of residues 213–224 with respect to the initial structure. For each system, the RMSD was calculated for individual replica (gray lines, n = 5) and then averaged (green). The molecular representations in panels E-H show the crystallographic structure of CK1δ (gray) superimposed with snapshots of the L-EF loop extracted from the GaMD simulations (green). When present in the crystal structure and the simulation, sulfate anions are represented by spheres. I-L, Alterations in anion and substrate-binding clefts arise from the activation loop switch and tau mutation. Volumes for the binding clefts were extracted and averaged from GaMD simulations in the four states: panel I, WT CK1δloop down; J, WT CK1δloop up; K, tau CK1δloop down; L, tau CK1δloop up. Water and anions were removed from the analysis. Volumetric maps are contoured at 0.1 and represent regions that were consistently open during the simulations. See also Figure 4—figure supplement 1 and Supplementary file 1d for more information.
Figure 4—figure supplement 1
Additional details for GaMD simulations.
(A) Defining the localization of anion binding sites 1 (green), 2 (magenta) and 3 (yellow) for MD simulations. For reference, the loop down conformation of WT CK1δ is represented as ribbons (cyan). (B) Residue Y225 displays more conformational freedom in the tau mutant (right panel) than in WT CK1δ (left panel). Populations of the gauche+ (g+), trans (t) and gauche- (g-) rotamers for Y225 from MD simulations of the loop up and loop down conformations of WT and tau kinase are depicted. (C-D) Stability of the activation loop assessed by the Root Mean Square Deviation (RMSD) of residues 168–175 with respect to the loop down conformation (RMSDdown, blue) or to the loop up conformation (RMSDup, magenta) as observed in the crystal structures. For both systems, the Site 2 anion was removed computationally before beginning MD simulations. Panel C, WT CK1δloop down; D, tau CK1δloop down; both show RMSDs superimposed from all five MD replicas. (E-F) Dynamics of the L-EF loop obtained from Gaussian Accelerated MD simulations in WT CK1δ (panel E) and tau mutant (panel F) when the activation loop in the ‘down’ conformation and the second anion binding site has been removed computationally. The RMSD was calculated for the backbone atoms of residues 213–224 for each independent replica (gray, n = 5) and then averaged (green). The molecular representations show crystallographic structures of the enzyme (in gray) superimposed with several snapshots of the loop L-EF extracted from the Gaussian Accelerated MD (GaMD) simulations (in green). When present, sulfate anions are represented by van der Waals spheres. G, Volumetric analysis of the Site 1 binding site (gray sphere), substrate binding cleft (golden sphere) and Site 2 anion binding site (rose sphere) during the GaMD simulations. In each system, the volumes were calculated for snapshots extracted from the GaMD trajectories every 2 ns, using POVME 3.0 (Wagner et al., 2017). Water and ions were computationally removed prior to volume calculations.
Figure 5 with 1 supplement
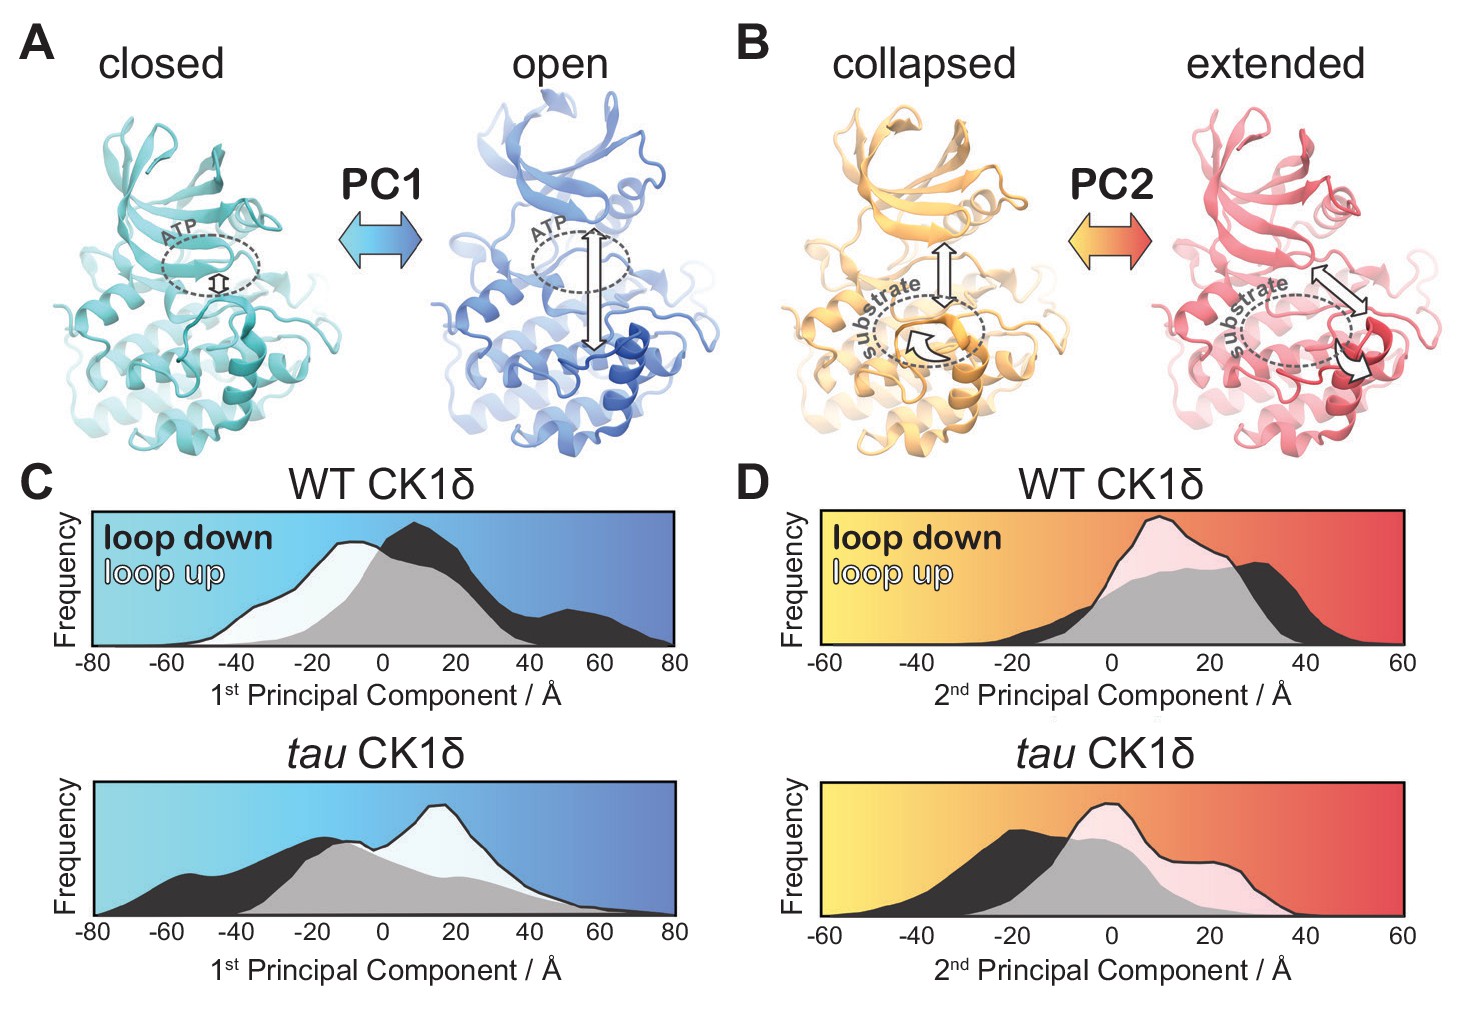
tau influences the principal modes of motion in CK1δ.
(A) PC1 consists of an ‘open-and-close’ movement achieved by dislocation of the N-lobe with respect to the top of the helix F to control accessibility of the ATP-binding site (dotted circle). (B) PC2 consists of a twisting movement of N-lobe with respect to the top of helix F and significant rearrangement of the loop L-EF, which can be extended or collapsed against the substrate binding site (dotted circle). (C-D) Structural representations correspond to (panel A) PC1 = −80 Å (cyan), PC1 = 80 Å (blue) and (panel B) PC2 = −60 Å (orange), and PC2 = 60 Å (red). The histograms represent projections of the accumulated GaMD trajectories along the 1st (C) or 2nd (D) principal components for WT CK1δ and the tau mutant, either in the activation ‘loop down’ (black) or ‘loop up’ (white) conformations. See also Figure 5—figure supplement 1 and Video 1.
Figure 5—figure supplement 1

Details of the principal modes of motion.
(A) Percent of atomic fluctuations contained in each of the principal modes of motion (eigenvectors) obtained from the Principal Component Analysis of the all GaMD trajectories. The 1st and 2nd modes of motions (highlighted in red) contain 18.2% and 14.3% of the total atomic fluctuations displayed by the backbone atoms, respectively. (B) cumulative sum of the relative atomic fluctuations displayed in panel A, showing that, if combined, the 1st and 2nd modes of motions contain more than 30% of the total atomic fluctuations of the backbone atoms. (C) 1st principal mode of motion corresponds to an ‘open-and-close’ movement of the enzyme, achieved mainly by dislocation of the N-terminal lobe (N-lobe) with respect to the top of the helix F. (D) 2nd principal mode of motion corresponds to a twisting movement of the N-lobe with respect to the top of helix F and significant rearrangement of loop L-EF, which can either be extended or collapsed.
Figure 6 with 1 supplement

Proximity of CK1 alleles map to catalytic and substrate binding sites.
(A) Structure of CK1δ (PDB: 1CKJ, chain B) clock relevant alleles mapped from mammalian CK1 or Drosophila DBT. Mutants are colored by phenotype: short period (blue), long period (green), loss of function (gray). DFG catalytic motif, cyan. (B) View of N-lobe period mutants and the regulatory spine (R-spine, purple) with F155 of the DFG motif in cyan. Polar interactions between Q51 and G156 that link the N- and C-lobe are depicted with a dashed black line. (C) Alignment of the mammalian and Drosophila Degron and FASP/stabilizing sequences. Residues in bold have experimental support for phosphorylation. Dashed arrows indicate sequential phosphorylation following the consensus pSxxS motif.
Figure 6—figure supplement 1
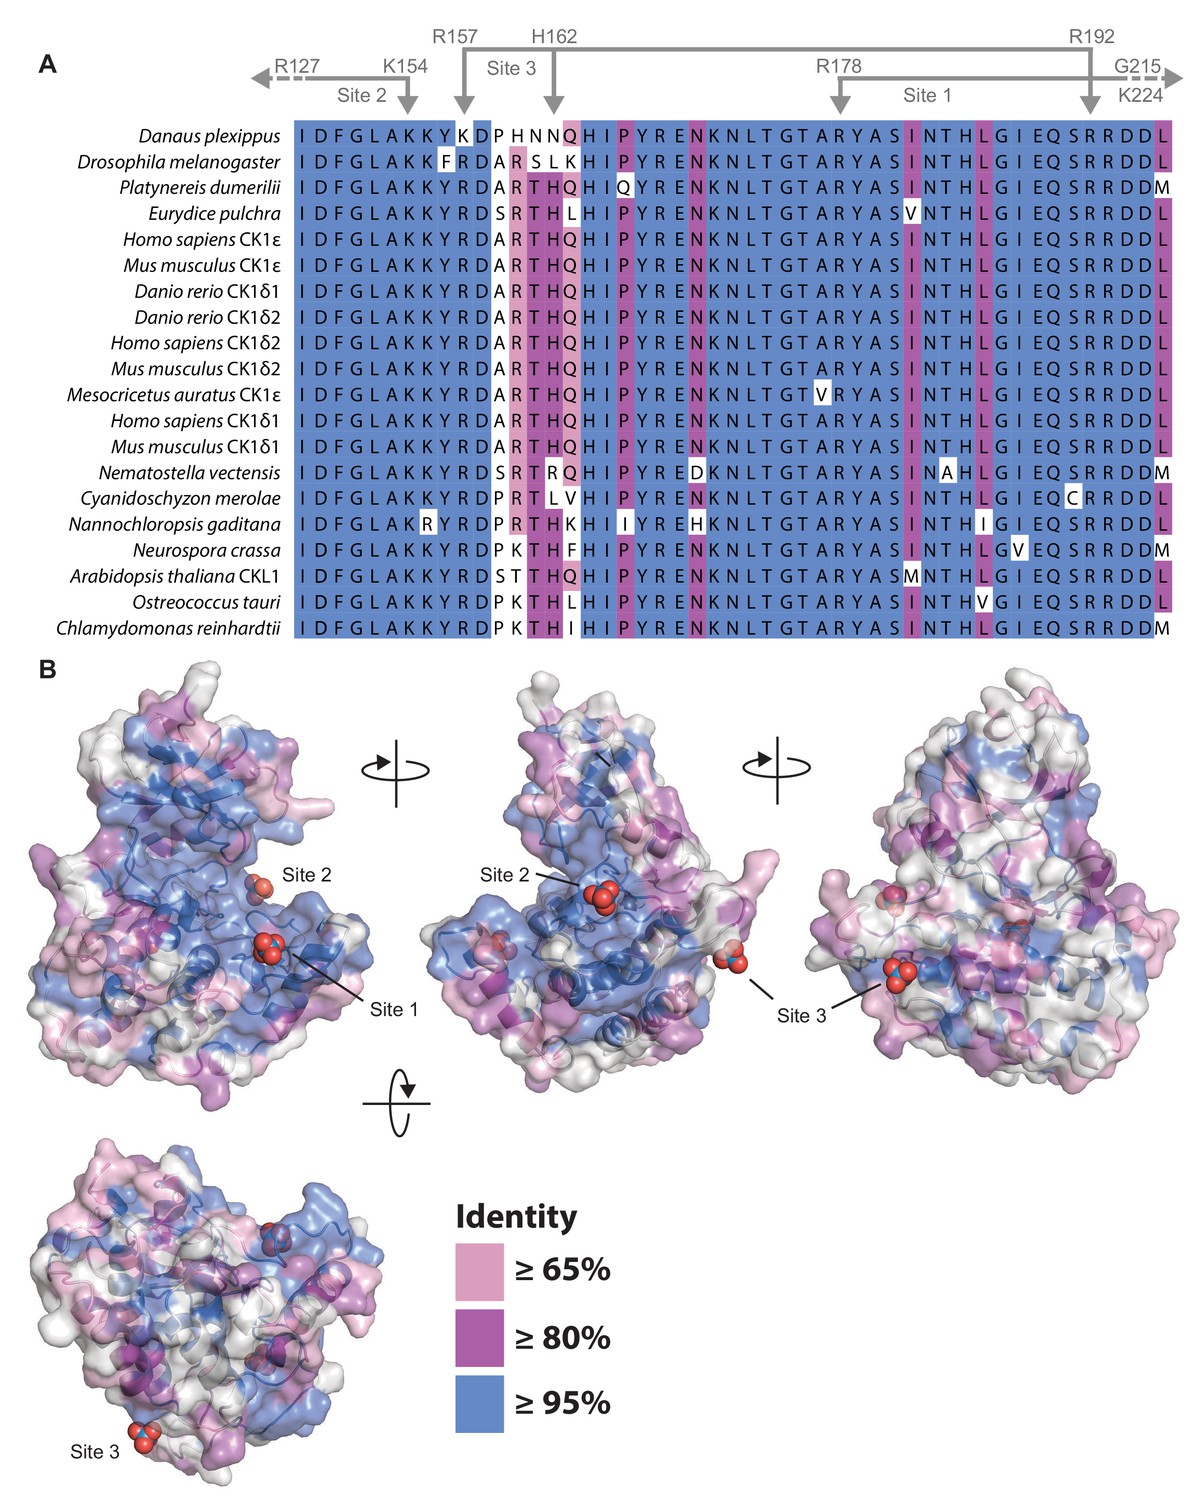
Conservation of CK1δ/ε in eukaryotes.
(A) Alignment of the central catalytic DFG motif and activation loop of CK1ε and CK1δ (including isoforms δ1 and δ2 that differ only in the last 15 amino acids Fustin et al., 2018; Narasimamurthy et al., 2018) that have been implicated in circadian regulation of the following species: Danaus plexippus (Reppert et al., 2016); Drosophila melanogaster (Kloss et al., 1998; Price et al., 1998); Platynereis dumerilii (Zantke et al., 2013); Eurydice pulchra (Zhang et al., 2013); Homo sapiens (Beale et al., 2019; Toh et al., 2001; Xu et al., 2005; Xu et al., 2007); Mus musculus (Fustin et al., 2018; Meng et al., 2008); Danio rerio (Smadja Storz et al., 2013), Mesocricetus auratus (Ralph and Menaker, 1988); Nematostella vectensis (Oren et al., 2015); Cyanidoschyzon merolae (Matsuzaki et al., 2004); Nannochloropsis gaditana (Poliner et al., 2019); Neurospora crassa (Görl et al., 2001); Arabidopsis thaliana (Uehara et al., 2019); Ostreococcus tauri (van Ooijen et al., 2013); and Chlamydomonas reinhardtii (Boesger et al., 2012; Boesger et al., 2014). When only one CK1δ/ε-like homolog was identified in an organism, no gene name is shown in the alignment. Coloring indicates the degree of conservation, with ≥95% identity in blue, ≥80% identity in purple, ≥65% identity in pink, and <65% identity in white. Residues that coordinate anion binding on CK1 are indicated above in gray. (B) Conservation from the kinase domain alignment mapped onto the WT CK1δ kinase domain (PDB: 1CKJ, chain B). The binding sites for three highly conserved anion are indicated.
Figure 7 with 1 supplement
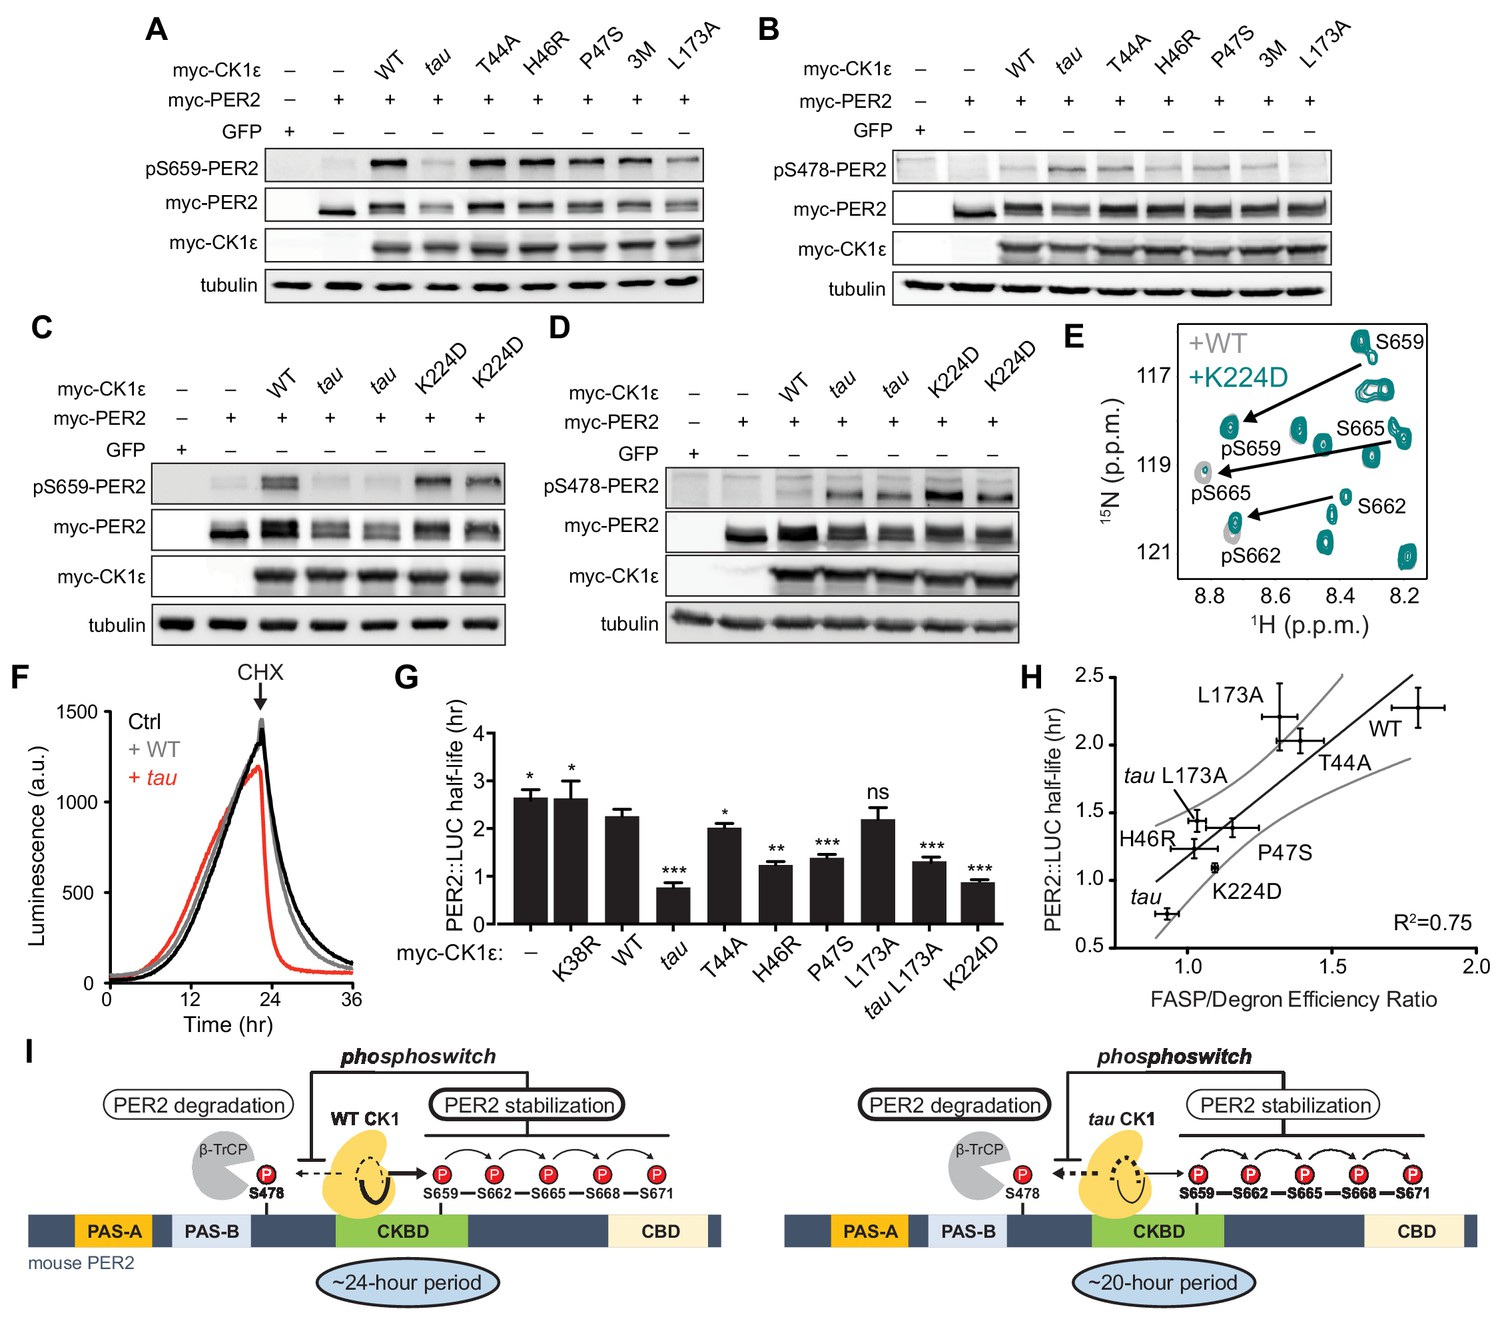
Substrate discrimination on the PER2 phosphoswitch is regulated by the CK1 activation loop switch.
(A,B) Western blot of FASP priming site, detecting pS659 (A) or Degron site, detecting pS478 (B) phosphorylation on mouse myc-PER2 in HEK293 cell lysates after transfection with indicated myc-CK1ε expression plasmids. 3M triple mutant: T44A, H46R, P47S. Representative blot from n = 3 shown. (C,D) Western blot of FASP priming (C) or Degron (D) phosphorylation on PER2 as above with the myc-CK1ε K224D mutant. Representative blot from n = 3 shown with replicate samples loaded for tau and K224D. (E) Overlaid 15N/1H HSQC spectra at 3 hr timepoint in the NMR kinase assay on 200 µM 15N FASP + 1 μM K224D (teal) or WT (gray) CK1δ ΔC. Arrows, phospho-specific peaks corresponding to pS659, pS662, and pS665. (F) Representative real-time luminescence data for PER2::LUC stability in HEK293 cells transfected with myc-PER2::LUC plus empty vector (black) or myc-CK1ε WT (gray) or tau (red) as indicated (n = 4). 40 µg/mL cycloheximide (CHX) added 24 hr post-transfection (arrow). (G) Quantification of PER2::LUC half-life with different myc-CK1ε mutants. Data represent mean ± s.d. (n = 4) with significance assessed as above. (H) Scatterplot with linear regression analysis of the ratio of enzyme efficiencies (kcat/Km) for FASP and Degron relative to the PER2::LUC half-life determined in panel G and Figure 7—figure supplement 1. All data are plotted as mean ± s.d. (n = 4 for PER2::LUC and n = 3–4 for enzyme efficiencies). Black, linear regression to data; gray, 95% confidence interval. (I) The conformational switch of the CK1δ/ε activation loop is coupled to substrate selection in the PER2 phosphoswitch. Left, the activation loop of the WT kinase is stable in the ‘loop down’ conformation, leading to preferential phosphorylation the FASP region, which stabilizes PER2 by reducing phosphorylation of the Degron. Right, the activation loop of tau kinase is better tolerated in the alternate ‘loop up’ conformation leading to an intrinsic gain of kinase function on the Degron and loss of kinase function on the stabilizing FASP region. This switch in substrate preference promotes PER2 degradation and leads to a shorter circadian period. CKBD, CK1 binding domain; CBD, CRY binding domain. See also Figure 7—figure supplement 1.
Figure 7—figure supplement 1
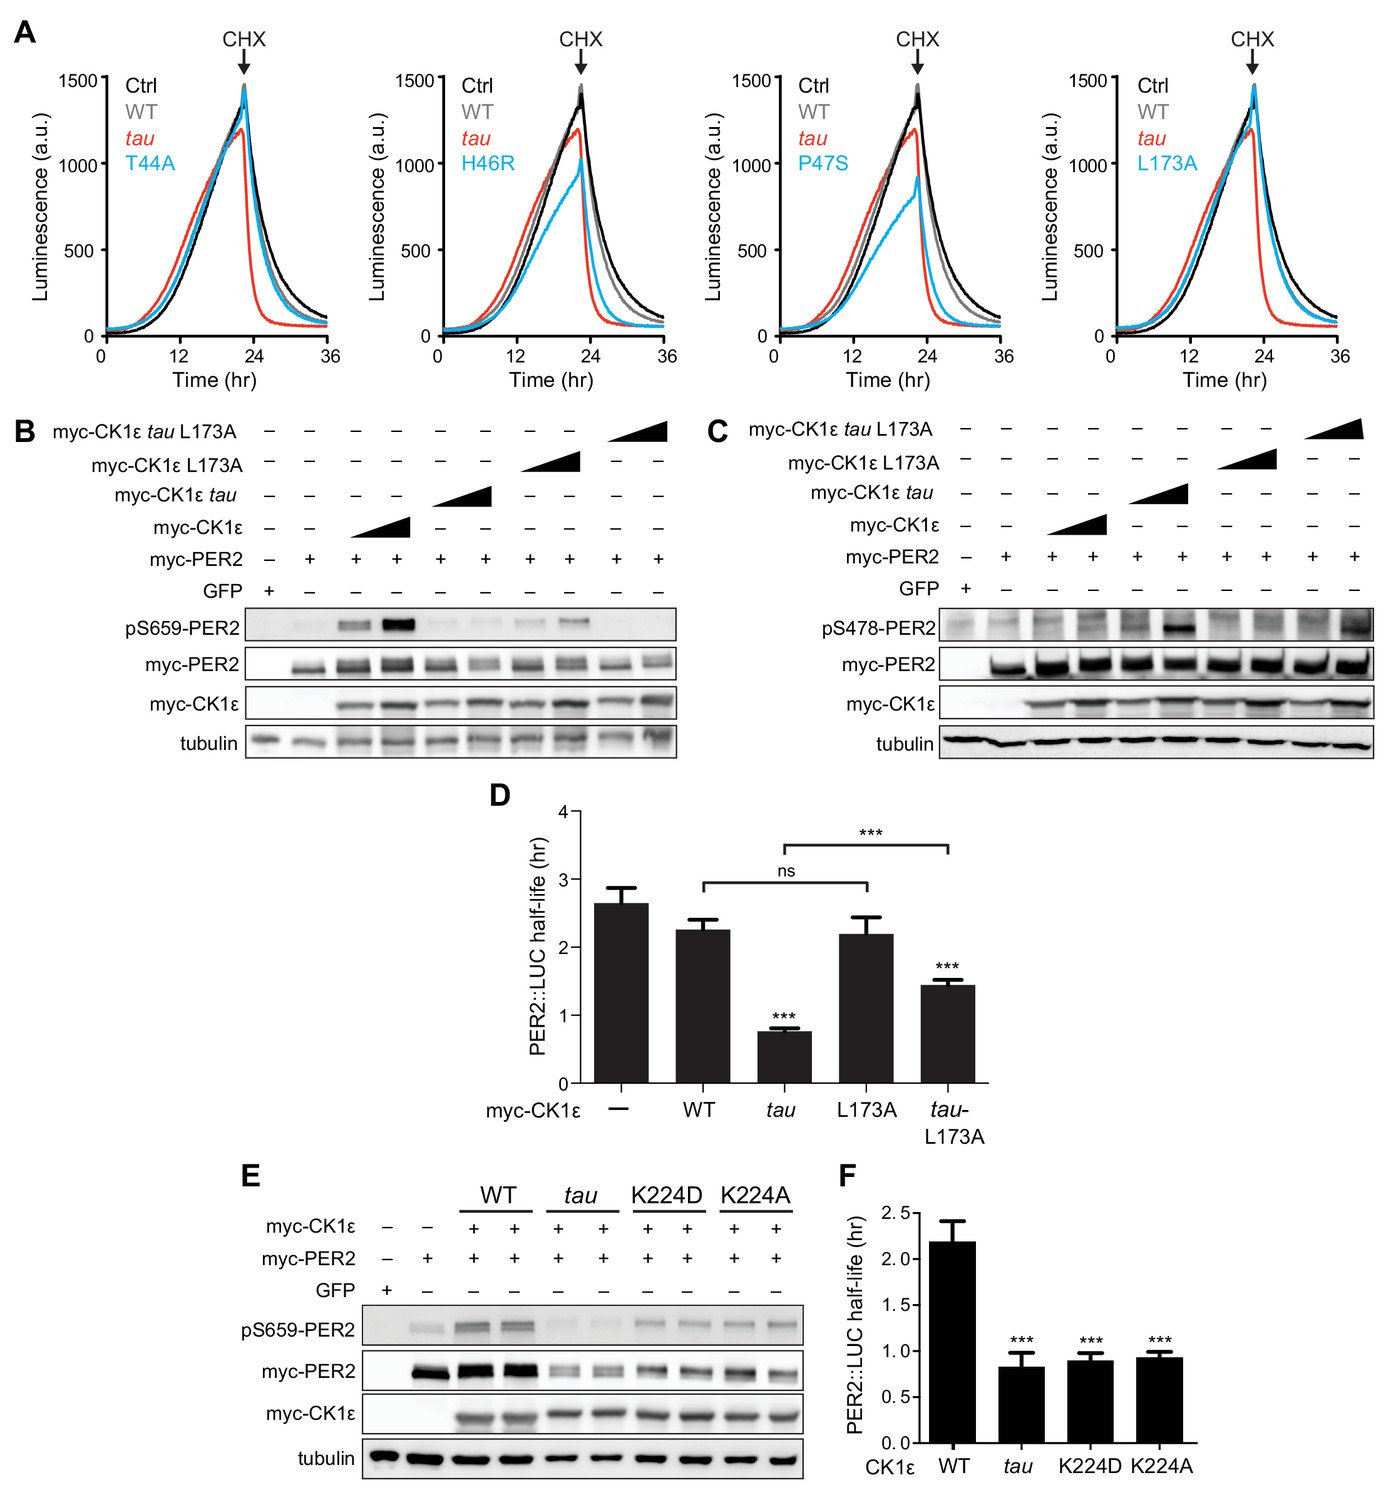
Effect of CK1 mutations on PER2 phosphorylation and stability.
(A) Representative real-time luminescence data for PER2::LUC stability in HEK293 cells transfected with mouse myc-PER2::LUC plus empty vector (black) or myc-CK1ε WT (gray) or mutants (red) as indicated (n = 4). 40 µg/mL cycloheximide (CHX) added 24 hr post-transfection (arrow). (B) Western blot of FASP priming phosphorylation at S659 on mouse myc-PER2 in HEK293 cell lysates after transfection with indicated myc-CK1ε expression plasmids. Representative blot from n = 3 shown. (C) Western blot of Degron phosphorylation at S478 on mouse myc-PER2 in HEK293 cell lysates after transfection with indicated myc-CK1ε expression plasmids. Representative blot from n = 3 shown. (D) Quantification of PER2::LUC half-life from transfection assays (as in panel A) with different myc-CK1ε mutants. Data represent mean ± s.d. (n = 4). (E) Western blot of FASP priming phosphorylation at S659 on mouse myc-PER2 in HEK293 cell lysates after transfection with indicated myc-CK1ε expression plasmids. Representative blot from n = 3 shown. (F) Quantification of PER2::LUC half-life from transfection assays (as in panel A) with myc-CK1ε mutants from panel E. Data represent mean ± s.d. (n = 4).
Author response image 1
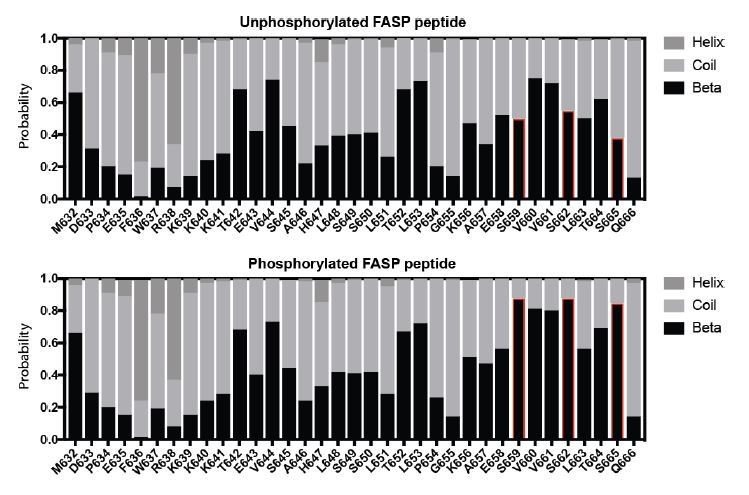
Secondary structure propensity of the FASP peptide.
Videos
Video 1
Principal Component Analysis of CK1δ normal modes.
The 1st principal mode of motion corresponds to an ‘open-and-close’ movement of the kinase, achieved mainly by dislocation of the N-terminal lobe (N-lobe) with respect to the top of the helix F. The 2nd principal mode of motion corresponds to a twisting movement of the N-lobe with respect to the top of helix F and significant rearrangement of loop L-EF, which can either be extended or collapsed.
Additional files
-
Supplementary file 1
Details of CK1 crystallography, enzyme kinetics, and simulated systems.
(A) X-ray crystallography data collection and refinement statistics. (B) Enzymatic efficiency of CK1δ ΔC (wild-type and mutants). (C) Survey of anion binding and activation loop conformation in CK1 family member structures. (D) Details of simulated systems.
- https://cdn.elifesciences.org/articles/52343/elife-52343-supp1-v1.xlsx
-
Supplementary file 2
CK1 family alleles and their circadian phenotypes.
- https://cdn.elifesciences.org/articles/52343/elife-52343-supp2-v1.xlsx
-
Transparent reporting form
- https://cdn.elifesciences.org/articles/52343/elife-52343-transrepform-v1.docx
Download links
A two-part list of links to download the article, or parts of the article, in various formats.
Downloads (link to download the article as PDF)
Open citations (links to open the citations from this article in various online reference manager services)
Cite this article (links to download the citations from this article in formats compatible with various reference manager tools)
Casein kinase 1 dynamics underlie substrate selectivity and the PER2 circadian phosphoswitch
eLife 9:e52343.
https://doi.org/10.7554/eLife.52343


