Primary cilia deficiency in neural crest cells models anterior segment dysgenesis in mouse
- Johns Hopkins University School of Medicine, United States
- Perelman School of Medicine, University of Pennsylvania, United States
- Rice University, United States
Figures
Figure 1 with 1 supplement

NCC of the periocular mesenchyme are ciliated.
(A) Representative eye section of a Wnt1-Cre;Ift88fx/+;mT/mG embryo at E14.5. NCC express the mG reporter (green cells) whereas cells from other embryonic origin express the mT reporter (red cells). Primary cilia were stained with an anti-Arl13b Ab and appear as small red rods. Scale bar, 50 μm. (B) Representative corneal stroma images of an Sstr3::GFP mouse at 3 months, in which primary cilia are GFP fluorescent. All stroma keratocytes are ciliated at adulthood. Scale bar, 50 μm. (C) Representative images of primary cilia in the corneal stroma and the periocular mesenchyme at E12.5. Scale bar, 0.5 μm. (D) Representative images of primary cilia in the corneal stroma at E15.5, E17.5, and P5. Scale bar, 1 μm. Primary cilia interact with neighboring cells or their cytoplasmic protrusions (red arrows). p, cytoplasmic protrusion.
Figure 1—figure supplement 1
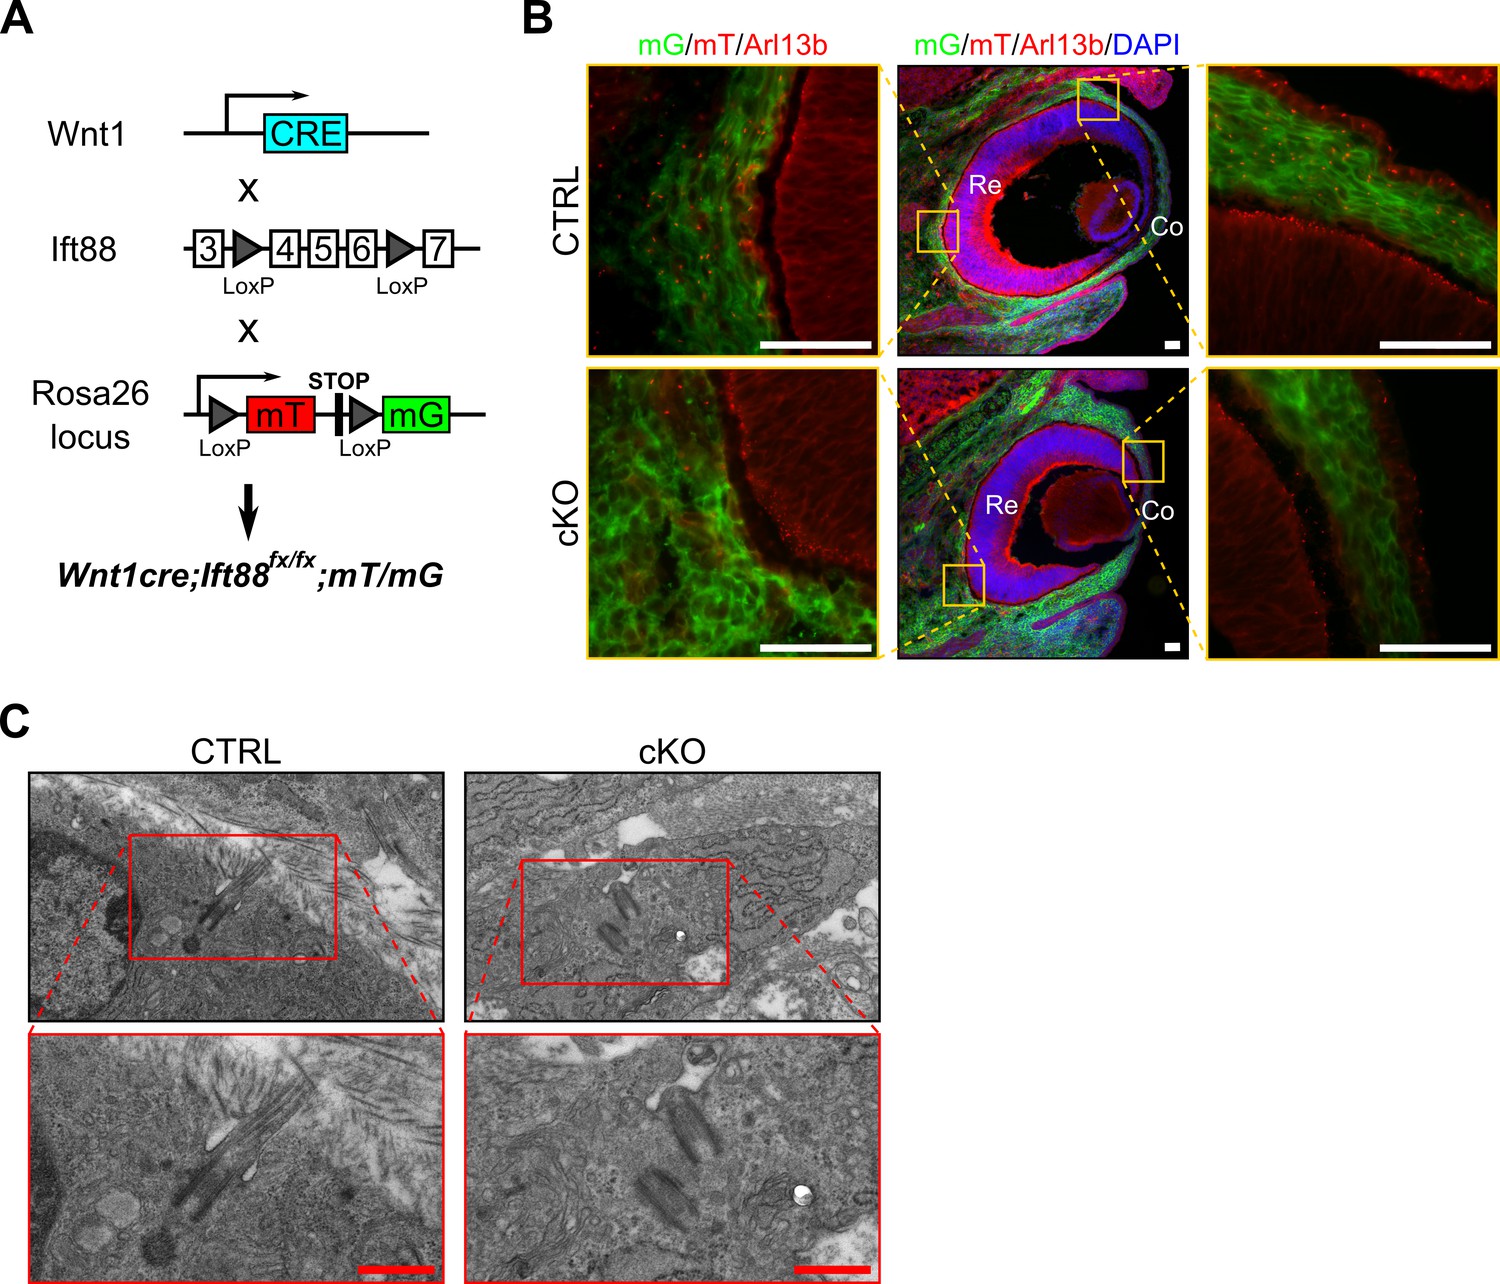
Genetic deletion of Ift88 in NCC leads to primary cilium ablation in NCC.
(A) Breeding strategy to generate NCC ciliary mutant and visualize Cre expression. (B) Representative eye sections of control and cKO embryos at E14.5. NCC express the mG reporter (green cells) whereas cells from other embryonic origin express the mT reporter (red cells). Primary cilia were stained with an anti-Arl13b Ab and appear as small red rods. Scale bar, 50 μm; Co, cornea; Re, retina. (C) Representative images of primary cilia in the corneal stroma at E17.5. In contrast to control, primary cilia do not assemble in cKO embryos. Scale bar, 0.5 μm.
Figure 2
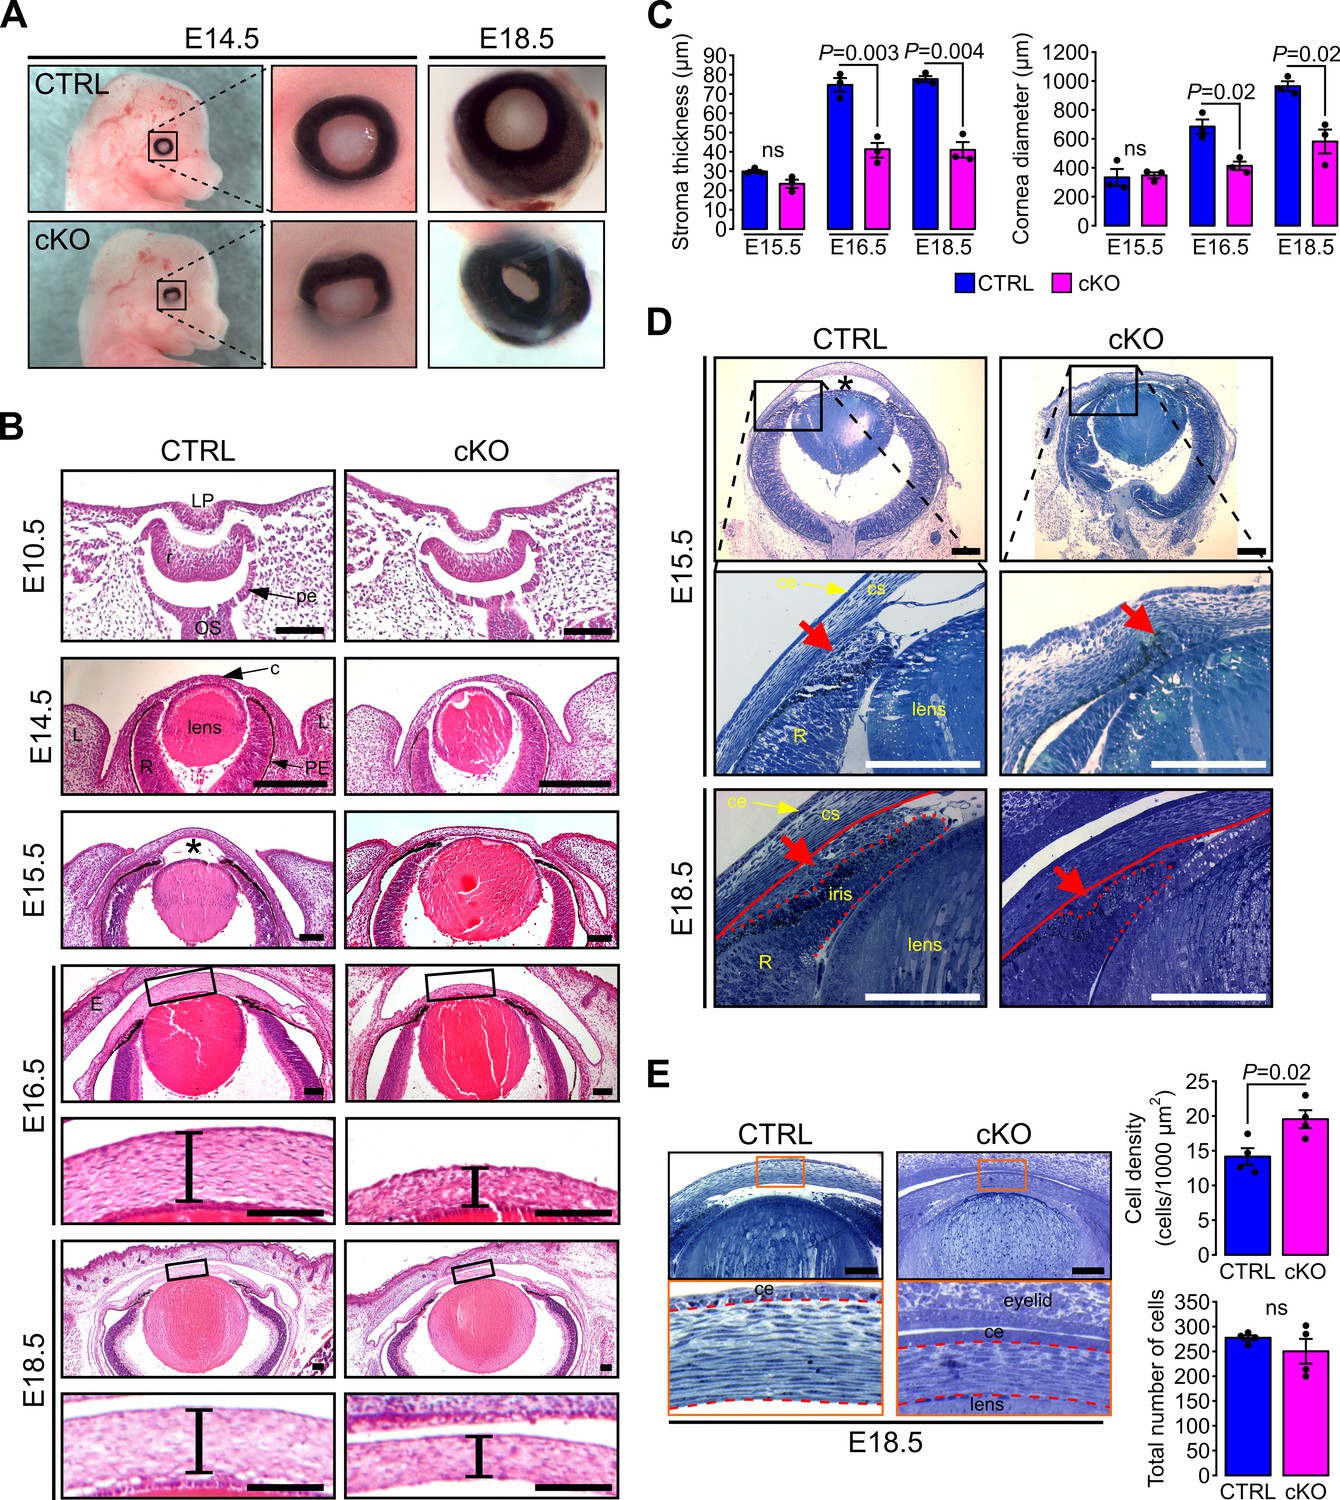
Primary cilium ablation in NCC leads to ASD phenotype.
(A) Representative images of control and cKO eyes at E14.5 and E18.5. Enlarged images show the misorientation of the eyeball in the cKO embryos at E14.5 and the reduced size of the cornea at E18.5. (B) Representative eye sections stained with HE of control and cKO embryos at E10.5, E14.5, E15.5, E16.5, and E18.5. Boxed regions indicate the areas shown at higher magnification below. Scale bar, 100 μm; *, anterior chamber; c, cornea; E, fused eyelids; L, lid fold; LP, lens pit; OS, optic stalk; pe, future pigment epithelium; PE, pigment epithelium; r, future neural retina; R, neural retina. (C) The corneal stroma thickness and the corneal diameter were measured in the center of the cornea on HE stained paraffin sections at E15.5, E16.5, and E18.5 (n = 3 embryos/group). (D) Representative plastic sections of the iridocorneal angle of control and cKO embryos at E15.5 and E18.5. Red arrows show the accumulation of mesenchymal cells between the cornea (underlined by the red line) and the presumptive iris (surrounded by the red dotted line). Scale bar, 150 μm; *, anterior chamber; ce, corneal epithelium; cs, corneal stroma; R, neural retina. (E) Representative plastic sections of corneas of control and cKO embryos at E18.5. Boxed regions indicate the areas shown at higher magnification below. Keratocytes were counted in the stroma which is surrounded by red dotted lines. The keratocyte density is significantly increased in cKO embryos compared to control but not the total number of cells (n = 4 embryos/group). Scale bar, 100 μm; ce, corneal epithelium. Data are presented as mean SEM. Statistical significance was assessed using two-tailed Student’s t-test. ns, non-significant, p≥0.05.
Figure 3 with 2 supplements
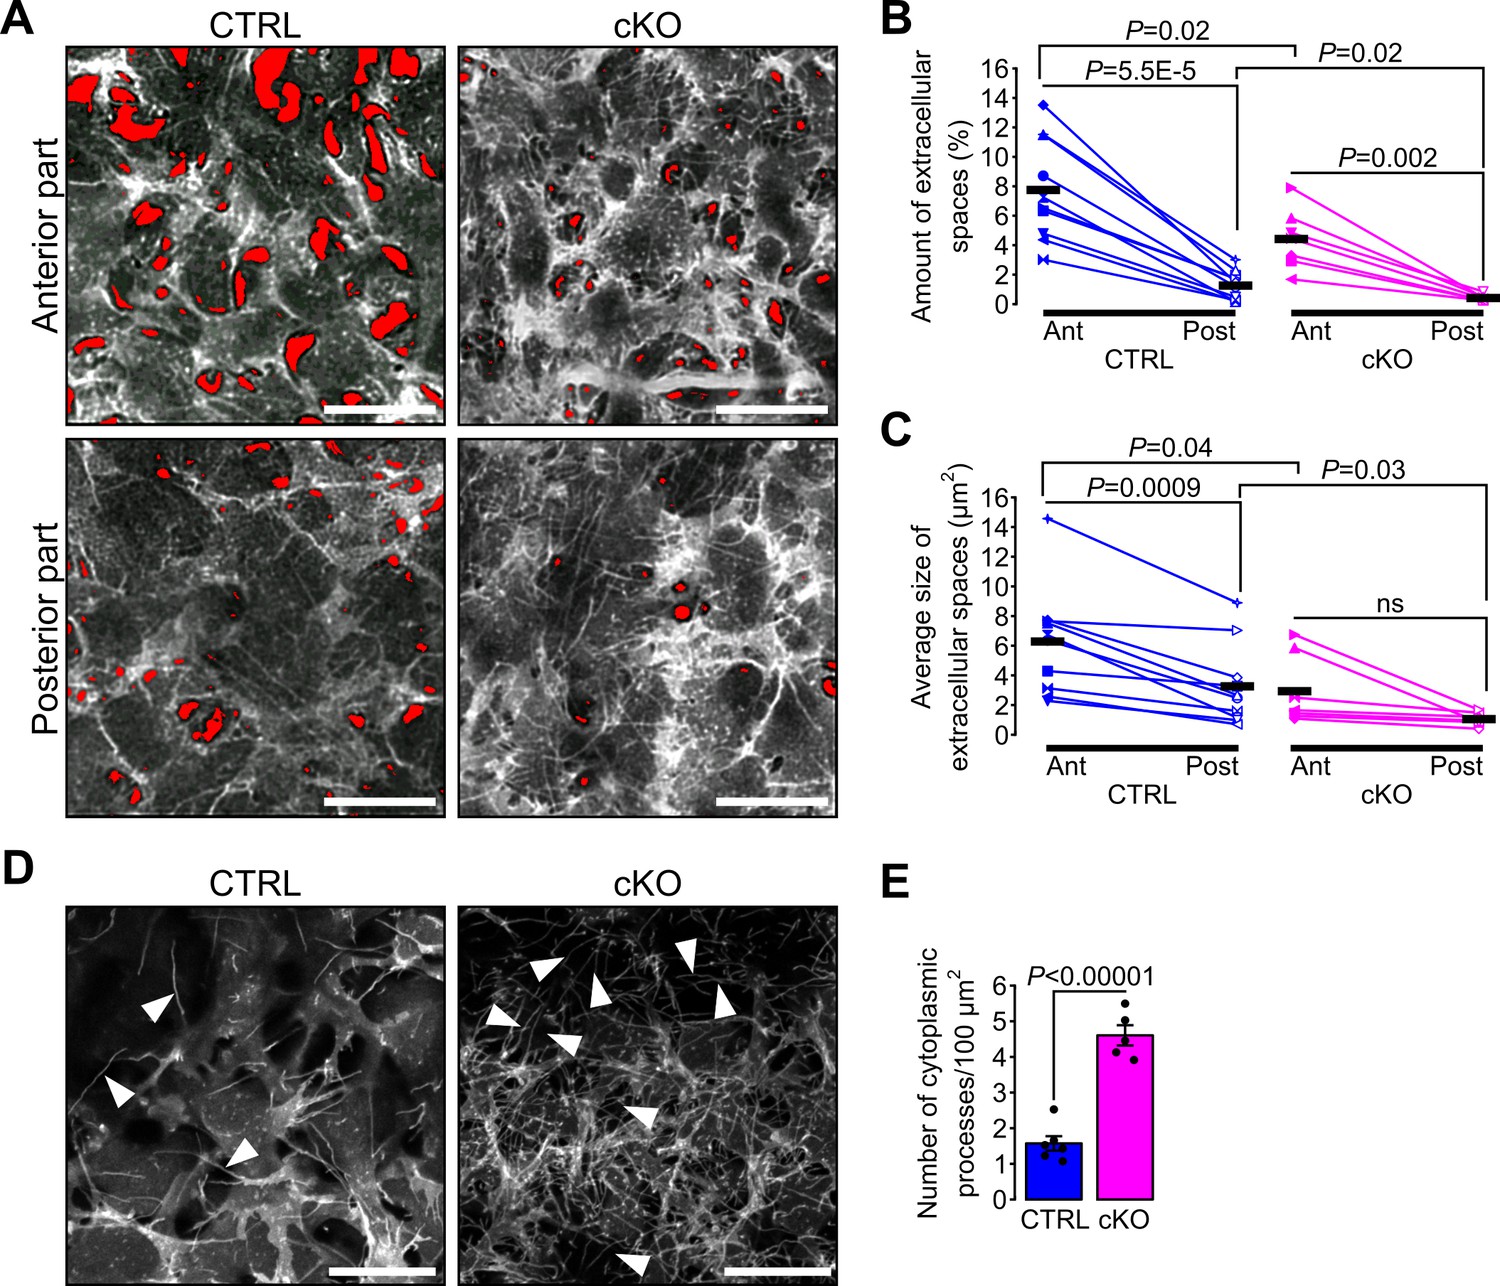
Primary cilium ablation in NCC impairs the spatial organization and the morphology of keratocytes.
(A) Representative ex vivo confocal optical sections taken at different levels (Anterior or Posterior) of the corneal stroma of E18.5 cKO and control embryos crossed with the mT/mG reporter. Here, only the mG fluorescent signal is displayed. The red areas indicate the extracellular spaces segmented with Ilastik. Images of the anterior and posterior parts were picked from the first tenth of the stroma underlying the corneal epithelium and from the last tenth of the stroma above the corneal endothelium, respectively. Scale bar, 25 μm. (B–C) Each symbol represents the mean value of the amount and the average size of the extracellular space areas (in red) measured in the anterior (filled symbols) and the posterior (empty symbols) parts of the corneal stroma of a single embryo. Paired values in the graphs are connected by a solid line. Scatterplots show that the amount of extracellular spaces is significantly lower in the posterior part of the corneal stroma of both genotypes, but the average size of extracellular spaces is only significantly reduced in the posterior part of the control embryos (n = 10 control, n = 7 cKO, one symbol/embryo). Black lines represent the mean value of each group. Statistical significance was assessed using unpaired two-tailed Student’s t-test (CTRL vs cKO), and using paired two-tailed Student’s t-test (Ant vs Post). ns, non-significant, p≥0.05. (D) Representative maximum intensity projections of the first layer of stromal keratocytes underlying the corneal epithelium (only the mG reporter is displayed). Cytoplasmic processes (white arrowheads) are more numerous in the cKO embryos. Scale bar, 20 μm. (E) Quantification of the number of cytoplasmic processes in the first layer of keratocytes underlying the corneal epithelium (n = 5–6 embryos/group). Data are presented as mean SEM. Statistical significance was assessed using two-tailed Student’s t-test.
Figure 3—figure supplement 1
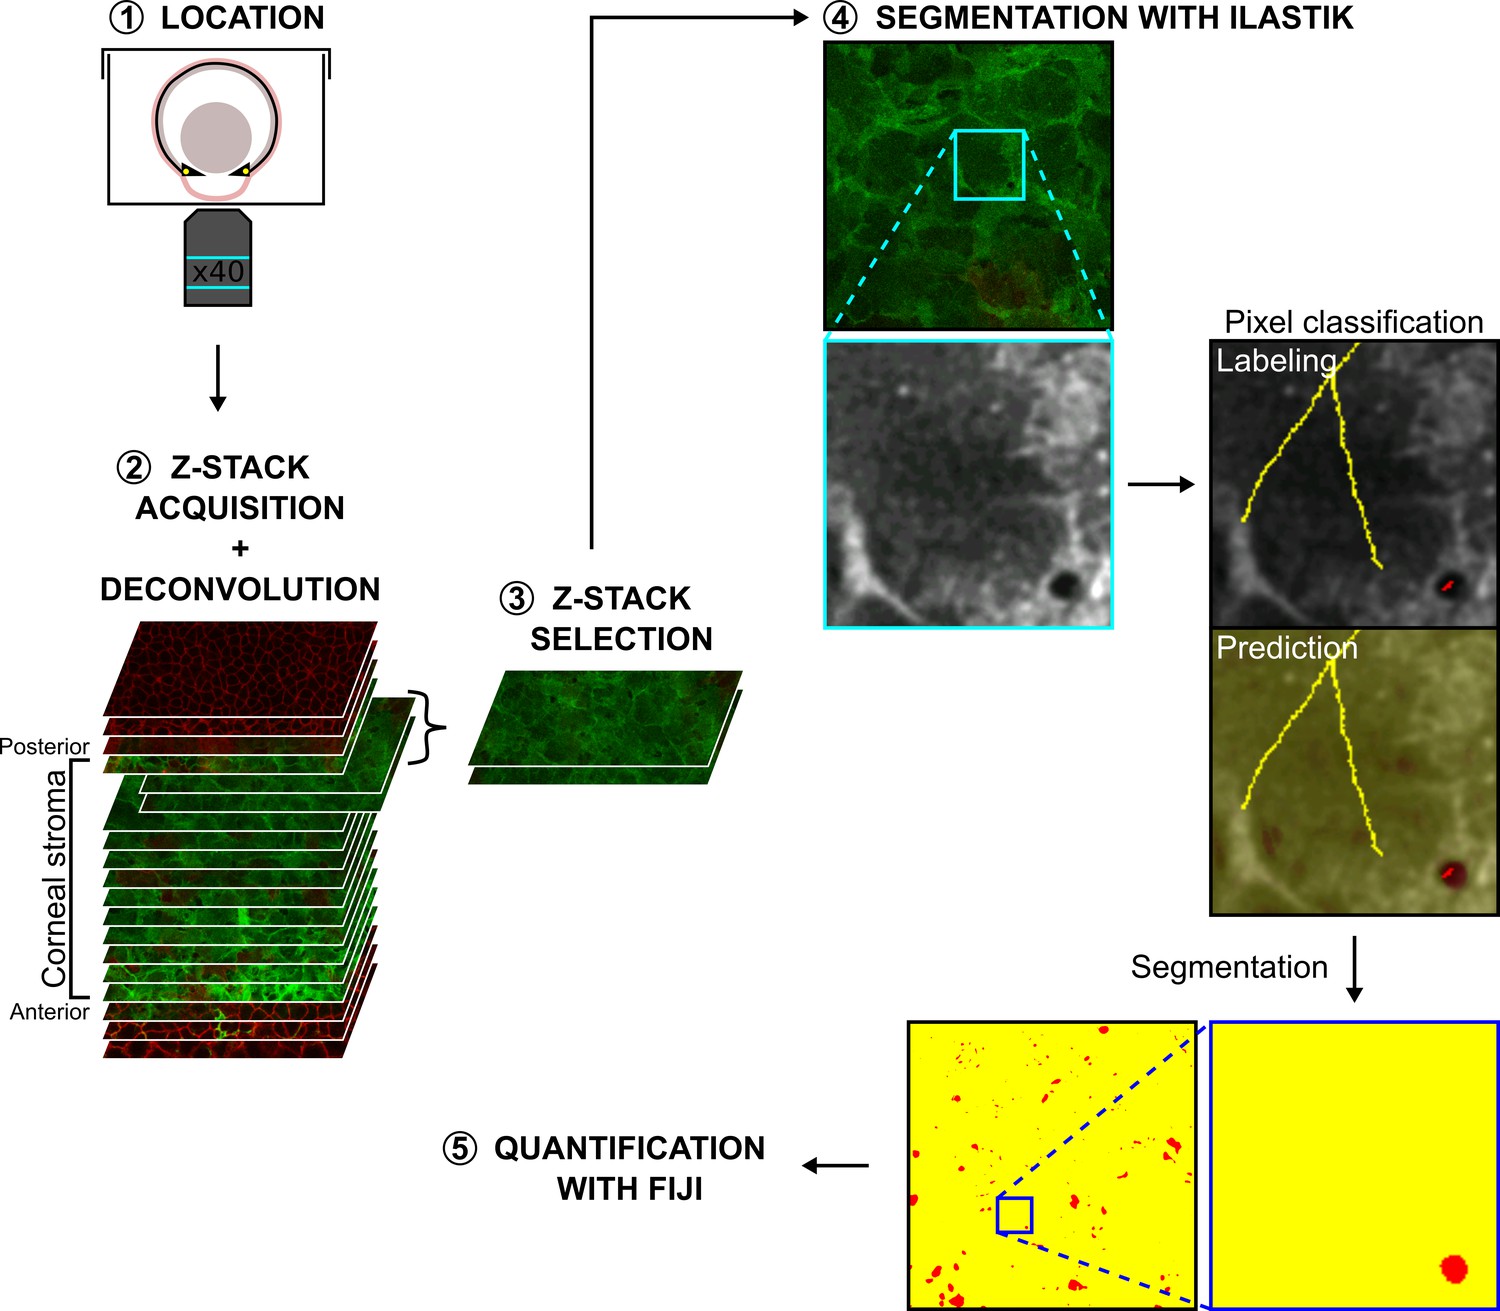
Segmentation of the extracellular spaces with Ilastik to study corneal stroma organization.
1. An enucleated eye was placed with the cornea facing down on a glass-bottom microwell dish.2. A z-stack of confocal optical sections was acquired between the corneal epithelium and the lens epithelium, and then deconvoluted with AutoQuant X3. 3. z-sections corresponding to the area of interest (Anterior or Posterior) were selected. 4. After uploading the z-sections in Ilastik, a pixel classification was done to train the classifier to recognize pixels belonging to the cells or to the extracellular spaces. For this, a trained user manually labeled pixels with a different color for each class: cells were labeled in yellow and extracellular spaces in red. Boxed region indicates the area shown at higher magnification below. Various examples of each class were given to the classifier to optimize the segmentation. Quality of the segmentation was checked with the prediction by a trained user. 5. Segmented masks were then exported and the quantification of the amount and the average size of extracellular spaces were performed using Fiji.
Figure 3—figure supplement 2
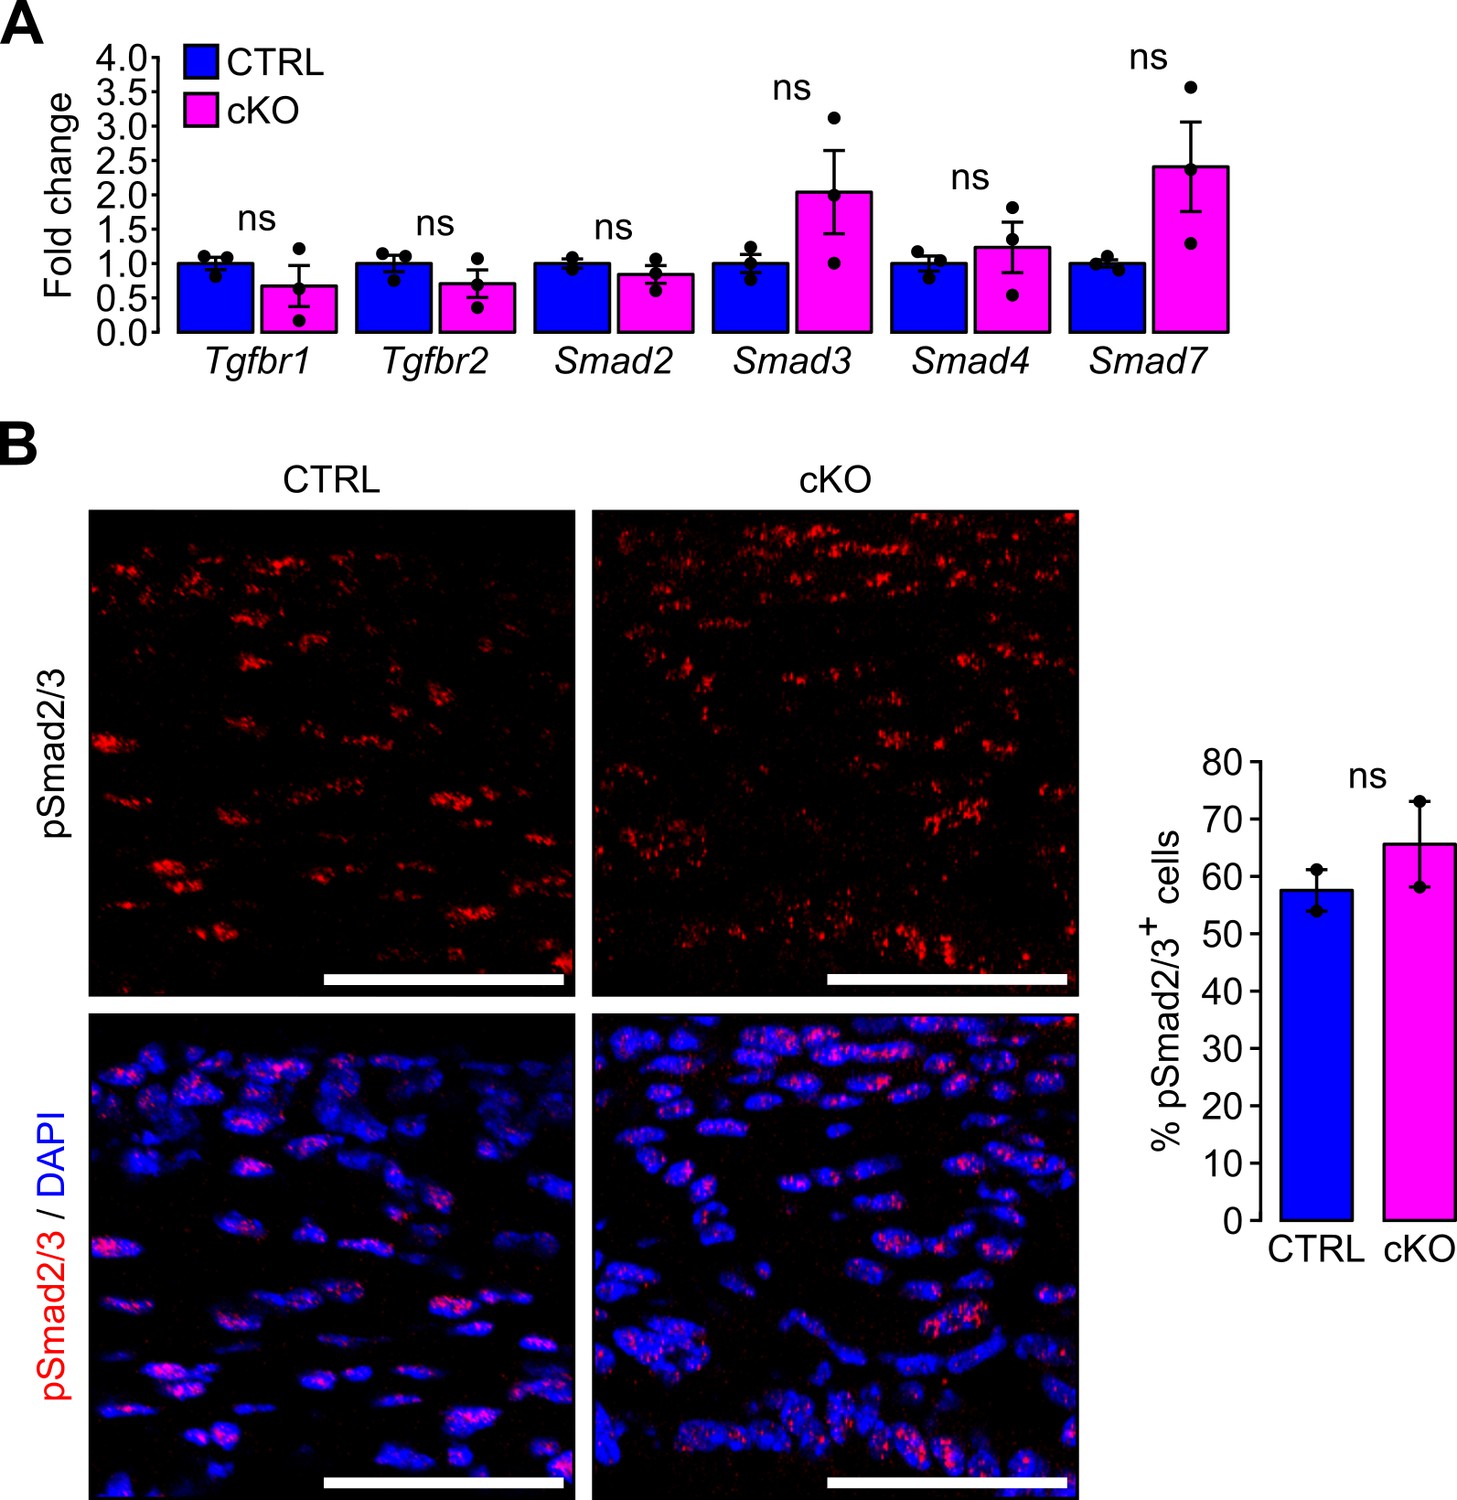
TGFβ signaling pathway is not affected by the primary cilium ablation in NCC.
(A) Gene expression was evaluated in corneas of E18.5 embryos by RT-qPCR. Data are mean ± SEM. Statistical significance was assessed using two-tailed Student’s t-test (n = 3 embryos/group). ns, non-significant, p≥0.05. (B) Immunostaining of phosphorylated Smad2/3 (pSmad2/3) in the corneas of E18.5 embryos. The proportion of pSmad2/3+ cells in the cornea is not affected by the primary cilium ablation in NCC. Scale bar, 50 μm. Data are mean ± SEM. Statistical significance was assessed using two-tailed Student’s t-test (n = 2 embryos/group). ns, non-significant, p≥0.05.
Figure 4 with 1 supplement
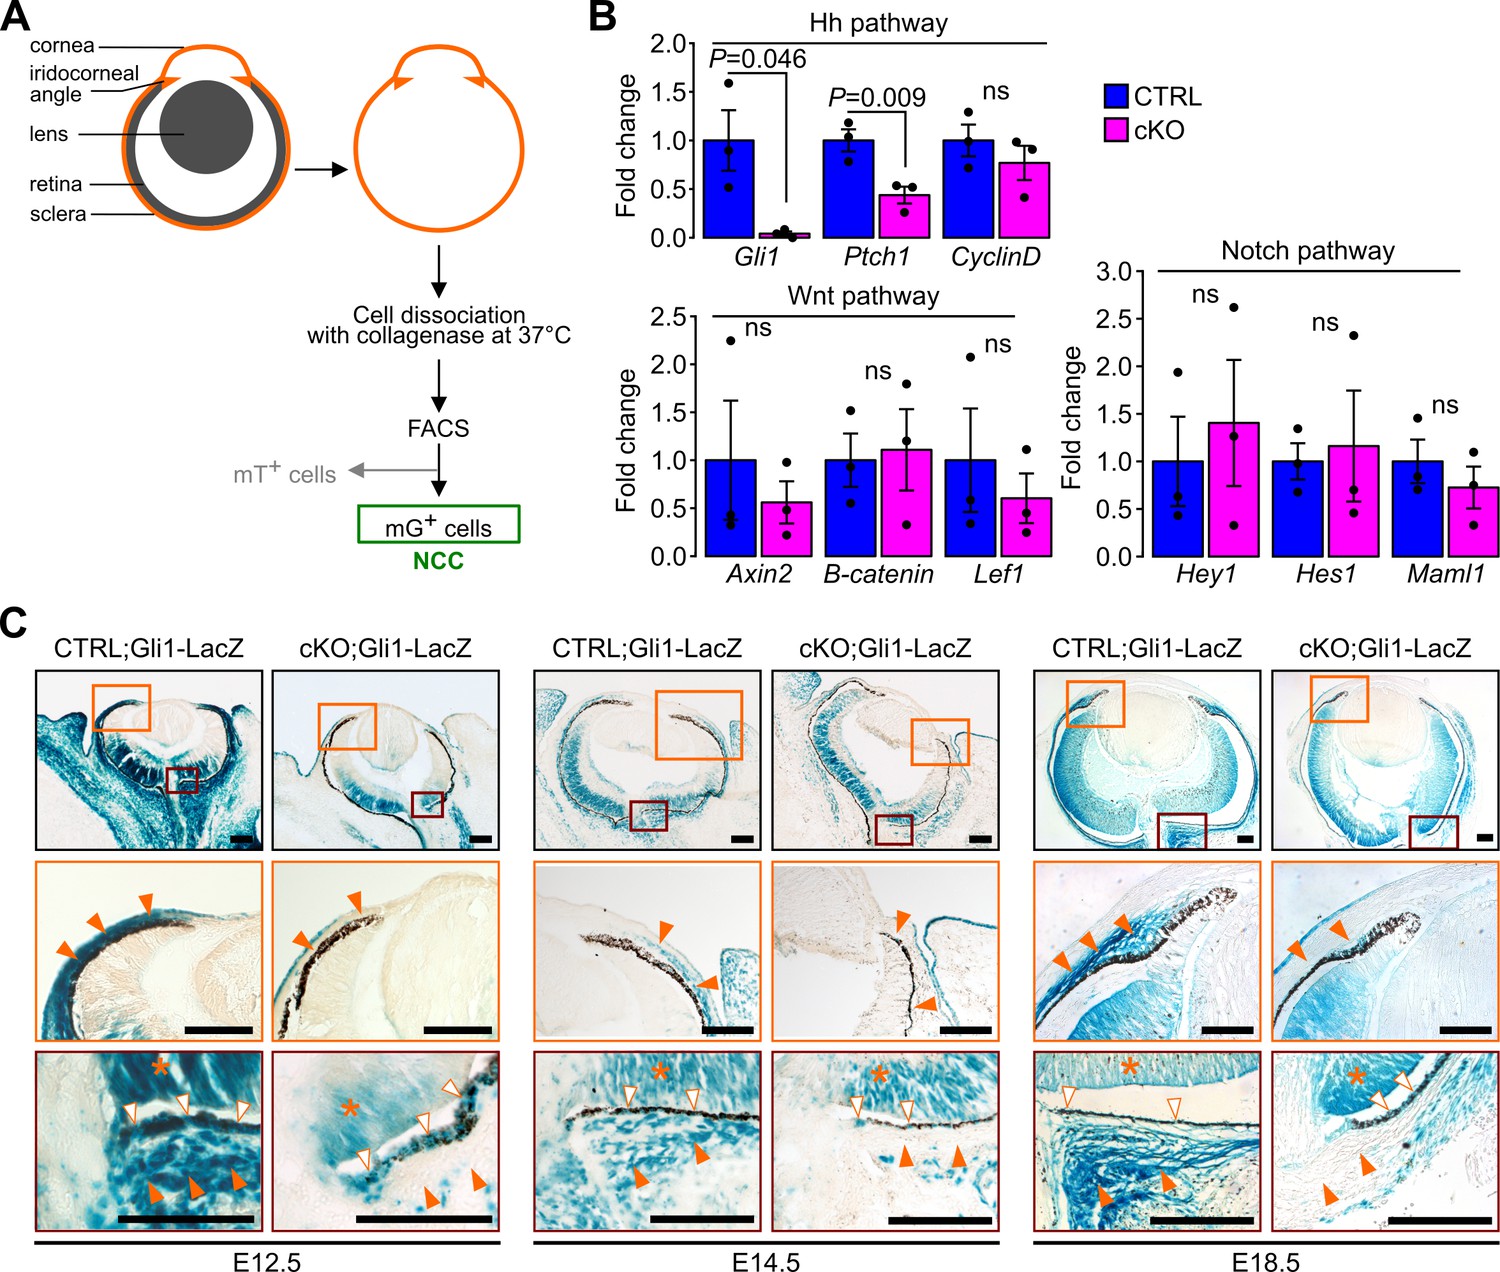
Ablation of Ift88 in NCC reduces Hh signaling in the POM NCC.
(A) Workflow followed to collect the NCC from the eyeball by cell sorting. (B) Hh, Wnt and Notch target gene expression in NCC at E18.5. Fold change is expressed as mean ± SEM (n = 3 embryos/group, both eyes of each embryo were pooled together). Only the expression of Hh pathway target genes was affected by the primary cilium ablation in the NCC. Statistical significance was assessed using two-tailed Student’s t-test. ns, non-significant, p≥0.05. (C) Hh activity assessed by Gli1-LacZ staining throughout the embryonic development. In the control embryos, the Hh activity progressively decreases in the POM from E12.5 to E18.5 but remains activated in a subpopulation of POM cells surrounding the RPE layer and extending until the iridocorneal angle, as well as in the POM surrounding the optic nerve (orange arrowheads). The primary cilium ablation in NCC leads to the absence of Hh activity in these specific areas. Hh signaling remains active in non-NCC derived tissues in the cKO embryos like in the RPE (white arrowheads) and the retina (asterisks). Scale bar, 100 μm.
Figure 4—figure supplement 1

Hh activity in the eye at adulthood.
Hh activity assessed by Gli1-LacZ staining at adulthood (5 months). Hh signaling remains active in the ciliary body (empty arrow), in the choroid (orange arrows) and around the optic nerve (arrowheads). Scale bar, 250 μm. Eye schematic modified from https://commons.wikimedia.org/wiki/File:Schematic_diagram_of_the_human_eye_en.svg.
Figure 5 with 1 supplement

Primary cilium ablation in NCC decreases the cell proliferation specifically in the POM cells surrounding the RPE layer.
(A) Cell proliferation was assessed at E14.5 in the cornea (delimited by the two yellow lines) and in two areas of the POM. The first area (0–20 µm) extended 20 µm from the white solid line, indicating the RPE cell layer (used as reference at 0 µm), to the red line (at 20 µm). This area corresponded to the mean thickness of Gli1LacZ-positive POM cells surrounding the RPE layer. The second area (20–50 µm) extending 30 µm from the red line to the white dashed line positioned at 50 µm from the RPE layer (white solid line). Scale bar, 100 μm; c, cornea; GCL, ganglion cell layer; L, lens; NCL, neuroblastic cell layer; R, retina. (B) Percentage of Ki67+ cells in the different areas of the POM and in the cornea. The number of Ki67+/DAPI+ cells is expressed as mean ± SEM. Statistical significance was assessed using one-tailed Student’s t-test (n = 3 embryos/group). ns, non-significant, p≥0.05.
Figure 5—figure supplement 1
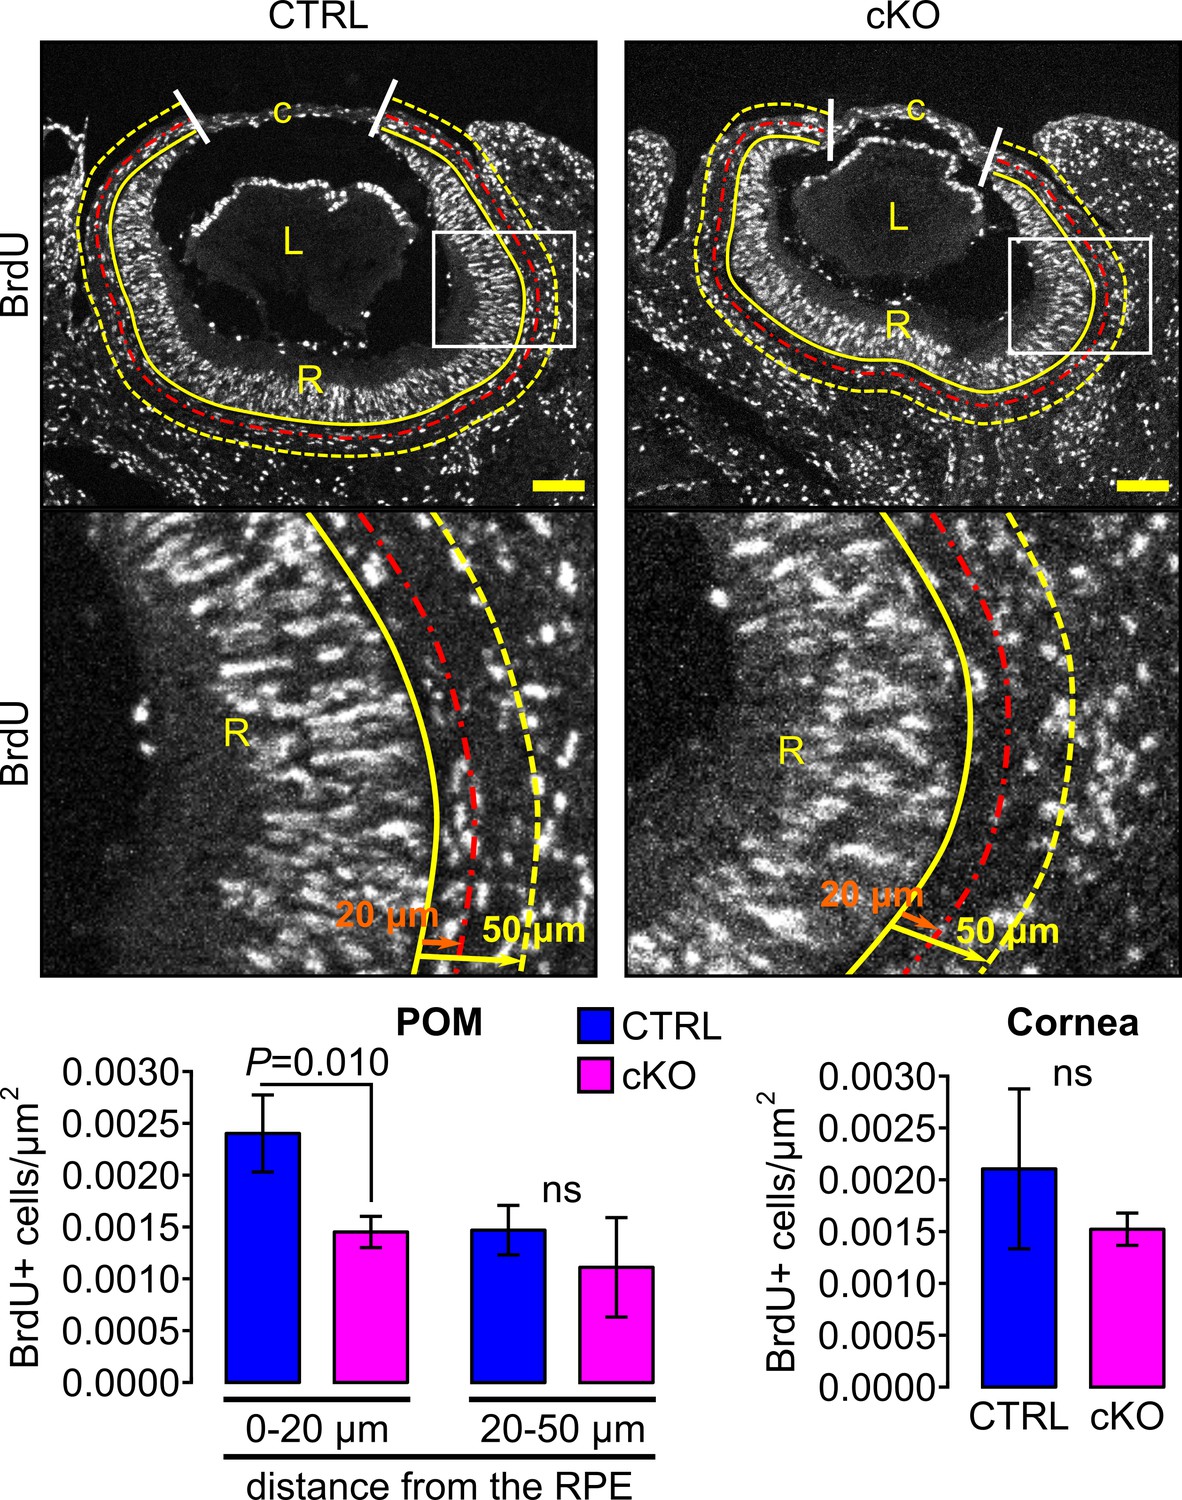
Cell proliferation assessed by BrdU pulse labeling.
Cell proliferation was assessed at E14.5 in the cornea (delimited by the two white lines) and in two areas of the POM. The first area (0–20 μm) extended 20 μm from the yellow solid line, indicating the RPE cell layer (used as reference at 0 μm), to the red line (at 20 μm). The second area (20–50 μm) extended 30 μm from the red line to the yellow dashed line positioned at 50 μm from the RPE layer (yellow solid line). Scale bar, 100 μm; c, cornea; L, lens; R, retina. The number of Brdu+ cells/μm2 is expressed as mean ± SEM. Statistical significance was assessed using one-tailed Student’s t-test (n = 3 embryos/group). ns, non-significant, p≥0.05.
Figure 6
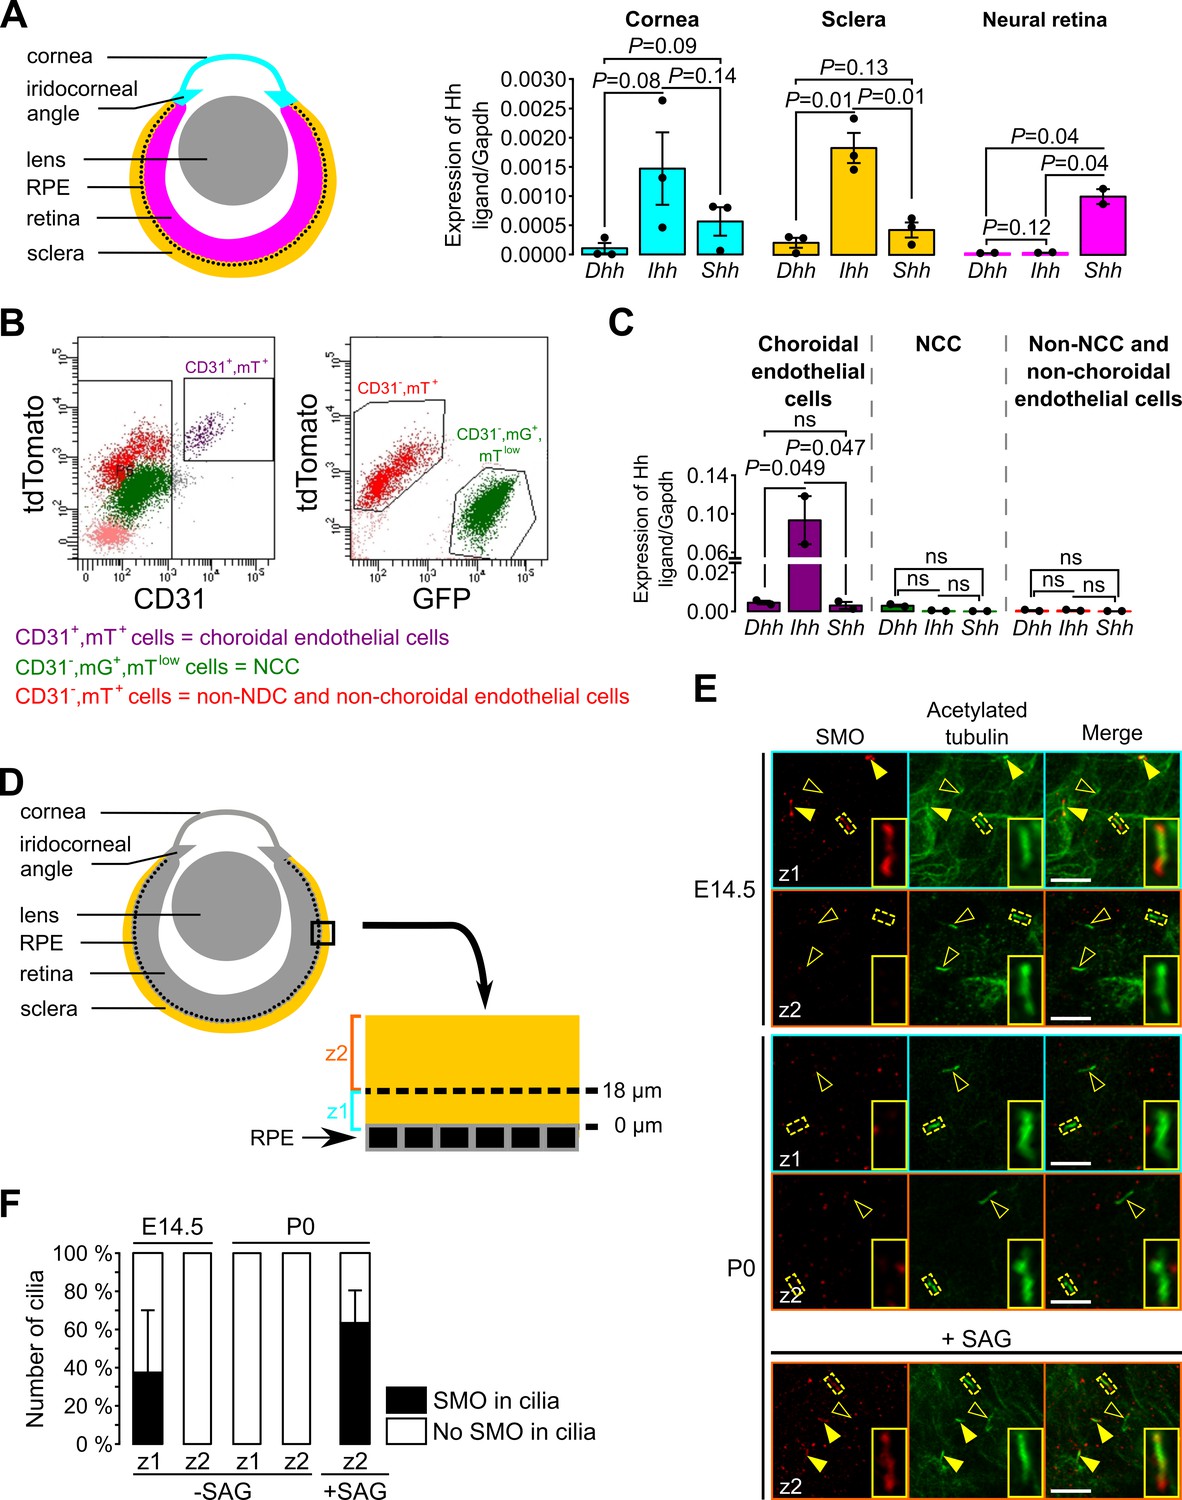
Ihh produced by choroidal endothelial cells is the predominant Hh ligand present in the POM during embryonic development.
(A) Expression of Dhh, Ihh and Shh in the cornea (including the iridocorneal angle), the neural retina and the posterior half of the eyeball without the neural retina (corresponding to the sclera, choroid and RPE layer, here indicated as the sclera) in control embryos at E18.5 (n = 2–3). The different colors correspond to the different dissected parts of the eyeball as shown on the schematic representation on the left. (B) Representative bivariate dot plots of isolated cells from E18.5 embryonic eyeballs gated on mT and CD31 or mG expression. (C) Expression of Dhh, Ihh, and Shh in sorted cells isolated from E18.5 embryonic eyeballs (N = 2 independent experiments; n = 4–6 eyeballs/N). Results are mean ± SEM. Statistical significance was assessed using one-way ANOVA with posthoc Tukey HSD test. ns, non-significant, p≥0.05. (D) Schematic representation of the areas imaged in the sclera by confocal microscopy. On E14.5 embryonic sclera, we identified two different layers: z1 from 0 and 18 μm from the RPE in which SMO is accumulated in primary cilia, and z2 above 18 μm from the RPE in which SMO is not accumulated in primary cilia. For further quantifications at P0, the same layers were considered. (E) Representative images of SMO and acetylated tubulin (primary cilia) staining extracted from z1 and z2 z-stacks in whole-mount scleras at E14.5 and P0. Primary cilia with SMO accumulation are indicated with yellow arrowheads, whereas primary cilia without SMO are indicated by empty arrowheads. At P0, SMO is visible in primary cilia only upon SAG stimulation. Scale bar, 5 μm. (F) Quantification of the number of primary cilia in which SMO is present or absent (n = 5 at E14.5, n = 3 at P0).
Figure 7 with 1 supplement
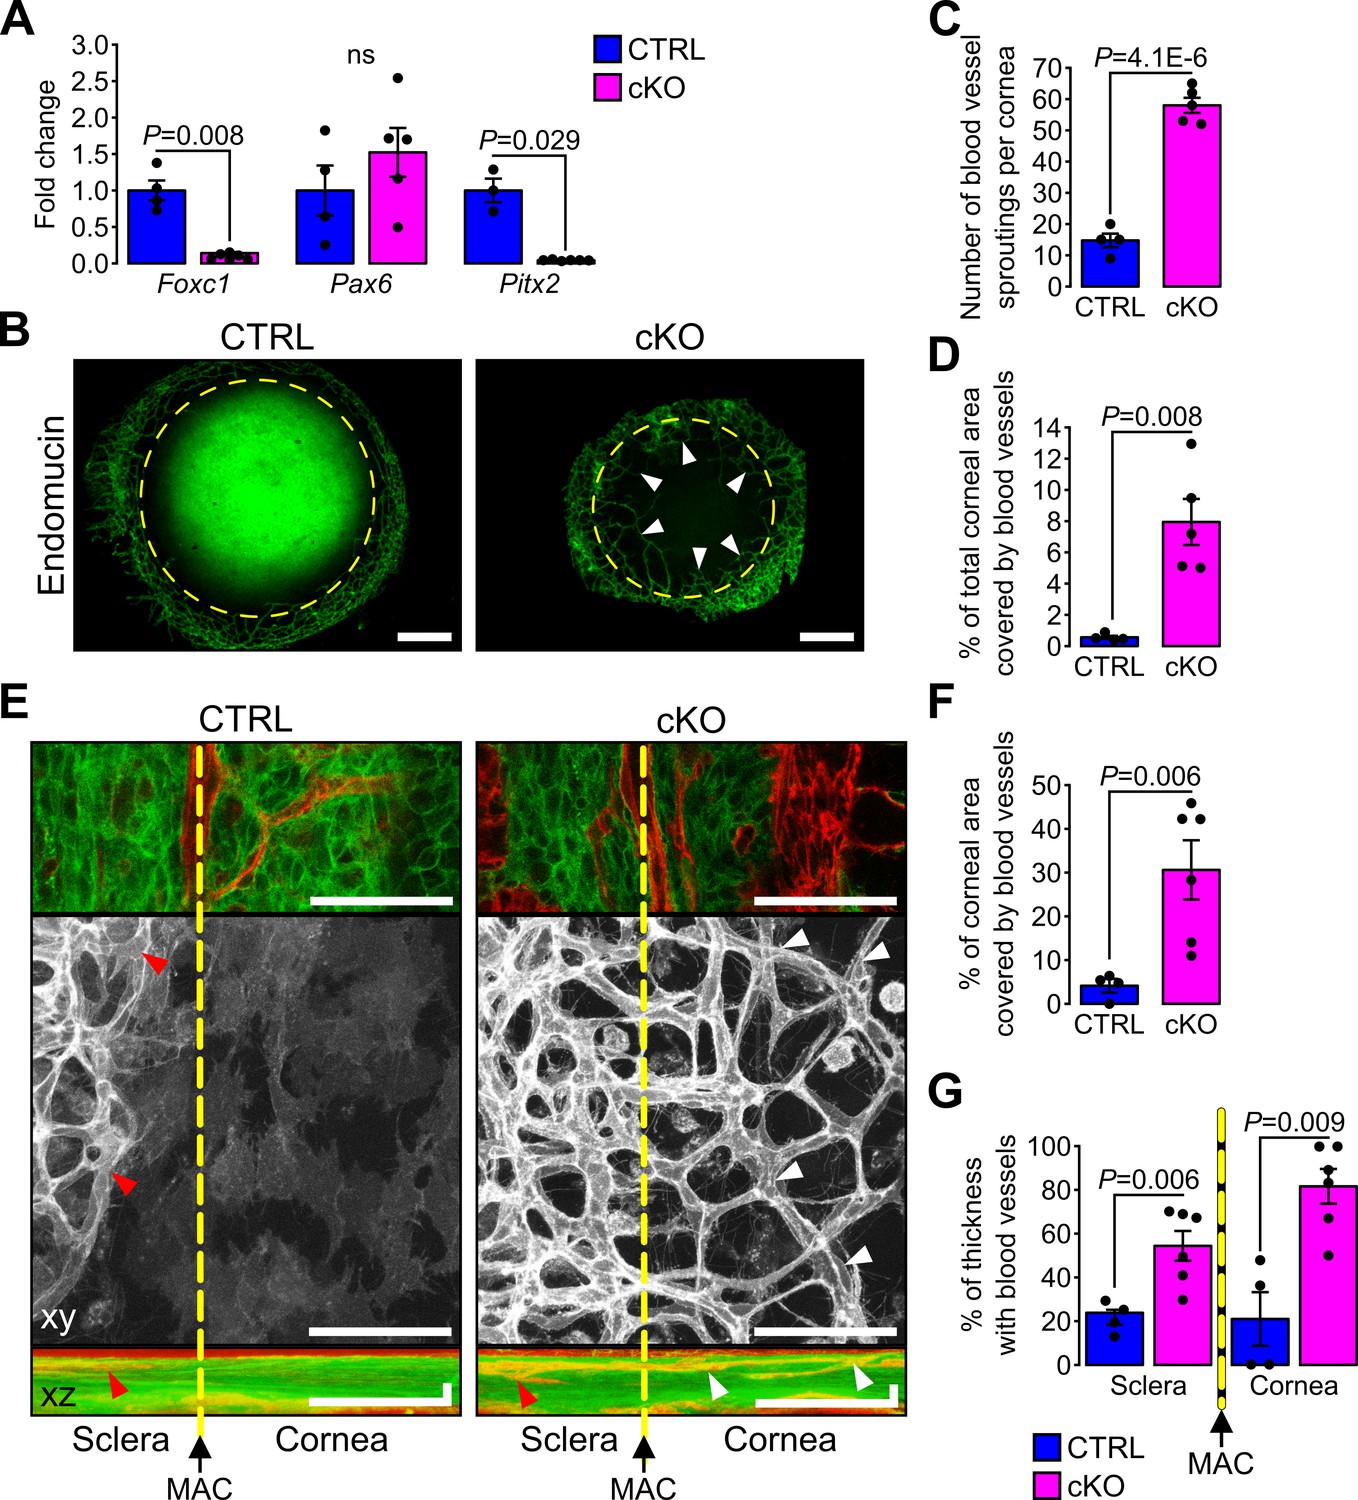
Primary cilium ablation in NCC leads to corneal neovascularization.
(A) Foxc1, Pax6 and Pitx2 expression in the cornea (including the iridocorneal angle) (n = 3–6 embryos/group). (B) Representative images of whole-mount corneas stained with an anti-endomucin Ab in control and cKO embryos at E18.5. Blood vessels are indicated by white arrowheads and the yellow dotted line surrounds the cornea. Scale bar, 250 μm. (C–D) Quantification of the number of blood vessel sproutings and the total corneal area covered by blood vessels in E18.5 control and cKO embryos (n = 4–5 embryos/group). We defined the vessel point crossing the corneal border and extending forward to the cornea as vessel sprouting. (E) Representative confocal images of the cornea periphery at E18.5. The yellow dotted line represents the corneal boundary, established by the position of the major arterial circle (MAC, picture on the top). Only the mT reporter is displayed on the xy maximum intensity projection (grayscale picture), whereas both mT and mG reporters are displayed on the xz maximum intensity projection. Arrowheads indicate blood vessels which are only visible in the sclera side in controls (red arrowheads) whereas they extend into the cornea in the cKO embryos (white arrowheads). Scale bar, 25 μm. (F) Percentage of the corneal area covered by blood vessels at the periphery of the cornea (n = 4–6 embryos/group). (G) Quantification of the corneal and stroma thickness in which blood vessels are present (n = 4–6 embryos/group). Results are mean ± SD. Statistical significance was assessed using two-tailed Student’s t-test. ns, non-significant, p≥0.05.
Figure 7—figure supplement 1
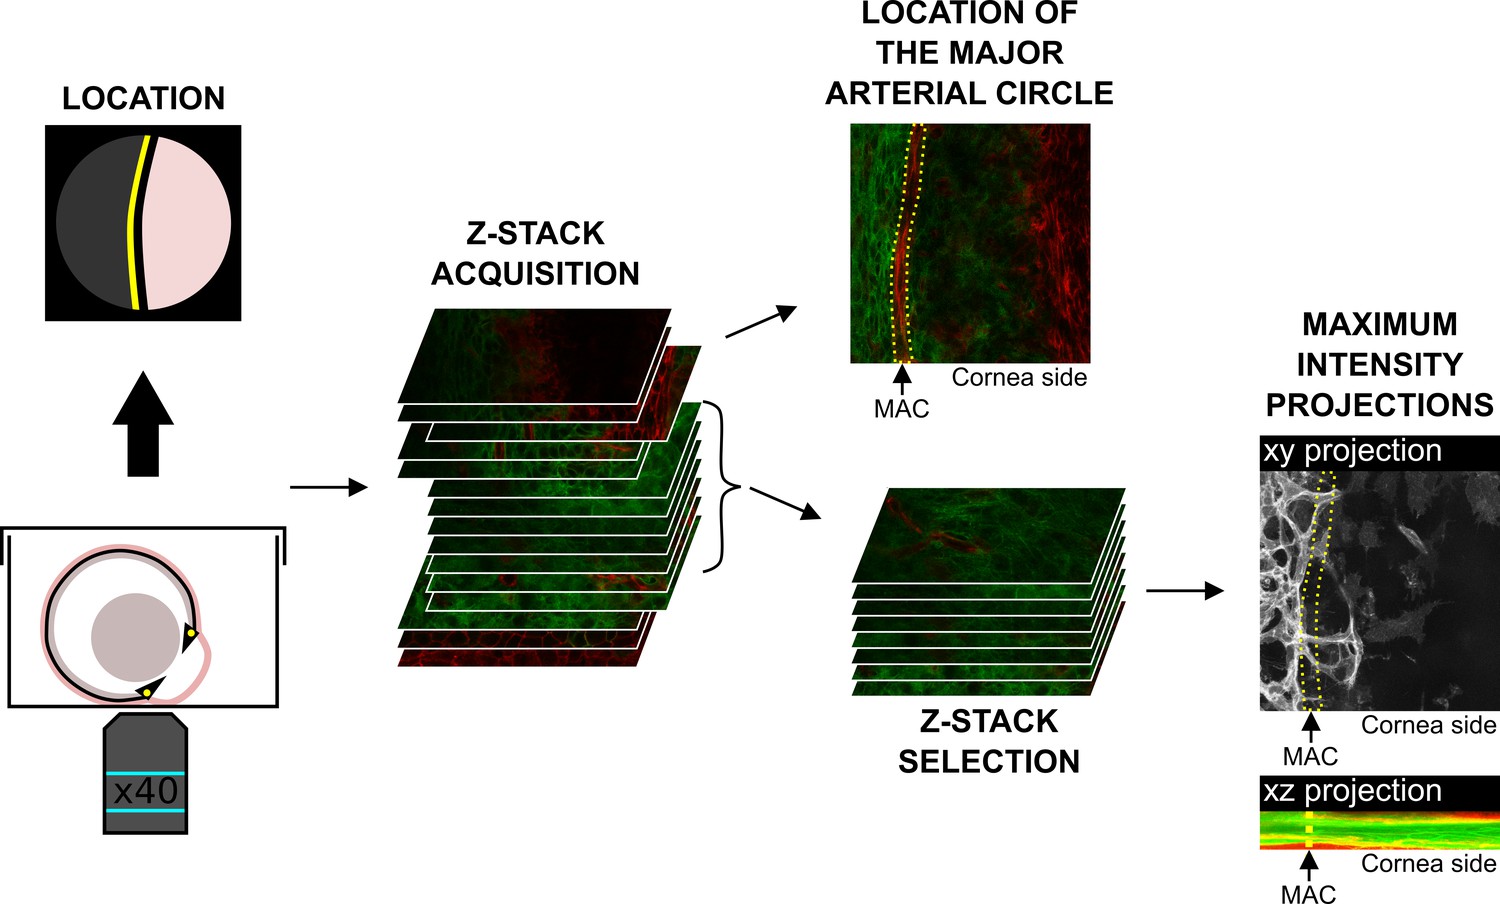
Live imaging of the cornea boundary area.
Enucleated eye was placed facing down in a glass-bottom microwell dish. The observed field was centered on the major arterial circle (yellow line). A z-stack was acquired from the corneal epithelium to the presumptive iris by confocal microscopy (49 to 109 μm per stack). and then deconvoluted with AutoQuant X3. z-sections corresponding to the area of interest were selected. The major arterial circle (yellow dotted line) is the reference to define the boundary between the cornea and the sclera. Quantifications of the corneal area covered by blood vessels and the percentage of corneal and stromal thickness with blood vessels were done with Fiji on the maximum intensity projections. MAC, major arterial circle.
Figure 8 with 1 supplement
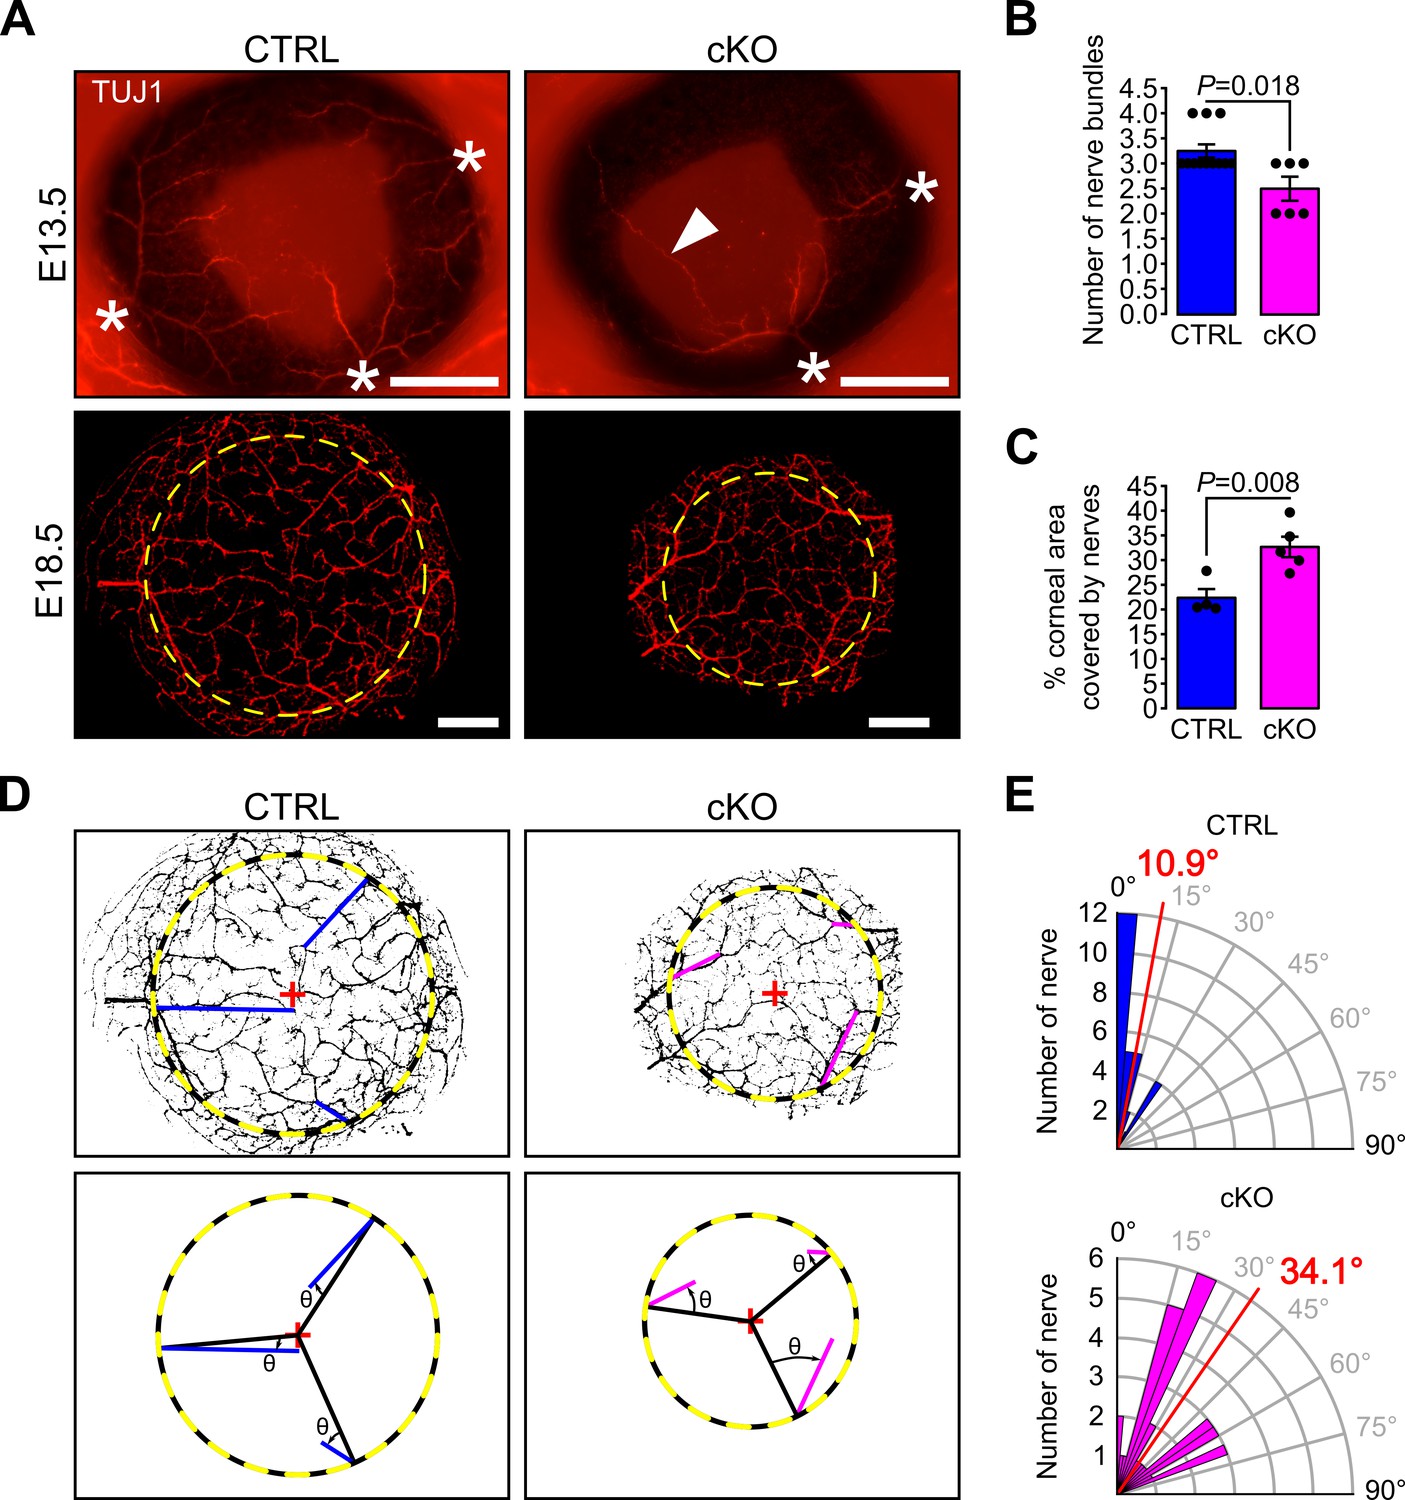
Primary cilium ablation in NCC reduces early corneal innervation and impairs the centripetal migration of sensory nerves.
(A) Representative images of whole-mount corneas stained with an anti-TUJ1 Ab in control and cKO embryos at E13.5 and E18.5. At E13.5, three to four nerves bundles (asterisk) are present in controls and start to project at the periphery of the cornea. Abnormal nerve projections (head arrow) across the cornea are visible in some cKO embryos at E13.5. By E18.5, the cornea (surrounded by the yellow dotted line) is fully innervated in both the control and cKO embryos. Scale bar, 250 μm. (B) Quantification of the number of nerve bundles at E13.5 which is significantly decreased in cKO embryos compared to control (n = 8–13 embryos/group). (C) Nerve density at E18.5 quantified by measuring the percentage of corneal area covered by nerves (n = 4–5 embryos/group). (D) Corneal nerve segmentation from E18.5 embryos. The colored lines (blue in control, pink in cKO) represent the axis of major nerve branches formed between the point where the main nerve branch crosses the corneal border (yellow dotted line) and its end point (final point of the nerve branch or the branching point from which two secondary branches with similar diameter arise). The angle θ formed by the major nerve branches and the radius of the cornea (black line) was measured with Fiji. (E) Quantification of the angle θ in control and cKO mice at E18.5. The nerves in the cKO embryos are less centripetally organized than in control (p=8.43E−7, n = 4–5 embryos/group). In B and C, results are mean ± SEM. In D, the mean angle is indicated in red. Statistical significance was assessed using two-tailed Student’s t-test.
Figure 8—figure supplement 1

Innervation of the corneal epithelium.
Representative maximum intensity projections of the epithelium in the center of the cornea of E18.5 embryos imaged on live tissues using the mT/mG reporter. Corneal epithelial cells are visualized with the tdTomato fluorescent reporter (mT) and the sensory nerves with the GFP fluorescent reporter (mG). Corneal epithelia of both genotypes are innervated. Scale bar, 50 μm.
Author response image 1
Tables
Key resources table
| Reagent type (species) or resource | Designation | Source or reference | Identifiers | Additional information |
|---|---|---|---|---|
| Strain, strain background (Mus musculus) | Ift88(tm1Bky) | (Haycraft et al., 2007), | RRID: MGI:6315331 | |
| Strain, strain background (Mus musculus) | Wnt1-Cre | (Danielian et al., 1998), | RRID: IMSR_JAX:009107 | |
| Strain, strain background (Mus musculus) | B6.129(Cg)-Gt(Rosa)26Sor(tm4(ACTB-tdTomato,-EGFP)Luo)/J | (Muzumdar et al., 2007) | Jackson laboratories stock No 007676 RRID: IMSR_JAX:007676 | |
| Strain, strain background (Mus musculus) | Gli1(tm2Alj)/J | (Bai et al., 2002) | Jackson Laboratories stock No 008211 RRID: IMSR_JAX:008211 | |
| Strain, strain background (Mus musculus) | Gt(ROSA)26Sor(tm1(Sstr3/GFP)Bky) | (O'Connor et al., 2013) | RRID: ISMR_JAX:024540 | |
| Antibody | Anti-acetylated tubulin (mouse monoclonal) | Sigma-Aldrich | Cat #: 6-11B-1 RRID: AB_527348 | 1:1 |
| Antibody | Anti-Arl13b (rabbit polyclonal) | ProteinTech Group | Cat #: 17711–1-AP RRID: AB_2060867 | 1:800 |
| Antibody | Anti-BrdU (rat monoclonal) | Abcam | Cat #: ab6326 RRID: AB_305426 | 1:400 |
| Antibody | Anti-CD31 (rat monoclonal) | BD Biosciences | Cat #: 550274 RRID: AB_393571 | 1:500 |
| Antibody | Anti-endomucin (rat monoclonal) | eBioscience | Cat #: 14-5851-85 RRID: AB_891531 | 1:500 |
| Antibody | Anti-Ki67 (rabbit polyclonal) | Abcam | Cat #: ab15580 RRID: AB_443209 | 1:300 |
| Antibody | Anti-pSmad2/3 (goat polyclonal) | Santa Cruz | Cat #: sc11769 RRID: AB_2193189 | 1:200 |
| Antibody | Anti-SMO (rabbit polyclonal) | MilliporeSigma | Cat #: ABS1001 | 1:100 |
| Antibody | Anti-TUJ1 (rabbit monoclonal) | Covance | Cat #: MRB-435P RRID: AB_663339 | 1:500 |
| Antibody | Alexa Fluor 594 goat anti-rabbit IgG | Invitrogen | Cat #: A27034 RRID: AB_2536097 | 1:200 |
| Antibody | Alexa Fluor 647 donkey anti-rat | Jackson ImmunoResearch | Cat #: 712-605-153 RRID: AB_2340694 | 1:200 |
| Antibody | FITC donkey anti-mouse | Jackson ImmunoResearch | Cat #: 715-096-151 RRID: AB_2340796 | 1:200 |
| Antibody | FITC donkey anti-rat | Jackson ImmunoResearch | Cat #: 712-097-003 RRID: AB_2340655 | 1:200 |
| Antibody | FITC goat anti-rat IgG2a | Bethyl | Cat #: A110-109F RRID: AB_67287 | 1:200 |
| Antibody | TRITC donkey anti-goat | Jackson ImmunoResearch | Cat #: 705-025-147 RRID: AB_2340389 | 1:200 |
| Antibody | TRITC donkey anti-rabbit | Jackson ImmunoResearch | Cat #: 711-025-152 RRID:AB_2340588 | 1:200 |
| Chemical compound, drug | BrdU | Sigma-Aldrich | Cat #: B5002 | 10 mg/mL |
| Chemical compound, drug | Collagenase | Sigma | Cat #: C2674 | 8 mg/mL |
| Chemical compound, drug | SMO agonist (SAG) | Calbiochem | Cat #: 566660 | 100 nM |
| Chemical compound, drug | X-gal | LabScientific | Cat #: X266 | |
| Commercial assay or kit | RNeasy microkit | Qiagen | Cat #: 74004 | |
| Software, algorithm | Fiji | (Schindelin et al., 2012) | RRID: SCR_002285 | |
| Software, algorithm | Ilastik | (Haubold et al., 2016) | RRID: SCR_015246 |
Additional files
-
Supplementary file 1
Table: RT-qPCR primers.
- https://cdn.elifesciences.org/articles/52423/elife-52423-supp1-v2.docx
-
Transparent reporting form
- https://cdn.elifesciences.org/articles/52423/elife-52423-transrepform-v2.docx
Download links
A two-part list of links to download the article, or parts of the article, in various formats.
Downloads (link to download the article as PDF)
Open citations (links to open the citations from this article in various online reference manager services)
Cite this article (links to download the citations from this article in formats compatible with various reference manager tools)
Primary cilia deficiency in neural crest cells models anterior segment dysgenesis in mouse
eLife 8:e52423.
https://doi.org/10.7554/eLife.52423


