Rejuvenating conventional dendritic cells and T follicular helper cell formation after vaccination
- Laboratory of Lymphocyte Signalling and Development, Babraham Institute, United Kingdom
- Epigenetics Programme, Babraham Institute, United Kingdom
- Bioceros BV, Netherlands
- Division of Nephrology, Department of Medicine and Clinical and Translational Science Institute, University of Rochester Medical Center, United States
- Autoimmune Genetics Laboratory, VIB and University of Leuven, Belgium
- Biological Chemistry, Babraham Institute, United Kingdom
- Department of Medicine, University of Cambridge, United Kingdom
Figures
Figure 1
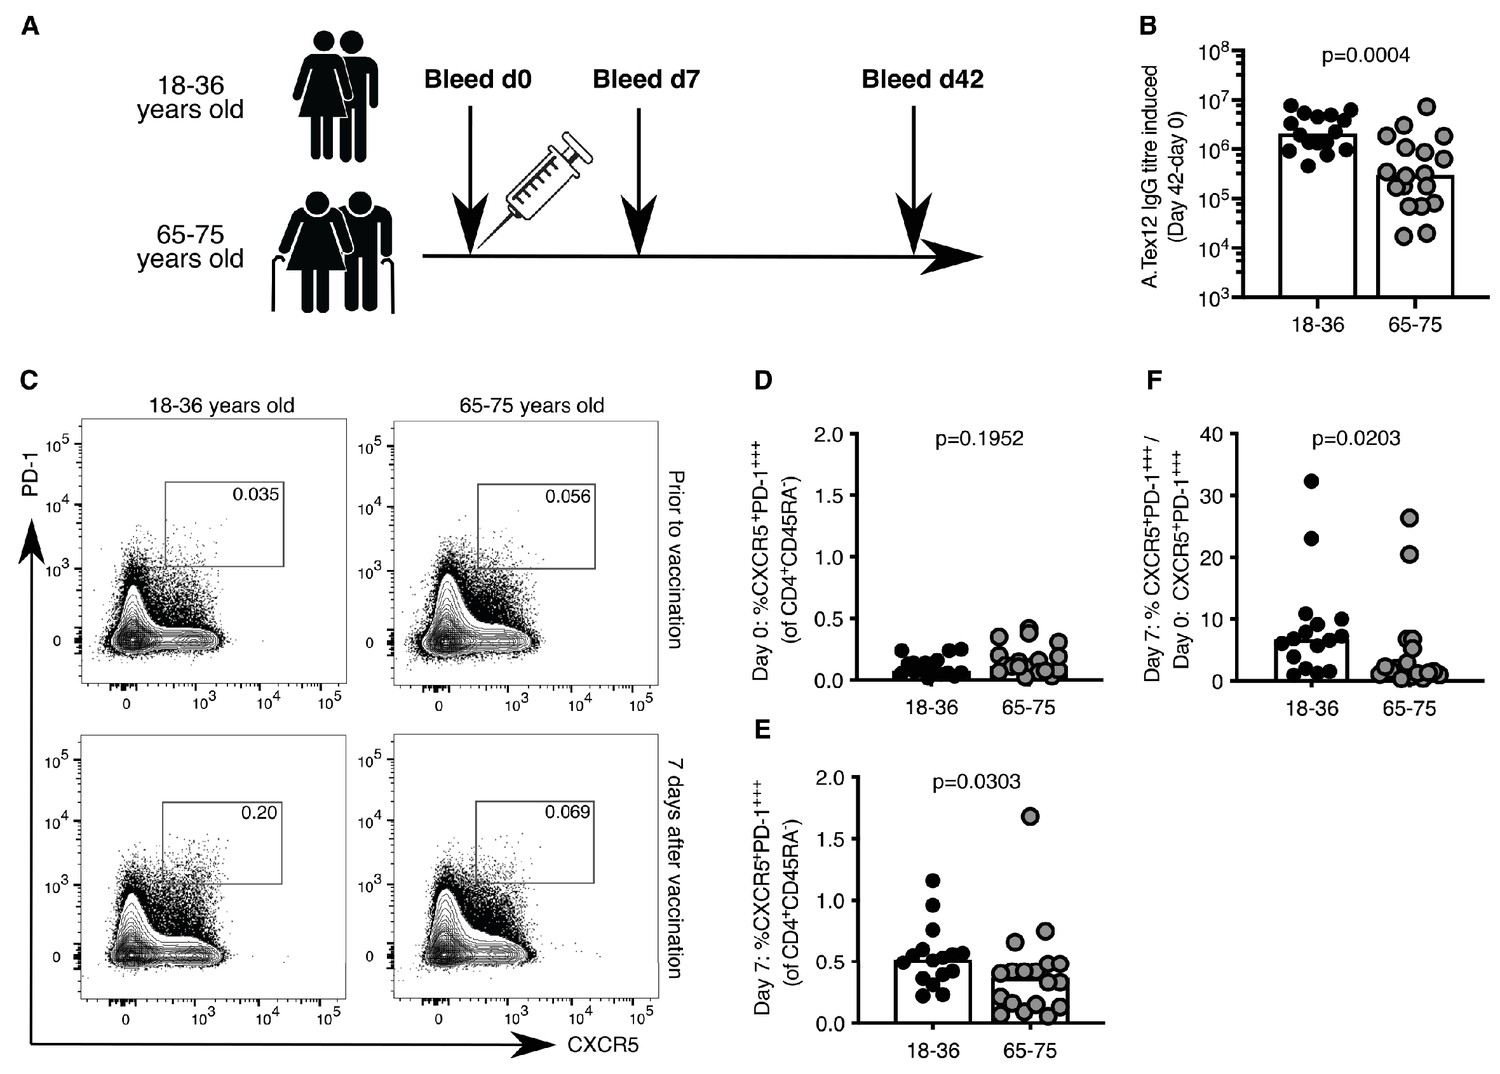
Poor induction of circulating Tfh (cTfh)-like cells in older persons upon influenza vaccination.
(A) Vaccination and venepuncture schedule for the seasonal influenza vaccination study, 18-36yo n = 16, 65-75yo n = 18. (B) Change in antibody titre of anti-A.Tex12 IgG, an influenza A haemagglutinin (HA), from baseline 42 days after vaccination. Flow cytometric contour plots (C) and quantification of the frequency of CXCR5+PD-1+++ cells amongst CD45RA-CD4+CD3+ cells in the peripheral blood of healthy UK donors at days zero (D) and seven (E) relative to seasonal influenza vaccination. (F) Fold change of cTfh-like cells in the peripheral blood seven days after vaccination over day zero (% CXCR5+PD-1+++CD45RA-CD4+CD3+ on day 7 divided by % CXCR5+PD-1+++CD45RA-CD4+CD3+ on day 0). Bar height corresponds to the median, and each circle represents one biological replicate. P-values generated with a Mann-Whitney test. Data are from one seasonal influenza vaccination cohort from the northern hemisphere in winter 2014–2015.
-
Figure 1—source data 1
Poor induction of circulating Tfh (cTfh)-like cells in older persons upon influenza vaccination.
- https://cdn.elifesciences.org/articles/52473/elife-52473-fig1-data1-v1.xlsx
Figure 2 with 1 supplement
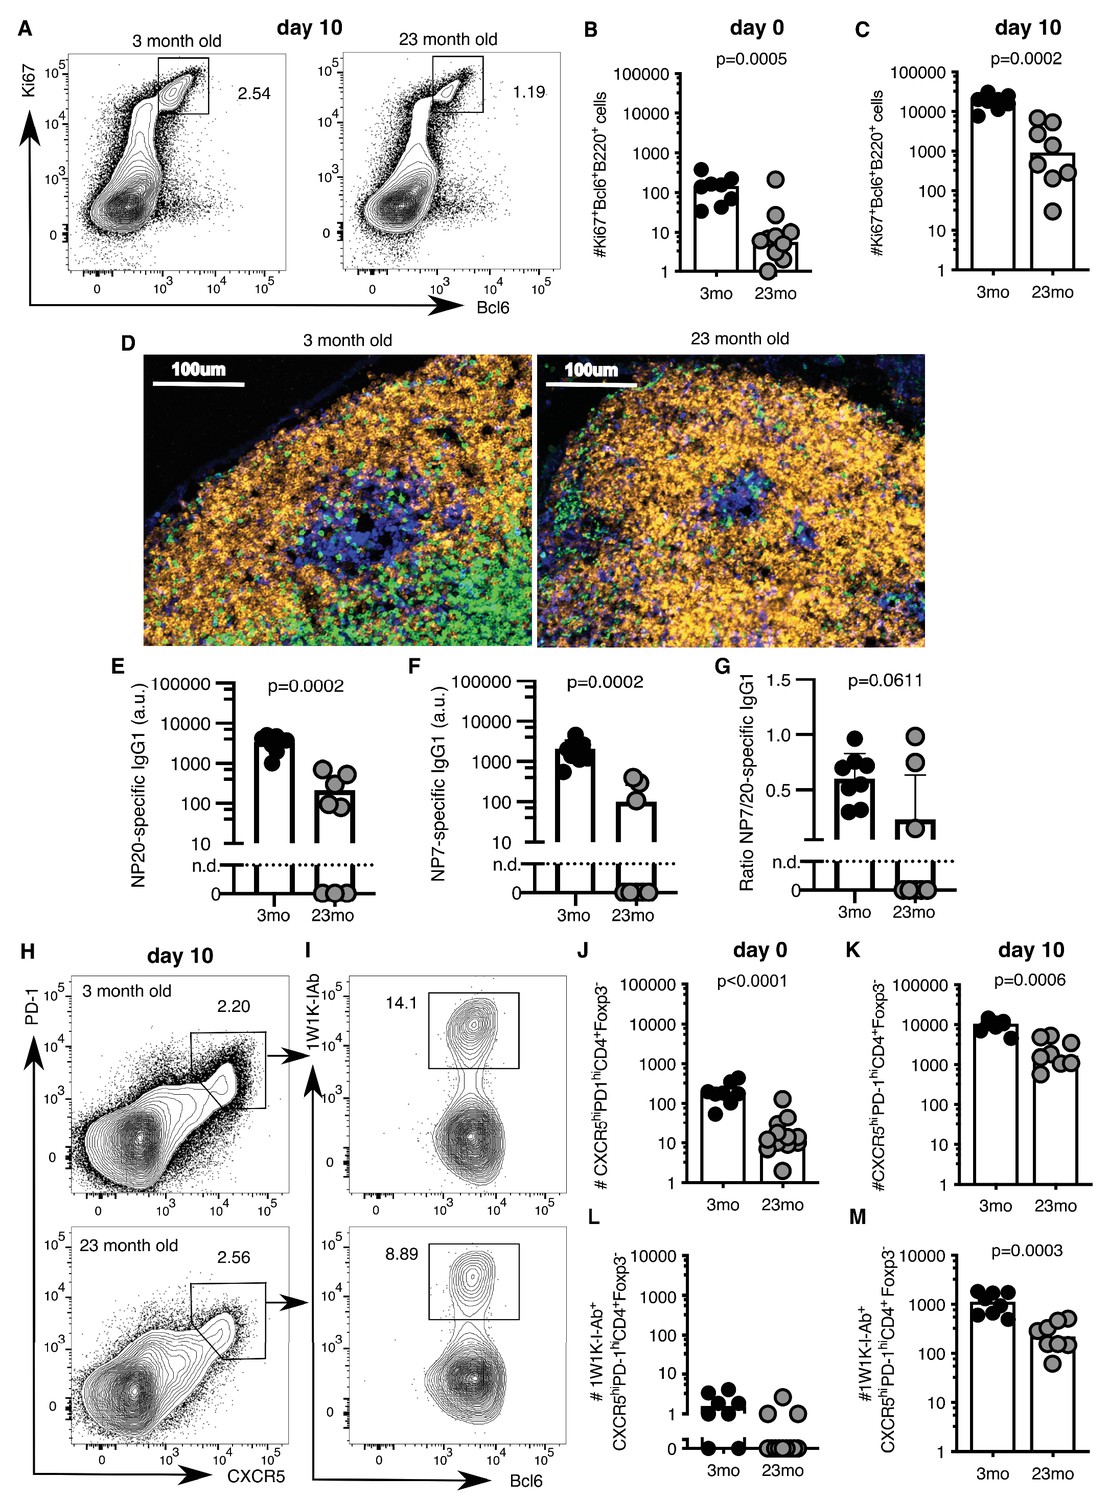
Germinal centre (GC) responses are impaired in aged mice.
2–3 month-old adult and 22–24 month-old aged C57BL/6 mice were subcutaneously immunised with NP-1W1K (A-C, E-M) or NP-KLH (D) in Alum. Their draining inguinal lymph nodes (LNs) were analysed by flow cytometry without immunisation (B, J, L), ten days after immunisation (A, C, E-G, H-I, K, M), or after 14 days by confocal imaging (D). (A-C) Representative flow cytometric plots (A) and quantitation (B-C) of B220+Ki67+Bcl6+ GC B cells. (D) Confocal images of draining LNs from 2 to 3 month-old and 22–24 month-old mice, taken 14 days after subcutaneous immunisation with NP-KLH. 10 µm LN sections were stained with anti-IgD (orange), anti-CD3 (green), anti-Ki67 (blue) and anti-Foxp3 (pink) antibodies (n = 3–6). (E-G) Levels of NP-specific IgG1 antibodies in the serum of 2–3 month-old and 22–24 month-old mice 10 days after immunisation with NP-1W1K in Alum as determined by ELISA. (E) Serum levels of NP20-specific IgG1 antibodies. (F) Serum levels of high-affinity NP7-specific IgG1 antibodies. (G) Ratio of NP20/NP7-specific IgG1 antibodies in the serum as a measure of antibody affinity maturation. (H-M) Representative flow cytometric plots (H-I) and quantitation (J-M) of CXCR5hiPD-1hiFoxp3-CD4+ T follicular helper (Tfh) cells (H, J-K) and antigen-specific 1W1K-I-Ab+ Tfh cells (I, L-M). Bar graphs show the results of one of two independent experiments (n = 8–12 per group/experiment). Bar height corresponds to the median, and each circle represents one biological replicate. P-values were determined using Mann-Whitney testing. The gating strategy is shown in Figure 2—figure supplement 1.
-
Figure 2—source data 1
Germinal centre (GC) responses are impaired in aged mice.
- https://cdn.elifesciences.org/articles/52473/elife-52473-fig2-data1-v1.xlsx
Figure 2—figure supplement 1
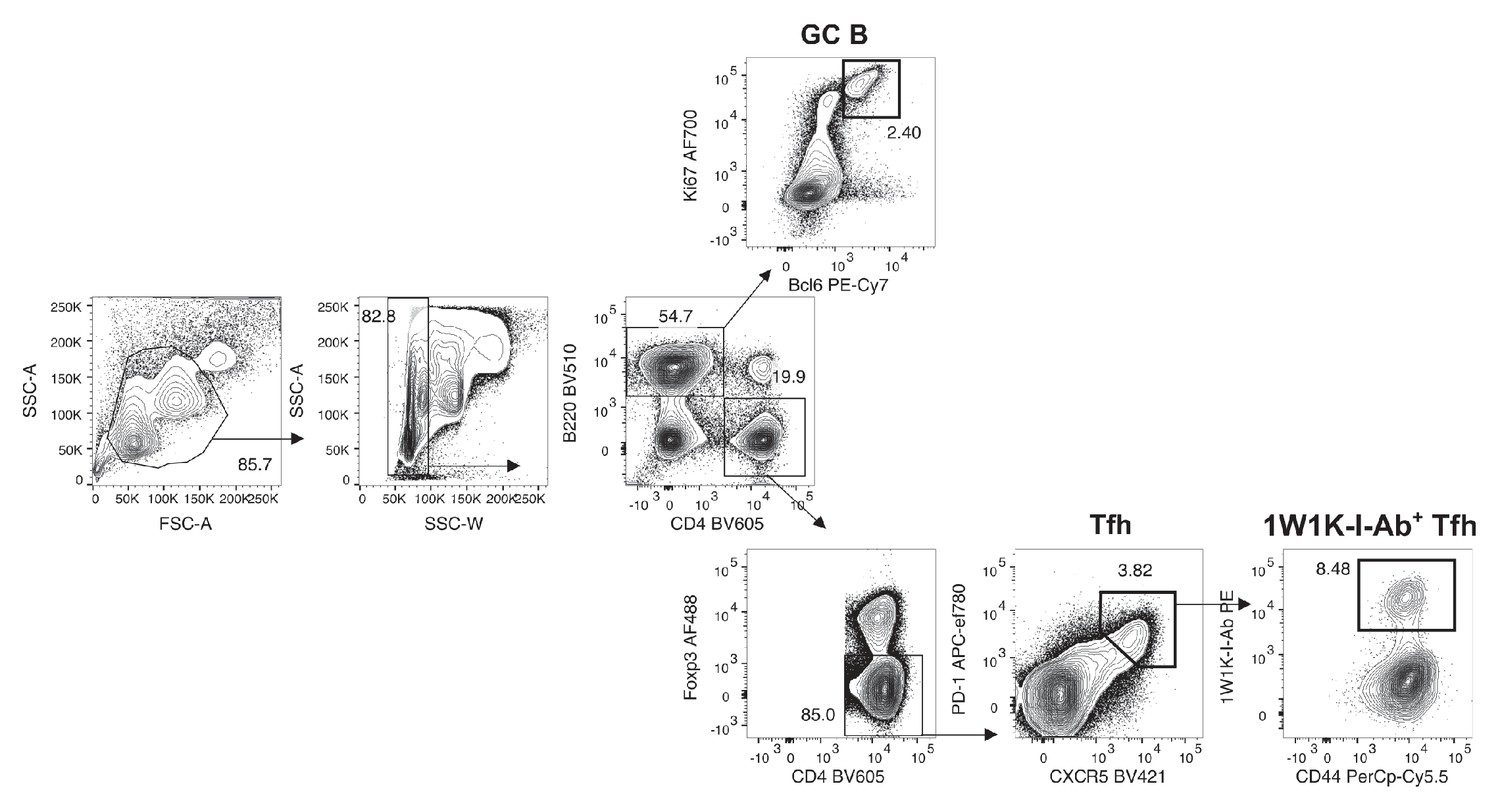
Gating strategy for GC B and Tfh cell populations.
2–3 month-old adult and 22–24 month-old aged C57BL/6 mice were immunised subcutaneously with NP-1W1K in Alum. Their draining inguinal lymph node cells were analysed by flow cytometry ten days later. GC B cells were defined as Bcl6+Ki67+B220+, T follicular helper (Tfh) cells as CXCR5hiPD-1hiFoxp3-CD4+ and antigen-specific Tfh cells as 1W1K-I-Ab+CXCR5hiPD-1hiFoxp3-CD4+.
Figure 3 with 1 supplement
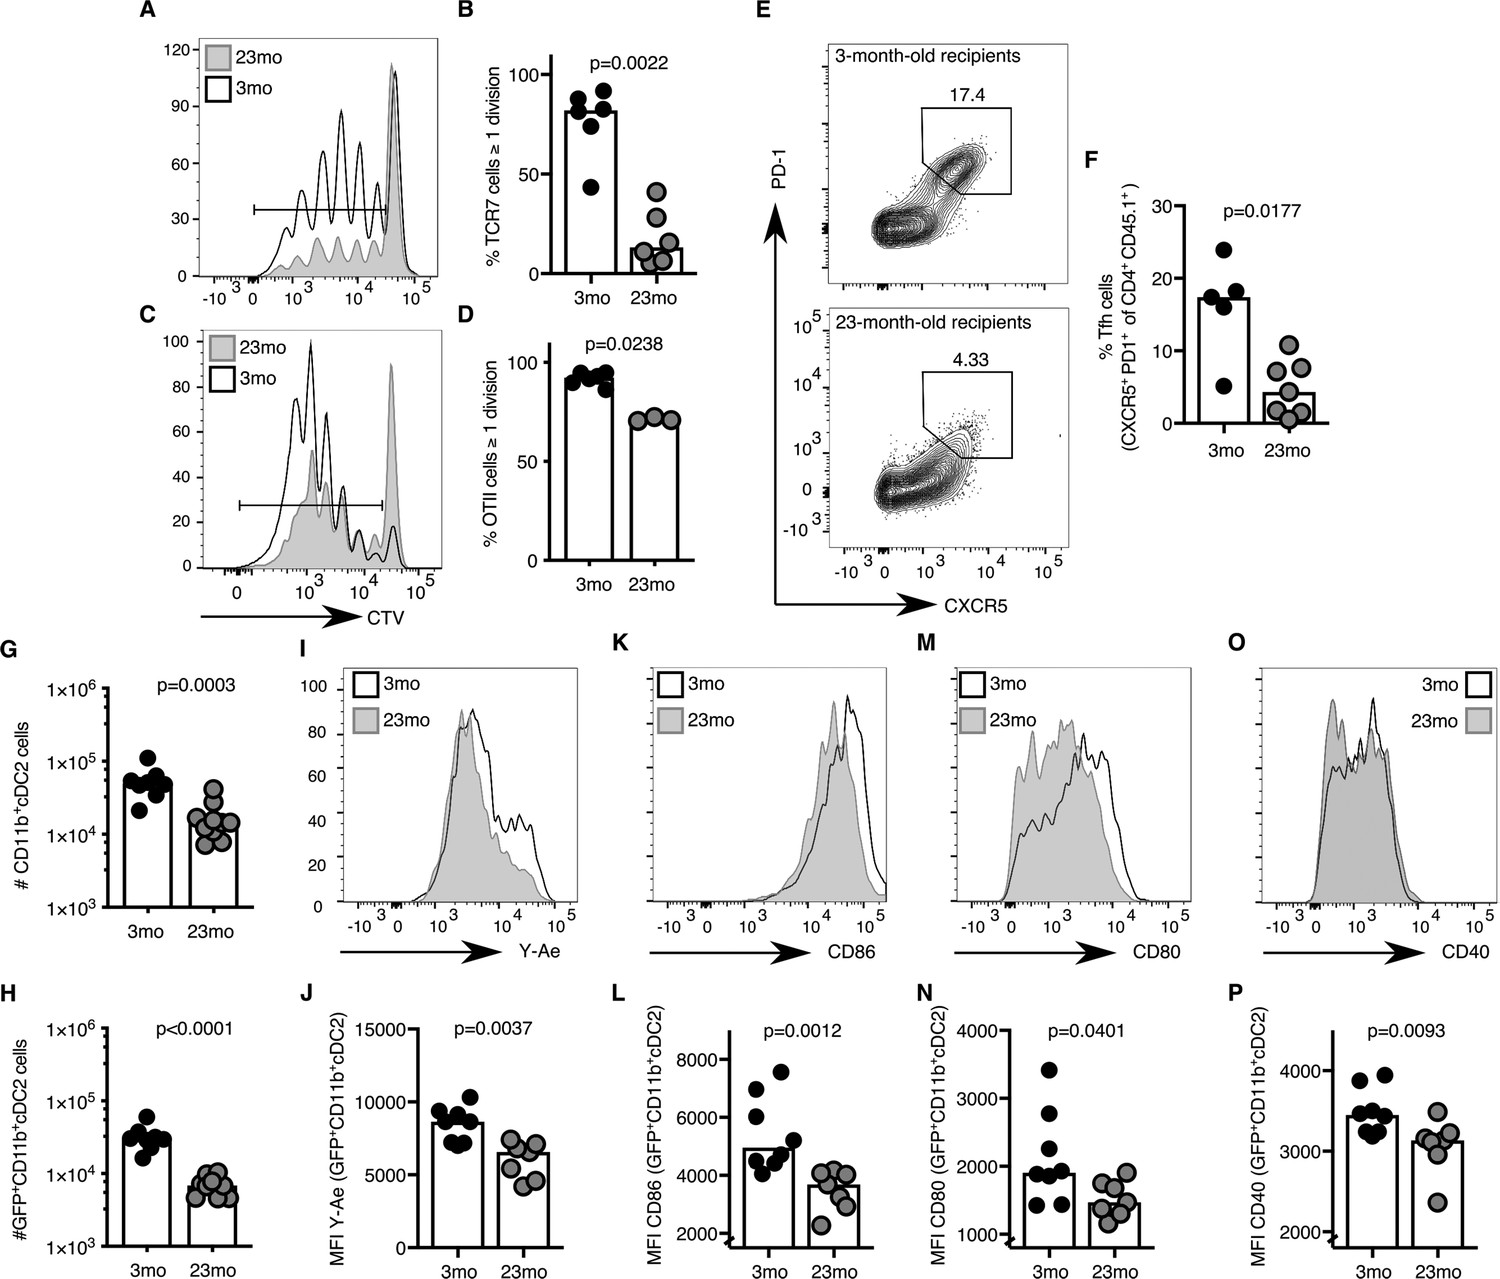
Activation of cDC2s and T cell priming are impaired in aged mice.
(A–B) 1–5 × 10⁶ CellTrace-labelled hen egg lysozyme (HEL)-specific TCR7 (CTV+TCRVβ3+CD45.1+CD4+) cells or (C-D) 5 × 10⁵ ovalbumin (OVA)-specific (CTV+TCRVα2+CD45.1+CD4+) OTII cells were adoptively transferred into 2–3 month-old and 22–24 month-old C57BL/6 recipients, which were subsequently immunised subcutaneously with HEL or OVA in Alum. Cell proliferation of transferred cells was assessed in draining lymph nodes (LNs) by flow cytometry as defined by the serial dilution of CellTrace (CTV) three days after immunisation (n = 3–6 per group/experiment). (A, C) Representative flow cytometric plot of CTV levels in CD45.1+CD4+ cells in 2–3 month-old (white) and 22–24 month-old (grey) C57BL/6 recipients. The gate indicates cells that have undergone one or more divisions. (B, D) Percentage of divided CTV+CD45.1+CD4+ cells in 2–3 month-old and 22–24 month-old C57BL/6 recipients. (E-F) 5 × 10⁴ OVA-specific (CD45.1+TCRVα2+CD4+) OTII cells were adoptively transferred into 2–3 month-old and 22–24 month-old C57BL/6 recipients, which were subsequently immunised subcutaneously with NP-OVA in Alum in the hind flank to assess T follicular helper (Tfh) cell formation ten days after immunisation (n = 5–6 per group/experiment). Representative flow cytometric plot (E) and quantitation (F) of CXCR5hiPD-1hi Tfh cells formed from CD45.1+CD4+ OTII cells in 2–3 month-old and 22–24 month-old C57BL/6 recipients. (G-P) 2–3 month-old mice and 22–24 month-old were immunised subcutaneously with Eα-GFP in IFA. Antigen-bearing GFP+ and antigen-presenting Y-Ae+dendritic cells (DCs) in draining LNs were analysed 22 hr after immunisation (n = 7–10 per group/experiment). (G-H) Quantitation of total (G) and GFP+ (H) CD11b+ type 2 conventional DCs (cDC2s). (I-P) Representative histograms (I, K, M, O) and quantitation of median fluorescence intensity (MFI) levels (J, L, N, P) of Y-Ae (I-J), CD86 (K-L), CD80 (M-N) and CD40 (O-P) on the surface of GFP+ CD11b+ cDC2s from 2 to 3 month-old and 22–24 month-old mice. Bar graphs show the results of one of at least two independent experiments. Bar height corresponds to the median, and each circle represents one biological replicate. P-values were determined using the Mann-Whitney test. Supporting data is shown in Figure 3—figure supplement 1.
-
Figure 3—source data 1
Activation of cDC2s and T cell priming are impaired in aged mice.
- https://cdn.elifesciences.org/articles/52473/elife-52473-fig3-data1-v1.xlsx
Figure 3—figure supplement 1
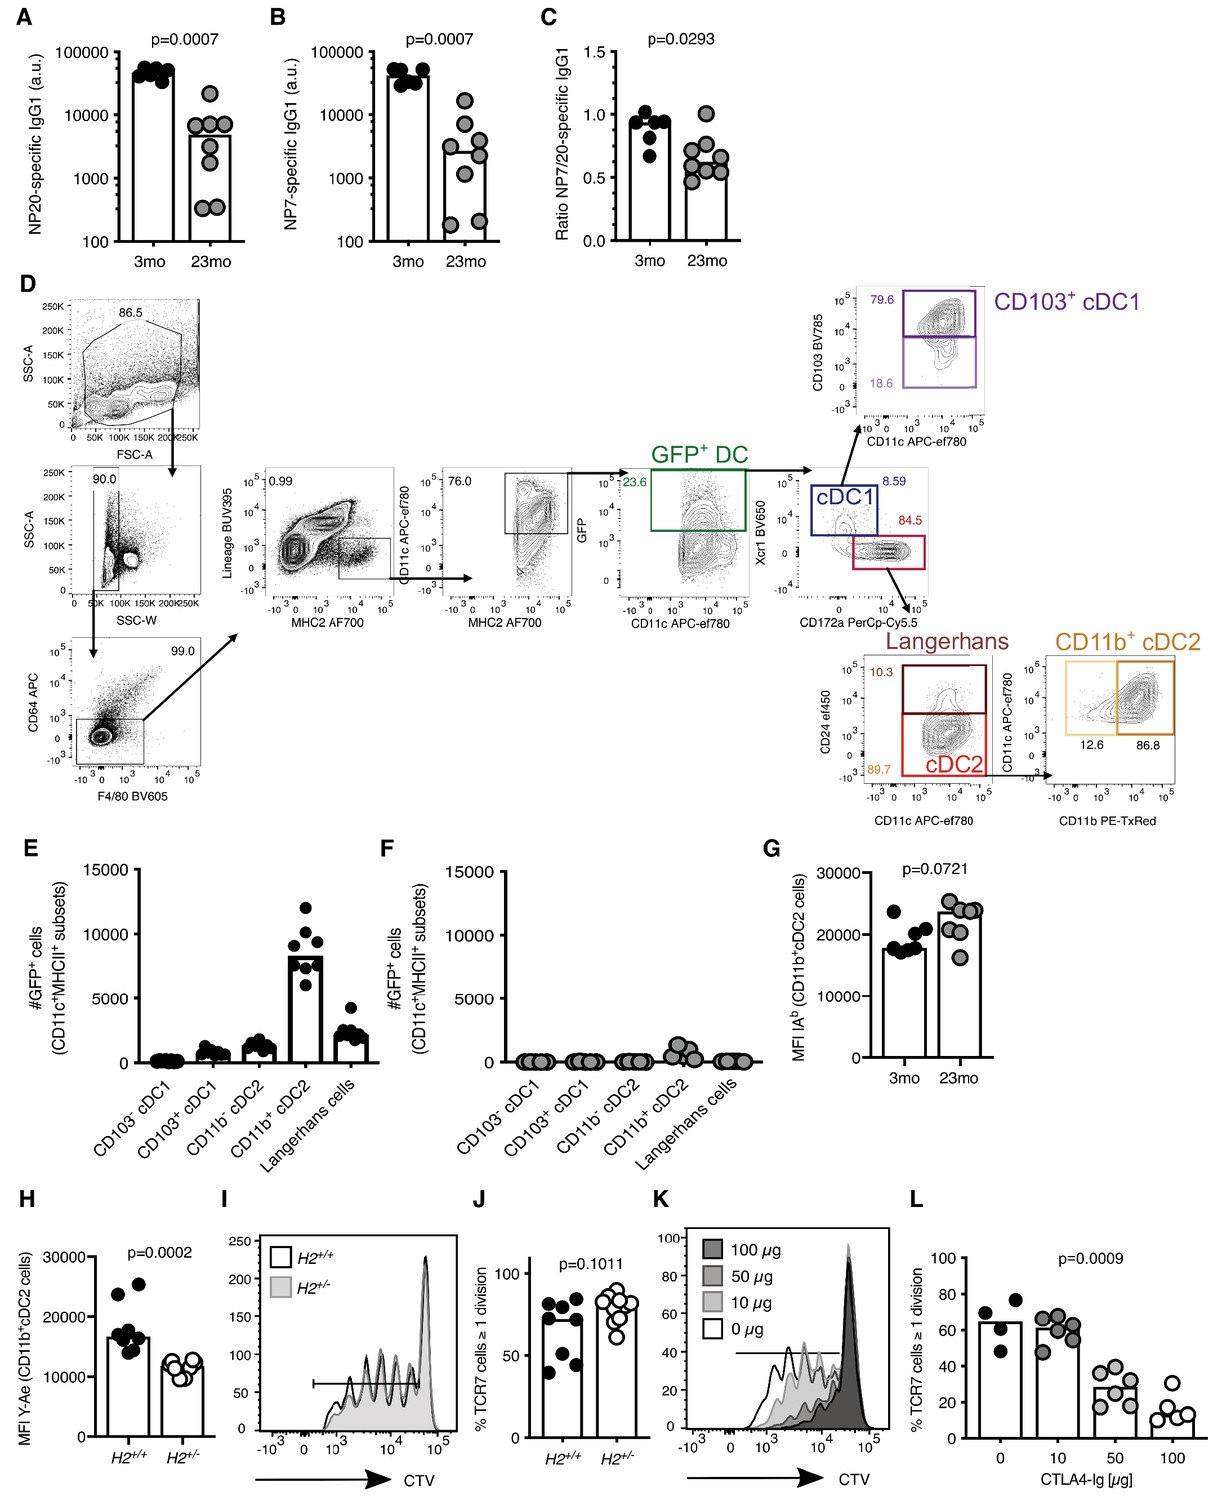
Migratory cDC2s are the main antigen-bearing cells in draining lymph nodes (LNs).
(A–C) 5 × 10⁴ OVA-specific (CD45.1+TCRVα2+CD4+) OTII cells were adoptively transferred into 2–3 month-old and 22–24 month-old C57BL/6 recipients, which were subsequently immunised subcutaneously with NP-OVA in Alum in the hind flank. Ten days later, NP-specific IgG1 antibody response were quantified by ELISA in the serum of these mice (n = 4–6 per group/experiment). (A) Serum levels of NP20-specific IgG1 antibodies. (B) Serum levels of high-affinity NP7-specific IgG1 antibodies. (C) Ratio of NP20/NP7-specific IgG1 antibodies in the serum as a measure of antibody affinity maturation. (D) Gating strategy for dendritic cell (DC) subsets in the LNs of mice immunised subcutaneously with Eα-GFP in IFA 22 hr previously. Antigen-carrying DCs were defined as GFP+CD11chiMHC-IIhiLineage-(CD3-B220-CD19-)CD64-F4/80- events. Type 1 conventional DCs (cDC1s) were defined as Xcr1+CD172a- DCs and were subdivided into CD103+ and CD103- cDC1s. Langerhans cells were defined as CD24+CD172a+Xcr1- DCs. Type 2 conventional DCs (cDC2s) were defined as CD24-CD172a+Xcr1- DCs and were subdivided into CD11b+ and CD11b- cDC2s. (E–F) Quantitation of GFP+ cells from different DC subsets in the draining LNs of 2–3 month-old mice 22 hr after subcutaneous immunisation with Eα-GFP in IFA, without (E) or with (F) intraperitoneal pertussis toxin treatment twice prior to, and once at the time of immunisation (n = 5 per group/experiment). (G) Quantitation of median fluorescence intensity (MFI) levels of I-Ab (C57BL/6 MHC-II) on the surface of GFP+CD11b+ cDC2s in adult and aged mice. (H) Quantitation of Eα-peptide presentation on CD11b+ cDC2s from H2+/+ and H2+/- mice as determined by Y-Ae surface staining 22 hr after immunisation with Eα-GFP/IFA. In (I–L), CellTrace violet (CTV)-labelled TCRVβ3+CD45.1+CD4+ TCR7 cells were adoptively transferred into recipient mice which were immunised subcutaneously with HEL in Alum. (I–J) Representative histogram (I) and quantitation (J) of CTV in CD45.1+CD4+ cells three days after adoptive transfer of these cells into H2+/+ or H2+/- mice subcutaneous immunised with HEL in Alum (n = 8–10 per group/experiment). The gate indicates cells that have undergone one or more divisions. In (K–L), TCRVβ3+CD45.1+CD4+ cells were adoptively transferred into C57BL/6 mice, which were immunised subcutaneously with HEL in Alum and also received intraperitoneal injections of 10, 50 or 100 µg CTLA4-Ig or PBS. On day 3, proliferation of CD45.1+CD4+ T cells was analysed by flow cytometry (n = 2–3 per group/experiment). Representative histogram (K) and quantitation (L) of divided CTV+CD45.1+CD4+ cells in mice treated with CTLA4-Ig or PBS. Graphs show the results of one of two independent experiments (A–C, E–J) or the combined results of two experiments (L). Bar height corresponds to the median, and each circle represents one biological replicate. P-values were determined using the Mann-Whitney test (A–C, E–J) or Kruskal-Wallis (L) test.
-
Figure 3—figure supplement 1—source data 1
Migratory cDC2s are the main antigen-bearing cells in draining lymph nodes.
- https://cdn.elifesciences.org/articles/52473/elife-52473-fig3-figsupp1-data1-v1.xlsx
Figure 4
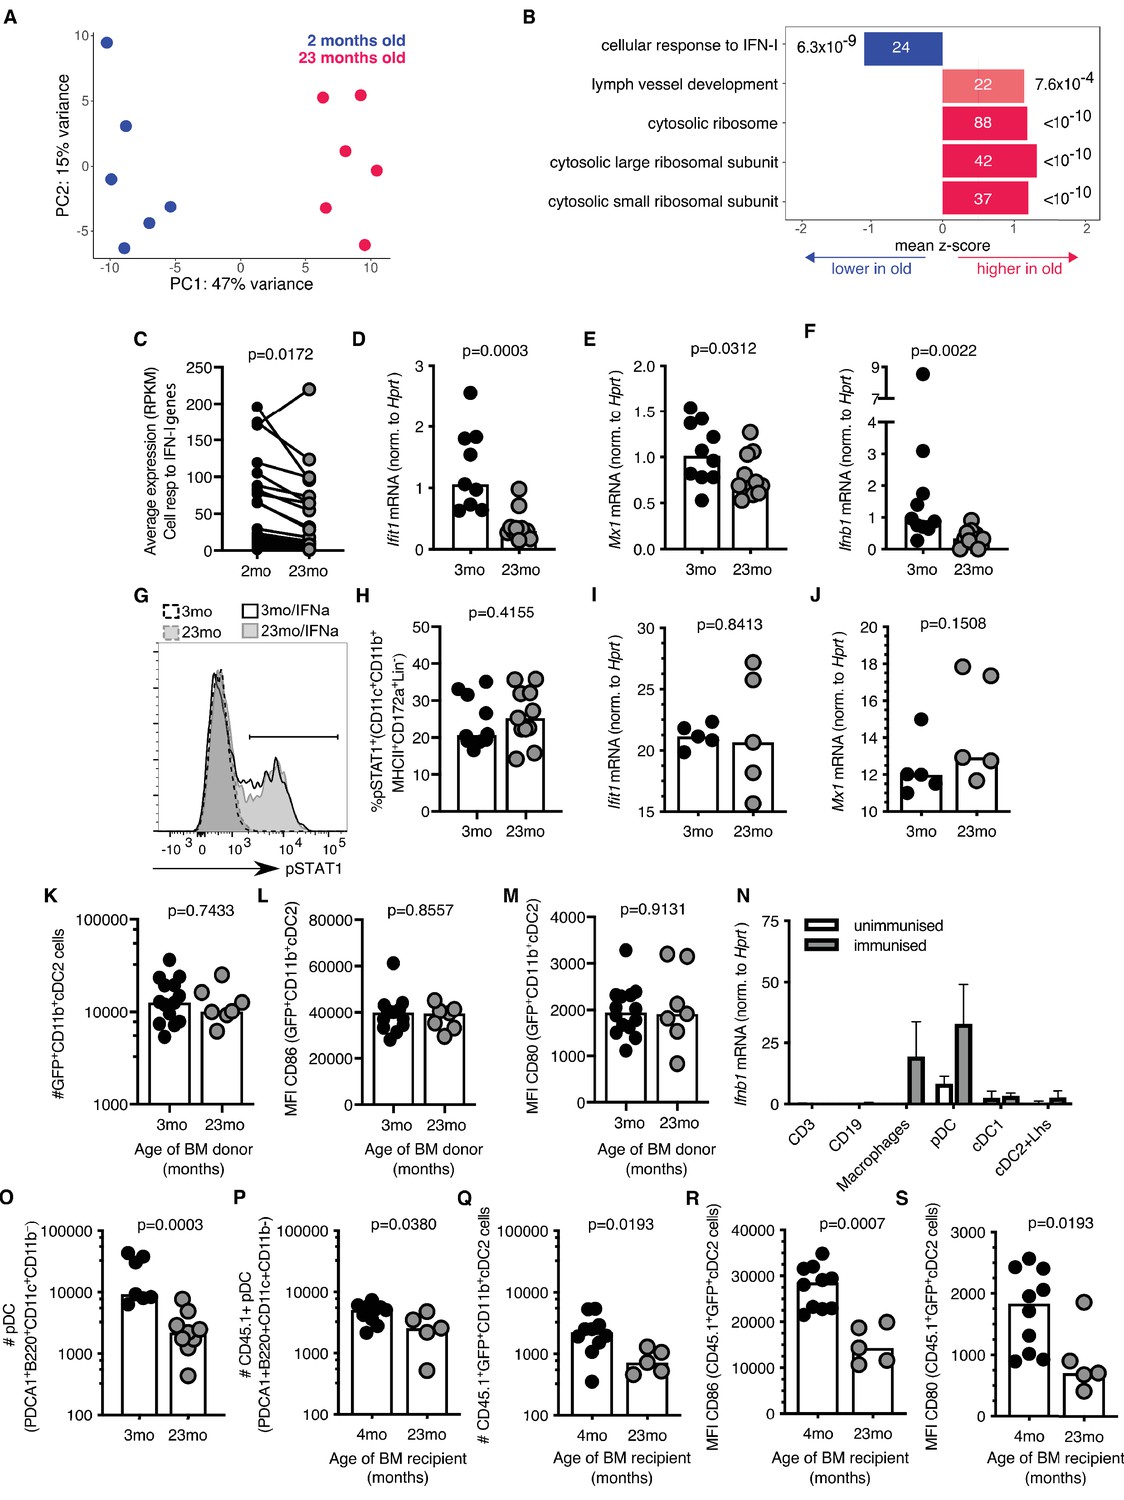
Reduced type I interferon (IFN-I) signalling in cDC2s from aged mice.
(A) Principal component analysis (PCA) of the 1000 genes with the largest variance in sorted GFP+CD11b+ cDC2s cells from adult 2-month-old (blue) and aged 23-month-old (pink) mice (n = 6 per group). (B) Functional categories significantly affected by age as determined by Gene Ontology Analysis using Seqmonk. From a publicly available list of gene sets (Merico et al., 2010), significantly different gene ontology terms are shown (Kolmogorov-Smirnov test, p<0.05, average absolute z-score >1, multiple testing correction). Bars are labelled with the number of genes in each set (inside) and the adjusted p-value (outside). (C) Average RPKM (read per kilobase million) expression of IFN-I-responsive genes in GFP+ CD11b+ cDC2s as determined by RNA sequencing. RPKM expression values of the same IFN-I stimulated gene in cDC2s from 2-month-old and 23-month-old mice are connected by lines. (D-E) 2–3 month-old and 22–24 month-old C57BL/6 mice were subcutaneously immunised with Eα-GFP in IFA. 22 hr later, Ifit1 (D) and Mx1 (E) mRNA levels were determined in sorted GFP+ CD11b+ cDC2s by RT-qPCR (n = 4–6 per group/experiment). (F) 2–3 month-old and 22–24 month-old C57BL/6 mice were subcutaneously immunised with Eα-GFP in IFA. 6 hr later, Ifnb1 mRNA levels were determined in cells isolated from the draining lymph nodes (LN) by RT-qPCR (n = 5 per group/experiment). (G-H) Representative flow cytometric plot (G) and quantitation (H) of STAT1 phosphorylation in CD11b+ cDC2s (CD11b+CD11c+MHCII+CD172a+CD8-CD4-B220- cells) from 2 to 3 month-old and 22–24 month-old C57BL/6 mice upon ex vivo treatment of LN cells with 50 U murine IFNα for 30 min, or no cytokine controls (n = 4–7 per group/experiment). (I-J) Ifit1 (I) and Mx1 (J) mRNA levels were determined in sorted GFP+ CD11b+ cDC2s by RT-qPCR upon ex vivo treatment of LN cells with 50 U murine IFNα for 3 hr. Expression levels were normalised to age-matched no cytokine controls (n = 5 per group/experiment). (K-M) Bone marrow (BM) cells from 3-month-old adult or 23-month-old aged mice were transferred into 2-month-old irradiated CD45.1+ C57BL/6 recipient mice. 8 weeks later, these BM chimeras were immunised subcutaneously with Eα-GFP in IFA. 22 hr later, DC populations were analysed by flow cytometry (n = 3–8 per group/experiment). (K) Quantitation of GFP+CD11b+ cDC2 cells in the draining LNs of BM chimeras. (L-M) Quantitation of median fluorescence intensity (MFI) levels of CD86 (L) and CD80 (M) on the surface of GFP+CD11b+ cDC2s in BM chimeras. (N) Ifnb1 expression in different cell populations FACS-sorted from the draining LNs of unimmunised adult mice or mice immunised with EαGFP 16 hr earlier as determined by RT-qPCR. Cell populations were defined as follows: CD3+ T cells, CD19+ B cells, macrophages (CD11c+CD64+F4/80+), pDC (CD3-CD19-B220+CD11c+PDCA1+), cDC1 (CD3-CD19-CD64-F4/80-MHC-II+CD11c+Xcr1+) and a population including cDC2s and Langerhans (Lhs) cells (CD3-CD19-CD64-F4/80-MHC-II+CD11c+Xcr1-). (O) Flow cytometric quantitation of the number of plasmacytoid DCs (pDCs; defined as B220+CD11c+CD11b-PDCA1+ cells) in the draining LNs of 2–3 month-old and 22–24 month-old C57BL/6 mice 22 hr after immunisation with Eα-GFP/IFA (n = 5–6 per group/experiment). (P-S) Bone marrow (BM) cells from 2-month-old CD45.1+ C57BL/6 SJL mice were transferred into 2-month-old or 21-month-old irradiated C57BL/6 recipient mice. 8 weeks later, these BM chimeras were immunised subcutaneously with Eα-GFP in IFA. 22 hr later, DC populations were analysed by flow cytometry (n = 2–5 per group/experiment). (P-Q) Quantitation of CD45.1+ pDCs (P) and GFP+CD11b+ cDC2s (Q) in the draining LNs of BM chimeras. (R-S) Quantitation of median fluorescence intensity (MFI) levels of CD86 (R) and CD80 (S) on the surface of CD45.1+GFP+CD11b+cDC2s in BM chimeras. Bar graphs show the pooled results from at least two experiments except in (I-J), which show the results of one of two experimental repeats. Bar heights correspond to the median, and each circle represents one biological replicate. In (N) bar heights correspond to the mean and error bars represent standard deviation. P-values were determined using the Mann-Whitney test.
-
Figure 4—source data 1
Reduced type I interferon (IFN-I) signalling in cDC2s from aged mice.
- https://cdn.elifesciences.org/articles/52473/elife-52473-fig4-data1-v1.xlsx
Figure 5
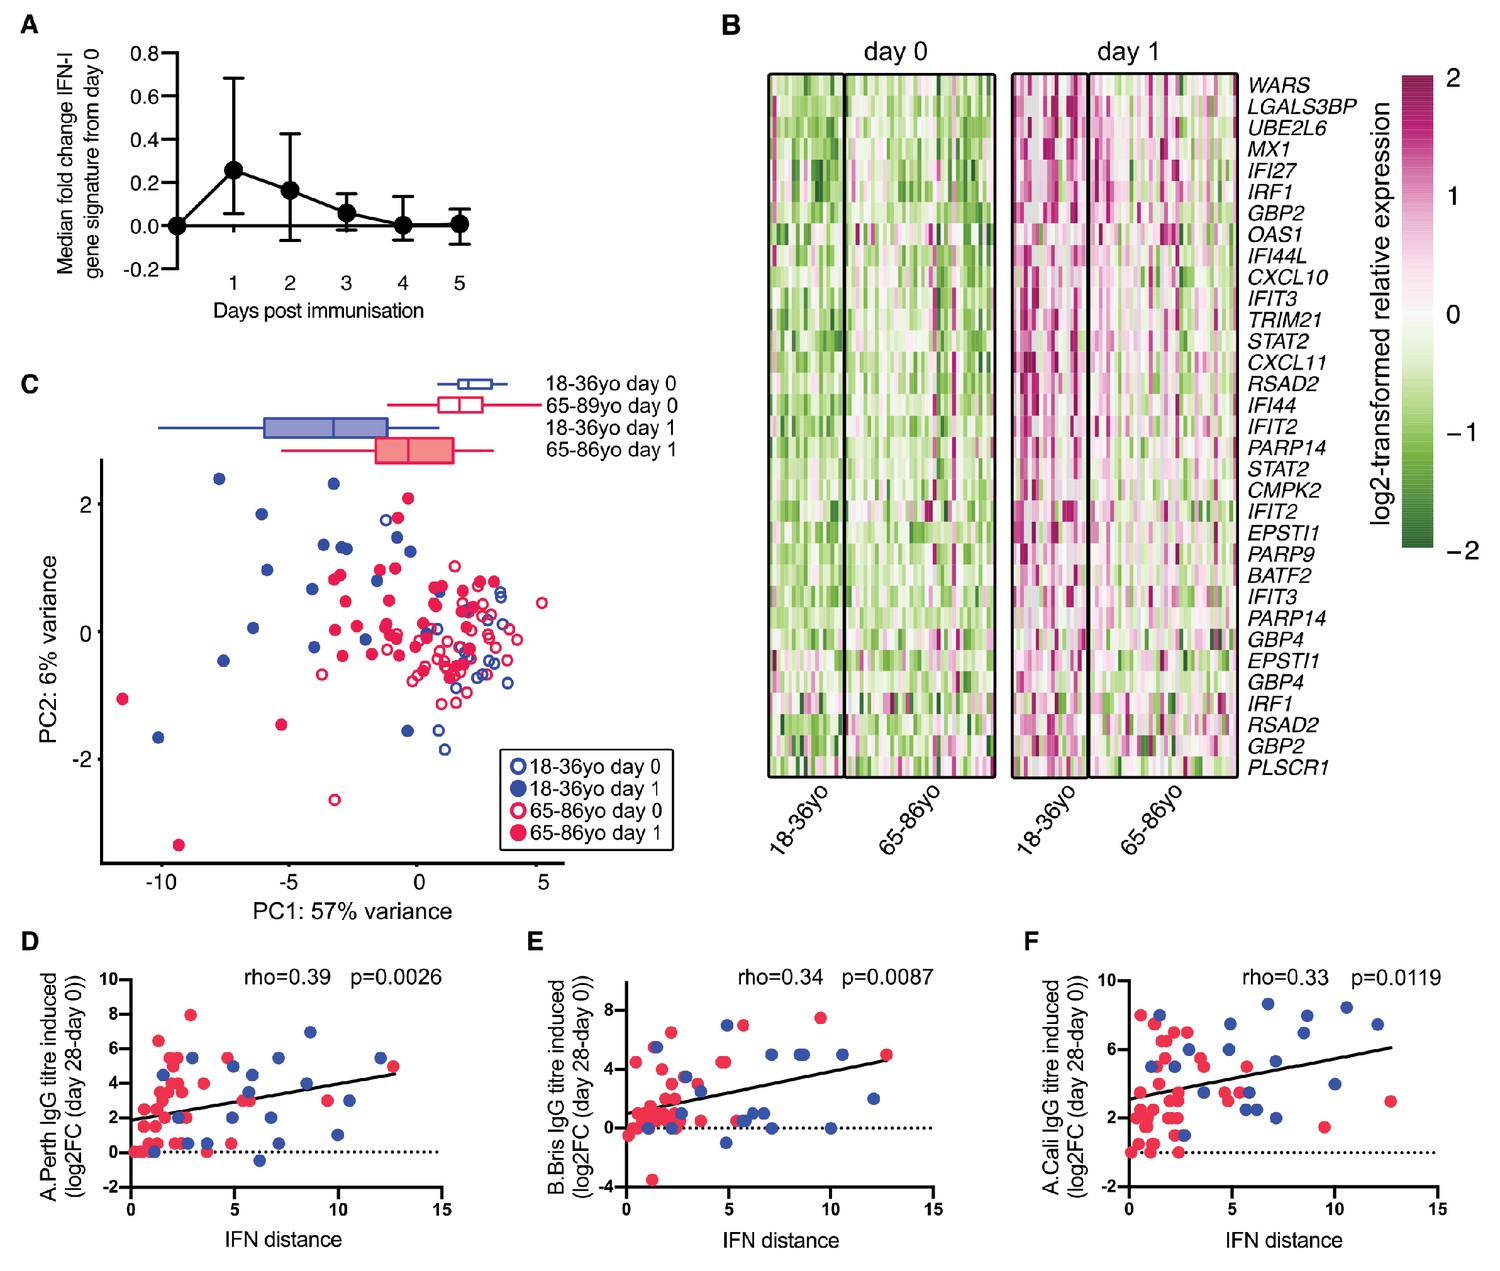
Poor vaccine responses in older persons correlate with attenuated IFN-I signalling.
(A) Time course of the expression of IFN-I-stimulated genes in whole PBMC after influenza vaccination. Median expression of IFN-I-stimulated genes were calculated for each sample at each day and normalised by the day 0 value. The mean and range for five individuals are shown. (B) Heatmap of expression values of a curated list of significant probe sets for IFN-I-stimulated genes (ISGs) induced with a log2-fold change of >0.5 determined using the dataset in (A), and applied to days 0 and 1 in 18–36 year-old (18–36 yo; n = 19) or 65–86 year-old (65–85 yo; n = 39) individuals. (C) Principal component analysis (PCA) of the differentially expressed ISGs from (B) with data from younger and older individuals plotted in blue and pink, respectively. Open circles represent data from day 0, closed circles represent data from day 1 after vaccination, and boxplots represent the distribution of PC1 coordinates for each group. (D-F) The distance from baseline to day 1 after vaccination on the PCA plot in (C) (‘IFN-I distance’) correlates with log2 fold-changes (day 28/day 0) of HAI titres for A/Perth 2009 (D), B/Brisbane 2008 (E) and A/California 2009 (F). In (F-H), Spearman’s correlation coefficients (rho) and their p-values are shown and younger and older individuals are plotted in blue or pink, respectively. Data are reanalysed from publicly available datasets (Franco et al., 2013; Henn et al., 2013; Nakaya et al., 2015).
-
Figure 5—source data 1
Poor vaccine responses in older persons correlate with attenuated IFN-I signalling.
- https://cdn.elifesciences.org/articles/52473/elife-52473-fig5-data1-v1.xlsx
Figure 6 with 1 supplement
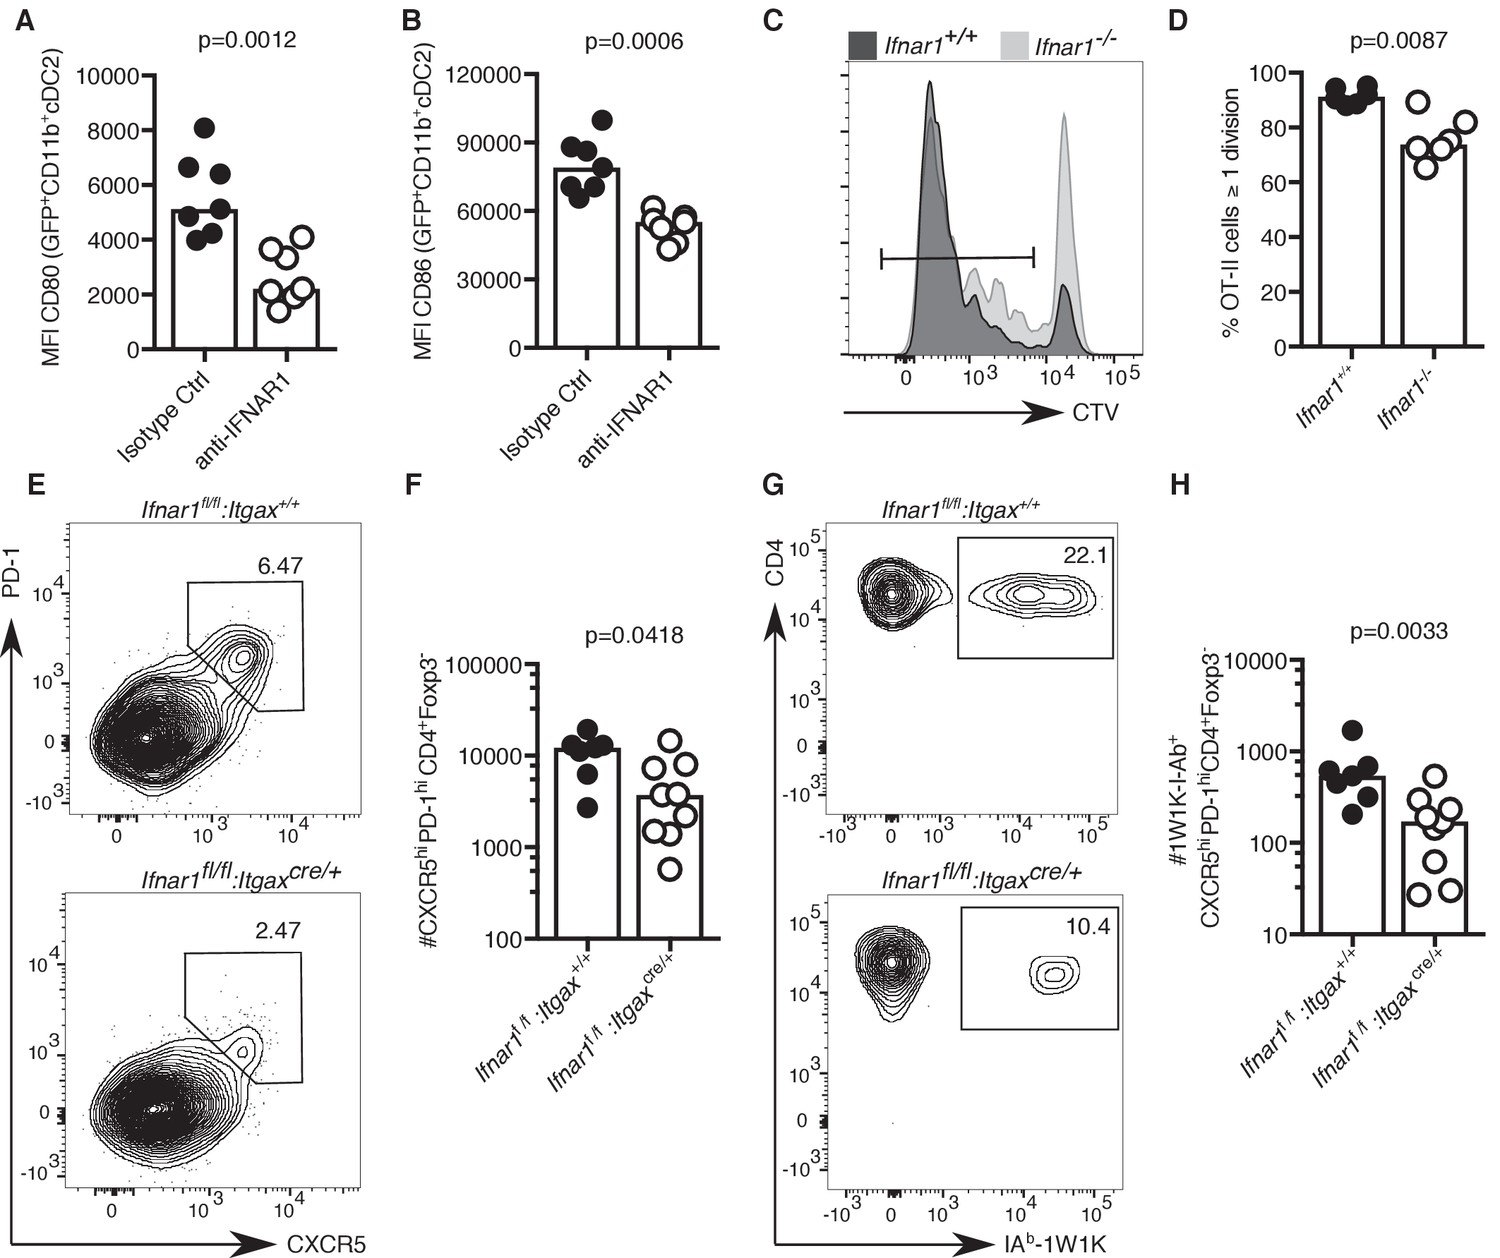
Lack of IFN-I signalling in DCs impairs Tfh cell differentiation.
(A–B) Quantitation of median fluorescence intensity (MFI) levels of CD80 and CD86 on GFP+ CD11b+ cDC2s in mice treated with anti-IFNAR1 blocking or isotype control antibodies (n = 7 per group/experiment). (C-D) Representative flow cytometric histograms (C) and quantitation (D) of divided CTV+CD45.1+CD4+, which had been transferred into Ifnar1-/- and Ifnar1+/+ mice and immunised with ovalbumin (OVA) in Alum three days earlier (n = 6 per group/experiment). (E-H) Flow cytometric analysis (E, G) and quantitation (F, H) of total (E-F) and 1W1K-I-Ab+ (G-H) CXCR5hiPD-1hiFoxp3-CD4+ T follicular helper (Tfh) cells isolated from Ifnar1fl/fl:Itgaxcre/+ or Ifnar1fl/fl:Itgax+/+ control mice seven days after immunisation with NP-1W1K in Alum (n = 8–9 per group/experiment). Bar graphs show the results of one of two experimental repeats. Bar height corresponds to the median, and each circle represents one biological replicate. P-values were determined using the Mann-Whitney test. Supporting data is shown in Figure 6—figure supplement 1.
-
Figure 6—source data 1
Lack of IFN-I signalling in DCs impairs Tfh cell differentiation.
- https://cdn.elifesciences.org/articles/52473/elife-52473-fig6-data1-v1.xlsx
Figure 6—figure supplement 1
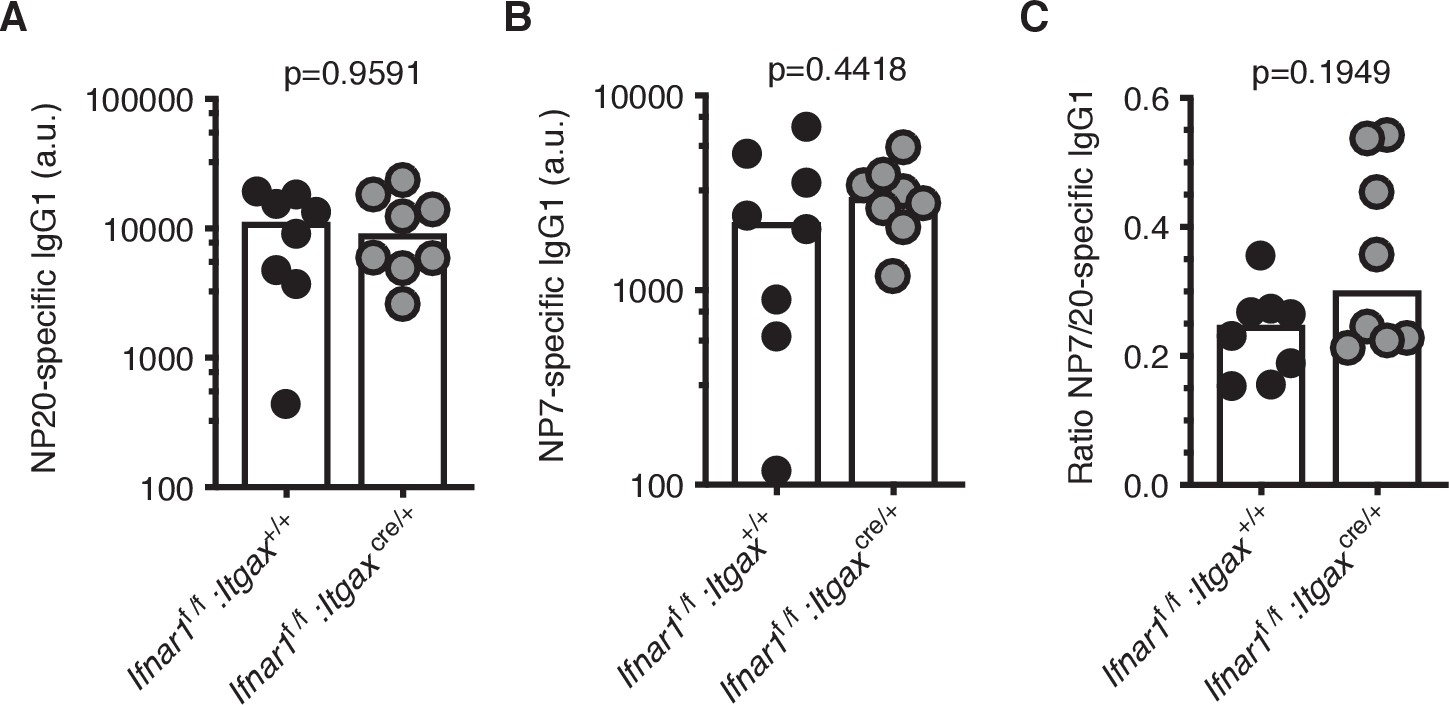
Lack of IFN-I signalling in DCs does not affect early antigen-specific antibody responses.
(A–C) Quantitation of NP-specific IgG1 antibody responses in the serum of Ifnar1fl/fl:Itgaxcre/+ or Ifnar1fl/fl:Itgax+/+ control mice seven days after immunisation with NP-1W1K in Alum by ELISA (n = 4–9 per group/experiment). (A) Serum levels of NP20-specific IgG1 antibodies. (B) Serum levels of high-affinity NP7-specific IgG1 antibodies. (C) Ratio of NP20/NP7-specific IgG1 antibodies in the serum as a measure of antibody affinity maturation. Bar graphs show the results of one of two experimental repeats. Bar height corresponds to the median, and each circle represents one biological replicate. P-values were determined using the Mann-Whitney test.
-
Figure 6—figure supplement 1—source data 1
Lack of IFN-I signalling in DCs does not affect early antigen-specific antibody responses.
- https://cdn.elifesciences.org/articles/52473/elife-52473-fig6-figsupp1-data1-v1.xlsx
Figure 7 with 1 supplement
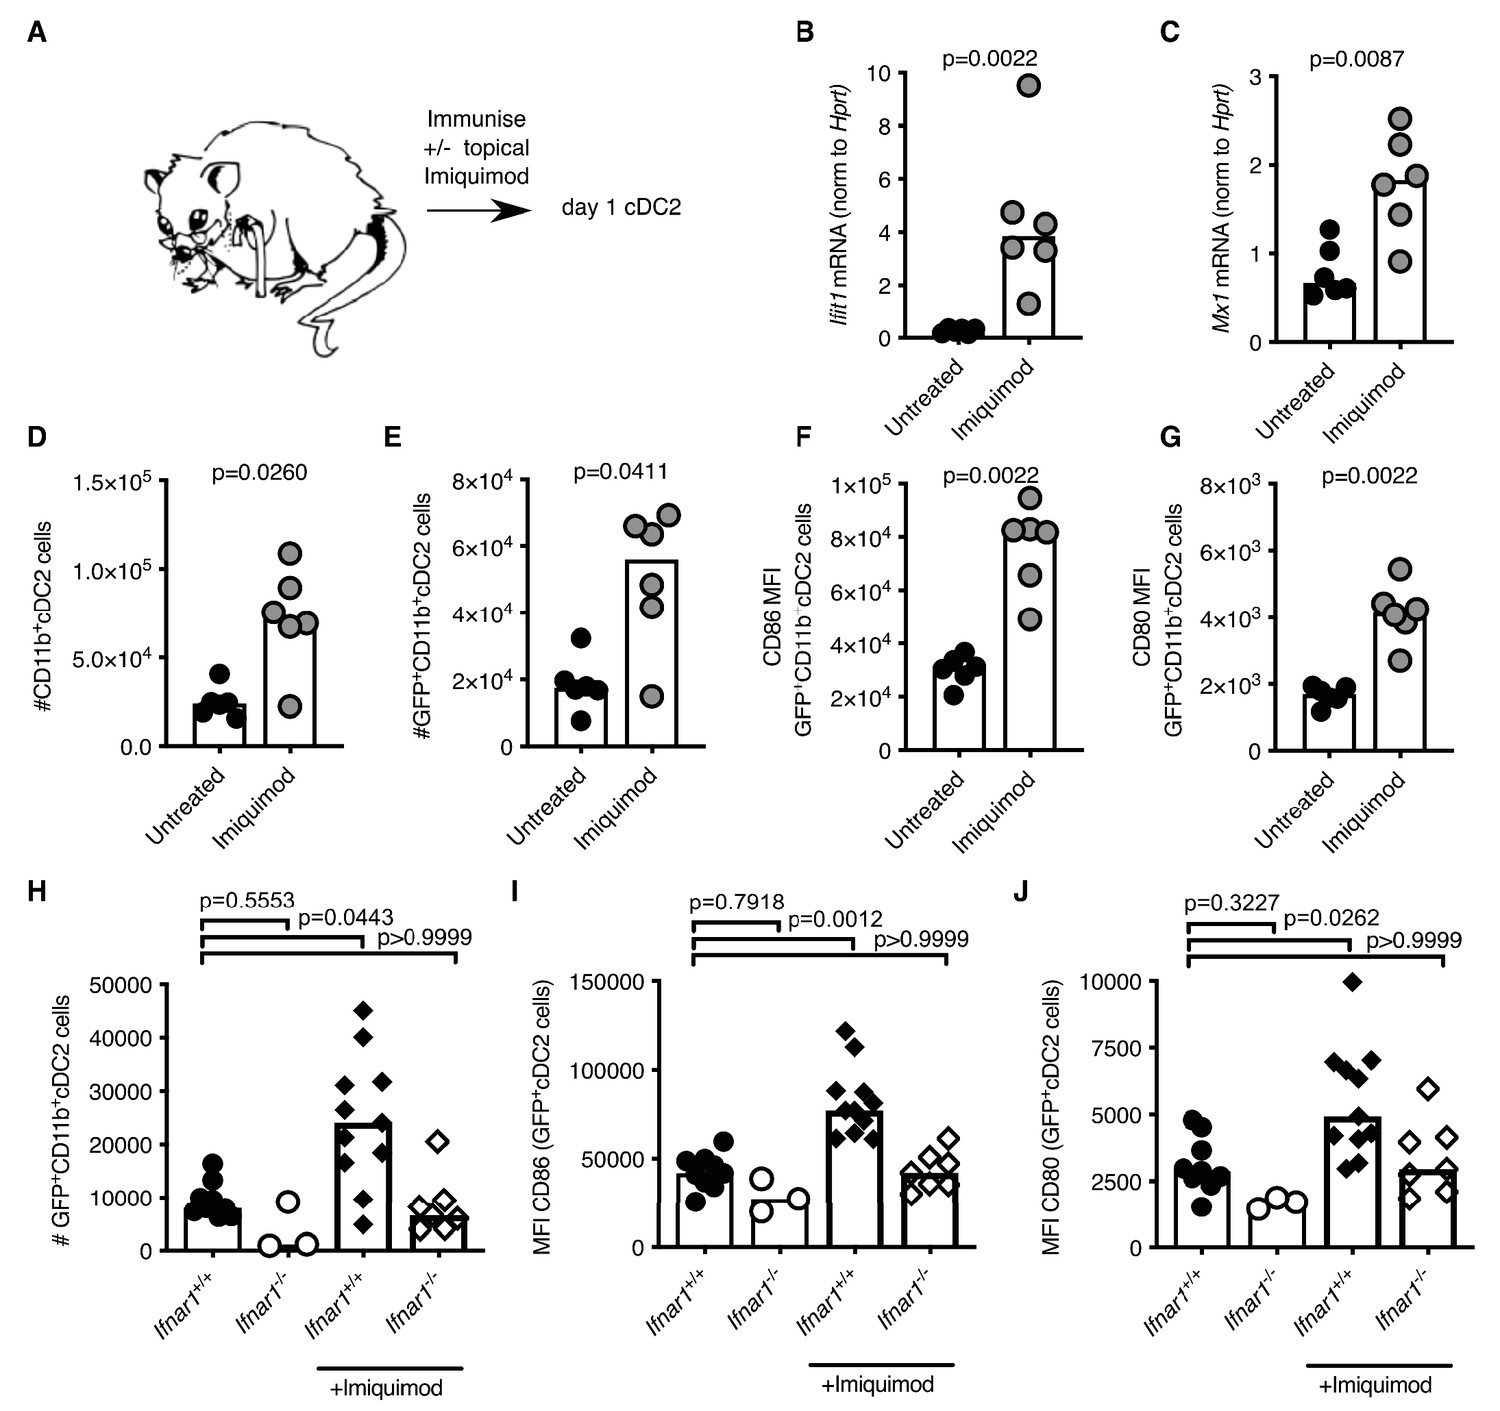
Imiquimod rejuvenates cDC2s in aged mice by enhancing IFN-I signalling.
(A) Schematic representation of the experimental set-up. (B-G) 22–24 month-old mice were immunised subcutaneously with Eα-GFP in IFA. Half of the mice were topically treated with imiquimod cream over their immunisation sites. 22 hr after immunisation with Eα-GFP in IFA, Ifit1 (B) and Mx1 (C) mRNA expression in sorted GFP+ CD11b+ cDC2s was analysed by RT-qPCR. (D-E) Flow cytometric quantitation of total (D) and GFP+(E) CD11b+ cDC2 cells in the draining lymph nodes (LNs) of 22–24 month-old mice with or without imiquimod treatment. (F-G) Quantitation of median fluorescence intensity (MFI) levels of CD86 (F) and CD80 (G) on the surface of GFP+ CD11b+ cDC2s in 23-month-old mice with or without imiquimod treatment. (H-J) 2 month old Ifnar1-/- and Ifnar1+/+ mice were immunised subcutaneously with Eα-GFP in IFA and some of the mice were additionally treated with imiquimod cream over their immunisation sites. (H) 22 hr later the number of GFP+ CD11b+ cDC2 cells in the draining lymph nodes (LNs) were quantified. (I-J) Quantitation of median fluorescence intensity (MFI) levels of CD86 (I) and CD80 (J) on the surface of these GFP+ CD11b+ cDC2s. Bar graphs show the results of one of two independent experiments (B-G; n = 6 per group/experiment) or the pooled results from two experiments (H-J; n = 3–11 per group). Bar height corresponds to the median, and each circle represents one biological replicate. In (B-G) p-values were determined using the Mann-Whitney test. In (H-J) p-values were determined by comparing each group to the ‘Ifnar1+/+ no imiquimod control’ group using the Kruskal Wallis test with Dunn’s multiple testing correction. Supporting data is shown in Figure 7—figure supplement 1.
-
Figure 7—source data 1
Imiquimod rejuvenates cDC2s in aged mice by enhancing IFN-I signalling.
- https://cdn.elifesciences.org/articles/52473/elife-52473-fig7-data1-v1.xlsx
Figure 7—figure supplement 1
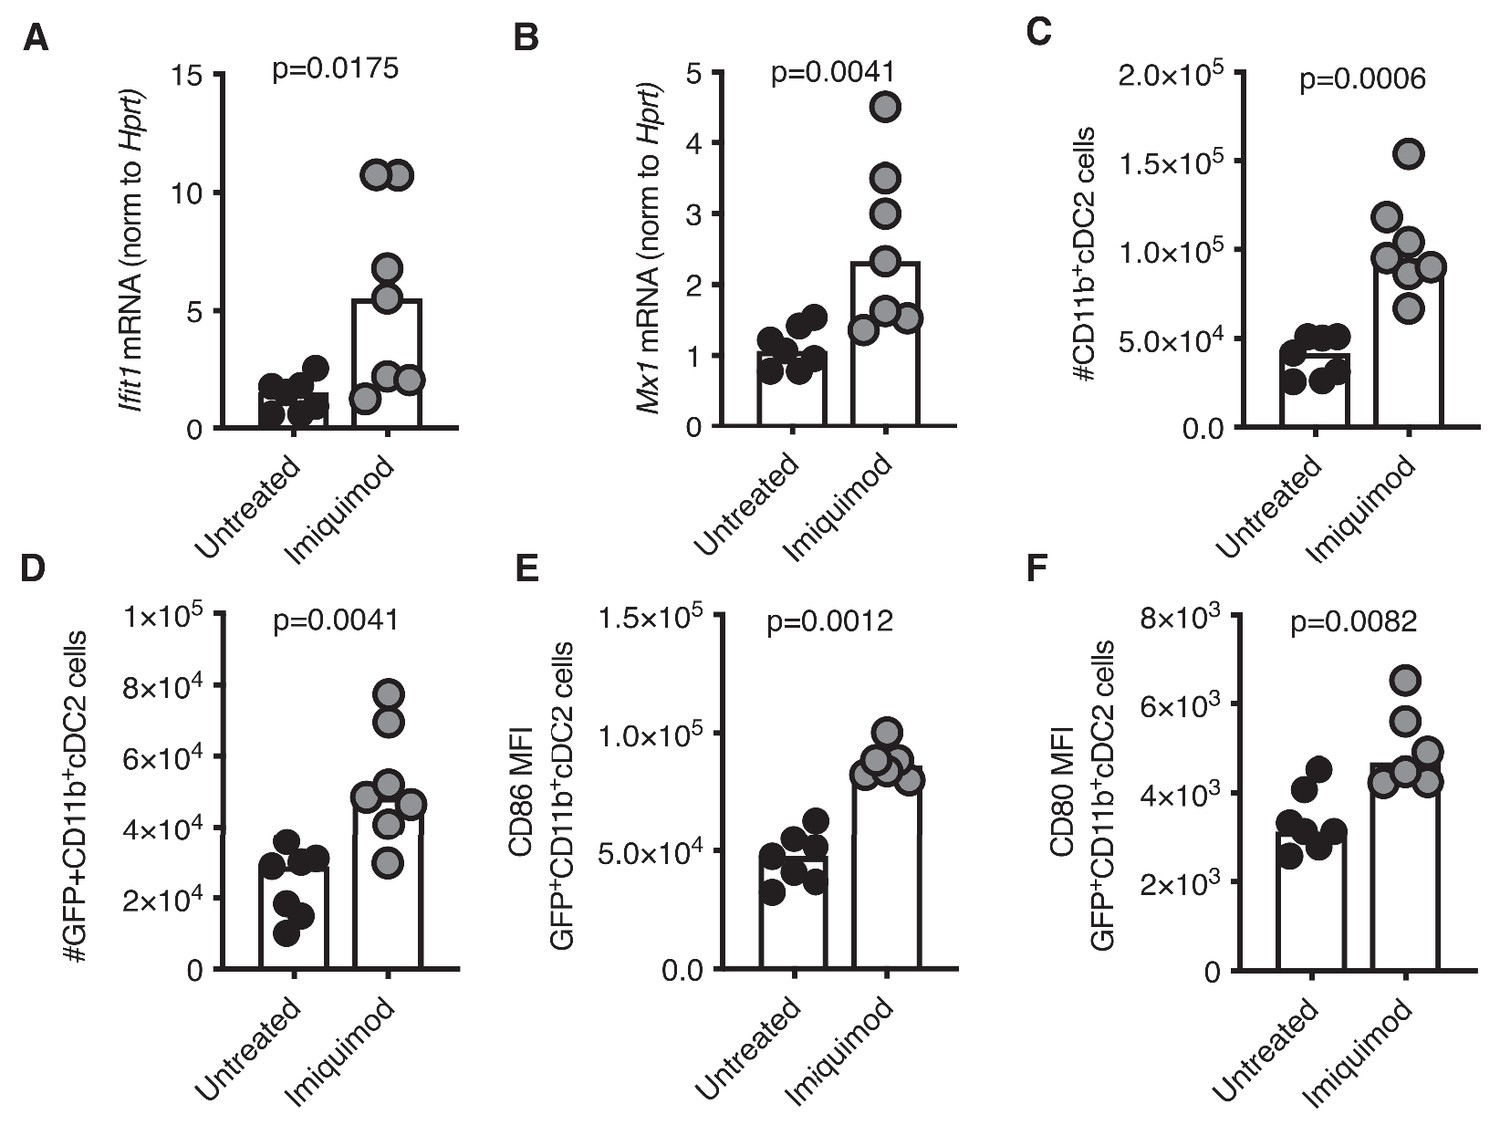
Imiquimod induces IFN-I signalling and boosts cDC2 responses.
2–3 month-old mice were immunised subcutaneously with either Eα-GFP in IFA. Half of the mice were topically treated with imiquimod cream over their immunisation sites. 22 hr after immunisation with Eα-GFP in IFA Ifit1 (A) and Mx1 (B) mRNA expression in sorted GFP+ CD11b+ cDC2s was analysed by RT-qPCR. (C–D) Flow cytometric quantitation of total (C) and GFP+(D) CD11b+ cDC2 cells in the draining lymph nodes (LNs) of 2–3 month-old mice with or without imiquimod treatment. (E–F) Quantitation of median fluorescence intensity (MFI) levels of CD86 (E) and CD80 (F) on the surface of GFP+ CD11b+ cDC2s in 2–3 month-old mice with or without imiquimod treatment. Bar graphs show the pooled results of two experiments (A–F); n = 3–4 per group/experiment). Bar height corresponds to the median, and each circle represents one biological replicate. P-values were determined using the Mann-Whitney test.
-
Figure 7—figure supplement 1—source data 1
Imiquimod boosts Tfh cell differentiation in young mice.
- https://cdn.elifesciences.org/articles/52473/elife-52473-fig7-figsupp1-data1-v1.xlsx
Figure 8 with 1 supplement
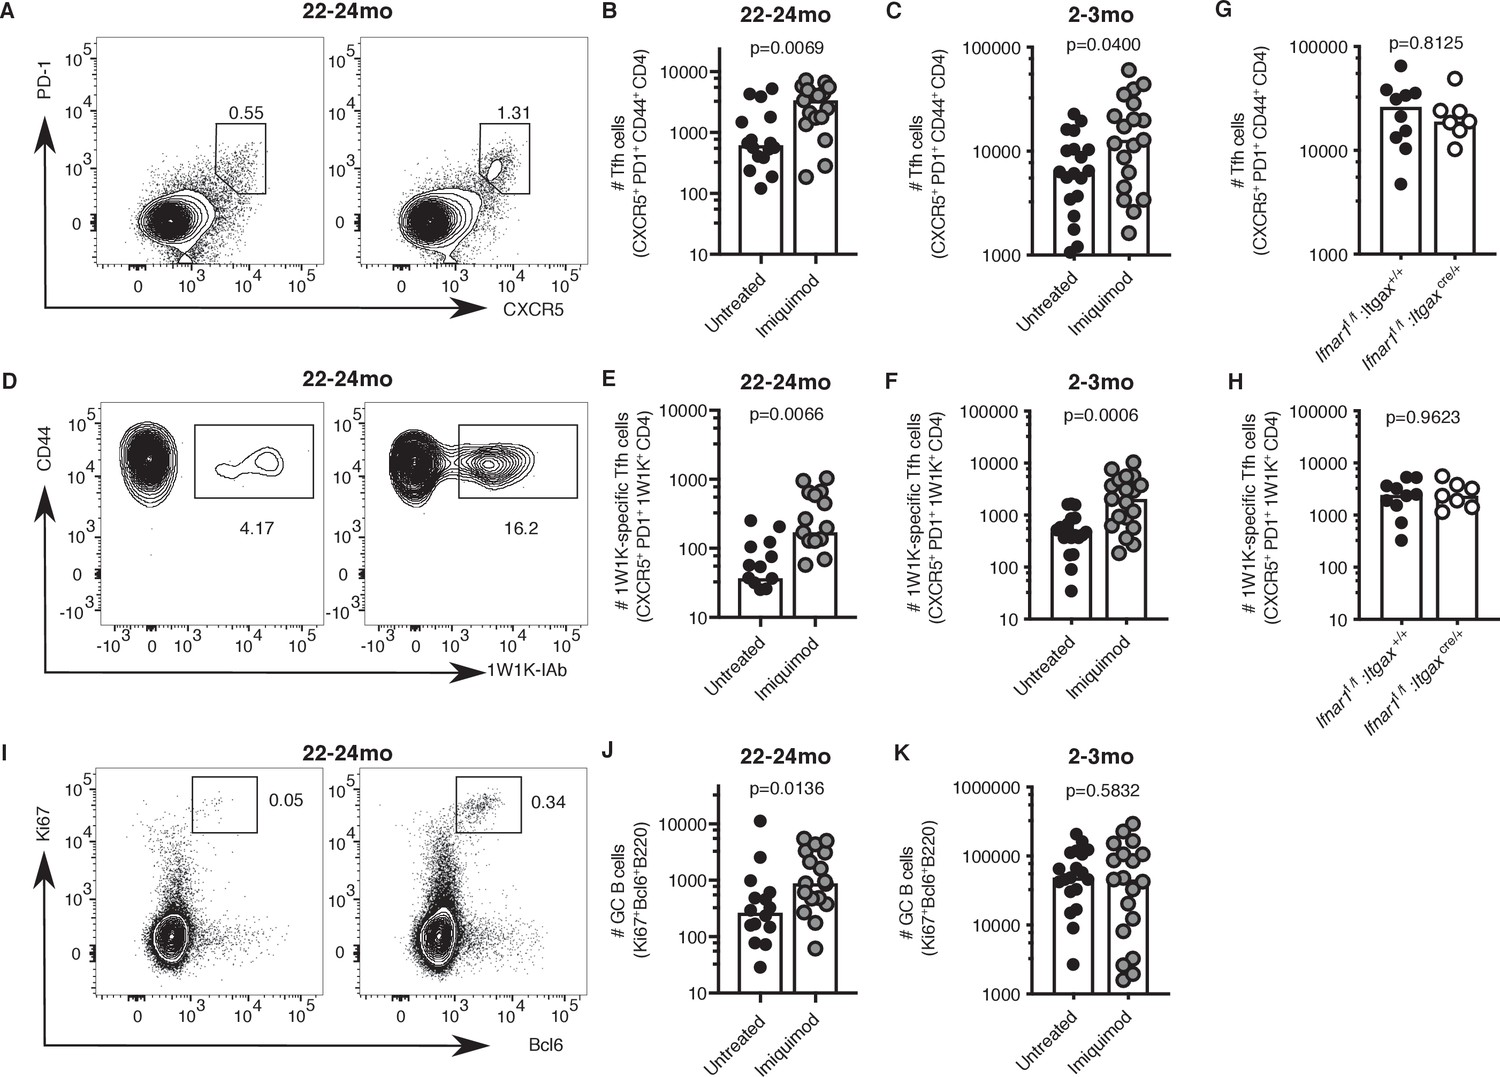
Imiquimod rejuvenates Tfh cell differentiation.
2–3 month-old and 22–24 month-old C57BL/6 mice (A-F, I-K) or 2 month old Ifnar1fl/fl:Itgaxcre/+ and Ifnar1fl/fl:Itgax+/+ littermate controls (G-H) were all subcutaneously immunised with NP-1W1K in Alum and then either topically treated with imiquimod cream over their immunisation sites (‘Imiquimod’, Ifnar1fl/fl:Itgaxcre/+ and Ifnar1fl/fl:Itgax+/+ mice) or left untreated (‘Untreated’). Seven days later, draining LN cells were analysed by flow cytometry. (A-F) Representative flow cytometric plots and quantitation of CXCR5hiPD-1hiCD4+ T follicular helper (Tfh) cells (A-C) as well as antigen-specific 1W1K-I-Ab+ Tfh cells (D-F) in 22–24 month-old (A-B, D-E) and 2–3 month-old (C, F) mice. (G-H) Quantitation of CXCR5hiPD-1hiCD4+ T follicular helper (Tfh) cells (G) as well as antigen-specific 1W1K-I-Ab+ Tfh cells (H) in two month old Ifnar1fl/fl:Itgaxcre/+ and Ifnar1fl/fl:Itgax+/+ littermate controls seven days after immunisation with NP-1W1K in Alum and imiquimod treatment. (I-K) Representative flow cytometric plots and quantitation of B220+Ki67+Bcl6+germinal centre (GC) B cells in 22–24 month-old (I-J) and 2–3 month-old (K) mice seven days after immunisation with NP-1W1K in Alum with or without topical imiquimod treatment. Bar graphs show the results of one of three independent experiments (G-H; n = 6–10 per group/experiment), or the pooled results of three independent experiments (A-F, I-K; n = 4–7 per group/experiment). Bar height corresponds to the median, and each circle represents one biological replicate. P-values were determined using the Mann-Whitney test. Supporting data is shown in Figure 8—figure supplement 1.
-
Figure 8—source data 1
Imiquimod rejuvenates Tfh cell differentiation.
- https://cdn.elifesciences.org/articles/52473/elife-52473-fig8-data1-v1.xlsx
Figure 8—figure supplement 1
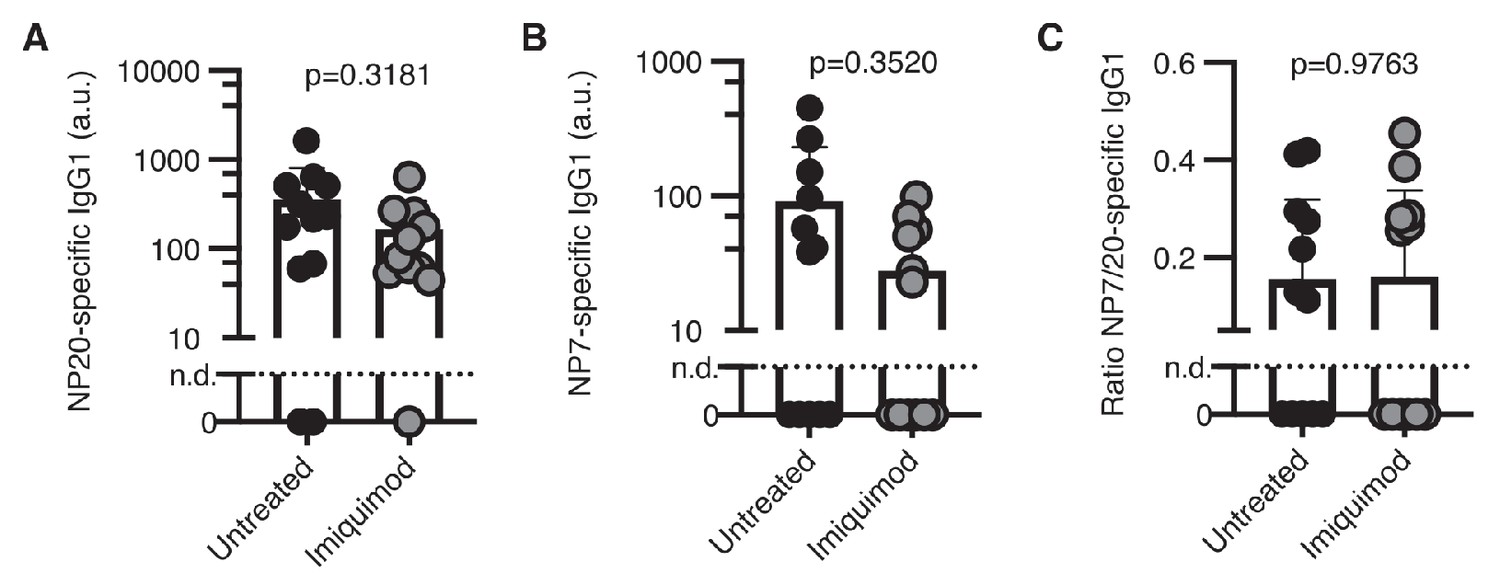
Imiquimod treatment does not affect early antigen-specific antibody responses.
(A–C) 22–24 month-old mice were immunised subcutaneously with NP-1W1K in Alum. Half of the mice were topically treated with imiquimod cream over their immunisation sites. Seven days later, serum levels of antigen-specific IgG1 antibodies were determined by ELISA. (A) Serum levels of NP20-specific antibodies. (B) Serum levels of high-affinity NP7-specific antibodies. (C) Ratio of NP20/NP7-specific antibodies in the serum as a measure of antibody affinity maturation. Bar graphs show the pooled results of two experiments (n = 6 per group/experiment). Bar height corresponds to the median, and each circle represents one biological replicate. P-values were determined using the Mann-Whitney test.
-
Figure 8—figure supplement 1—source data 1
Imiquimod treatment does not affect early antigen-specific antibody responses.
- https://cdn.elifesciences.org/articles/52473/elife-52473-fig8-figsupp1-data1-v1.xlsx
Tables
Table 1
Antibodies used for flow cytometry of human PBMC.
| Antibody | Company and clone | Dilution |
|---|---|---|
| eFluor780 Viability dye | eBioscience | 1:5000 |
| APC-eFluor780-coupled anti-human CD14 | eBioscience (61D3) | 1:50 |
| APC-eFluor780-coupled anti-human CD16 | eBioscience (eBioCB16) | 1:50 |
| APC-eFluor780-coupled anti-human CD19 | eBioscience (HIB19) | 1:50 |
| BUV395-coupled anti-human CD3 | BD (UCHT1) | 1:100 |
| PerCp-Cy5.5-coupled anti-human CD4 | BD (RPA-T4) | 1:50 |
| BUV737-coupled anti-human CD45RA | BD (HI100) | 1:25 |
| PE-Cy7-coupled anti-human PD1 | eBioscience (eBioJ105) | 1:25 |
| BB515-coupled anti-human CXCR5 | BD (RF8B2) | 1:25 |
Table 2
Antibodies and conjugated probes used for flow cytometry and FACS of mouse tissues.
| Antibody | Supplier (Clone) | Dilution |
|---|---|---|
| PE/PE-Cy7-coupled anti-mouse Bcl6 | BD Biosciences (K112-91) | 1:100 |
| PE-Cy7-coupled anti-mouse CD95 | BD Biosciences (Jo2) | 1:200 |
| BV605-coupled anti-mouse IgG1 | BD Biosciences (A85-1) | 1:100 |
| PE-Cy7/BUV395-coupled anti-mouse CD3 | BD Biosciences (145–2 C11) | 1:300 |
| PE-Cy7/BUV395-coupled anti-mouse CD19 | BD Biosciences (1D3) | 1:200-1:300 |
| PE-Cy7/BUV395-coupled anti-mouse B220 | BD Biosciences (RA3-6B2) | 1:300 |
| BUV395-coupled anti-mouse CD8a | BD Biosciences (53–6.7) | 1:200 |
| AF647-coupled anti-mouse CD64 | BD Biosciences (X54-5/71) | 1:200 |
| PE-Cf594-coupled anti-mouse CD11b | BD Biosciences (M1/70) | 1:200 |
| BV786-coupled anti-mouse CD103 | BD Biosciences (M290) | 1:200 |
| PE/BV510-coupled anti-mouse CD86 | BD Biosciences (GL1) | 1:300 |
| APC-AF780-coupled anti-mouse PD1 | eBioscience (J43) | 1:200 |
| APC/Foxp3-coupled anti-mouse Foxp3 | eBioscience (FJK-16S) | 1:100-1:200 |
| AF488/AF700-coupled anti-mouse Ki67 | eBioscience (SolA15) | 1:100 |
| Biotin-coupled anti-mouse Gr1 | eBioscience (RB6-8C5) | 1:200 |
| eF450-coupled anti-mouse CD38 | eBioscience (90) | 1:400 |
| PerCp-Cy5.5-coupled anti-mouse CD172a | eBioscience (P84) | 1:200 |
| eF450-coupled anti-mouse CD24 | eBioscience (M1/69) | 1:500 |
| APC/APC-AF870-coupled anti-mouse CD11c | eBioscience (N418) | 1:200 |
| PE-Cy5/APC-coupled anti-mouse CD80 | eBioscience (16-10A1) | 1:300 |
| PerCp-Cy5.5-coupled anti-mouse CD45.2 | eBioscience (104) | 1:200 |
| AF700-coupled anti-mouse MHC-II | eBioscience (M5/114.12.2) | 1:400 |
| BV421-coupled anti-mouse CXCR5 | Biolegend (L138D7) | 1:100 |
| V500/PE/BV605-coupled anti-mouse CD4 | Biolegend (RM4-5) | 1:400-1:800 |
| BV510/BV785-coupled anti-mouse B220 | Biolegend (RA3-6B2) | 1:200-1:400 |
| PerCp-Cy5.5-coupled anti-mouse CD44 | Biolegend (IM7) | 1:200 |
| AF488-coupled anti-mouse GL7 | Biolegend (GL7) | 1:100 |
| BV605/PE-coupled anti-mouse F4/80 | Biolegend (BM8) | 1:200 |
| BV650-coupled anti-mouse XCR1 | Biolegend (ZET) | 1:200 |
| PE-Cy7-coupled anti-mouse CD40 | Biolegend (3/23) | 1:300 |
| AF700-coupled anti-mouse CD45.1 | Biolegend (A20) | 1:200 |
| PerCp-Cy5.5-coupled anti-mouse PDCA-1 | Biolegend (927) | 1:100 |
| PE-coupled anti-mouse TCR Vβ3 | BD Biosciences (KJ25) | 1:100 |
| APC-coupled anti-mouse TCR Vα2 | eBioscience (B20.1) | 1:100 |
| APC/PE-Cy7/BV510-coupled Streptavidin StrepavidinStreptavidin | Biolegend, eBioscience | 1:600 |
| Biotin-coupled anti-mouse Eα 52–68 peptide | eBioscience (eBioY-Ae) | 1:200 |
| PE-coupled 1W1K-IAb tetramer | NIH Tetramer core facility | 1:100 |
| PE-coupled anti-mouse pSTAT1 | BD Biosciences Phosflow (pY701) | 1:10 |
Additional files
-
Supplementary file 1
Key Resources Table.
- https://cdn.elifesciences.org/articles/52473/elife-52473-supp1-v1.docx
-
Transparent reporting form
- https://cdn.elifesciences.org/articles/52473/elife-52473-transrepform-v1.pdf
Download links
A two-part list of links to download the article, or parts of the article, in various formats.
Downloads (link to download the article as PDF)
Open citations (links to open the citations from this article in various online reference manager services)
Cite this article (links to download the citations from this article in formats compatible with various reference manager tools)
Rejuvenating conventional dendritic cells and T follicular helper cell formation after vaccination
eLife 9:e52473.
https://doi.org/10.7554/eLife.52473


