Cryo-EM structure of the potassium-chloride cotransporter KCC4 in lipid nanodiscs
- Department of Molecular and Cell Biology, University of California Berkeley, United States
- Helen Wills Neuroscience Institute, University of California Berkeley, United States
Figures
Figure 1
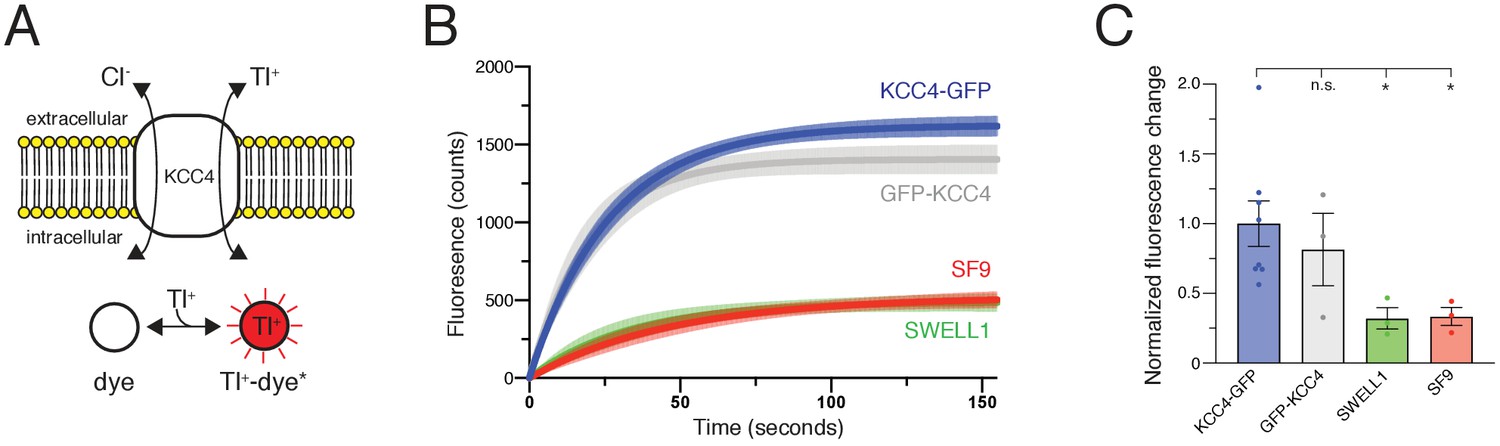
Transport activity of mouse KCC4.
(A) Tl+ uptake assay for KCC4 activity. KCC4 activity in SF9 cells results in Tl+ uptake and increased fluorescence of the Tl+ sensitive dye FluxOR Red. (B) Fluorescence values as a function of time for each construct assayed. Lines are global exponential fits to all data with 95% confidence intervals shown for KCC4-GFP (n = 8, blue), GFP-KCC4 (n = 3, gray), SWELL1 (n = 3, green), and uninfected SF9 cells (n = 3 red). (C) Quantification of experiments shown in (B). Normalized final fluorescence. KCC4-GFP 1.0 ± 0.16 (n = 8); GFP-KCC4 0.76 ± 0.33 (n = 3) SWELL1 0.32 ± 0.08 (n = 3) SF9 0.33 ± 0.06 (n = 3); mean ± SEM, one-way Anova (*p<0.05, n.s. = not significant).
Figure 2 with 8 supplements

Structure of mouse KCC4 in lipid nanodiscs.
(A) Cryo-EM map from an unmasked refinement viewed from the membrane plane showing the position of nanodisc, transmembrane region (blue), and extracellular region (green). (B) Final map, (C) corresponding atomic model, and (D) cartoon representation of KCC4. In (C), bound K+ and Cl- ions are shown as green and violet spheres, respectively. Two disulfides and two N-linked glycosylation sites are shown as sticks and labeled in the cartoon (a third disulfide between TM2 and TM11 is not visible).
Figure 2—figure supplement 1
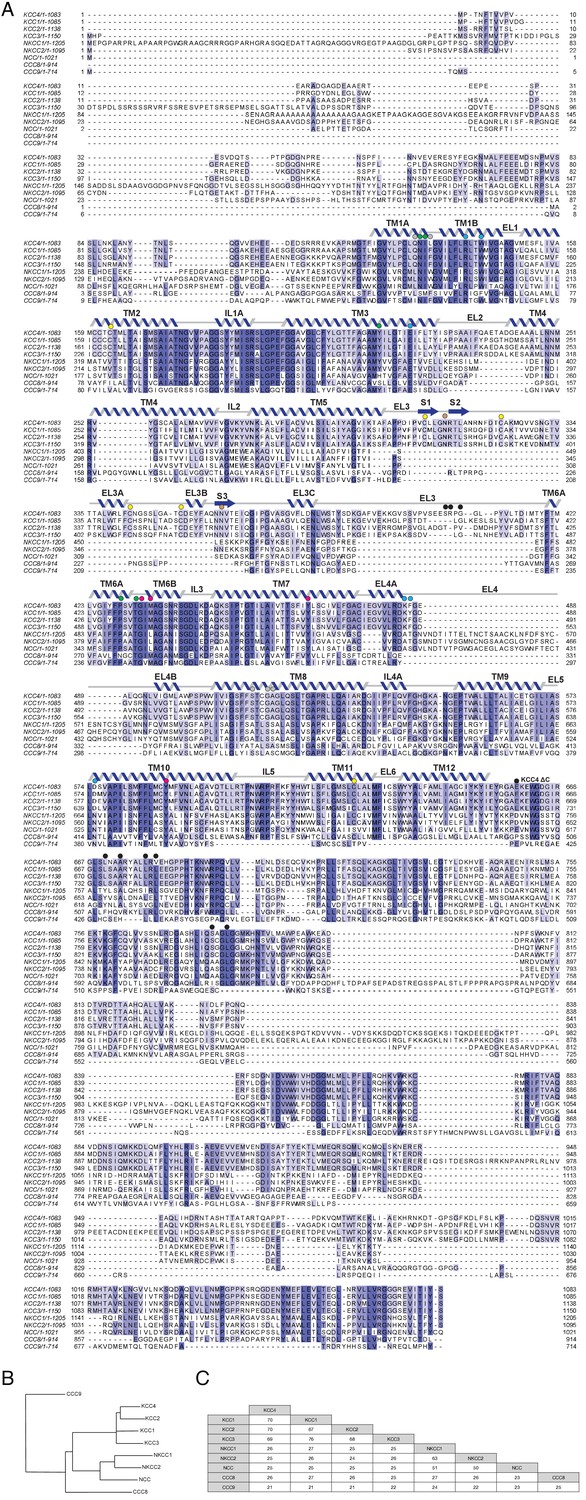
CCC family sequence alignment.
(A) Sequence alignment of mouse CCC family transporters. Sequence numbering is indicated at the left and right of each line. Secondary structure for KCC4 is indicated above the sequence. Residues discussed in the text are indicated with circles above the sequence: green, K+ coordinating residues; violet, Cl- coordinating residues; gray, Na+ coordinating residues in NKCC1; yellow, disulfide bond forming residues; brown, glycosylated residues; cyan, extracellular gate forming residues; black, putative dimerization interfaces. (B) Cladogram of CCC family made using sequences from mouse. (C) Percentage sequence identity between members of the mouse CCC family.
Figure 2—figure supplement 2
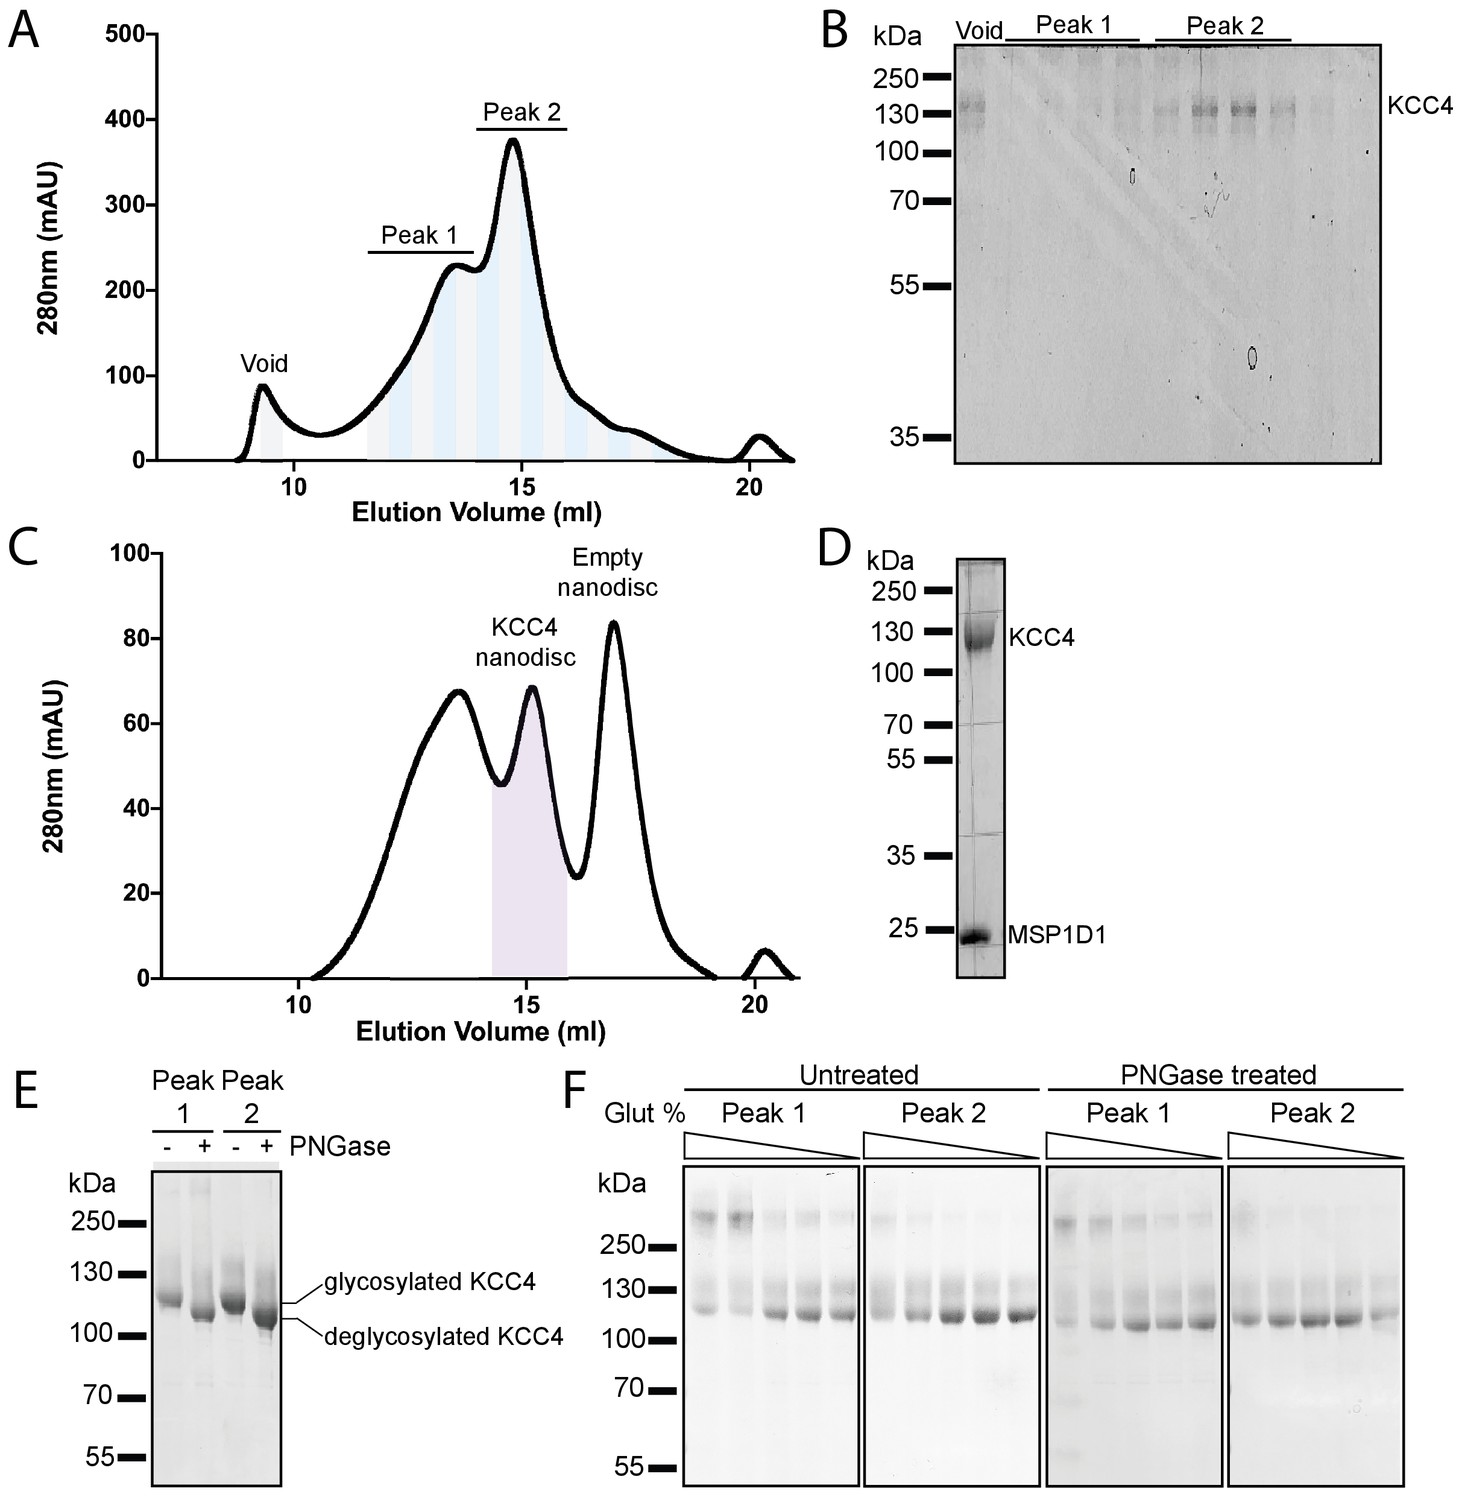
Purification and reconstitution of mouse KCC4.
(A) Representative chromatogram from a Superose six gel filtration of KCC4 purified in DDM/CHS. (B) Coomassie-stained SDS-PAGE fractions (indicated by alternating gray and blue bands in (A)) with band corresponding to KCC4 labeled. KCC4 is present in two species: an earlier eluting, broader peak one and a later eluting, sharper peak 2. Fractions in the later eluting peak correspond to monodisperse KCC4 and were used for structure determination. (C) Representative chromatogram from Superose six gel filtration of KCC4 reconstituted in MSP1D1 lipid nanodiscs. (D) Coomassie-stained SDS-PAGE of final pooled KCC4-MSP1D1 nanodisc sample (indicated by purple shading in (C)). (E) Coomassie-stained SDS-PAGE of peak 1 and peak two pools (as indicated in (A,B)) before (-) and after (+) treatment with PNGase. (F) Coomassie-stained SDS-PAGE of KCC4 crosslinked with different concentrations of glutaraldehyde (bands within each gel correspond to 0.02, 0.01, 0.005, 0.0025, and 0% glutaraldehyde, respectively). Peak 1 and peak two samples were pooled as indicated in (A,B), concentrated, and crosslinked (left pair of gels) or deglycosylated with PNGase prior to crosslinking (right pair of gels).
Figure 2—figure supplement 3
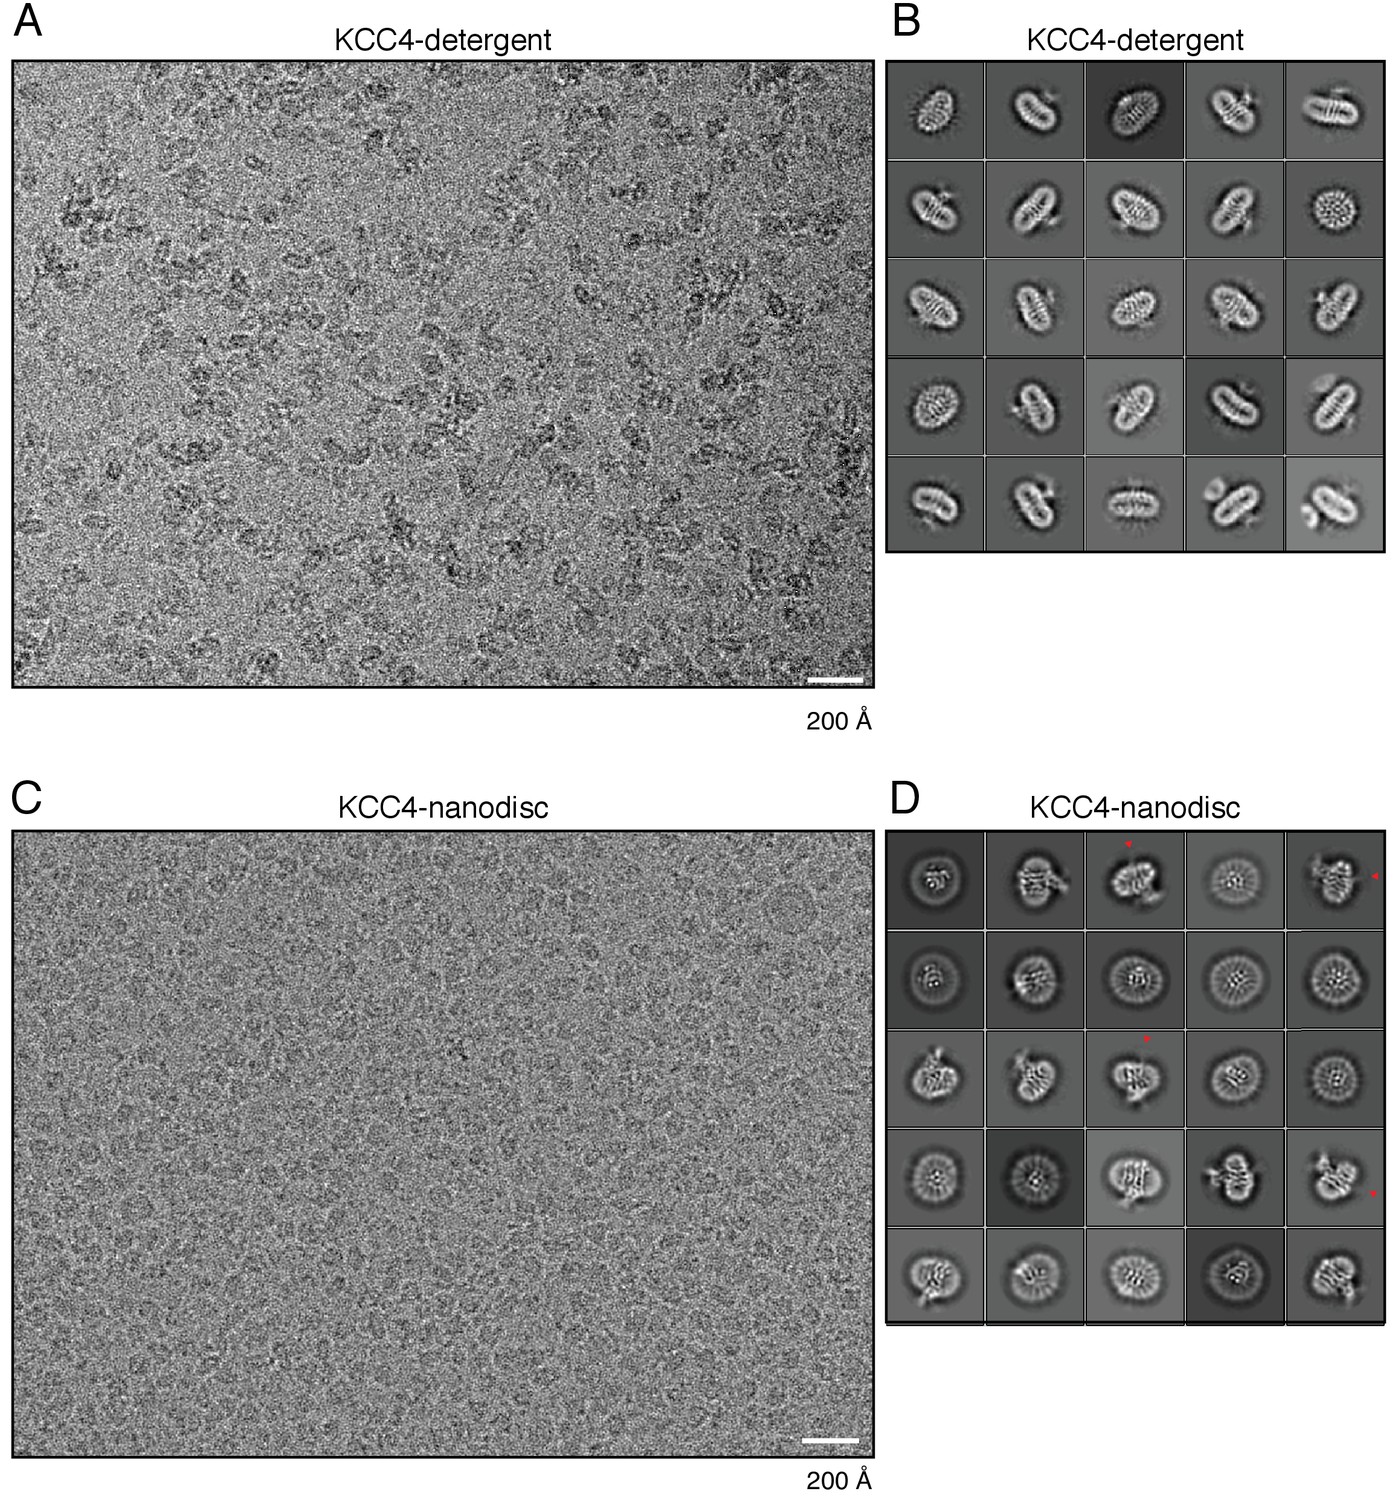
Example micrograph and 2D class averages.
(A) Representative micrograph and (B) selected class averages of KCC4 in detergent (DDM/CHS) micelles. (C) Representative micrograph and (D) selected class averages of KCC4 in MSP1D1 lipid nanodiscs. Red arrowheads in (D) point to blurred density features on the intracellular side of the membrane consistent with flexible N-terminal regions or CTDs.
Figure 2—figure supplement 4
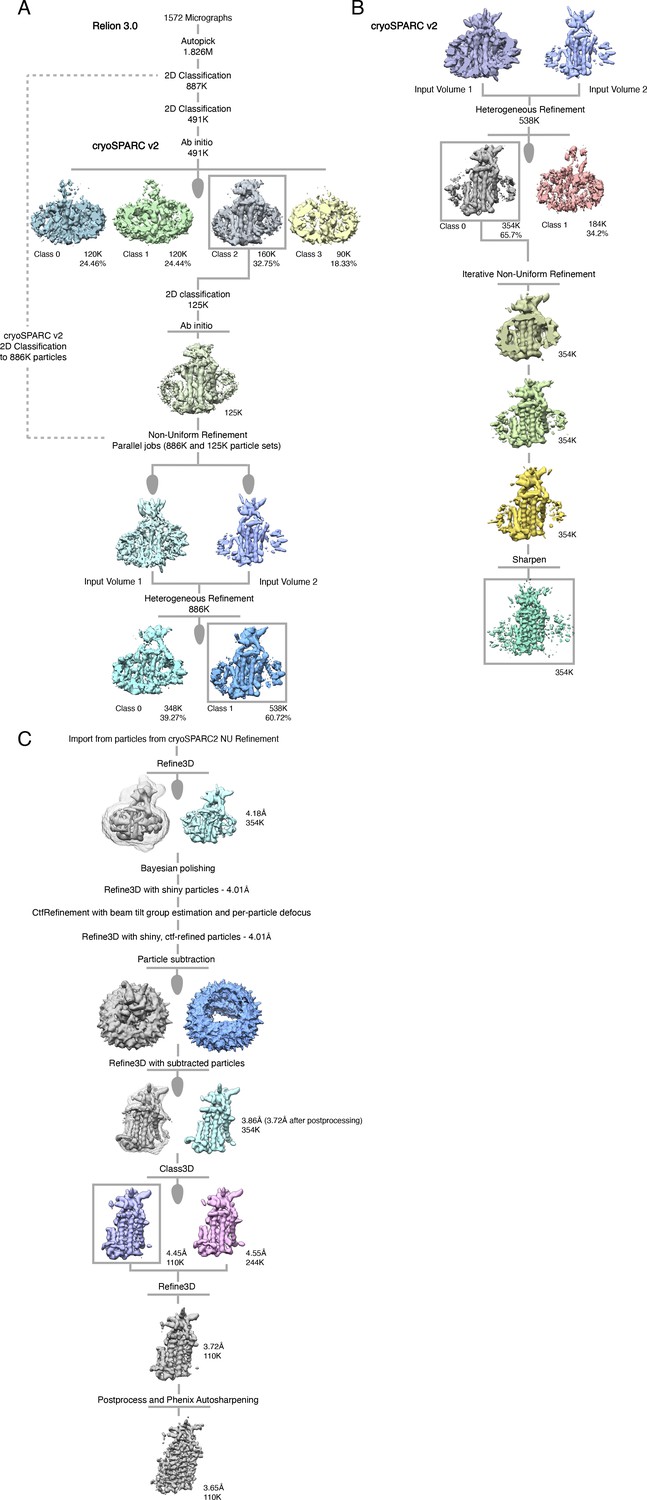
Cryo-EM processing pipeline for KCC4 in MSP1D1 nanodiscs.
(A, B) Initial stages of cryo-EM data processing in Relion and cryoSPARC2. (C) Final stages of cryo-EM data processing in Relion. See Materials and methods for details.
Figure 2—figure supplement 5
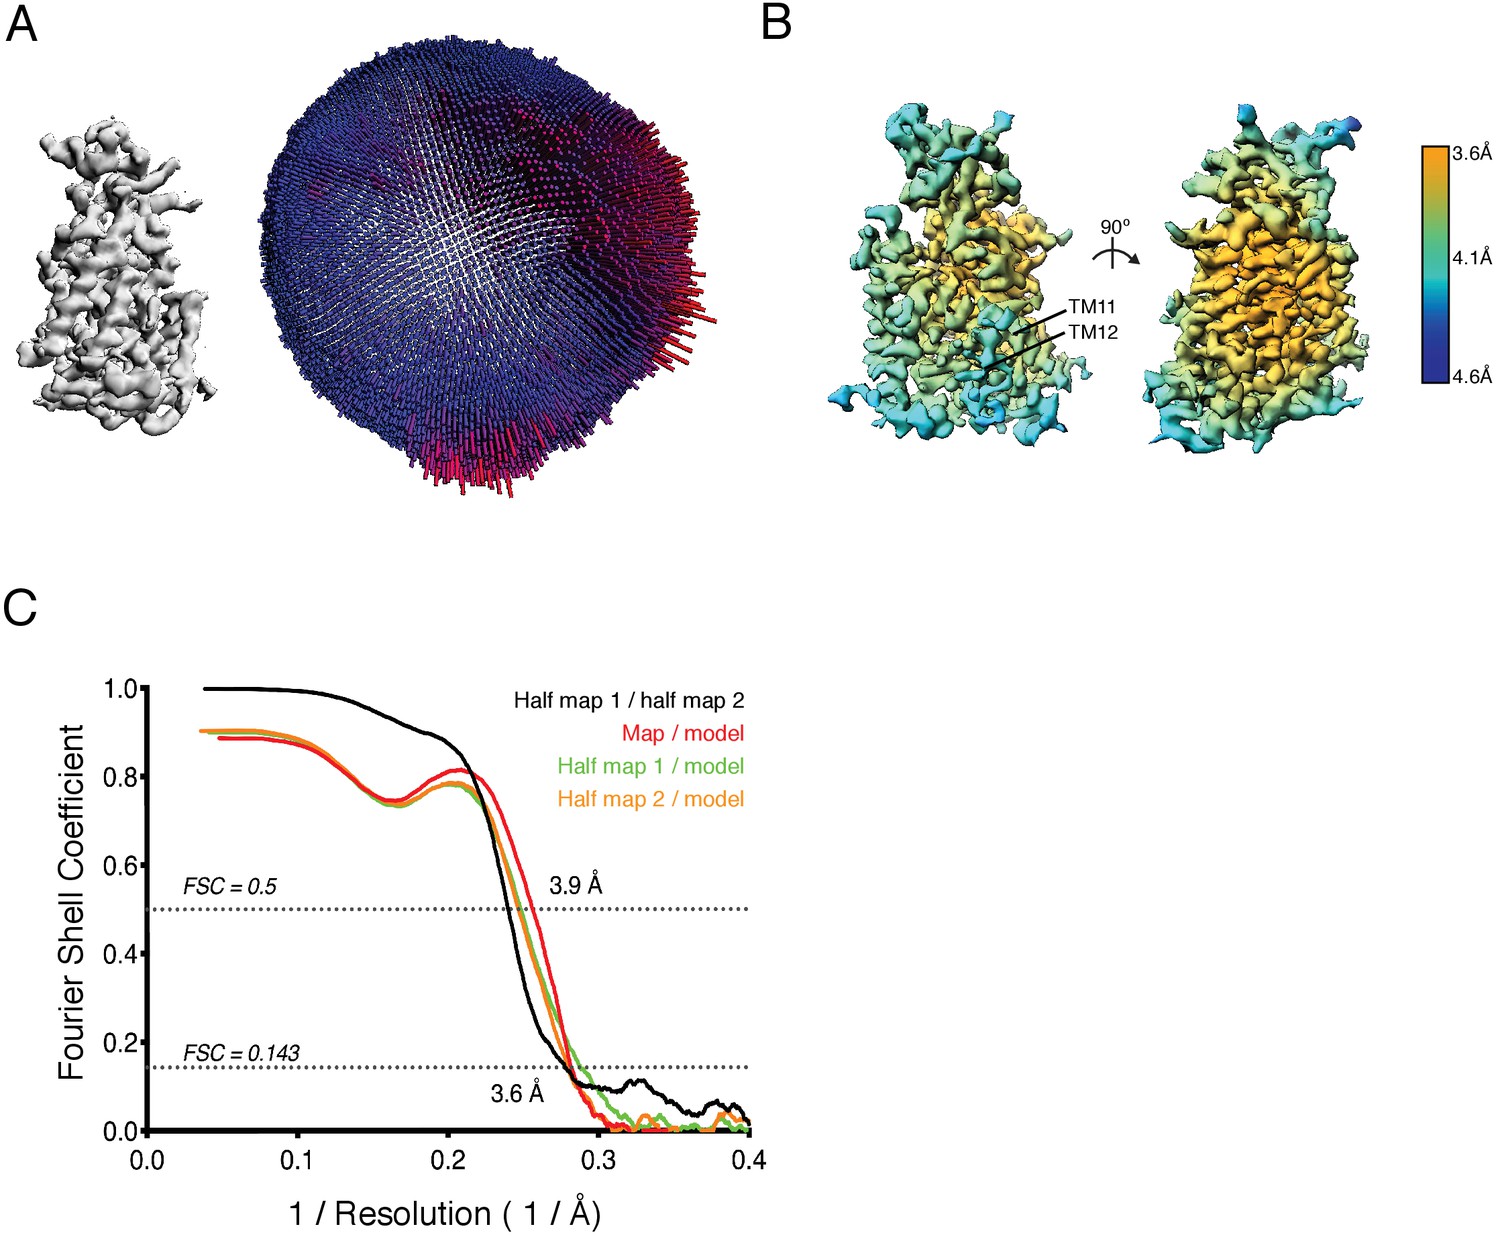
Cryo-EM validation.
(A) Angular distribution of particles used in final refinement with final map for reference. (B) Local resolution estimated in Relion colored as indicated on the final map. (Right) A view from the membrane plane showing relatively weaker local resolution in TM11-12 and (left) a view rotated 90°. (C) Fourier Shell Correlation (FSC) relationships between (black) the two unfiltered half-maps from refinement and used for calculating overall resolution at 0.143, (red) final map versus model, (orange) half-map one versus model, and (green) half-map two versus model.
Figure 2—figure supplement 6
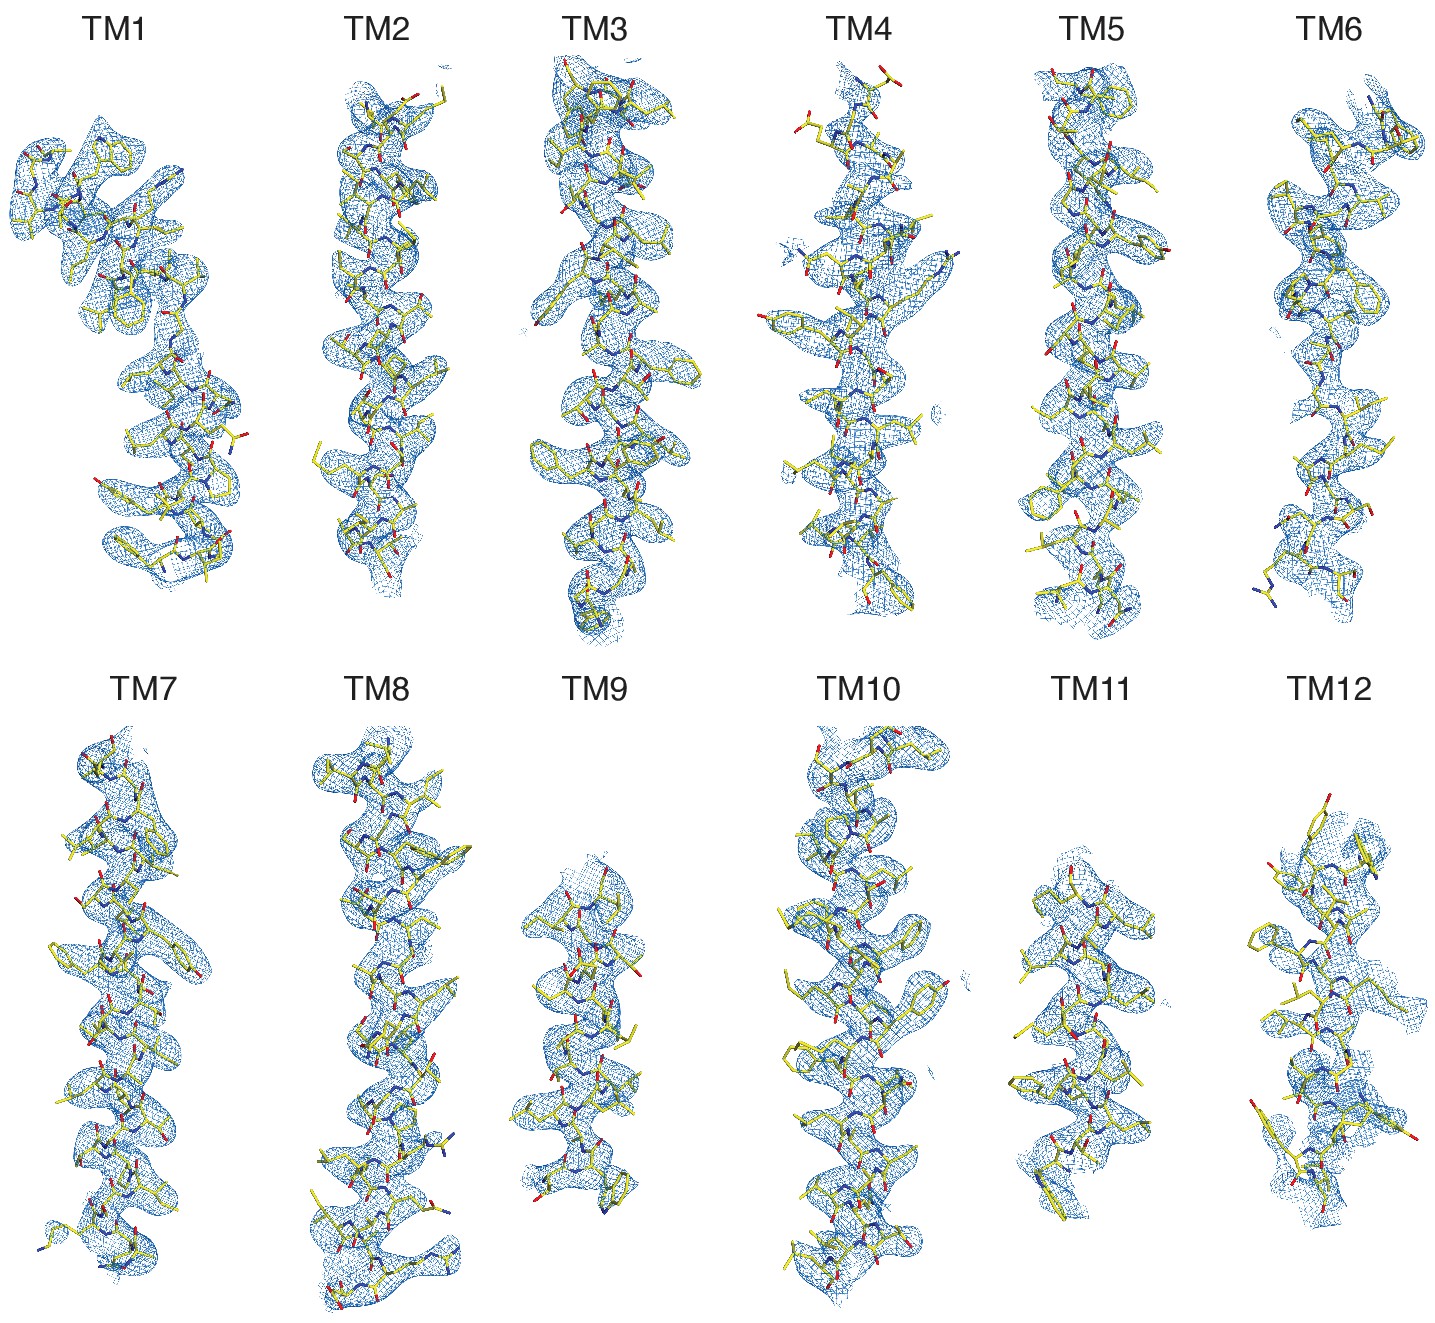
Representative regions of cryo-EM map.
Cryo-EM density is shown carved around each transmembrane helix with the atomic model of KCC4 drawn as sticks.
Figure 2—figure supplement 7
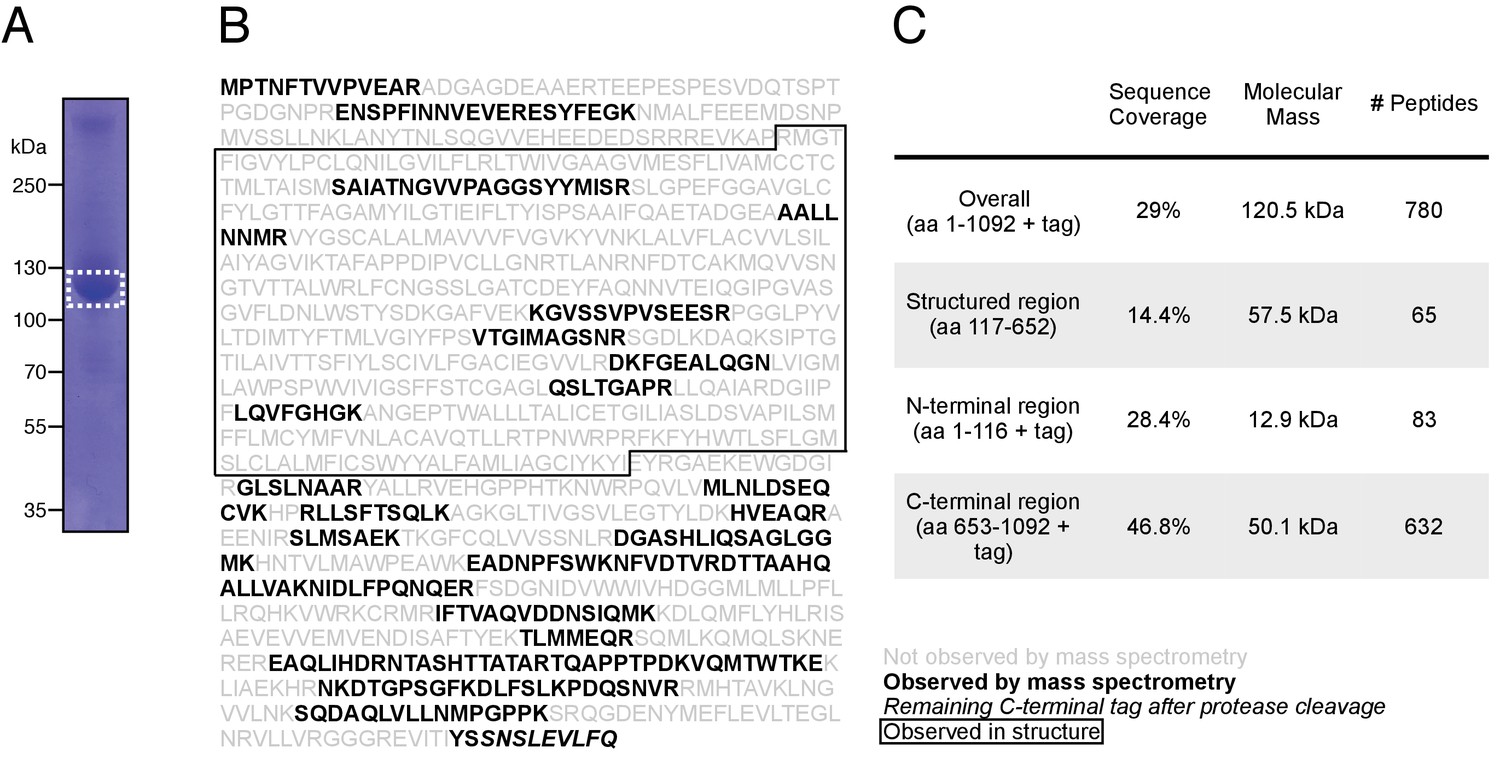
Mass spectrometry of purified KCC4.
(A) Coomassie-stained SDS-PAGE of purified mouse KCC4 sample used for mass spectrometry. The band indicated by dashed line box was excised for analysis. (B) Identified peptides (bold) are indicated on the purified KCC4 sequence. Boxed region indicates boundaries of KCC4 observed by cryo-EM. (C) Summary of mass spectrometry data.
Figure 2—figure supplement 8
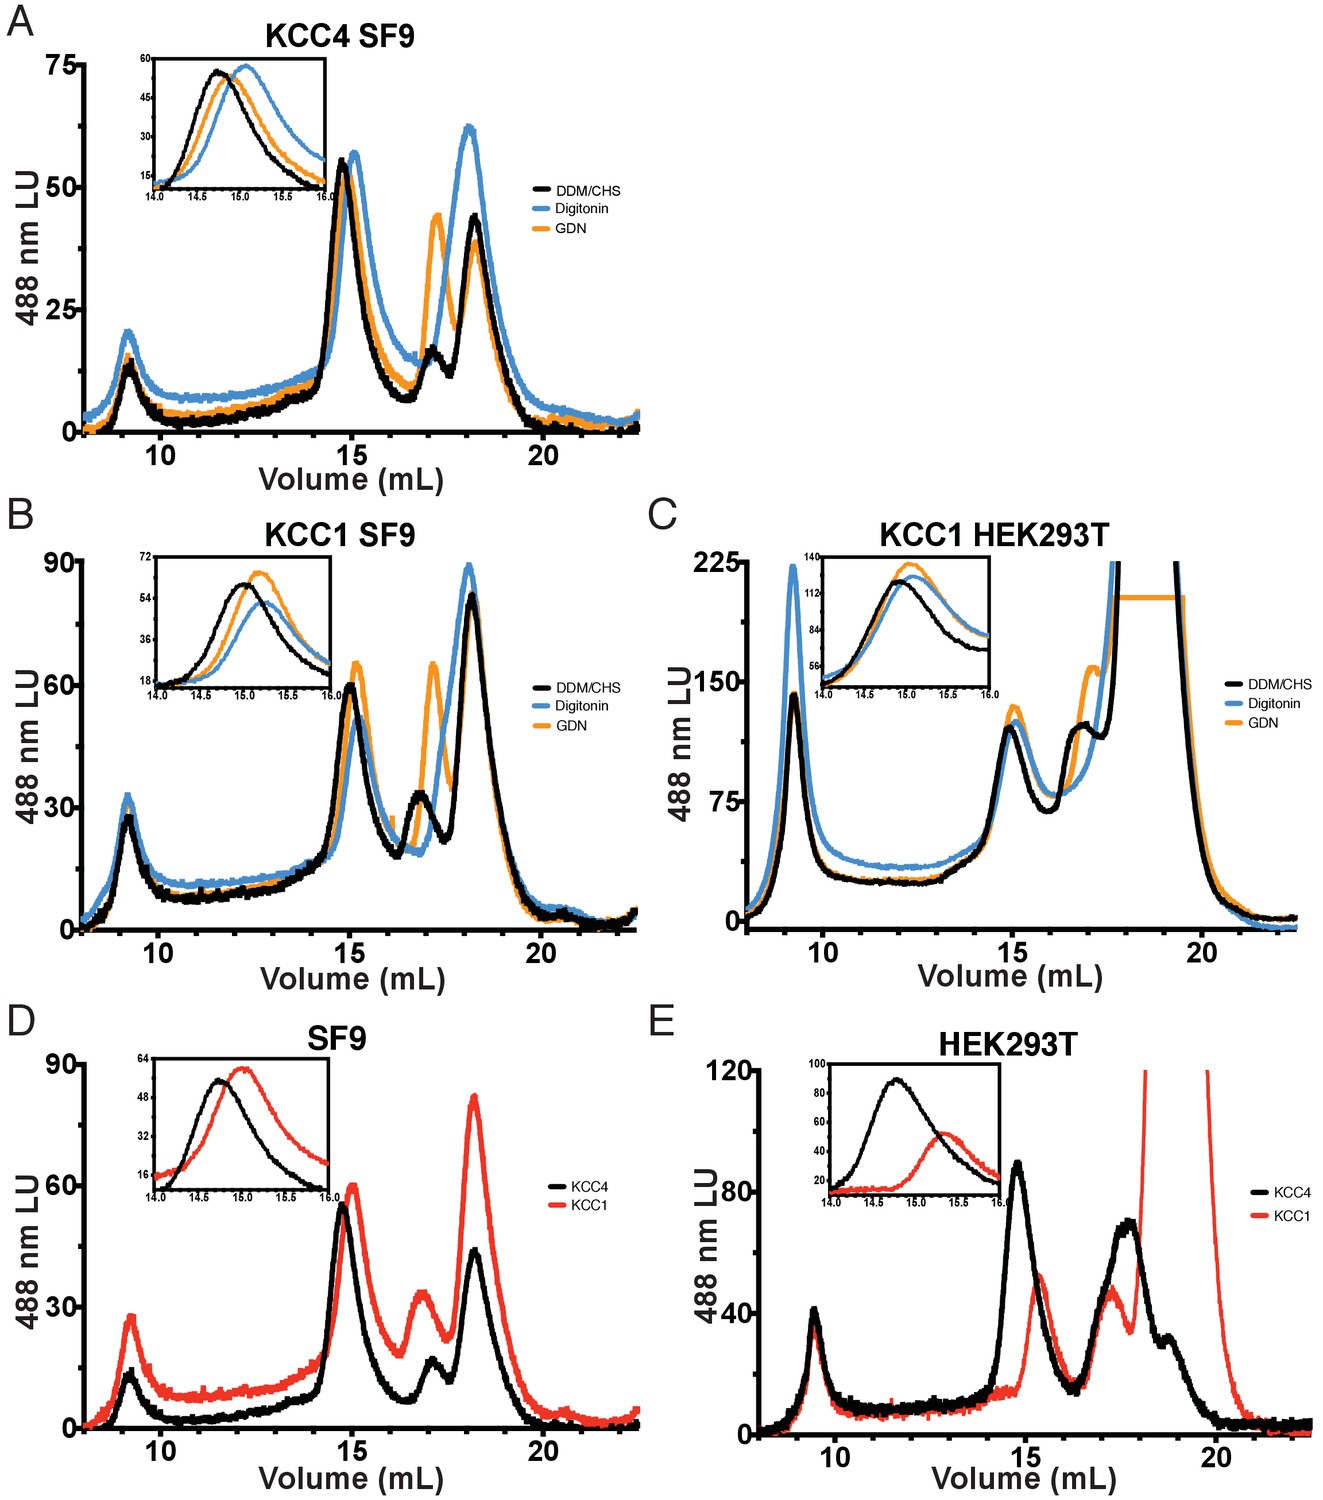
FSEC comparison of KCC4 and KCC1 expressed in different host cells and treated with different detergents.
(A) Overlaid fluorescence chromatograms from a Superose six gel filtration of KCC4 expressed in SF9 cells and extracted/run in DDM:CHS/DDM:CHS (black; conditions used in KCC4 structure determination) DDM:CHS/GDN (orange; conditions used in KCC1 structure determination), and LMNG/digitonin (blue; conditions used in NKCC1 structure determination). (B) As in (A), but for KCC1 expressed in SF9 cells. (C) As in (A), but for KCC1 expressed in HEK293T cells. (D) Overlaid fluorescence chromatograms of KCC4 (black) and KCC1 (red) expressed in SF9 cells and extracted/run in DDM:CHS/DDM:CHS. (E) As in (D), but for KCC4 (black) and KCC1 (red) expressed in KEK293T cells.
Figure 3 with 1 supplement

Analysis of putative KCC4 dimerization.
(A) Overlay of monomeric KCC4 (blue) and dimeric KCC1 (protomer one purple, protomer two white, PDB 6KKT) structures viewed from the membrane. (B) Magnified top views of the extracellular protein-protein interaction region of KCC1 (dashed box in (A)) shown alone with residues in KCC1 labeled (upper) or with KCC4 overlaid (lower) and KCC4 residues labeled. (C) Overlay of KCC4 (blue) and dimeric NKCC1 (protomer one orange, protomer two white, PDB 6NPL) structures viewed from the membrane. (D) Magnified view of the intracellular protein-protein interaction region of NKCC1 (dashed box in (C)). Residues in NKCC1 for which corresponding KCC4 mutations were made are labeled. (E) Partial sequence alignments between KCC4 and NKCC1 (above) and human and mouse KCC1 and KCC4 (below) for the regions highlighted in (B,D). Residues mutated in KCC4 are numbered in bold. (F) Normalized activity of KCC4 mutations. Wild-type KCC4 1 ± 0.11 (n = 11); S404E, R405E, G407E 0.85 ± 0.11 (n = 8); L678R, V680R 0.59 ± 0.10 (n = 8); L670R, A673R 0.64 ± 0.10 (n = 8); S780R, L783R 0.56 ± 0.11 (n = 6); KCC4ΔC (1–658 0.40 ± 0.09 (n = 7); mean ± SEM, one-way Anova (*p<0.05, **p<0.01 ***p<0.001).
Figure 3—figure supplement 1
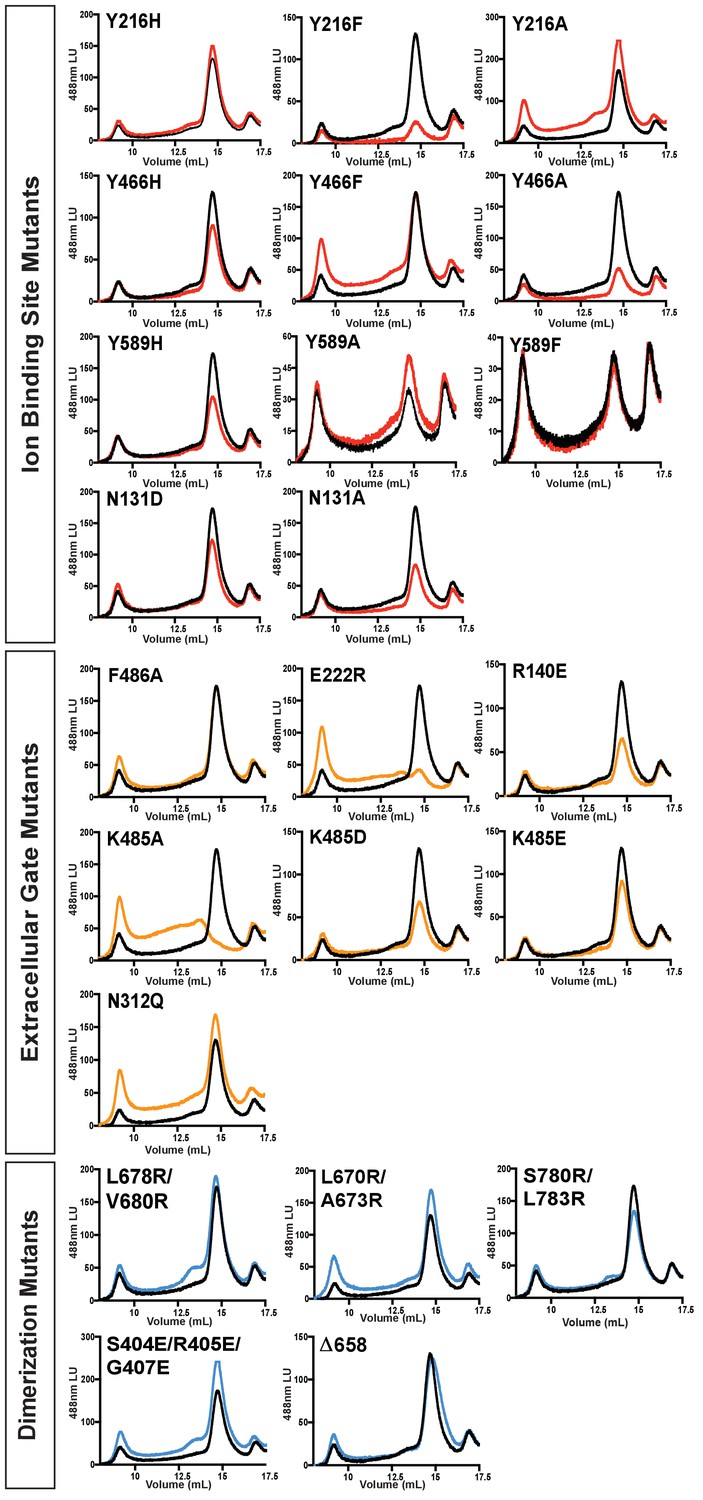
FSEC comparison of KCC4 mutations.
Representative fluorescence chromatograms from a Superose six gel filtration of wild-type KCC4-GFP (black) compared to each mutant KCC4-GFP. Traces for mutations in ion binding sites are colored red, mutations in the extracellular gate are colored orange, and mutations in putative dimerization interfaces are colored blue.
Figure 4

Inward-open conformation of KCC4.
(A) Cartoon representation of KCC4 colored with extracellular region green and transmembrane region colored in a gradient from white to blue from N- to C-terminus. Ions and residues forming an extracellular gate are shown as spheres. (B) Close-up view of extracellular gate. Residues forming the interaction network are shown as sticks. (C) Normalized activity of KCC4 mutations. Wild-type KCC4 1 ± 0.09 (n = 16); K485A 1.15 ± 0.12 (n = 11); K485D 0.25 ± 0.04 (n = 11); K485E 0.44 ± 0.05 (n = 12); F486A 0.52 ± 0.11 (n = 12); E222R 1.19 ± 0.10 (n = 11); R140E 0.30 ± 0.05 (n = 12); N312Q 0.16 ± 0.04 (n = 6); mean ± SEM, one-way Anova (***p<0.001, ****p<0.0001). (D) View of the open pathway to the intracellular ion binding sites. Helices surrounding the ion binding sites are shown as cylinders. Yellow dots demarcate the surface of a bifurcated tunnel that connects the ion binding sites to the cytoplasmic solution. (E) Radius of the ion access tunnel as a function of distance along the path for Cl- (pink) and K+ (green). (F) Electrostatic surface representation of KCC4 sliced to show one leg of the cytoplasmic access tunnel.
Figure 5
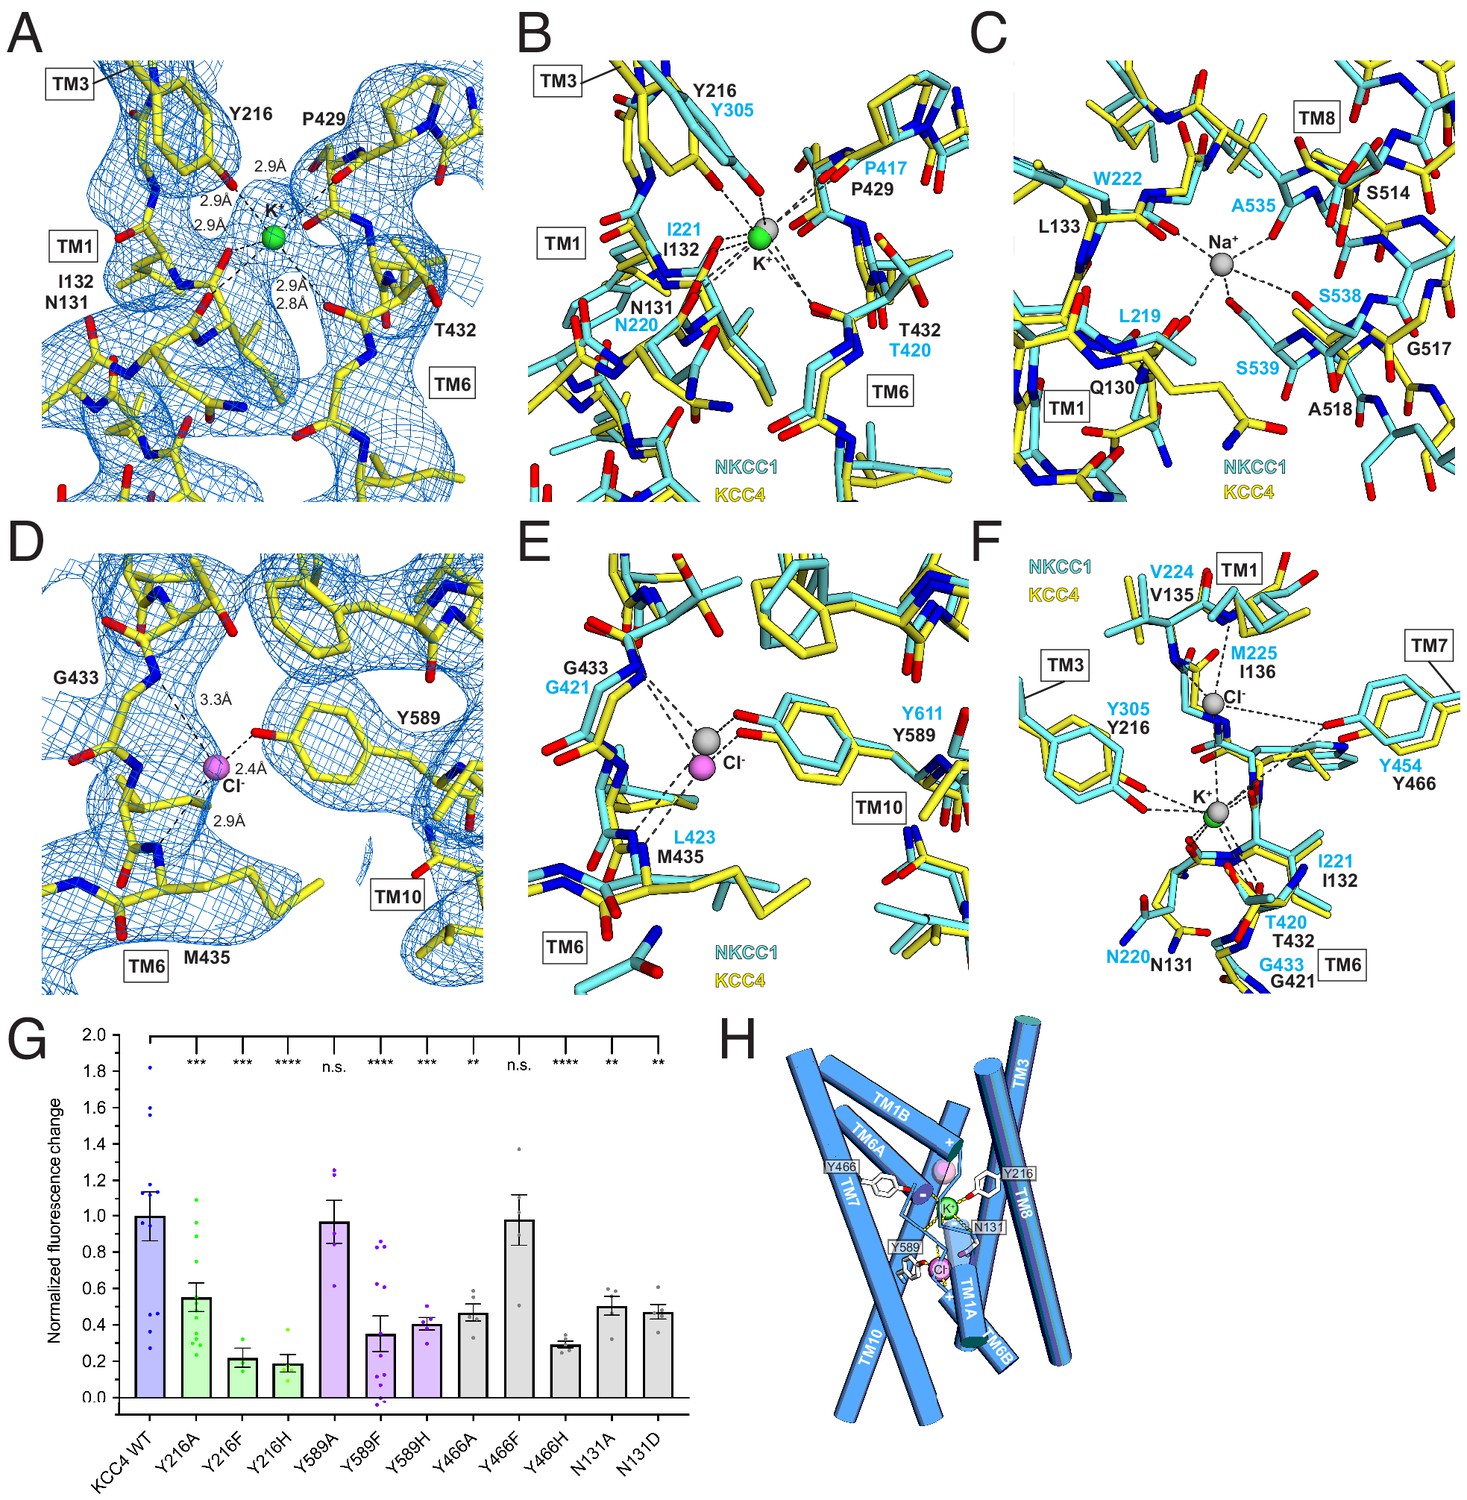
Ion binding sites.
(A) K+ binding site. The cryo-EM map is shown as blue mesh and KCC4 is colored with carbon yellow, oxygen red, nitrogen blue, and K+ green. K+-coordination environment is indicated with dashed lines. (B) Superposition of K+ binding sites in KCC4 (depicted as in (A)) and Danio rerio NKCC1 (PDB 6NPL) colored with carbons cyan and K+ gray. (C) Superposition of the Na+ (gray) binding site in NKCC1 and analogous region in KCC4. The position of the Na+ ion is inferred from SiaT (PDB:5NVA). (D) Cl- (pink) binding site and (E) superposition of Cl- binding site in KCC4 with analogous lower site in NKCC1. (F) Superposition of second upper Cl- binding site in NKCC1 with analogous site in KCC4. (G) Normalized activity of KCC4 mutations. Wild-type KCC4 1 ± 0.14 (n = 13); Y216A 0.55 ± 0.08 (n = 13); Y216F 0.22 ± 0.05 (n = 3); Y216H 0.19 ± 0.05 (n = 5); Y589A 0.97 ± 0.12 (n = 5); Y589F 0.35 ± 0.10 (n = 13); Y589H 0.41 ± 0.03 (n = 5); Y466A 0.47 ± 0.05 (n = 5); Y466F 0.98 ± 0.14 (n = 5); Y466H 0.29 ± 0.02 (n = 5); N131A 0.50 ± 0.05 (n = 5); N131D 0.47 ± 0.04 (n = 5); all mean ± SEM, one-way Anova (**p<0.01, ***p<0.001 ****p<0.0001). (H) Model for ion binding and transport stoichiometry in CCC transporters. Helices are shown as cylinders with ion coordination in KCC4 shown as dashed lines to green K+ and pink Cl-. Helix dipoles in discontinuous helices TM1 and TM6 are indicated. A second upper Cl- site in NKCC1 and KCC1 not observed in the current KCC4 structure is shown as a transparent pink sphere.
Tables
Key resources table
| Reagent type (species) or resource | Designation | Source or reference | Identifiers | Additional information |
|---|---|---|---|---|
| Gene (Mus musculus) | KCC4 | Synthesized (Thermo Fisher) | Uniprot Q80WG5 | Codon-optimized for Spodoptera frugiperda |
| Gene (Mus musculus) | KCC1 | Synthesized (Thermo Fisher) | Uniprot Q9QY75 | Codon-optimized for Spodoptera frugiperda |
| Recombinant DNA reagent | pACEBAC1 | Geneva Biotech | pACEBac1 | Modified as described in Materials and methods |
| Cell Line (Spodoptera frugiperda) | Sf9 | Expression Systems | Catalog Number: 94–001F | |
| Cell Line (H. sapiens) | HEK293T | ATCC | Catalog Number: CRL-3216 | |
| Cell Line (H. sapiens) | HEK293T GnTI- | ATCC | Catalog Number: CRL-3022 | |
| Peptide, recombinant protein | MSP1D1 | Prepared as described in doi: 10.1016/S0076-6879(09)64011–8 | His-tag cleaved | |
| Chemical compound | DDM | Anatrace | Part Number: D310S | |
| Chemical compound | CHS | Anatrace | Part Number: CH210 | |
| Chemical compound | Digitonin | EMD Chemicals | CAS 11024-24-1 | |
| Chemical compound | GDN | Anatrace | Part Number: GDN101 | |
| Chemical compound | 18:1 (Δ9-Cis) PE (DOPE) lipid | Avanti Polar Lipids | SKU: 850725C | |
| Chemical compound | 16:0-18:1 PS (POPS) lipid | Avanti Polar Lipids | SKU: 840034C | |
| Chemical compound | 16:0-18:1 PC (POPC) lipid | Avanti Polar Lipids | SKU: 850457C | |
| Chemical compound | FluxOR Red Potassium Ion Channel Assay | ThermoFisher Scientific | Catalog Number: F20019 | |
| Software, algorithm | RELION | doi: 10.7554/eLife.42166 | Relion 3.0.7 | |
| Software, algorithm | Cryosparc | doi: 10.1038/nmeth.4169 | Cryosparc2 | |
| Software, algorithm | Ctffind | doi: 10.1016/j.jsb.2015.08.008 | Ctffind 4.1.13 | |
| Software, algorithm | PyEM | doi:10.5281/zenodo.3576630. | PyEM | https://zenodo.org/record/3576630#.XmptWJNKjUI |
| Software, algorithm | UCSF Chimera | UCSF | RRID:SCR_004097 | http://plato.cgl.ucsf.edu/chimera/ |
| Software, algorithm | COOT | RRID:SCR_014222 | http://www2.mrc-lmb.cam.ac.uk/personal/pemsley/coot/ | |
| Software, algorithm | Phenix | RRID:SCR_014224 | https://www.phenix-online.org/ | |
| Software, algorithm | PyMOL | PyMOL Molecular Graphics System, Schrodinger LLC | RRID:SCR_000305 | https://www.pymol.org/ |
Table 1
Cryo-EM data collection and structure refinement statistics.
| Data collection | |
|---|---|
| Total movie # | 1572 |
| Selected movie # | 1401 |
| Magnification | 36,000x |
| Voltage (kV) | 200 |
| Electron exposure (e–/Å2) | 46.665 |
| Frame # | 50 |
| Defocus range (μm) | −0.7 to −2.5 |
| Super resolution pixel size (Å) | 0.5685 |
| Binned pixel size (Å) | 1.137 |
| Processing | |
| Initial particle images (no.) | 887,132 |
| Final particle images (no.) | 110,143 |
| Map resolution | |
| Masked (Å, FSC = 0.143/ FSC=0.5) | 3.6/4.2 |
| Unmasked (Å, FSC = 0.143/ FSC=0.5) | 3.9/4.4 |
| Refinement | |
| Model resolution (Å, FSC = 0.143/ FSC=0.5) | 3.5/3.9 |
| Map-sharpening B factor (Å2) | −150 |
| Composition | |
| Number of atoms | 4103 |
| Number of protein residues | 536 |
| Ligands total | 4 |
| K+ | 1 |
| Cl- | 1 |
| NAG-NAG-BMA | 2 |
| R.m.s. deviations | |
| Bond lengths (Å) | 0.005 |
| Bond angles (°) | 0.731 |
| Validation | |
| MolProbity score | 1.7 |
| Clashscore | 4.59 |
| EMRinger score | 1.74 |
| Ramachandran plot | |
| Favored (%) | 92.48 |
| Allowed (%) | 7.52 |
| Disallowed (%) | 0 |
| Rotamer outliers (%) | 0.23 |
| Mean B factors (Å2) | |
| Protein | 75.41 |
| Ligand | 106.62 |
Additional files
Download links
A two-part list of links to download the article, or parts of the article, in various formats.
Downloads (link to download the article as PDF)
Open citations (links to open the citations from this article in various online reference manager services)
Cite this article (links to download the citations from this article in formats compatible with various reference manager tools)
Cryo-EM structure of the potassium-chloride cotransporter KCC4 in lipid nanodiscs
eLife 9:e52505.
https://doi.org/10.7554/eLife.52505


