The p75 neurotrophin receptor in AgRP neurons is necessary for homeostatic feeding and food anticipation
- University of Virginia, United States
- The Ohio State University College of Medicine, United States
Figures
Figure 1 with 2 supplements
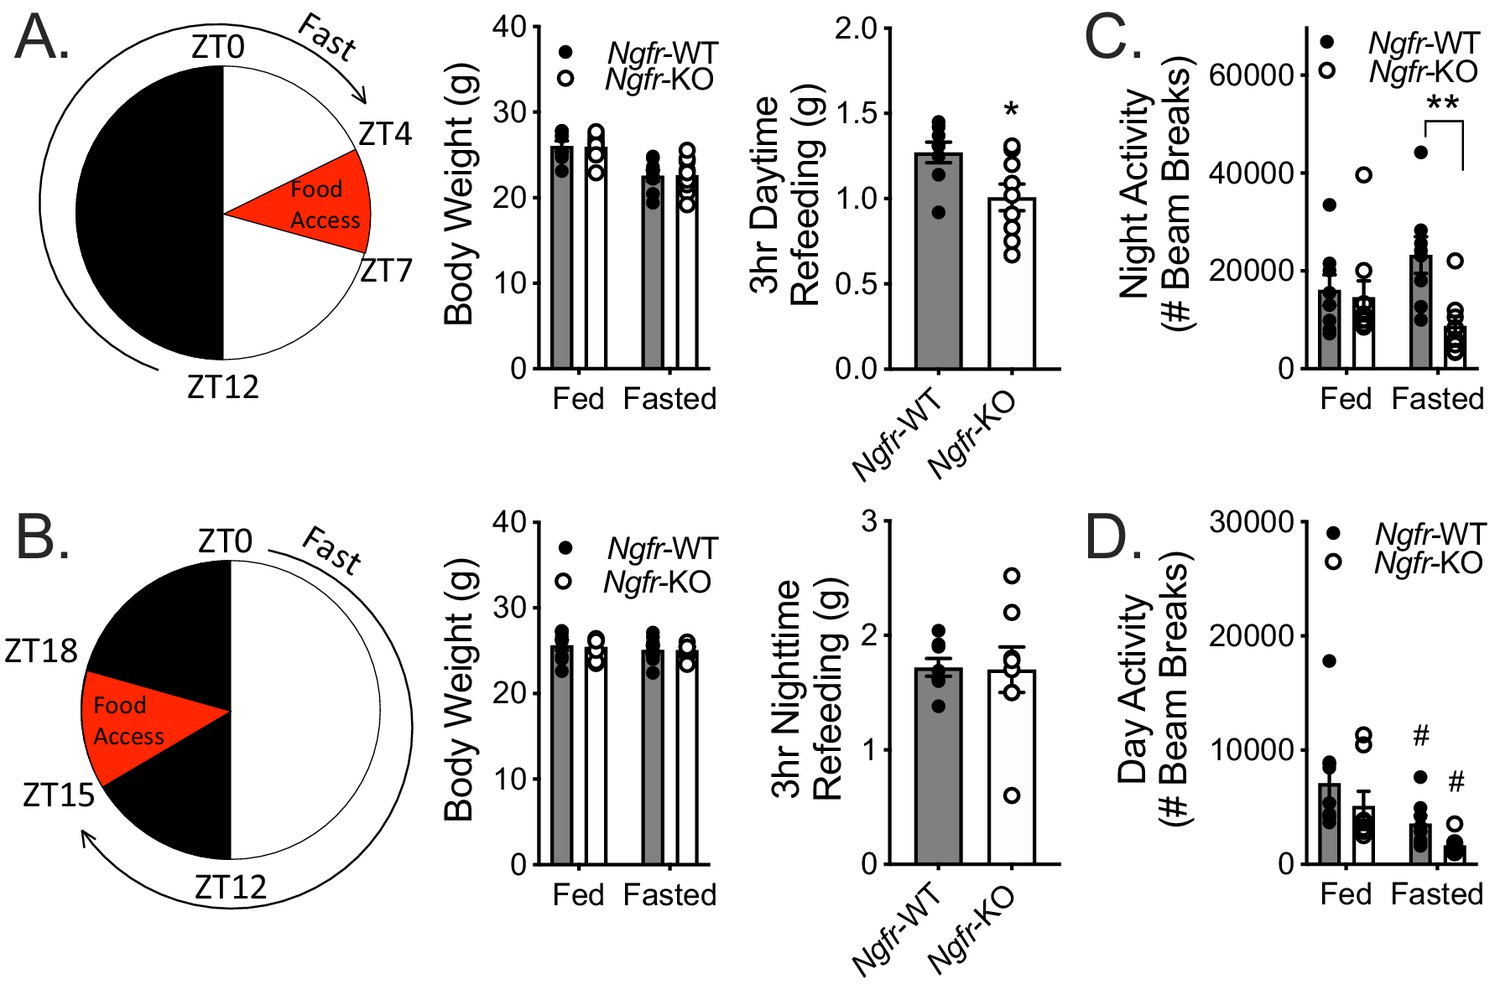
Fasting Ngfr-KO mice reveals activity and feeding deficits.
(A) Schematic of nighttime fasting (left). Mice are fasted just before lights out at ZT12, weighed at ZT0, and fed for 3 hr between ZT4 and ZT7 (right). n = 8 WT, 9 KO. *p=0.0195 by Student’s t-test. (B) Schematic of daytime fasting (left). Mice are fasted just after lights on at ZT0, weighed at ZT12, and fed for 3 hr between ZT15 and ZT18 (right). n = 8 WT, 9 KO. Not significant by Student’s t-test. (C) Locomotor activity during the 12 hr night (initial 12 hr of fasting) was measured in ad libitum fed and fasted mice, as described in A. n = 8 WT, 9 KO. **p=0.0045, F(1,15)=5.443 by two-way repeated measures ANOVA with Bonferroni multiple comparisons. (D) Locomotor activity during the 12 hr daytime (initial 12 hr of fasting) was measured in ad libitum fed and fasted mice, as described in B. n = 8/group. #p=0.02 versus fed, F(1,14)=16.44 by two-way repeated measures ANOVA with Bonferroni multiple comparisons. All mice are age and weight-matched. Data are presented as mean ± SEM.
Figure 1—figure supplement 1
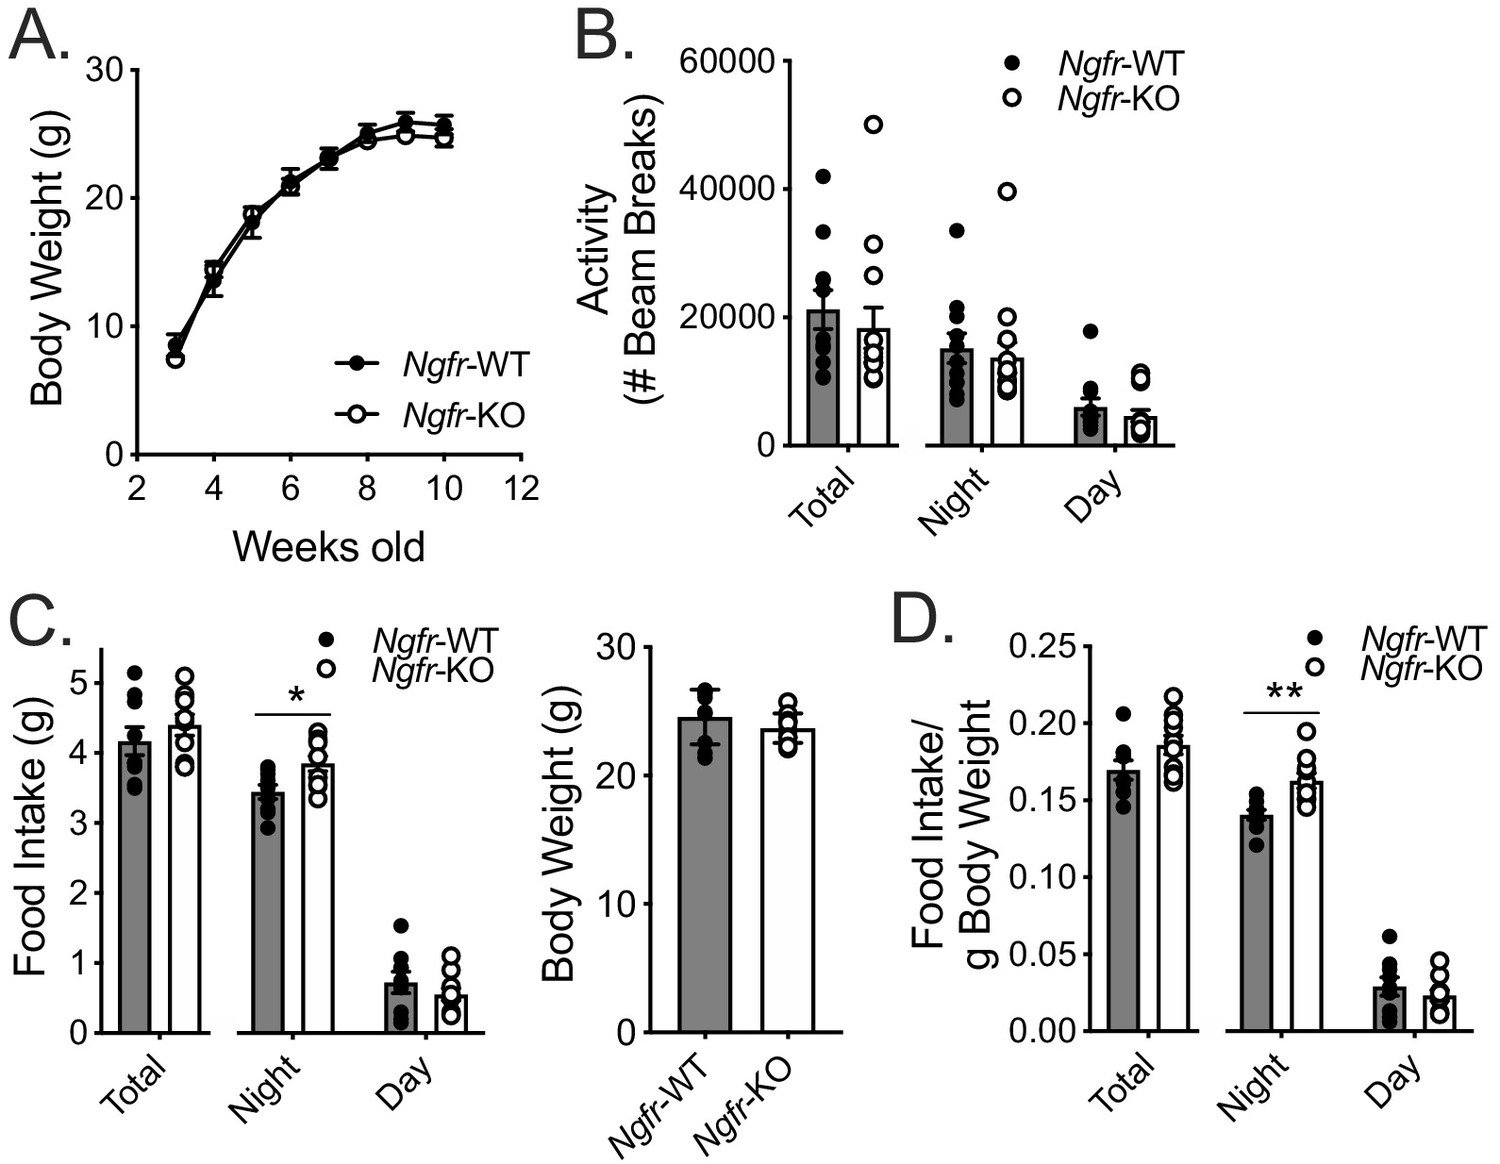
Germline loss of p75NTR does not alter body weight, activity, or daily food intake.
(A) Weekly body weight measurements; n = 7/group. Not significant by two-way repeated measures ANOVA with Bonferroni multiple comparisons. (B) 24 hr (total) and 12 hr (night, day), measurements of locomotor activity; n = 11 WT, 13 KO. Not significant by two-way repeated measures ANOVA with Bonferroni multiple comparisons. (C) 24 hr (total) and 12 hr (night, day), measurement of food intake (left), and body weight (right); n = 9 WT,10 KO. *p=0.0324, F(1,17)=0.8915 by two-way repeated measures ANOVA with Bonferroni multiple comparisons. (D) Food intake from C normalized to total body weight. **p=0.0029, F(1,17)=3.481 by by two-way repeated measures ANOVA with Bonferroni multiple comparisons. Data are presented as mean ± SEM.
Figure 1—figure supplement 2
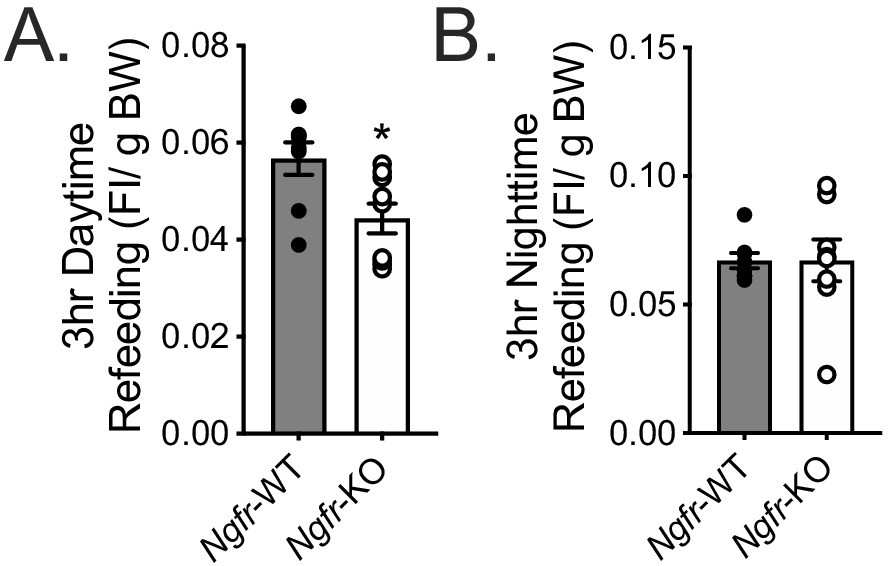
Refeeding food intake normalized to total body weight.
(A) Daytime refeeding normalized to overnight fasted body weight. *p=0.0149 by Student’s t-test. (B) Nighttime refeeding normalized to overday fasted body weight. Not significant by Student’s t-test.
Figure 2 with 2 supplements
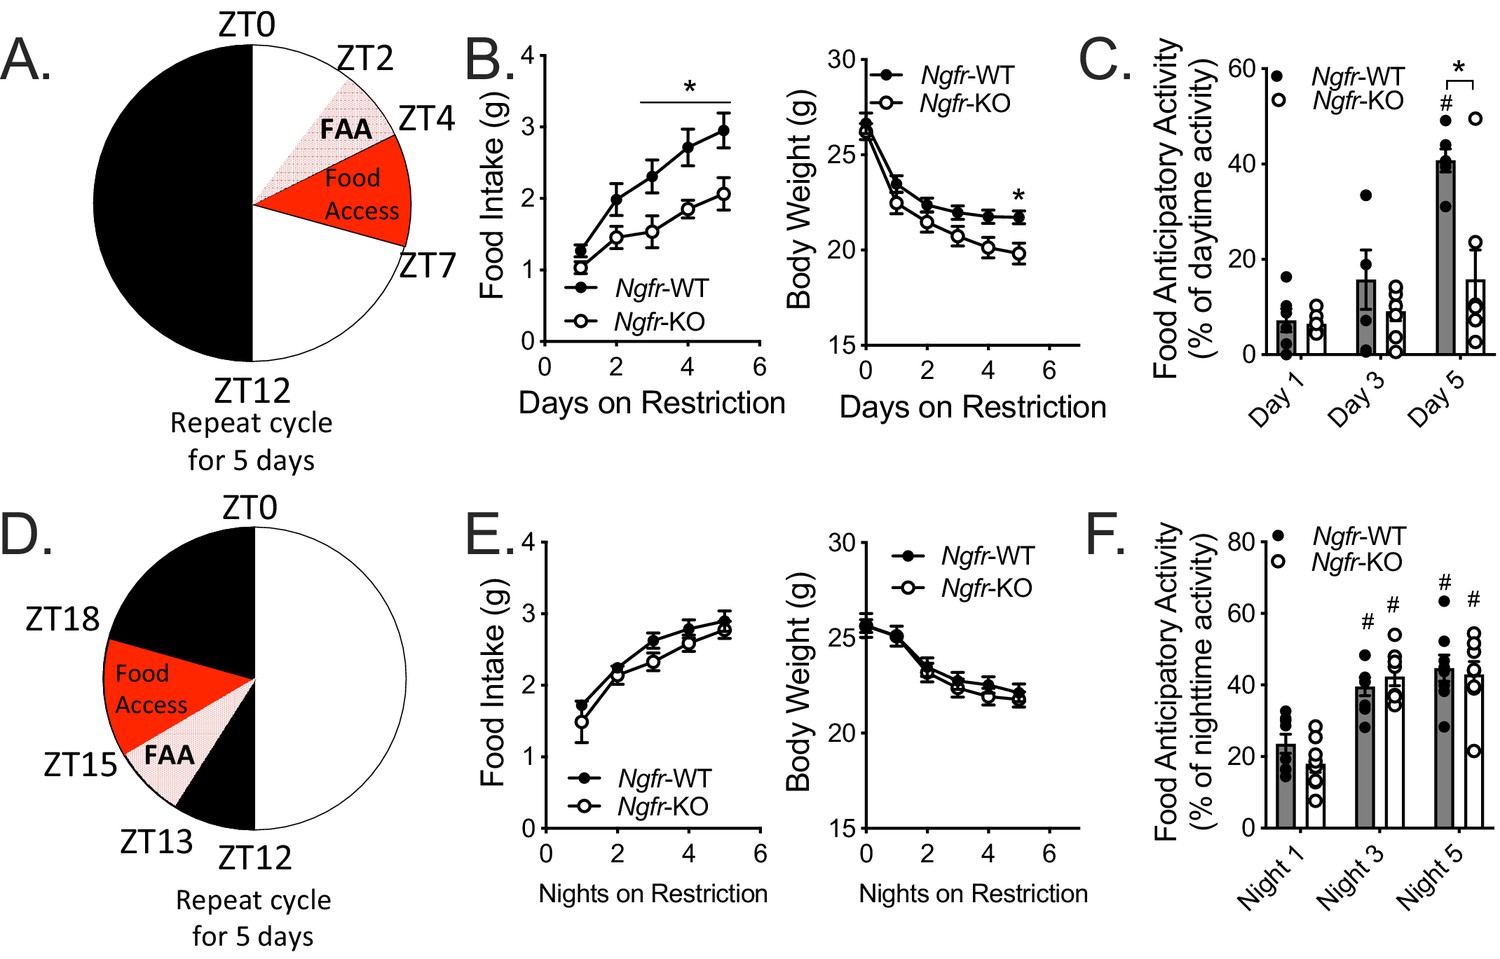
Ngfr-KO mice have blunted food anticipatory activity in response to daytime, but not nighttime, restricted feeding.
(A) Schematic of daytime restricted feeding paradigm. Mice are fasted just before lights out at ZT12, weighed at ZT0, fed for 3 hr between ZT4 and ZT7, and then fasted again until the next day’s feeding period. (B) Food intake (left, F(1,10)=7.065) and body weight (right, F(1,10)=3.64) on the five consecutive days of restriction. (Left) *p=0.0382 (day 3), 0.0155 (day 4), 0.0122 (day 5), F(1,10)=7.065; (Right) *p=0.0358, F(1,10)=3.64; by two-way repeated measures ANOVA with Bonferroni multiple comparisons; n = 6/group. (C) Percent of daytime locomotor activity that occurs in the two hour window (ZT2-4) preceding feeding. #p<0.0001, F(2,22)=21.21 vs day 1; *p=0.0169, F(1,11)=7.613 vs control by two-way repeated measures ANOVA with Bonferroni multiple comparisons; n = 6 WT, 7 KO. (D) Schematic of nighttime restricted feeding paradigm. Mice are fasted just after lights on at ZT0, weighed at ZT12, fed for 3 hr between ZT15 and ZT18, and then fasted again until the next day’s feeding period. (E) Food intake (left) and body weight (right) on the five consecutive nights of restriction. n = 8/group. Not significant by two-way repeated measures ANOVA with Bonferroni multiple comparisons. (F) Percent of nighttime locomotor activity that occurs in the two hour window (ZT13-15) preceding feeding. #p<0.0001, F(2,28)=41.62 vs night one by two-way repeated measures ANOVA with Bonferroni multiple comparisons. n = 8/group. All mice are age and weight-matched. Data are presented as mean ± SEM.
Figure 2—figure supplement 1
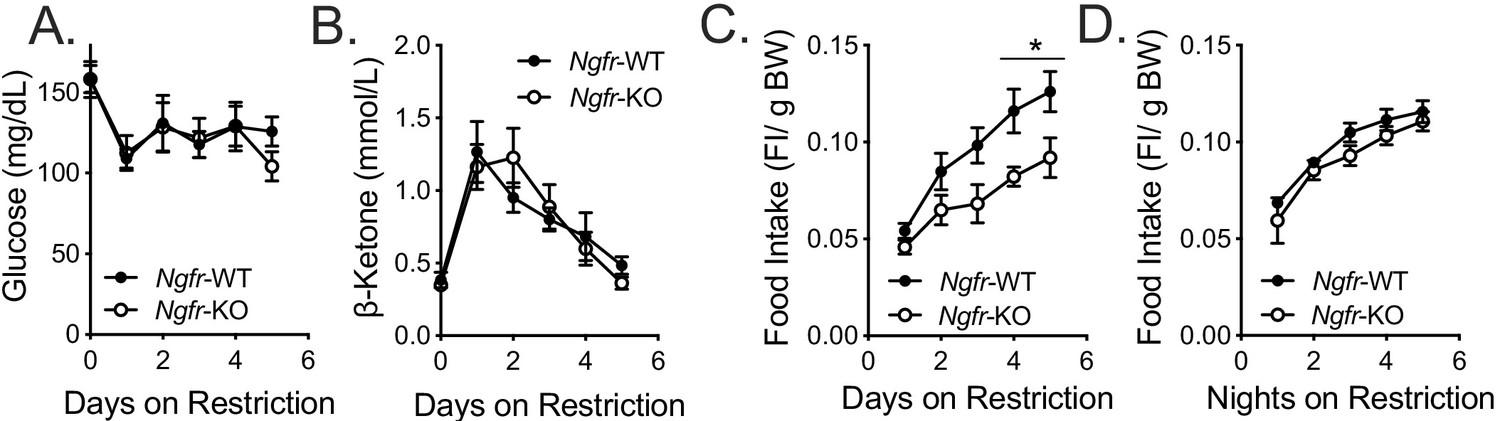
Glucose homeostasis and ketone production are intact in Ngfr-KO mice during daytime restricted feeding; Normalized food intake.
Blood glucose (A) and β-hydroxybutyrate (B) levels measured at ZT0 during daytime restricted feeding; n = 6 WT, 8 KO. Not significant by two-way repeated measures ANOVA with Bonferroni multiple comparisons. (C) Daytime restricted food intake normalized to total starting body weight. *p=0.0347 (day 4), 0.0321 (day 5), F(1,10)=5.621 by two-way repeated measures ANOVA with Bonferroni multiple comparisons; n = 6/group. (D) Nighttime restricted food intake normalized to total starting body weight. Not significant by two-way repeated measures ANOVA with Bonferroni multiple comparisons. All mice are age and weight-matched. Data are presented as mean ± SEM.
Figure 2—figure supplement 2
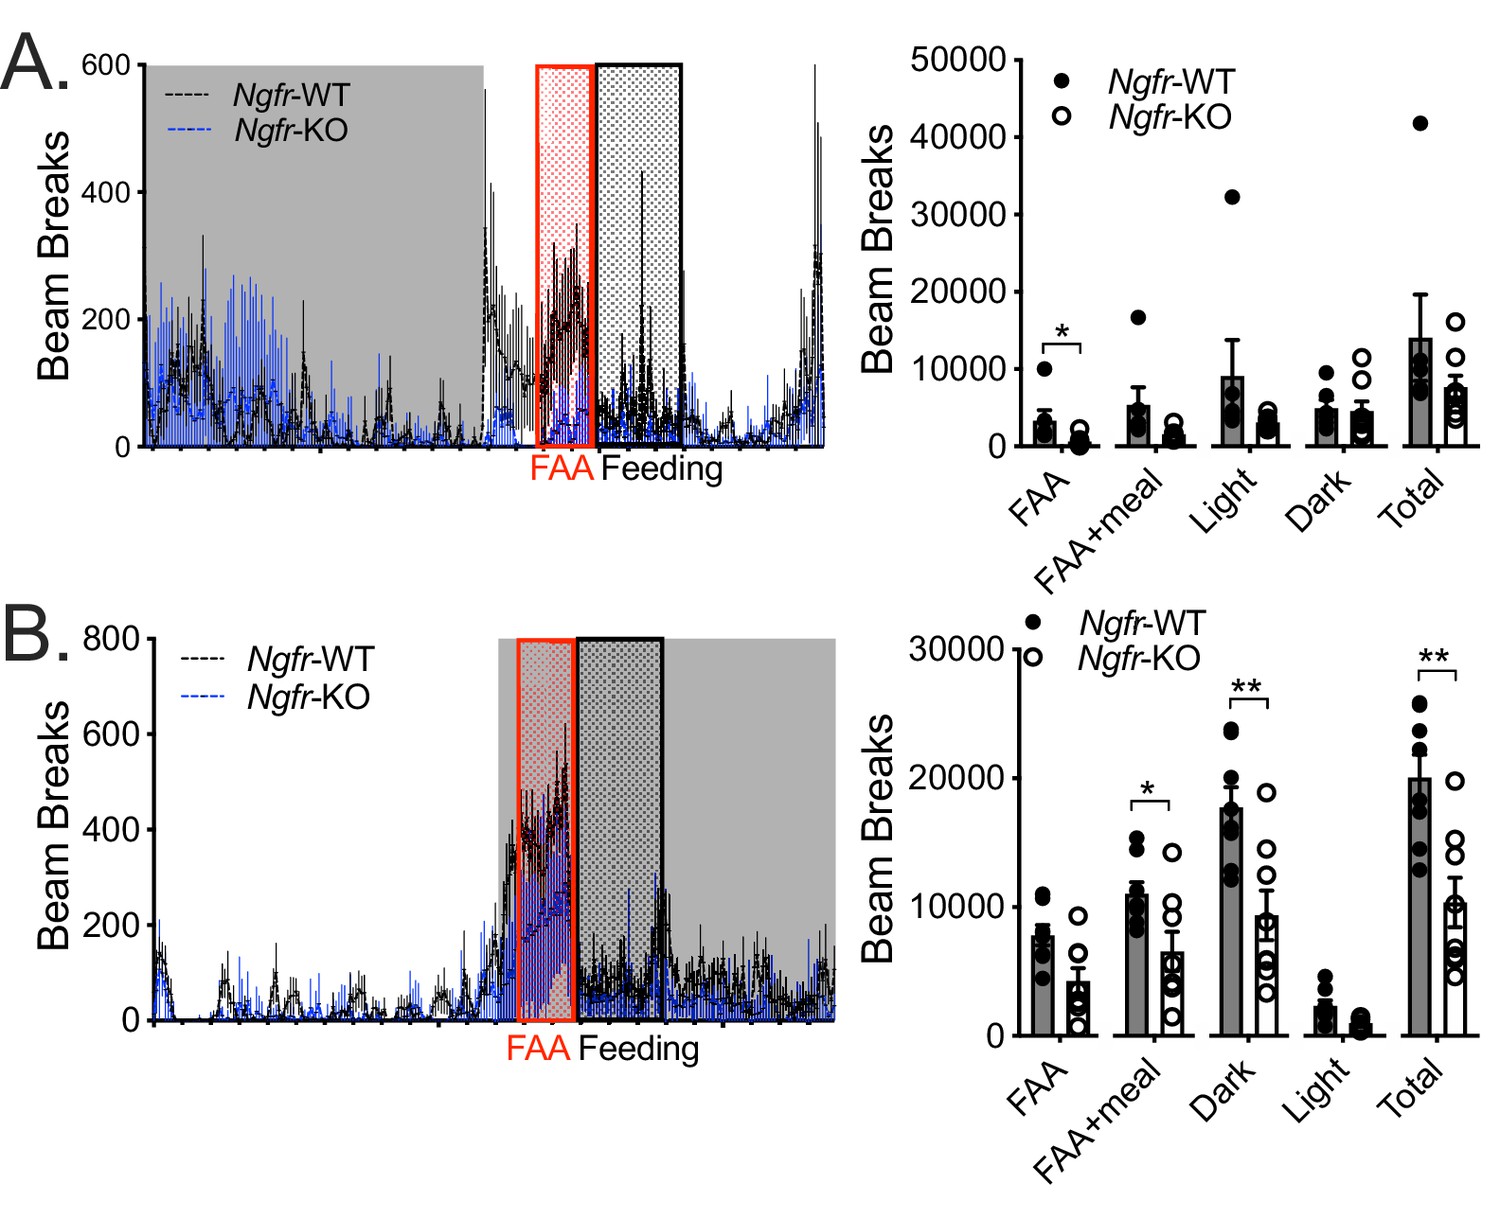
Daytime restricted feeding selectively dampens FAA, while nighttime restricted feeding blunts several activity measures.
(A) 24 hr plot of day five restriction locomotor activity (left) quantified into several discrete time periods (right); n = 6/group. *p=0.046 by Student’s t-test. (B) 24 hr plot of night five restriction locomotor activity (left) quantified into several discrete time periods (right); n = 8/group. All mice are age and weight-matched. Gray shaded areas correspond to the dark cycle. Data are presented as mean ± SEM. *p=0.0214, **p<0.0001 by Student’s t-test.
Figure 3 with 1 supplement
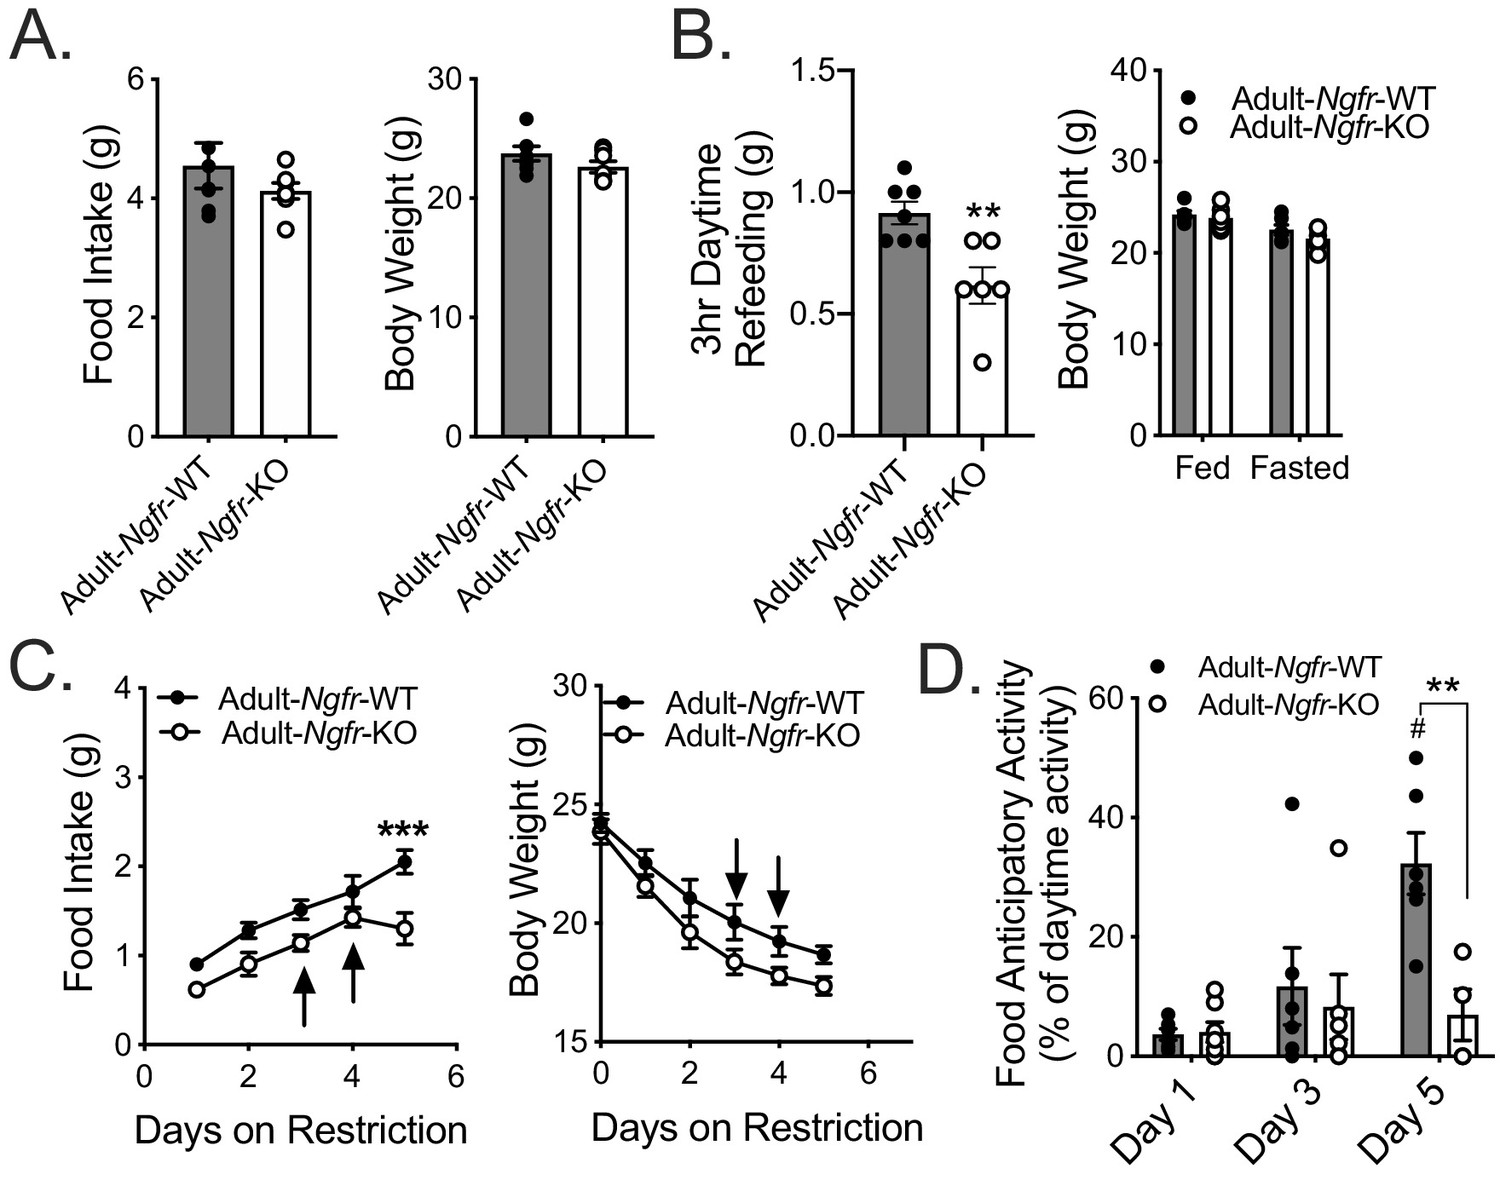
Adult loss of p75NTR leads to reduced homeostatic feeding and absent FAA.
(A) Ad libitum food intake (left) and body weight (right) 4 weeks after tamoxifen injection; n = 7/group. Not significant by Student’s t-test. (B) Mice are fasted just before lights out at ZT12 and fed for 3 hr between ZT4 and ZT7 (left). They are weighed at ZT0 before and after the fast (right). n = 7 WT, 6 KO. **p=0.005 by Student’s t-test. (C) Food intake (left) and body weight (right) during daytime restricted feeding paradigm as described in Figure 2A; n = 6/group. Arrows indicate mice that were removed from the experiment due to excessive weight loss (>30% of baseline). ***p=0.0002, F(1,10)=10.96 by mixed effects analysis with Bonferroni multiple comparisons. (D) Percent of daytime locomotor activity that occurs in the two hour window (ZT2-4) preceding feeding. #p=0.0002, F(2,18)=7.247 vs day 1; **p=0.002, F(1,11)=5.031 vs control by mixed effects analysis with Bonferroni multiple comparisons; n = 6/group. All mice are age and weight-matched in B-D. Data are presented as mean ± SEM.
Figure 3—figure supplement 1
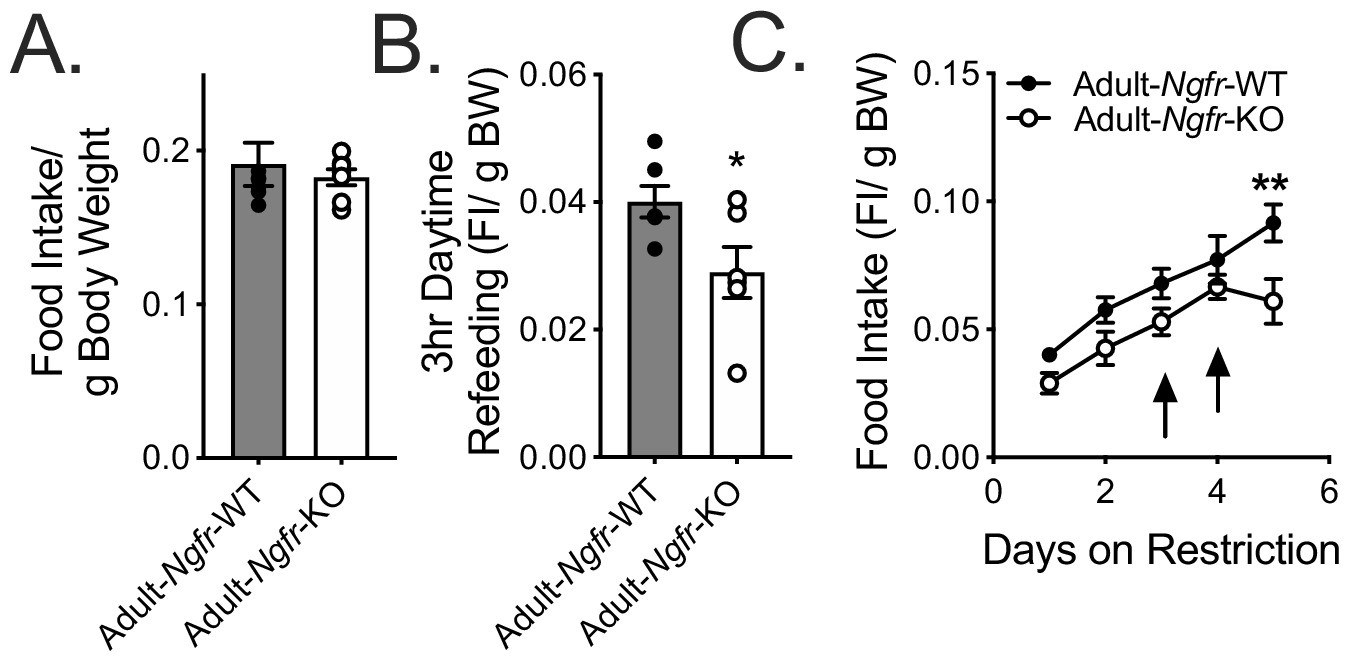
Adult food intake normalized to total body weight.
(A) Ad libitum food intake normalized to total body weight. Not significant by Student’s t-test. n = 7/group. (B) Daytime refeeding normalized to overnight fasted body weight. *p=0.0401 by Student’s t-test. n = 7 WT, 6 KO. (C) Daytime restricted food intake normalized to total starting body weight. **p=0.0031, F(1,10)=5.719 by mixed effects analysis with Bonferroni multiple comparisons.; n = 6/group. Data are presented as mean ± SEM.
Figure 4 with 1 supplement
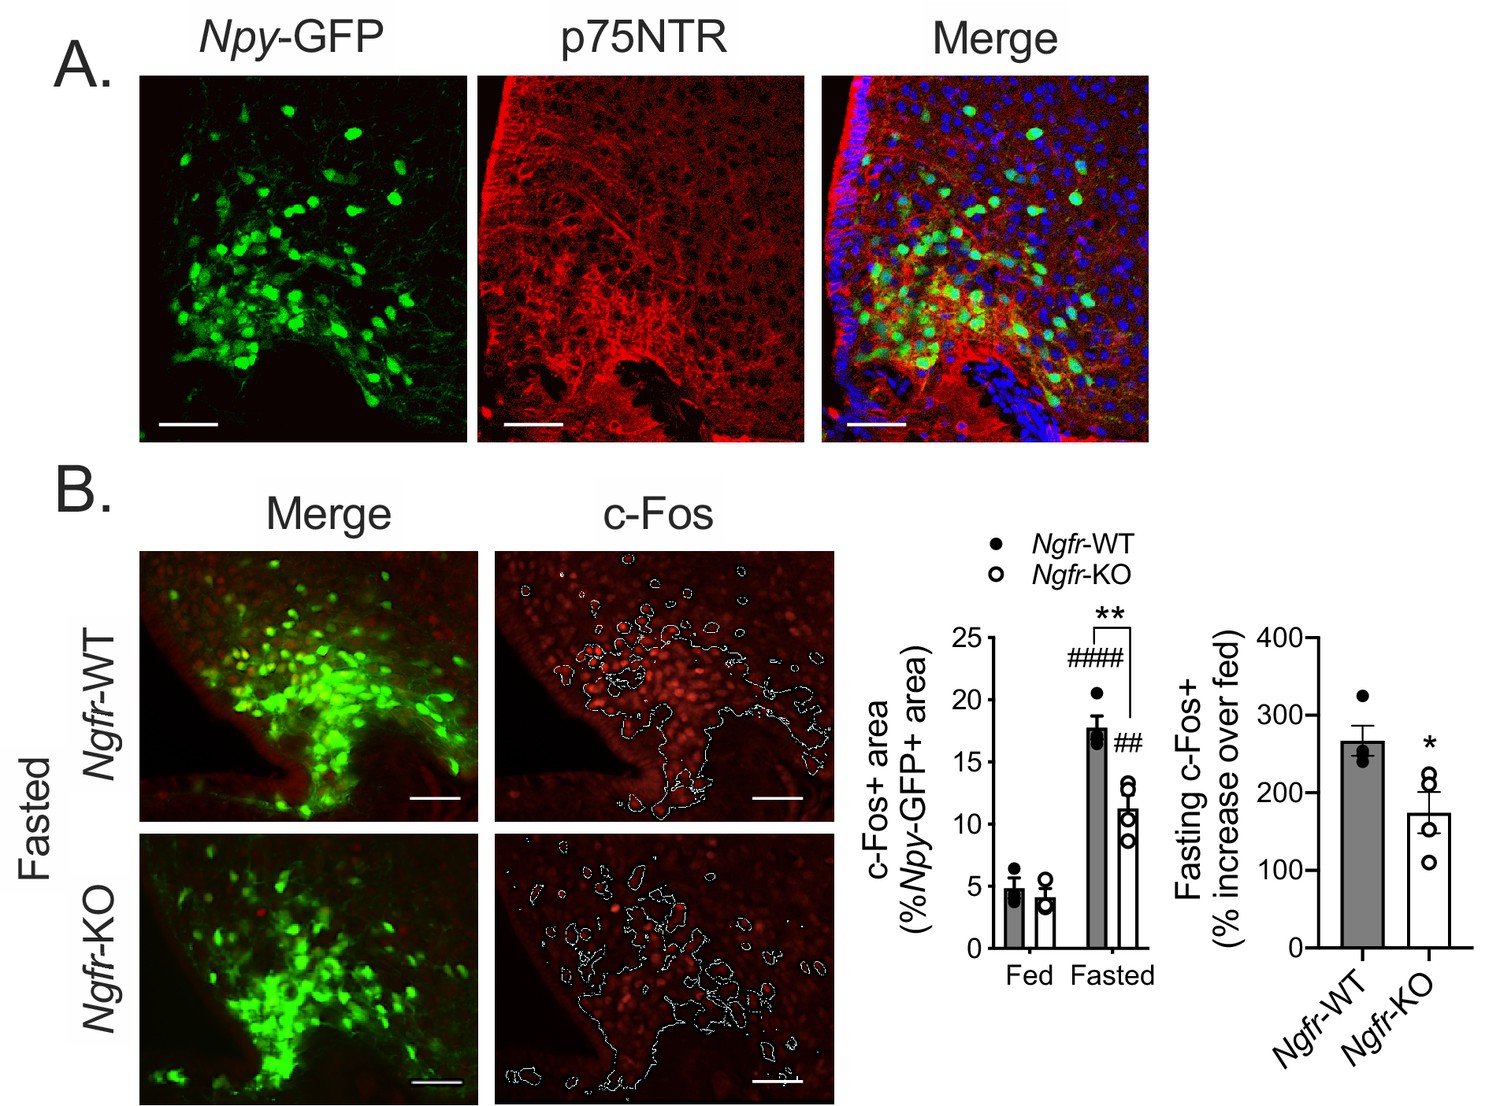
p75NTR is expressed in AgRP neurons and is necessary for the arcuate hypothalamus response to fasting.
(A) Representative images of immunofluorescent staining for p75NTR in an Npy-GFP expressing reporter mouse. (B) Immunofluorescent staining for c-Fos (left) in 16 hr overnight fasted mice co-expressing an Npy-GFP reporter. White lines indicate the approximate boundaries of Npy-GFP expression. Quantification (right) of c-Fos expression within Npy-GFP expressing areas in fed and fasted mice and the percent increase of c-Fos+/NPY+ areas in each fasted Ngfr-WT or Ngfr-KO mouse relative to the average of c-Fos+/NPY+ areas of fed Ngfr-WT or fed Ngfr-KO. Left, ###p<0.0001, ##p=0.0022 vs fed; **p=0.0027, F(1,10)=13.91 vs WT by two-way repeated measures ANOVA with Bonferroni multiple comparisons. Right, *p=0.0302 by Student’s t-test. n = 3–4/group. Scale bar = 50 µM. Data are presented as mean ± SEM.
Figure 4—figure supplement 1
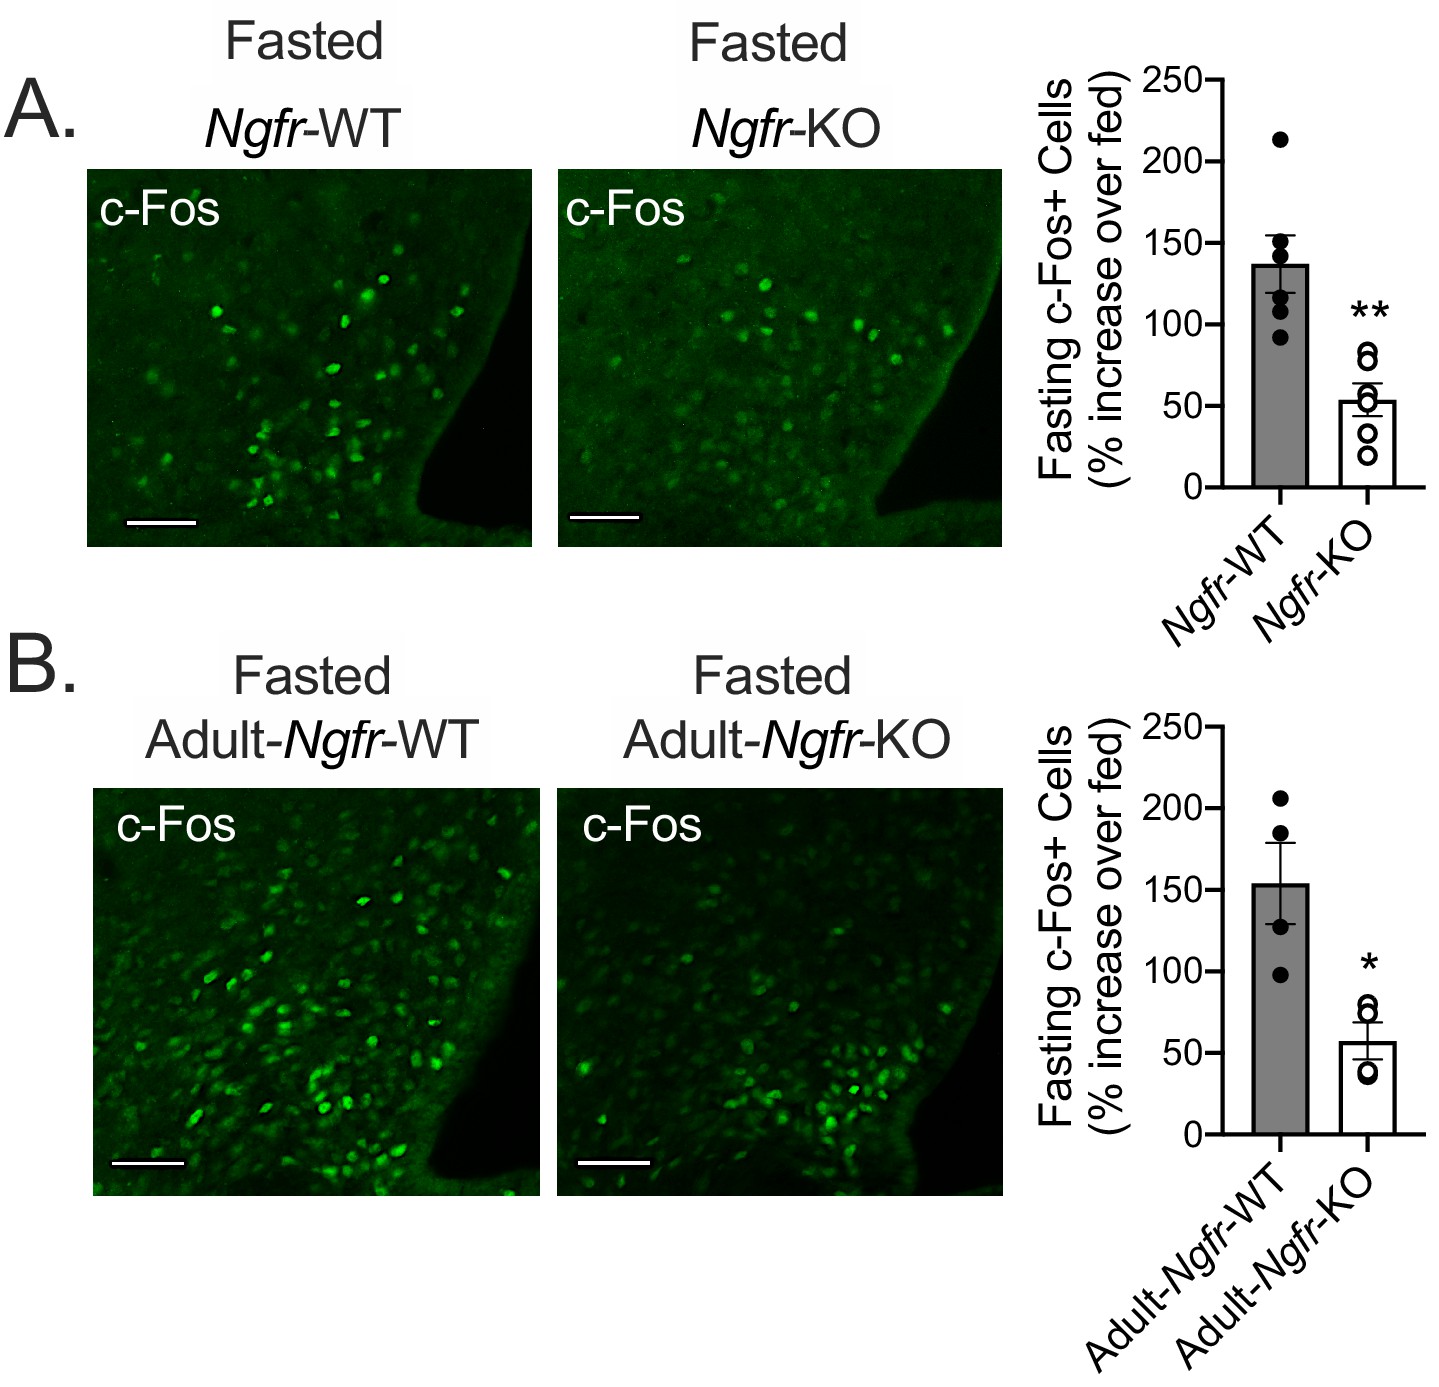
p75NTR is necessary for the arcuate hypothalamus response to fasting in germline and adult knockout mice.
(A) Immunofluorescent staining for c-Fos (left) in 16 hr overnight fasted Ngfr-KO and control mice. Quantification (right) as the percent increase of c-Fos+ cells/dapi+ cells in each fasted Ngfr-WT or Ngfr-KO mouse relative to the average of c-Fos+ cells/dapi+ cells in fed Ngfr-WT or fed Ngfr-KO; n = 6/group. **p=0.0022 by Student’s t-test. (B) Immunofluorescent staining for c-Fos (left) in 16 hr overnight fasted Adult-Ngfr-KO and control mice. Quantification (right) as the percent increase of c-Fos+ cells/dapi+ cells in each fasted Adult-Ngfr-WT or Adult-Ngfr-KO mouse relative to the average of c-Fos+ cells/dapi+ cells in fed Adult-Ngfr-WT or fed Adult-Ngfr-KO; n = 3–4/group. *p=0.0127 by Student’s t-test. Scale bar = 50 µM. Data are presented as mean ± SEM.
Figure 5 with 2 supplements
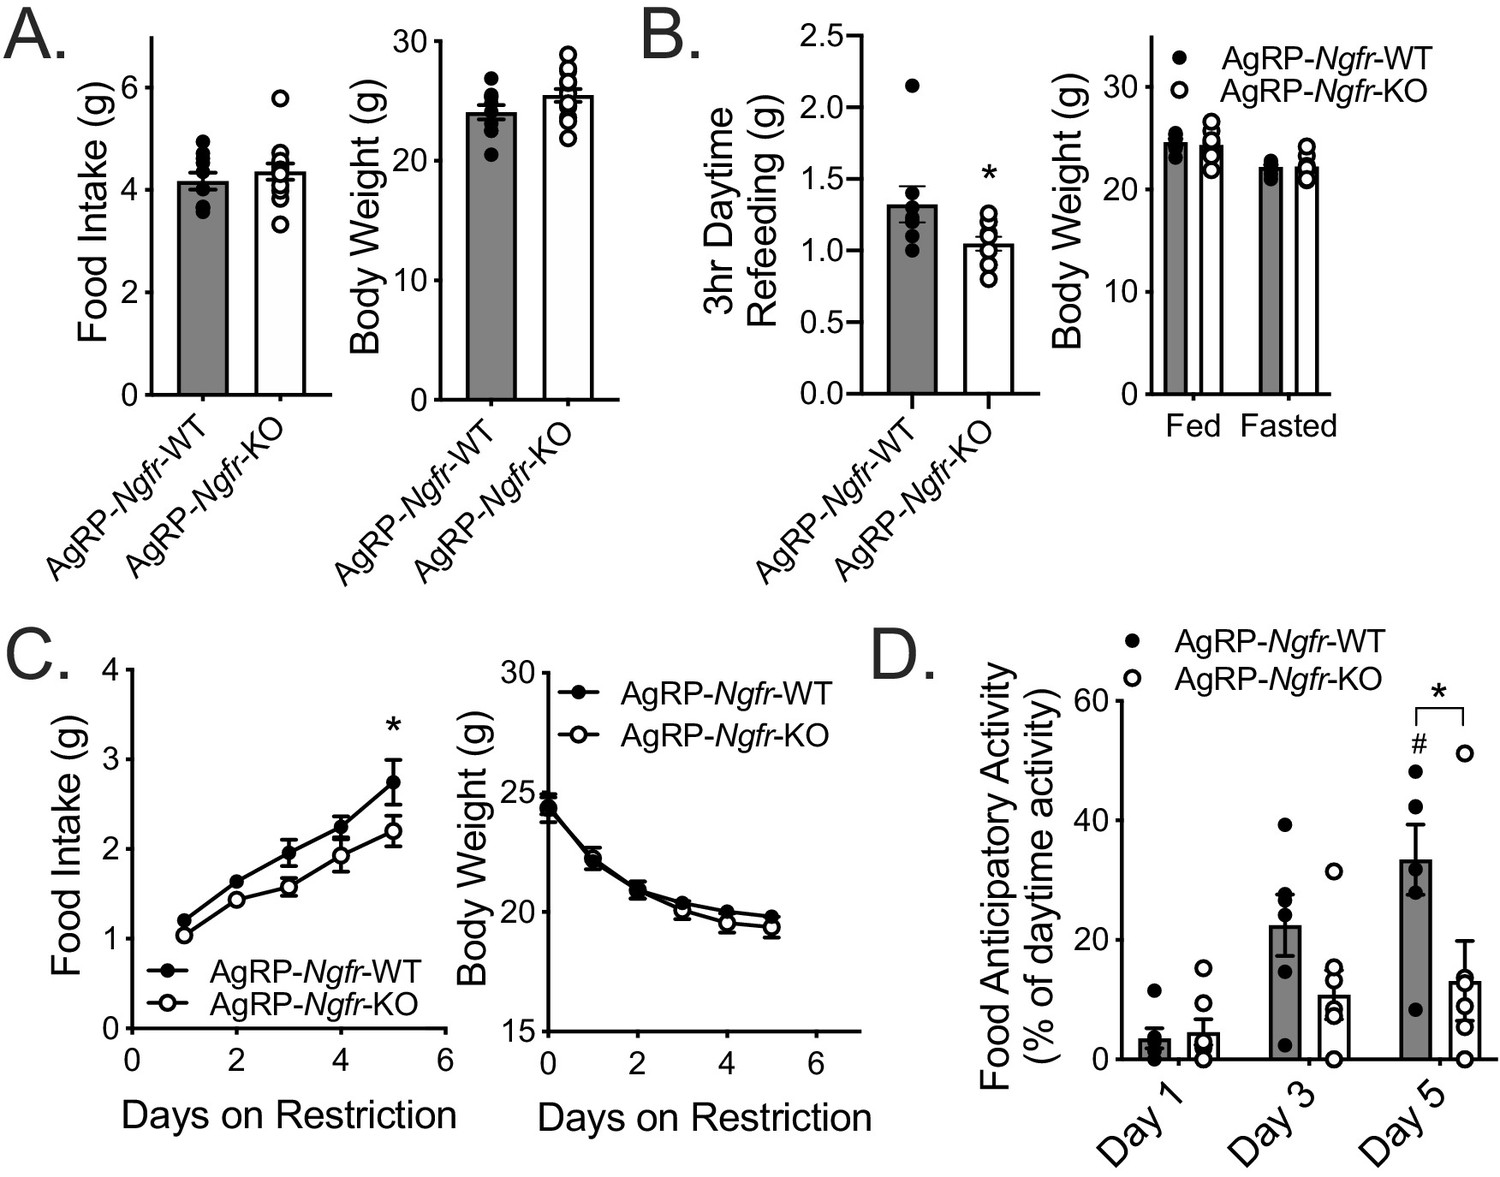
AgRP neuron specific loss of p75NTR leads to reduced daytime restricted feeding and FAA.
(A) Ad libitum food intake (left) and body weight (right); n = 10 WT, 13 KO. Not significant by Student’s t-test. (B) Mice are fasted just before lights out at ZT12 and fed for 3 hr between ZT4 and ZT7 (left). They are weighed at ZT0 before and after the fast (right). n = 8 WT, 10 KO. *p=0.0416 by Student’s t-test. (C) Food intake (left) and body weight (right) during daytime restricted feeding paradigm as described in Figure 2A. *p=0.0313, F(1,11)=5.024 by two-way repeated measures ANOVA with Bonferroni multiple comparisons; n = 6 WT, 7 KO. (D) Percent of daytime locomotor activity that occurs in the two hour window (ZT2-4) preceding feeding. #p=0.001, F(2,22)=8.358 vs day 1; *p=0.013, F(1,11)=7.883 vs control by two-way repeated measures ANOVA with Bonferroni multiple comparisons; n = 6 WT, 7 KO. All mice are age and weight-matched in B-D. Data are presented as mean ± SEM.
Figure 5—figure supplement 1
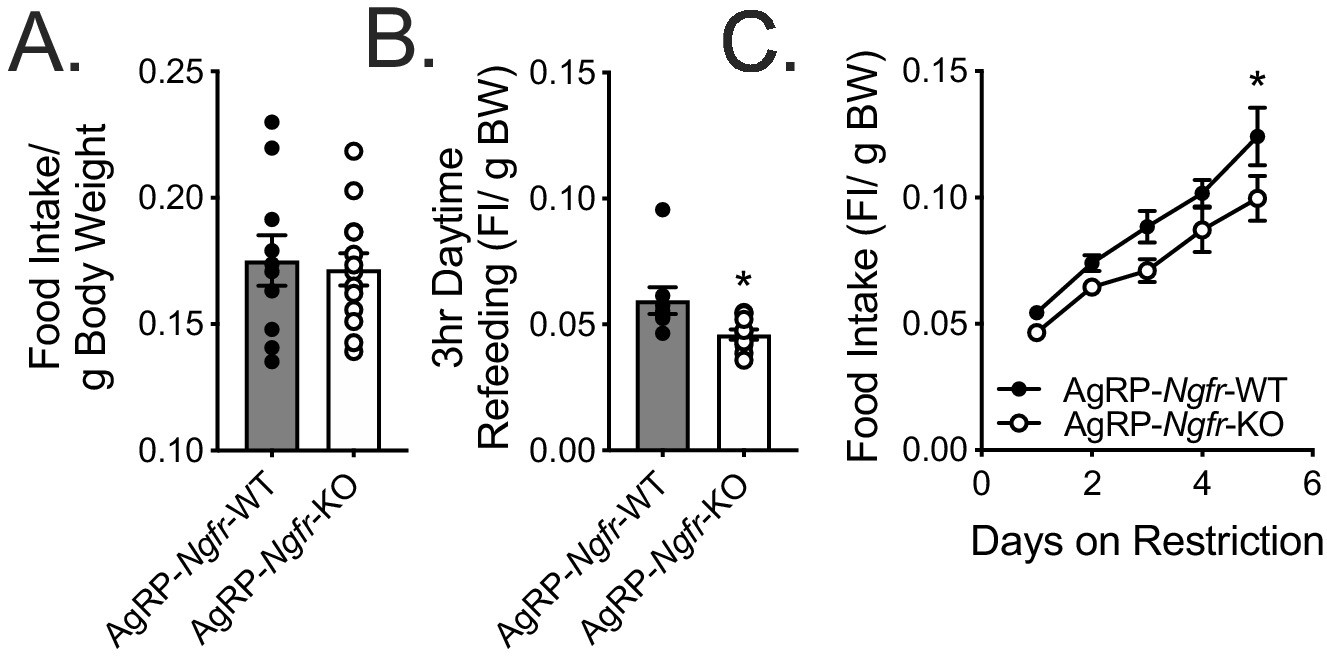
AgRP food intake normalized to total body weight.
(A) Ad libitum food intake normalized to total body weight. Not significant by Student’s t-test. (B) Daytime refeeding normalized to overnight fasted body weight. *p=0.021 by Student’s t-test. (C) Daytime restricted food intake normalized to total starting body weight. *p=0.0427 (day 5), F(1,11)=4.675 by two-way repeated measures ANOVA with Bonferroni multiple comparisons; n = 6 WT, 7 KO.
Figure 5—figure supplement 2

Ghrelin-induced feeding is intact in AgRP-Ngfr-KO mice.
(A) Three hour food intake following central infusion of either vehicle or ghrelin (1 ug) in ad libitum fed AgRP-Ngfr-KO mice or controls (left). Mice are weighed prior to infusion (right). n = 10 WT, 7KO. ###p=0.0003, #p=0.0162, versus vehicle. F(1,15)=30.5 by two-way repeated measures ANOVA with Bonferroni multiple comparisons. Comparison between genotypes is not significant by two-way repeated measures ANOVA with Bonferroni multiple comparisons. (B) Food intake normalized to total body weight. ###p=0.0003, #p=0.022, versus vehicle. F(1,15)=30.02 by two-way repeated measures ANOVA with Bonferroni multiple comparisons. Comparison between genotypes is not significant by two-way repeated measures ANOVA with Bonferroni multiple comparisons. (C) Immunofluorescent staining for c-Fos (left) approximately 90 min after central infusion of ghrelin. Scale bar = 50 µM. Quantification (right) as the percent of c-Fos+ cells/dapi+ cells in each treated AgRP-Ngfr-KO or control mouse; n = 3–5/group. ###p=0.003, #p=0.0117, versus vehicle. F(1,13)=46.59 by two-way repeated measures ANOVA with Bonferroni multiple comparisons. Comparison between genotypes is not significant by two-way repeated measures ANOVA with Bonferroni multiple comparisons. Data are presented as mean ± SEM.
Figure 6 with 1 supplement
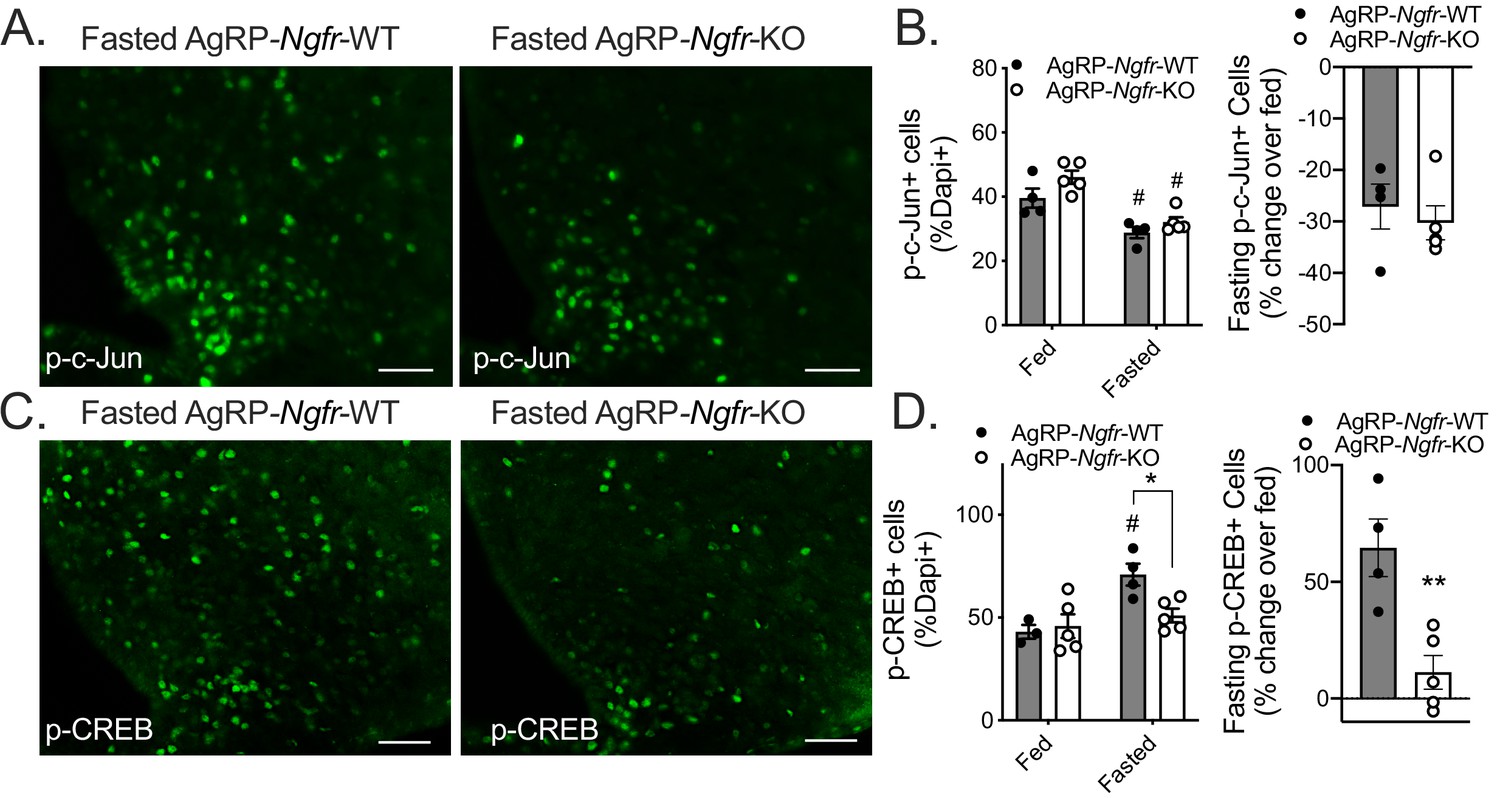
AgRP-Ngfr-KO mice have intact fasting JNK signaling, but blunted CREB activation.
(A) phospho-c-Jun immunofluorescence in fasted AgRP-Ngfr-KO mice and littermate controls. Scale bar = 50 µM. (B) Quantification of the number of phospho-c-Jun+ cells/dapi+ cells in fed and fasting conditions (left), and the percent increase of phospho-c-Jun+ cells/dapi+ cells in each fasted AgRP-Ngfr-WT or AgRP-Ngfr-KO mouse relative to the average of phospho-c-Jun+ cells/dapi+ cells in fed AgRP-Ngfr-WT or fed AgRP-Ngfr-KO (right). n = 4 WT, 5 KO, #p<0.05 compared to fed state. F(1,14)=0.5834 by two-way ANOVA with Bonferroni multiple comparisons in B, left. B, right, not significant by Student’s t-test. (C) phospho-CREB immunofluorescence in fasted AgRP-Ngfr-KO mice and littermate controls. Scale bar = 50 µM. (D) Quantification as the number of phospho-CREB+ cells/dapi+ cells in each condition (left), and the percent increase of phospho-CREB+ cells/dapi+ cells in each fasted AgRP-Ngfr-WT or AgRP-Ngfr-KO mouse relative to the average of phospho-CREB+ cells/dapi+ cells in fed AgRP-Ngfr-WT or fed AgRP-Ngfr-KO (right). n = 3–4 WT, 5 KO, *p=0.0216 compared to wildtype, #p=0.0174 compared to fed state. F(1,13)=5.266 by two-way ANOVA with Bonferroni multiple comparisons in d, left. **p=0.0057 by Student’s t-test in d, right.
Figure 6—figure supplement 1
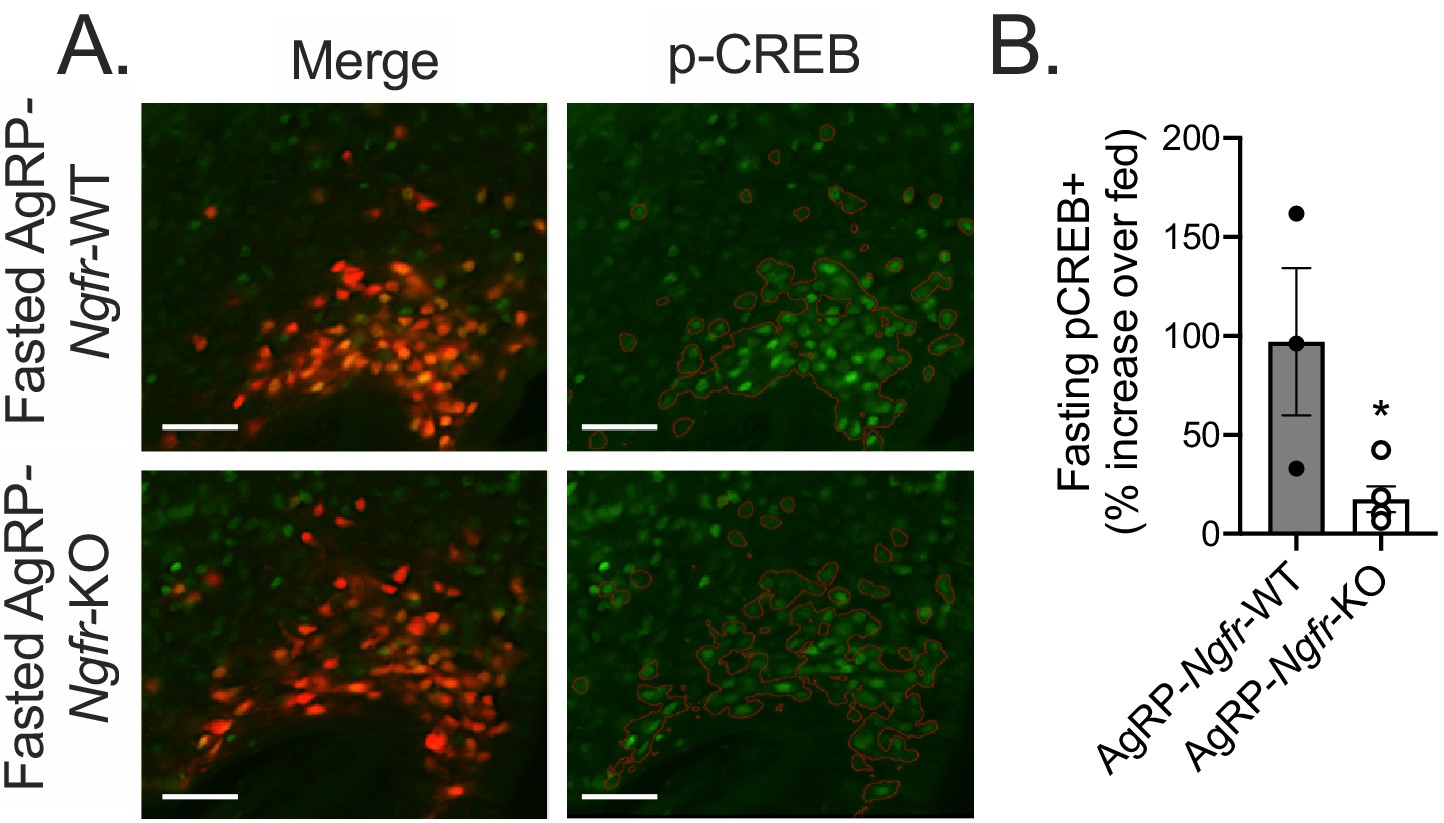
AgRP-Ngfr-KO mice have blunted activation of fasting CREB in AgRP neurons.
(A) Immunofluorescent staining for pCREB in 16 hr overnight fasted mice co-expressing tdTomato from the AgRP promoter. Red lines indicate the approximate boundaries of AgRP-tdTomato expression. Scale bar = 50 µM. (B) Quantification of the percent increase of pCREB+/AgRP+ areas in each fasted AgRP-Ngfr-WT or AgRP-Ngfr-KO mouse relative to the average of pCREB+/AgRP+ areas of fed AgRP-Ngfr-WT or fed AgRP-Ngfr-KO. *p=0.0316 by Student’s t-test. n = 3–5/group. Data are presented as mean ± SEM.
Tables
Table 1
Serum chemistries exhibit similar daytime changes in fed and fasted Ngfr-KO mice.
Serum was collected at ZT4 (Zeitgeber Time) in 12–16 week old ad libitum fed mice or following a 16 hr overnight fast. Data are presented as mean ± SEM. *p<0.05 compared to WT by Student’s t-test. #p<0.05 compared to fed state by Student’s t-test, exact p-values can be found in Table 1—source data 1. n = 8/group.
| Ngfr-WT | Ngfr-KO | ||
|---|---|---|---|
| ZT4 | |||
| Body Weight (g) | Fed | 29.8 ± 0.7 | 26.6 ± 1.2* |
| Fasted | 23.8 ± 1.3# | 22.0 ± 0.7# | |
| Glucose (mg/dl) | Fed | 380 ± 17.5 | 385 ± 16.4 |
| Fasted | 245 ± 19.1# | 307 ± 25.7# | |
| Insulin (ng/ml) | Fed | 0.23 ± 0.1 | 0.37 ± 0.1 |
| Fasted | 0.10 ± 0.1 | 0.10 ± 0.1# | |
| Ketones (mM) | Fed | 0.0 ± 0.02 | 0.0 ± 0.02 |
| Fasted | 2.1 ± 0.36# | 2.1 ± 0.10# | |
| Leptin (ng/ml) | Fed | 2.1 ± 0.5 | 0.9 ± 0.2 |
| Fasted | 0.8 ± 0.16# | 0.9 ± 0.14 | |
| Corticosterone (ng/ml) | Fed | 117 ± 12.4 | 126.7 ± 13.4 |
| Fasted | 170 ± 5.3# | 180 ± 4.1# | |
-
Table 1—source data 1
p values by Student’s t-test for each pair-wise comparison in Table 1.
- https://cdn.elifesciences.org/articles/52623/elife-52623-table1-data1-v2.docx
Table 2
Serum chemistries exhibit similar nighttime changes in fed and fasted Ngfr-KO mice.
Serum was collected at ZT16 in 12–16 week old ad libitum fed mice or following a 16 hr overday fast. Data are presented as mean ± SEM. *p<0.05 compared to WT by Student’s t-test. #p<0.05 compared to fed state by Student’s t-test, exact p-values can be found in Table 2—source data 1. n = 8/group.
| Ngfr-WT | Ngfr-KO | ||
|---|---|---|---|
| ZT16 | |||
| Body Weight (g) | Fed | 29.4 ± 0.4 | 23.9 ± 0.5* |
| Fasted | 26.2 ± 0.5# | 23.3 ± 0.7* | |
| Glucose (mg/dl) | Fed | 299 ± 13.0 | 312 ± 29.2 |
| Fasted | 145 ± 25.6# | 160 ± 13.6# | |
| Insulin (ng/ml) | Fed | 2.0 ± 0.5 | 0.88 ± 0.2 |
| Fasted | 0.16 ± 0.1# | 0.03 ± 0.1# | |
| Ketones (mM) | Fed | 0.1 ± 0.03 | 0.2 ± 0.11 |
| Fasted | 1.6 ± 0.10# | 1.4 ± 0.13# | |
| Leptin (ng/ml) | Fed | 3.3 ± 0.9 | 1.5 ± 0.2 |
| Fasted | 0.8 ± 0.15# | 0.8 ± 0.12# | |
| Corticosterone (ng/ml) | Fed | 123 ± 8.3 | 146 ± 8.5 |
| Fasted | 163 ± 8.2# | 176 ± 3.7# | |
-
Table 2—source data 1
1 p values by Student’s t-test for each pair-wise comparison in Table 2.
- https://cdn.elifesciences.org/articles/52623/elife-52623-table2-data1-v2.docx
Key resources table
| Reagent type (species) or resource | Designation | Source or reference | Identifiers | Additional information |
|---|---|---|---|---|
| Gene Mus musculus | Ngfr | NCBI Gene ID: 18053 | ||
| Strain, strain background (Mus musculus, males) | B6.129S4-Ngfrtm1Jae/J Also known as p75NGFR | Jackson Labs | RRID:IMSR_JAX:002213 | |
| Strain, strain background (Mus musculus, males) | Ngfrtm1.1Vk/BnapJ Also known as p75NTR-Fxflox | Bogenmann et al., 2011 | RRID:IMSR_JAX:031162 | Gift from Brian Pierchala |
| Strain, strain background (Mus musculus, males) | B6.Cg-Ndor1Tg(UBC-cre/ERT2)1Ejb/1J Also known as UBC-Cre-ERT2 | Jackson Labs | RRID:IMSR_JAX:007001 | |
| Strain, strain background (Mus musculus, males) | Agrptm1(cre)Lowl/J Also known as Agrp-IRES-cre | Jackson Labs | RRID:IMSR_JAX:012899 | |
| Strain, strain background (Mus musculus, males) | B6.FVB-Tg(Npy-hrGFP)1Lowl/J Also known as NPY-GFP | Jackson Labs | RRID:IMSR_JAX:006417 | |
| strain, strain background (Mus musculus, males) | B6.Cg-Gt(ROSA)26Sortm9(CAG-tdTomato)Hze/J Also known as Ai9 | Jackson Labs | RRID:IMSR_JAX:007909 | |
| Antibody | p75NTR, goat monoclonal | Neuromics | Cat # GT15057 | IF 1:5000 |
| Antibody | c-Fos, rabbit polyclonal | Synaptic Systems | Cat # 226 003 | IF 1:1000 |
| Antibody | phospho-cJun, rabbit monoclonal | Cell Signaling Technology | RRID:AB_2129575 | IF 1:800 |
| Antibody | phospho-CREB | Cell Signaling Technology | RRID:AB_2561044 | IF 1:800 |
| Commercial assay or kit | Insulin elisa | Crystal Chem | RRID:AB_2783626 | |
| Commercial assay or kit | Leptin elisa | Cayman Chemical | Cat # 10007609 | |
| Commercial assay or kit | Corticosterone elisa | Cayman Chemical | Cat # 501320 | |
| Commercial assay or kit | Glucose meter | Bayer | One touch ultra 2 | |
| Commercial assay or kit | Ketone monitor | Abbott | Precision xtra | |
| Peptide, recombinant protein | Ghrelin | Phoenix Pharmaceuticals, inc | Cat # 031–31 | ICV 1 ug |
| Software, algorithm | Prism 8 | Graphpad | RRID:SCR_002798 | |
| Software, algorithm | FIJI | FIJI | RRID:SCR_002285 | |
| Other | DAPI stain | Southern Biotech | Cat # 0100–20 | |
| Other | Opto M4 Activity Monitor | Columbus Instruments |
Additional files
Download links
A two-part list of links to download the article, or parts of the article, in various formats.
Downloads (link to download the article as PDF)
Open citations (links to open the citations from this article in various online reference manager services)
Cite this article (links to download the citations from this article in formats compatible with various reference manager tools)
The p75 neurotrophin receptor in AgRP neurons is necessary for homeostatic feeding and food anticipation
eLife 9:e52623.
https://doi.org/10.7554/eLife.52623


