Pathway-, layer- and cell-type-specific thalamic input to mouse barrel cortex
- Ecole Polytechnique Fédérale de Lausanne (EPFL), Switzerland
- Georg-August-University Goettingen, Germany
- Weizmann Institute of Science, Israel
Figures
Figure 1
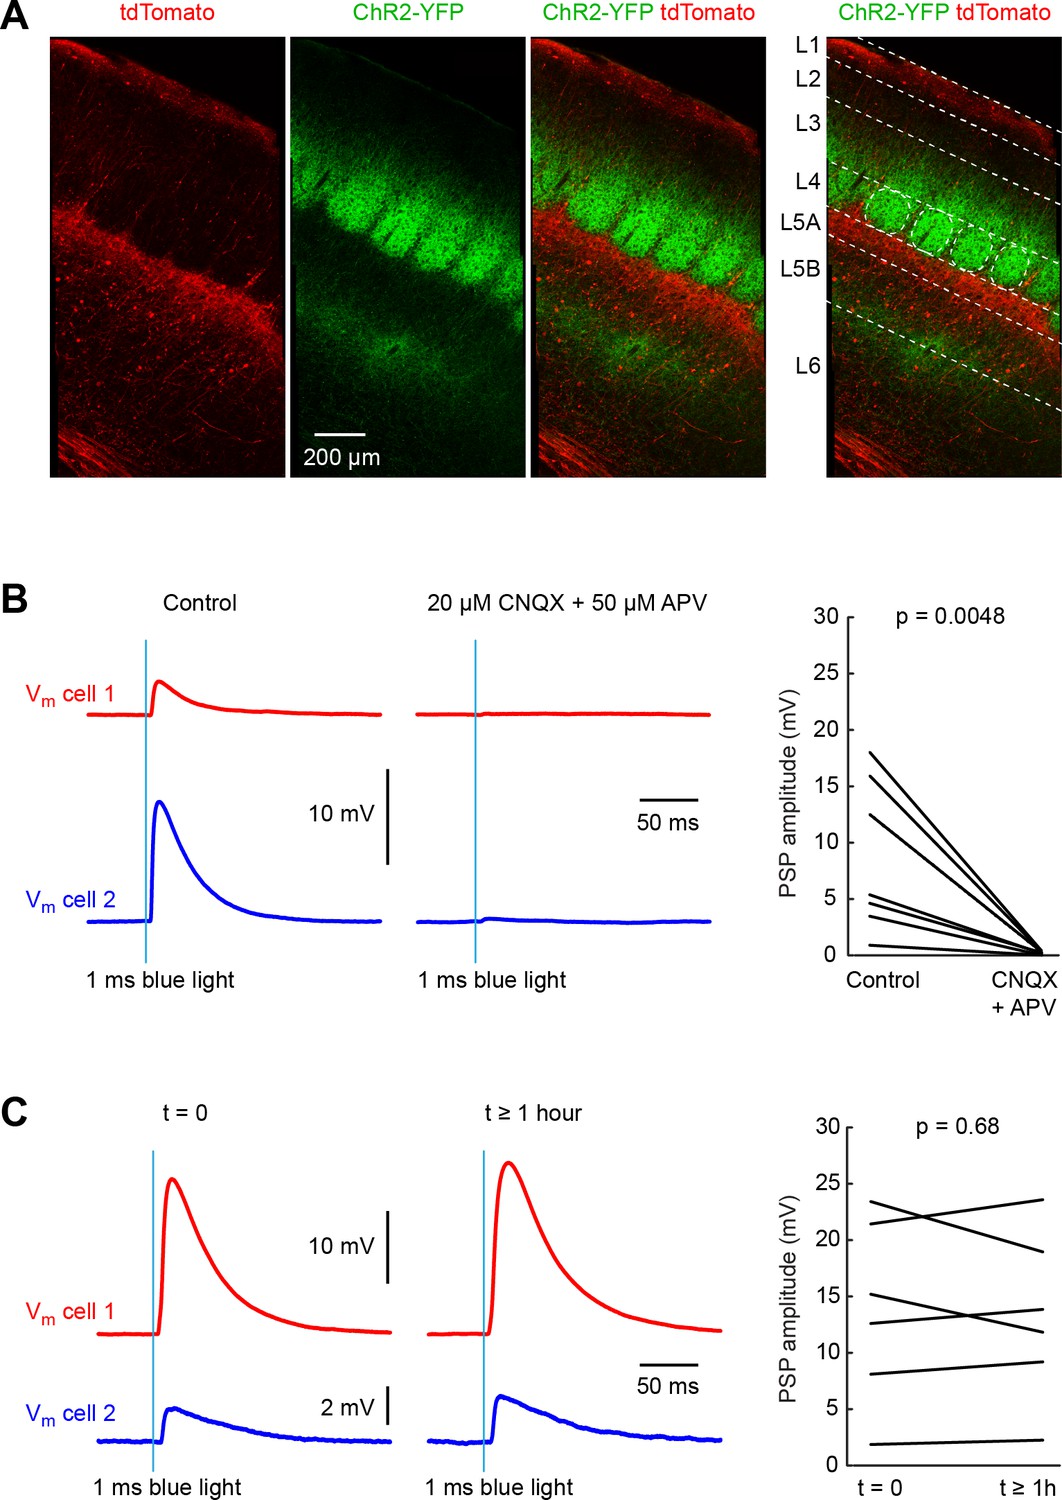
Pathway-specific optogenetic stimulation of thalamus evokes stable monosynaptic input to neurons in whisker primary somatosensory barrel cortex (wS1).
(A) A Cre-ON (FLEX) AAV virus expressing tdTomato and a Cre-OFF (DFO) virus expressing YFP, were injected together into the thalamus of GPR26-Cre mice, which express Cre in the higher-order somatosensory thalamic nucleus POm, but not in the first order somatosensory thalamic nucleus VPM. Thalamic axons from POm (red) were prominent in L5A and L1 in wS1. Axons from VPM (green) aggregate in clusters termed barrels in L4. Additional VPM innervation is found at the L5/L6 border. (B) Example average traces of membrane potential (Vm) from two simultaneously-recorded excitatory L4 neurons during optogenetic stimulation of thalamic VPM axons in wS1 (left). Application of CNQX (AMPA receptor antagonist) and APV (NMDA receptor anatagonist) completely blocked the evoked EPSP in the example experiment (middle), and on average across 8 cells (right) (p=0.0048, two-tailed Wilcoxon signed-rank test). (C) Example average traces of membrane potential (Vm) from two simultaneously-recorded excitatory L4 neurons in wS1 during optogenetic stimulation of thalamic VPM axons shortly after establishment of the whole-cell recordings (left) and more than an hour later (middle). On average across 6 cells, there was no systematic change in EPSP amplitude over the ~1 hr period of the experiments (right) (p=0.68, two-tailed Wilcoxon signed-rank test).
-
Figure 1—source data 1
Data values and statistics underlying Figure 1.
- https://cdn.elifesciences.org/articles/52665/elife-52665-fig1-data1-v1.xlsx
Figure 2

VPM input to excitatory neurons across layers in wS1.
(A) An example experiment (BS144) in which ChR2 was expressed in VPM and whole-cell recordings were obtained sequentially from 12 excitatory neurons across different cortical layers in wS1. Neurons were filled with biocytin and post hoc stained with streptavidin conjugated to Alexa 647 to reveal dendritic morphology, which was digitally reconstructed. Neurons #5 and #6 (both located in L4, although the full morphology of #6 was not recovered, its location is indicated by an asterisk) received the largest EPSPs in response to optogenetic stimulation of VPM. (B) The laminar location was assigned for each recording. The peak amplitude of the evoked EPSP averaged across trials was determined for each cell, and plotted for each layer along with the median (box plot, including interquartile range and whiskers) and the mean (filled circle, along with SD error bars) (left). The EPSP amplitudes from individual slices were normalized to the mean amplitude of the EPSP measured in the L4 neurons of the same slice (center left). The slope of the rising phase of the EPSP was determined and plotted across layers (center right). The normalized EPSP slope was calculated by dividing by the mean slope of the EPSPs in the L4 neurons recorded in the same slice (right). (C) EPSP amplitude (left), normalized EPSP amplitude (center left), EPSP slope (center right) and normalized EPSP slope (right) plotted as a function of cortical depth below the pial surface. Approximate layer boundaries are drawn according to Lefort et al. (2009).
-
Figure 2—source data 1
Data values underlying Figure 2.
- https://cdn.elifesciences.org/articles/52665/elife-52665-fig2-data1-v1.xlsx
Figure 3
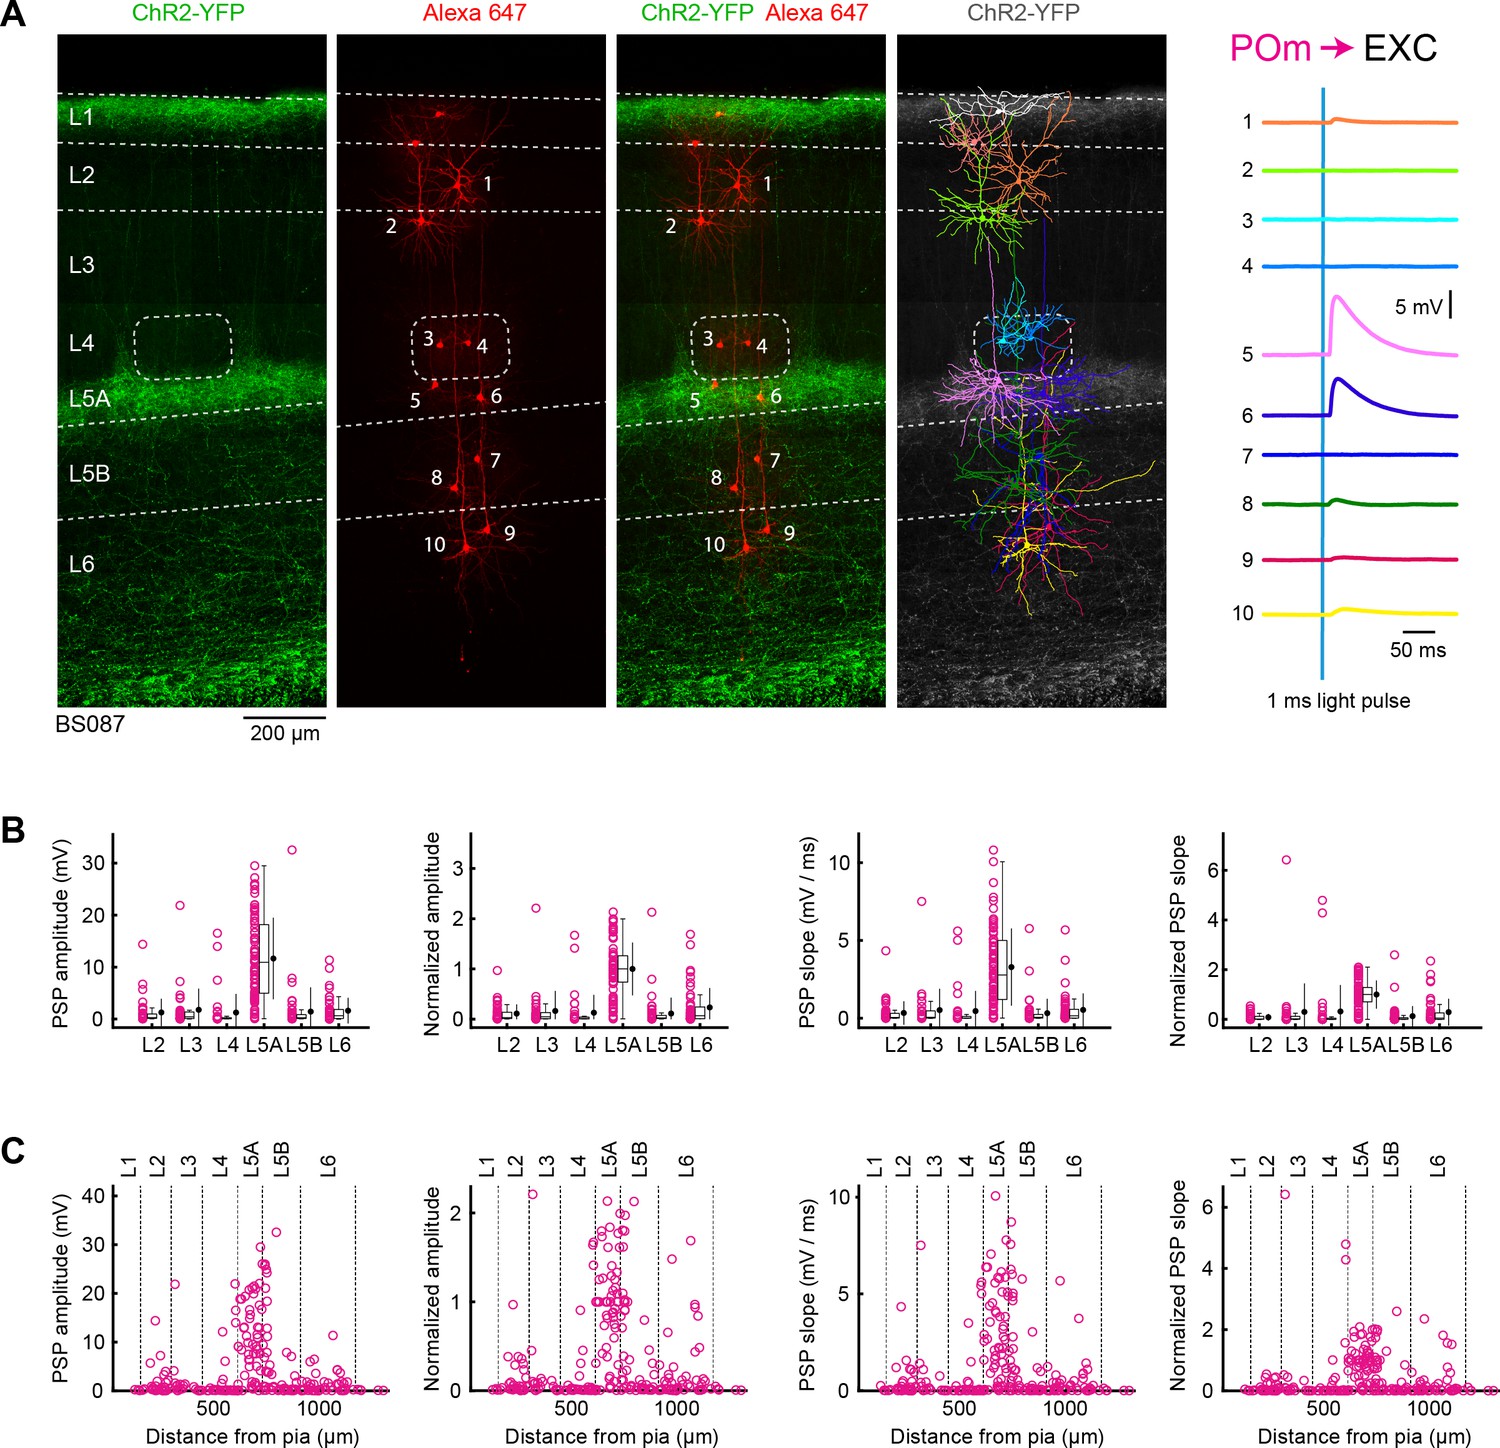
POm input to excitatory neurons across layers in wS1.
(A) ChR2 was expressed in POm in the example experiment (BS087) and 10 excitatory neurons across different cortical layers in wS1 were recorded sequentially. Neurons were filled with biocytin and post hoc stained with streptavidin conjugated to Alexa 647 to reveal dendritic morphology, which was digitally reconstructed. Neurons #5 and #6 (both located in L5A) received the largest EPSPs in response to optogenetic stimulation of POm. (B) The location of the soma of each recorded neuron was assigned to a cortical layer, and the peak amplitude of the evoked EPSP averaged across trials was determined for each cell, and plotted for each layer along with the median (box plot, including interquartile range and whiskers) and the mean (filled circle, along with SD error bars) (left). The EPSP amplitudes from individual slices were normalized to the mean amplitude of the EPSP measured in the L5A neurons of the same slice (center left). The slope of the rising phase of the EPSP was determined and plotted across layers (center right). The normalized EPSP slope was calculated by dividing by the mean slope of the EPSPs in the L5A neurons recorded in the same slice (right). (C) EPSP amplitude (left), normalized EPSP amplitude (center left), EPSP slope (center right) and normalized EPSP slope (right) plotted as a function of cortical depth below the pial surface. Approximate layer boundaries are drawn according to Lefort et al. (2009).
-
Figure 3—source data 1
Data values underlying Figure 3.
- https://cdn.elifesciences.org/articles/52665/elife-52665-fig3-data1-v1.xlsx
Figure 4
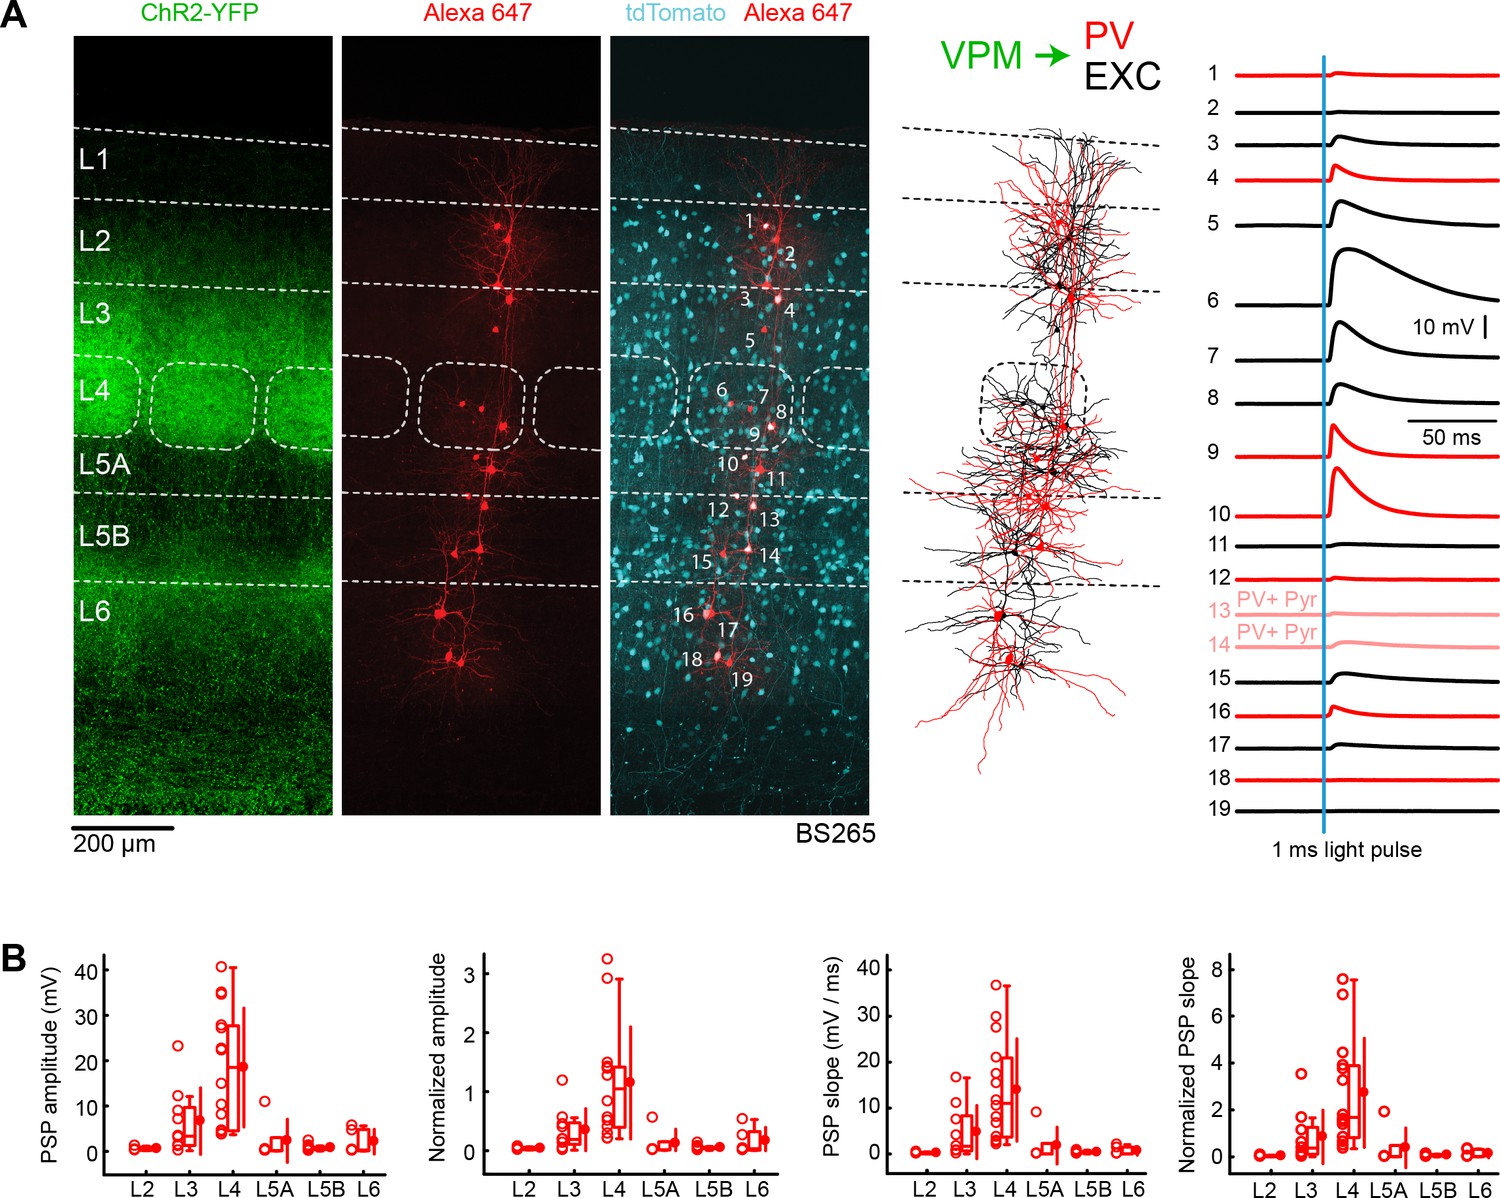
VPM input to GABAergic PV neurons across layers in wS1.
(A) An example experiment (BS265) in which ChR2 was expressed in VPM of a PV-Cre mouse crossed with a LSL-tdTomato report mouse, and whole-cell recordings were obtained sequentially neurons across different cortical layers in wS1. In the example experiment recordings were made from 7 PV-expressing inhibitory neurons (red), 2 PV-expressing L5 pyramidal neurons (#13 and #14, pink), and 10 non-tdTomato-expressing excitatory neurons (black). Neurons were filled with biocytin and post hoc stained with streptavidin conjugated to Alexa 647 to reveal dendritic morphology, which was digitally reconstructed. Neurons #6 (Exc L4), #7 (Exc L4), #9 (PV L4) and #10 (PV L5A) received the largest mean EPSPs in response to optogenetic stimulation of VPM (right). (B) The laminar location was assigned for each recording. The peak amplitude of the evoked EPSP averaged across trials was determined for each cell, and plotted for each layer along with the median (box plot, including interquartile range and whiskers) and the mean (filled circle, along with SD error bars) (left). The EPSP amplitudes from individual slices were normalized to the mean amplitude of the EPSP measured in the L4 EXC neurons of the same slice (center left). The slope of the rising phase of the EPSP was determined and plotted for each cell across layers (center right). The normalized EPSP slope was calculated by dividing by the mean slope of the EPSPs in the L4 EXC neurons recorded in the same slice (right).
-
Figure 4—source data 1
Data values underlying Figure 4.
- https://cdn.elifesciences.org/articles/52665/elife-52665-fig4-data1-v1.xlsx
Figure 5
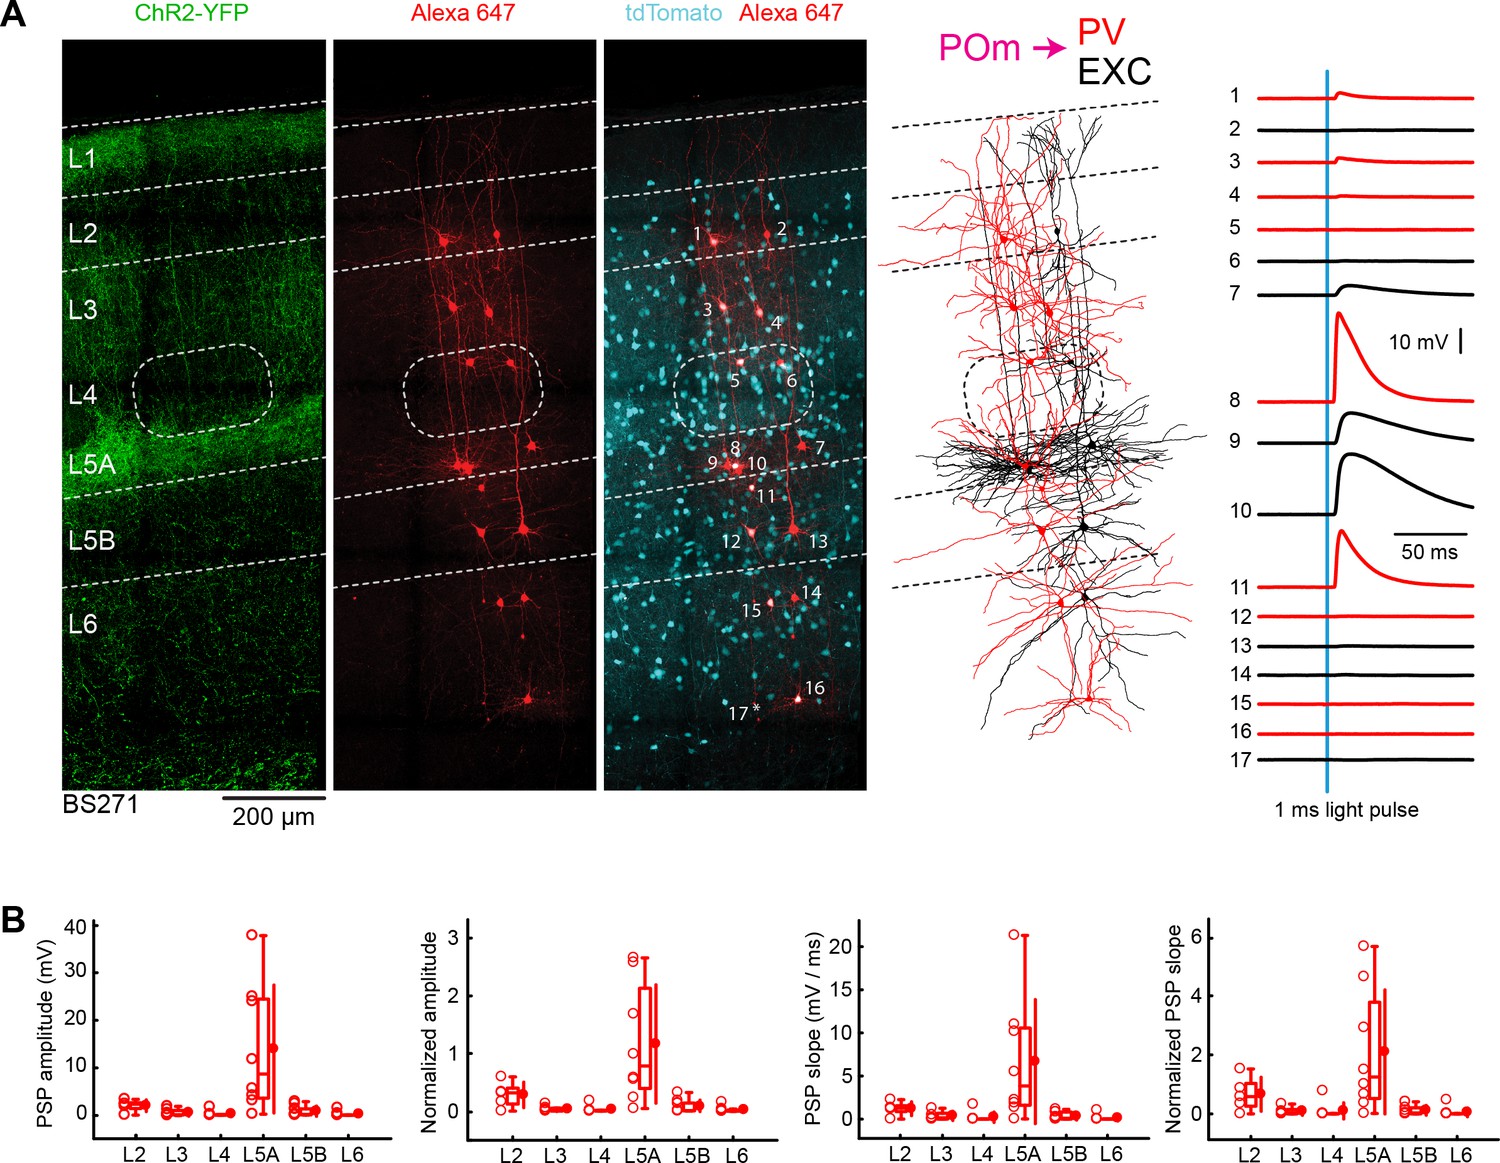
POm input to GABAergic PV neurons across layers in wS1.
(A) An example experiment (BS271) in which ChR2 was expressed in POm and whole-cell recordings were obtained sequentially neurons across different cortical layers in wS1 of PV-Cre mice crossed with LSL-tdTomato reporter mice. In the example experiment recordings were made from 9 PV-expressing inhibitory neurons (red), and eight non-tdTomato-expressing excitatory neurons (black). Neurons were filled with biocytin and post hoc stained with streptavidin conjugated to Alexa 647 to reveal dendritic morphology, which was digitally reconstructed. Neurons #8 (PV L5A), #9 (Exc L5A), #10 (Exc L5A) and #11 (PV L5A) received the four largest mean EPSPs in response to optogenetic stimulation of POm (right). (B) The laminar location was assigned for each recording. The peak amplitude of the evoked EPSP averaged across trials was determined for each cell, and plotted for each layer along with the median (box plot, including interquartile range and whiskers) and the mean (filled circle, along with SD error bars) (left). The EPSP amplitudes from individual slices were normalized to the mean amplitude of the EPSP measured in the L5A EXC neurons of the same slice (center left). The slope of the rising phase of the EPSP was determined and plotted for each cell across layers (center right). The normalized EPSP slope was calculated by dividing by the mean slope of the EPSPs in the L5A EXC neurons recorded in the same slice (right).
-
Figure 5—source data 1
Data values underlying Figure 5.
- https://cdn.elifesciences.org/articles/52665/elife-52665-fig5-data1-v1.xlsx
Figure 6
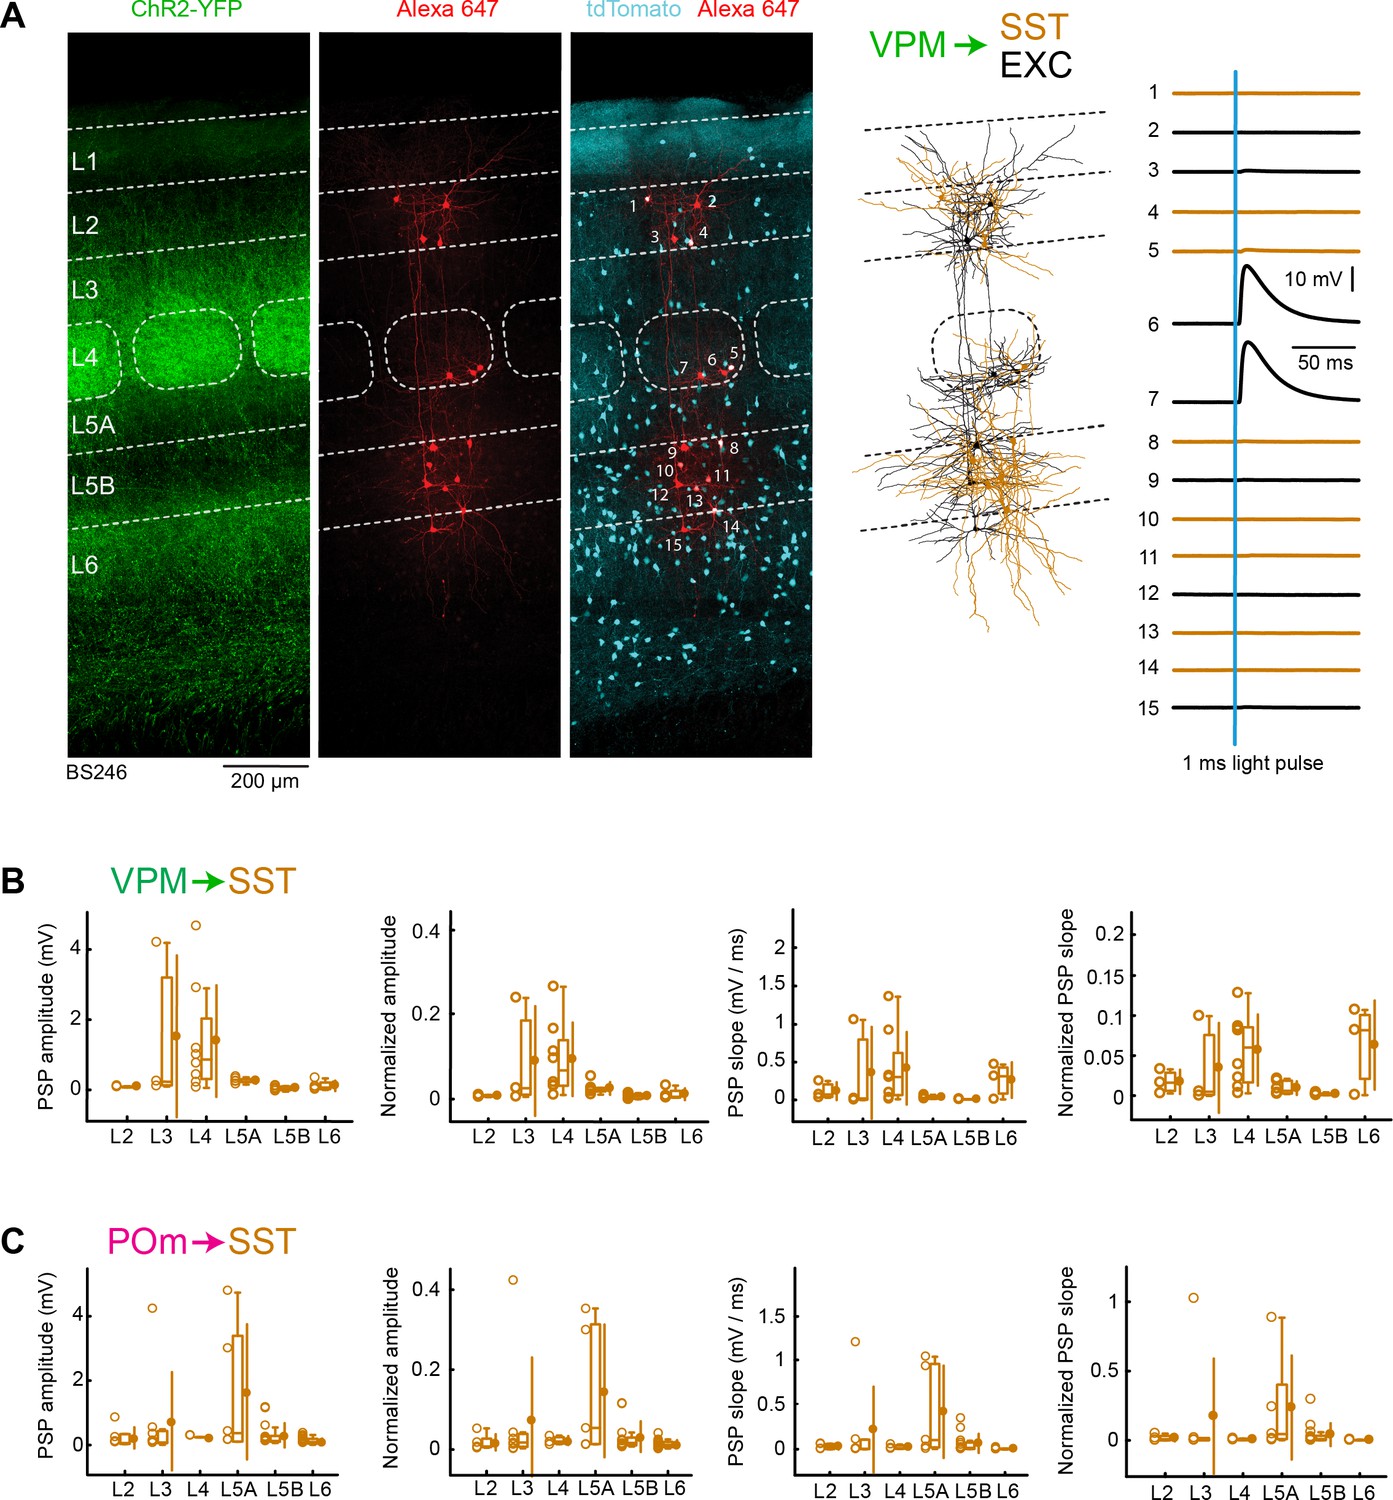
VPM and POm input to GABAergic SST neurons across layers in wS1.
(A) An example experiment (BS246) from a SST-Cre mouse crossed with a LSL-tdTomato reporter mouse, in which ChR2 was expressed in VPM and whole-cell recordings were obtained sequentially from neurons across different cortical layers in wS1. In the example experiment recordings were made from 8 SST-expressing inhibitory neurons (red), and seven non-tdTomato-expressing excitatory neurons (black). Neurons were filled with biocytin and post hoc stained with streptavidin conjugated to Alexa 647 to reveal dendritic morphology, which was digitally reconstructed. Neurons #6 (EXC L4) and #7 (EXC L4) received the largest mean EPSPs in response to optogenetic stimulation of VPM (right). (B) The peak amplitude of the VPM-evoked EPSP averaged across trials was determined for each SST-expressing cell, and plotted for each layer along with the median (box plot, including interquartile range and whiskers) and the mean (filled circle, along with SD error bars) (left). The EPSP amplitudes from individual slices were normalized to the mean amplitude of the EPSP measured in the L4 EXC neurons of the same slice (center left). The slope of the rising phase of the EPSP was determined and plotted for each cell across layers (center right). The normalized EPSP slope was calculated by dividing by the mean slope of the EPSPs in the L4 EXC neurons recorded in the same slice (right). (C) As for panel B, but for POm input and normalization to L5A EXC EPSPs.
-
Figure 6—source data 1
Data values underlying Figure 6.
- https://cdn.elifesciences.org/articles/52665/elife-52665-fig6-data1-v1.xlsx
Figure 7
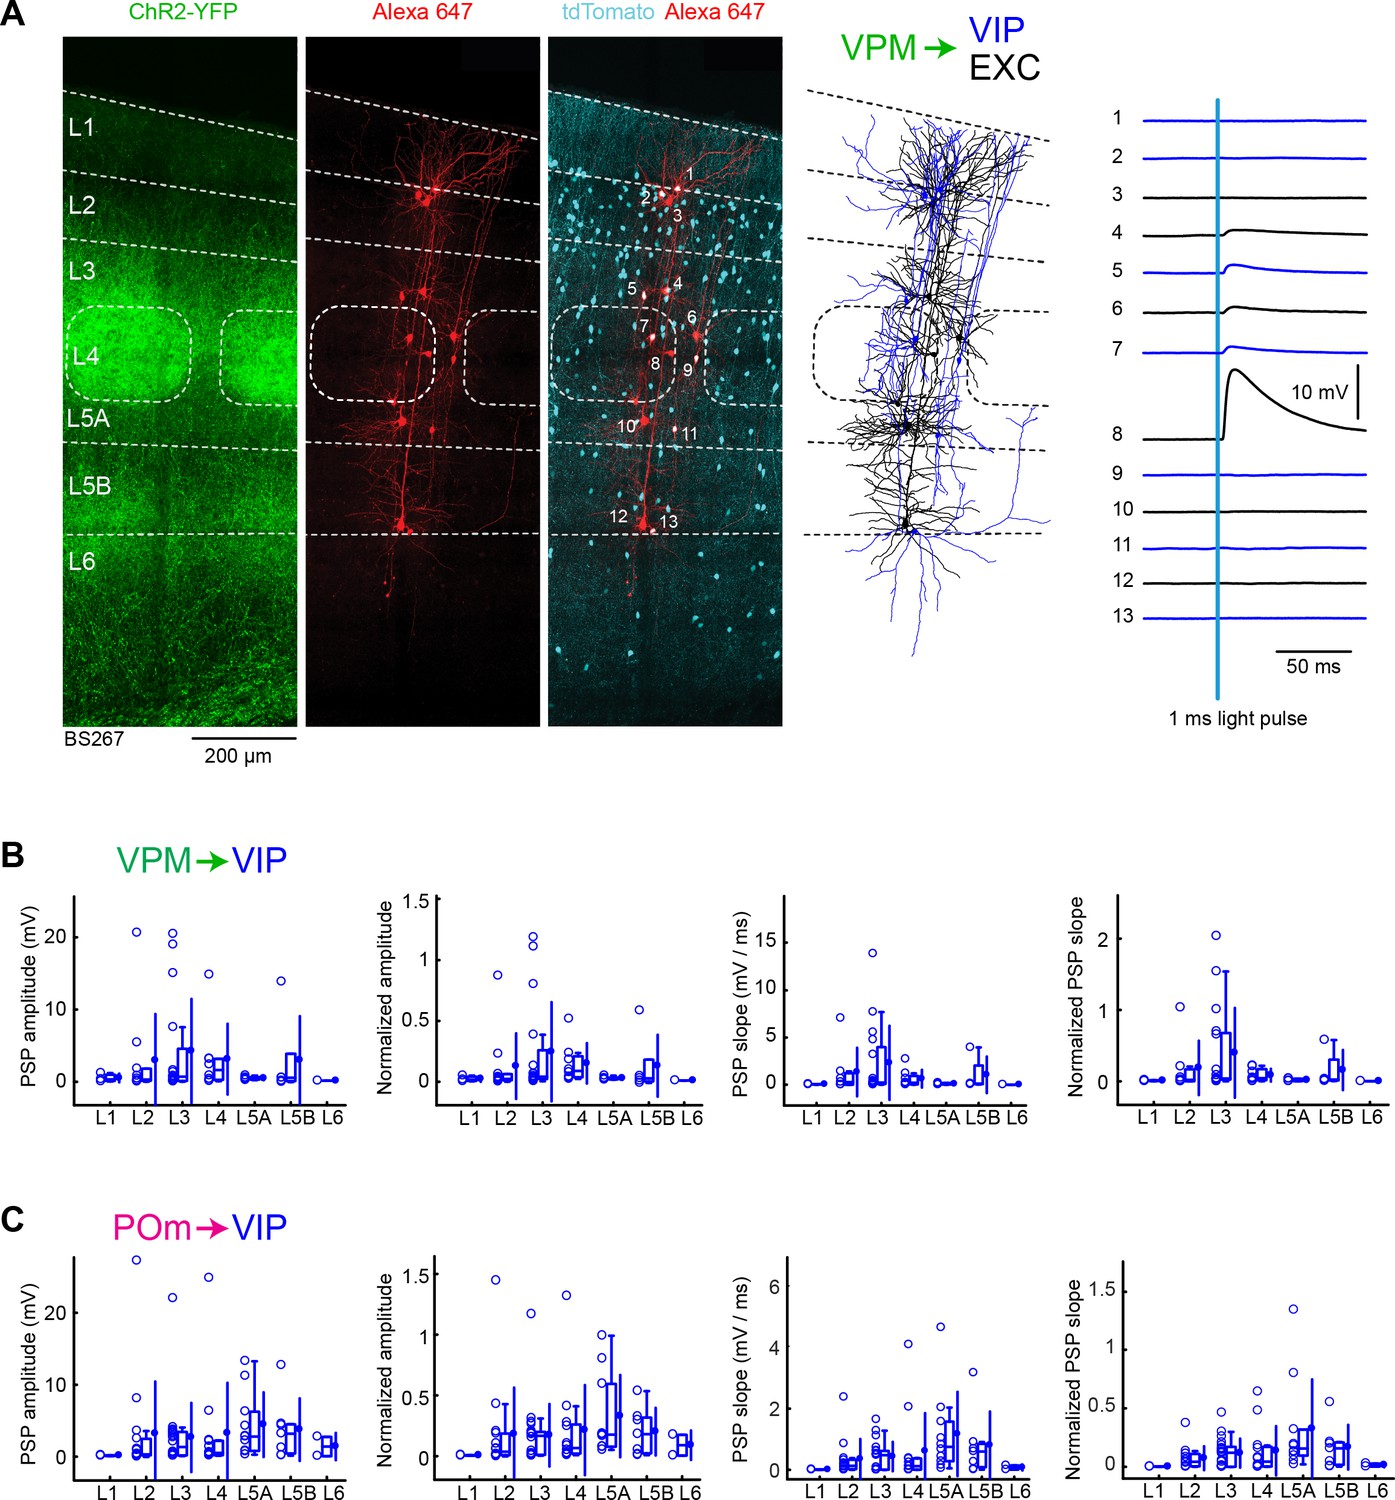
VPM and POm input to GABAergic VIP neurons across layers in wS1.
(A) An example experiment (BS267) in which ChR2 was expressed in VPM of a VIP-Cre mouse crossed with a LSL-tdTomato reporter mouse, and whole-cell recordings were obtained sequentially from neurons across different cortical layers in wS1. In the example experiment recordings were made from 7 VIP expressing inhibitory neurons (red), and six non-tdTomato-expressing excitatory neurons (black). Neurons were filled with biocytin and post hoc stained with streptavidin conjugated to Alexa 647 to reveal dendritic morphology, which was digitally reconstructed. Neuron #8 (Exc L4) received the largest mean EPSP in response to optogenetic stimulation of VPM (right). (B) The peak amplitude of the VPM-evoked EPSP averaged across trials was determined for each VIP-expressing cell, and plotted for each layer along with the median (box plot, including interquartile range and whiskers) and the mean (filled circle, along with SD error bars) (left). The EPSP amplitudes from individual slices were normalized to the mean amplitude of the EPSP measured in the L4 EXC neurons of the same slice (center left). The slope of the rising phase of the EPSP was determined and plotted for each cell across layers (center right). The normalized EPSP slope was calculated by dividing by the mean slope of the EPSPs in the L4 EXC neurons recorded in the same slice (right). (C) As for panel B, but for POm input and normalization to L5A EXC neurons.
-
Figure 7—source data 1
Data values underlying Figure 7.
- https://cdn.elifesciences.org/articles/52665/elife-52665-fig7-data1-v1.xlsx
Figure 8
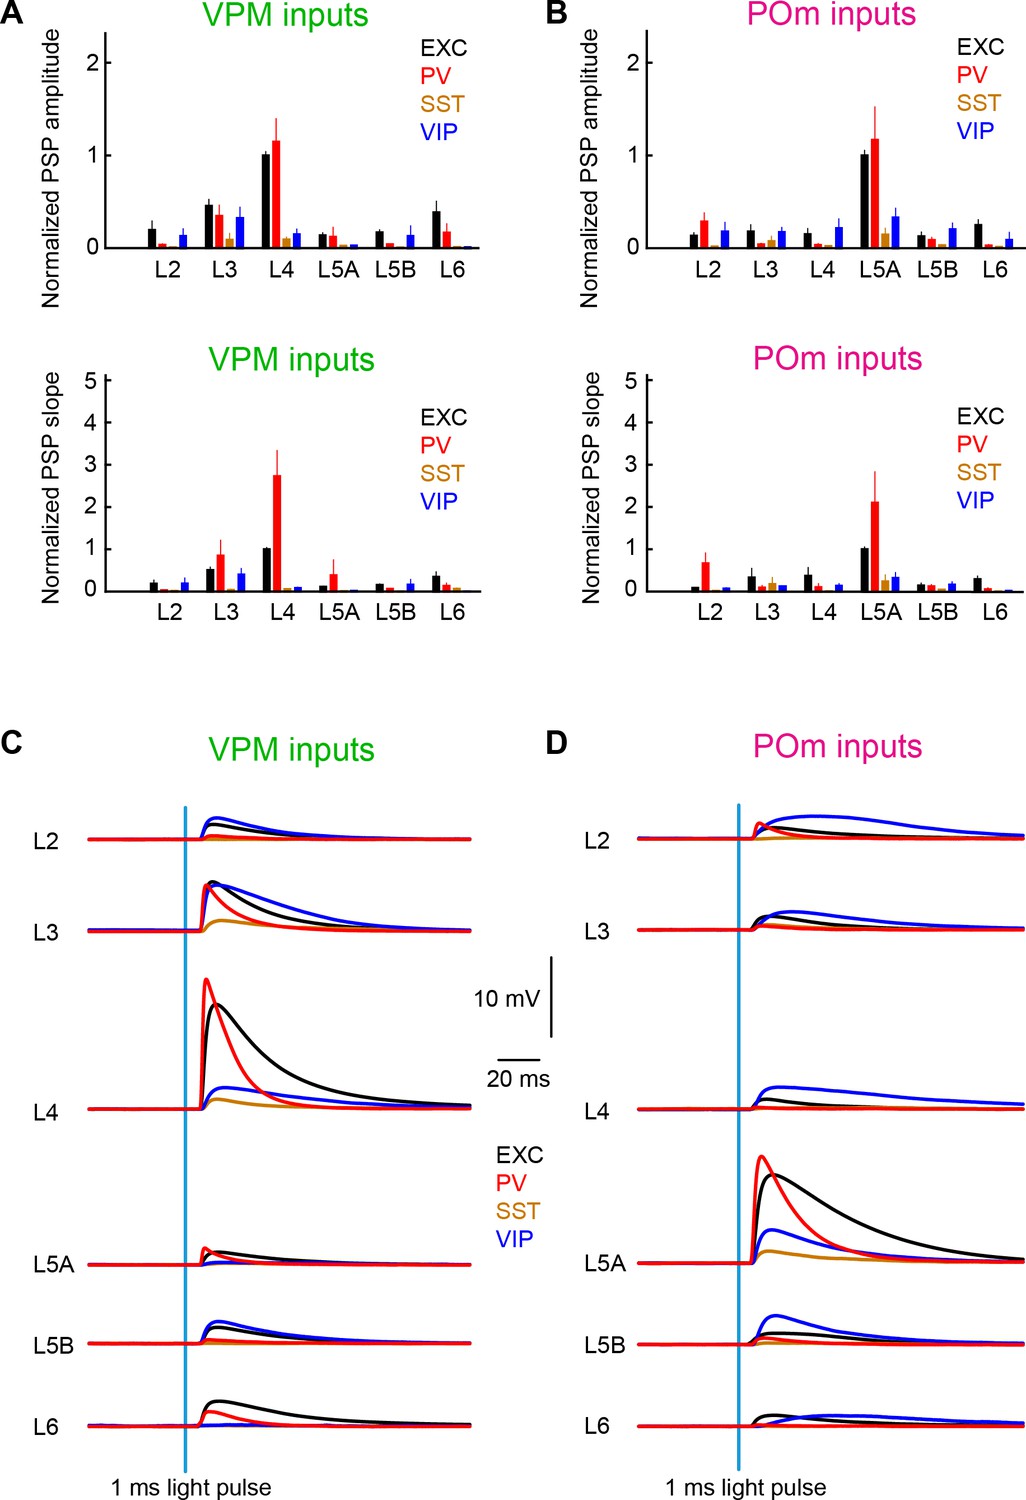
Summary of layer-specific inputs from VPM and POm to distinct cell-types in wS1.
(A) The mean ± SEM of EPSP amplitudes across layers (normalized to L4 EXC) for excitatory neurons (black), PV neurons (red), SST neurons (brown) and VIP neurons (blue) (above). The equivalent plot for the EPSP slope is shown below. (B) As for panel A, but for POm inputs normalized to L5A EXC. (C) The mean time-course of EPSPs evoked by the 1 ms blue light pulse in excitatory neurons (black), PV neurons (red), SST neurons (brown) and VIP neurons (blue) separately averaged across layers. (D) As for panel C, but for POm inputs.
Tables
Table 1
Normalized EPSP amplitudes of VPM input including: mean ± SD, median, and n = number of recorded cells.
| VPM amplitude | EXC | PV | SST | VIP |
|---|---|---|---|---|
| L2 | 0.20 ± 0.54 0.022 n = 29 | 0.04 ± 0.02 0.032 n = 3 | 0.01 ± 0.00 0.0082 n = 3 | 0.13 ± 0.26 0.024 n = 10 |
| L3 | 0.46 ± 0.50 0.26 n = 45 | 0.35 ± 0.34 0.19 n = 9 | 0.09 ± 0.10 0.025 n = 3 | 0.32 ± 0.49 0.046 n = 17 |
| L4 | 1.00 ± 0.37 1.00 n = 65 | 1.15 ± 0.92 1.05 n = 14 | 0.09 ± 0.08 0.067 n = 8 | 0.15 ± 0.16 0.089 n = 8 |
| L5A | 0.14 ± 0.21 0.063 n = 39 | 0.12 ± 0.22 0.016 n = 5 | 0.03 ± 0.01 0.021 n = 6 | 0.03 ± 0.01 0.029 n = 5 |
| L5B | 0.17 ± 0.22 0.080 n = 44 | 0.04 ± 0.02 0.045 n = 11 | 0.01 ± 0.01 0.0073 n = 9 | 0.13 ± 0.23 0.028 n = 5 |
| L6 | 0.39 ± 0.79 0.077 n = 40 | 0.17 ± 0.20 0.033 n = 5 | 0.01 ± 0.01 0.0060 n = 4 | 0.011 n = 1 |
Table 2
Normalized EPSP slopes of VPM input including: mean ± SD, median, and n = number of recorded cells.
| VPM slope | EXC | PV | SST | VIP |
|---|---|---|---|---|
| L2 | 0.19 ± 0.50 0.018 n = 29 | 0.03 ± 0.03 0.021 n = 3 | 0.02 ± 0.01 0.016 n = 3 | 0.19 ± 0.35 0.021 n = 7 |
| L3 | 0.51 ± 0.54 0.33 n = 45 | 0.85 ± 1.07 0.38 n = 9 | 0.03 ± 0.05 0.0049 n = 3 | 0.40 ± 0.61 0.038 n = 16 |
| L4 | 1.00 ± 0.43 1.00 n = 65 | 2.73 ± 2.24 1.68 n = 14 | 0.06 ± 0.04 0.060 n = 8 | 0.09 ± 0.08 0.044 n = 8 |
| L5A | 0.11 ± 0.16 0.043 n = 39 | 0.38 ± 0.76 0.0079 n = 5 | 0.01 ± 0.01 0.0061 n = 6 | 0.02 ± 0.02 0.0057 n = 5 |
| L5B | 0.16 ± 0.23 0.060 n = 43 | 0.06 ± 0.04 0.077 n = 11 | 0.00 ± 0.00 0.0016 n = 6 | 0.16 ± 0.24 0.024 n = 4 |
| L6 | 0.35 ± 0.81 0.037 n = 39 | 0.13 ± 0.16 0.015 n = 5 | 0.06 ± 0.05 0.082 n = 3 | 0.00072 n = 1 |
Table 3
Normalized EPSP amplitudes of POm input including: mean ± SD, median, and n = number of recorded cells.
| POm amplitude | EXC | PV | SST | VIP |
|---|---|---|---|---|
| L2 | 0.11 ± 0.18 0.032 n = 38 | 0.17 ± 0.13 0.17 n = 3 | 0.02 ± 0.02 0.0066 n = 5 | 0.18 ± 0.37 0.036 n = 14 |
| L3 | 0.16 ± 0.39 0.048 n = 31 | 0.04 ± 0.04 0.030 n = 7 | 0.07 ± 0.16 0.016 n = 7 | 0.17 ± 0.25 0.17 n = 20 |
| L4 | 0.13 ± 0.35 0.011 n = 38 | 0.03 ± 0.06 0.013 n = 8 | 0.02 ± 0.01 0.034 n = 3 | 0.21 ± 0.35 0.067 n = 12 |
| L5A | 1.00 ± 0.52 1.00 n = 75 | 1.17 ± 0.96 0.79 n = 8 | 0.15 ± 0.15 0.053 n = 5 | 0.33 ± 0.32 0.18 n = 10 |
| L5B | 0.11 ± 0.31 0.026 n = 52 | 0.09 ± 0.10 0.015 n = 10 | 0.03 ± 0.04 0.015 n = 13 | 0.20 ± 0.18 0.18 n = 7 |
| L6 | 0.23 ± 0.38 0.068 n = 47 | 0.03 ± 0.05 0.010 n = 10 | 0.01 ± 0.01 0.010 n = 18 | 0.090 n = 2 |
Table 4
Normalized EPSP slopes of POm input including: mean ± SD, median, and n = number of recorded cells.
| POm slope | EXC | PV | SST | VIP |
|---|---|---|---|---|
| L2 | 0.08 ± 0.13 0.014 n = 38 | 0.31 ± 0.24 0.35 n = 3 | 0.02 ± 0.02 0.0080 n = 4 | 0.07 ± 0.10 0.043 n = 13 |
| L3 | 0.30 ± 1.13 0.020 n = 31 | 0.09 ± 0.13 0.041 n = 5 | 0.17 ± 0.41 0.0024 n = 6 | 0.12 ± 0.12 0.12 n = 20 |
| L4 | 0.32 ± 1.05 0.0045 n = 35 | 0.10 ± 0.26 0.0040 n = 8 | 0.01 ± 0.01 0.014 n = 3 | 0.14 ± 0.20 0.045 n = 12 |
| L5A | 1.00 ± 0.56 1.00 n = 75 | 2.10 ± 1.96 1.25 n = 8 | 0.24 ± 0.34 0.045 n = 5 | 0.33 ± 0.40 0.16 n = 10 |
| L5B | 0.13 ± 0.40 0.014 n = 50 | 0.12 ± 0.16 0.029 n = 10 | 0.04 ± 0.08 0.0090 n = 13 | 0.17 ± 0.18 0.16 n = 7 |
| L6 | 0.29 ± 0.53 0.050 n = 44 | 0.05 ± 0.14 0.0040 n = 10 | 0.00 ± 0.00 0.00093 n = 14 | 0.015 n = 2 |
Key resources table
| Reagent type (species) or resource | Designation | Source or reference | Identifiers | Additional information |
|---|---|---|---|---|
| Strain, strain background (Mus musculus) | Short: Wild type C57BL/6J | Jackson Laboratory | JAX:000664 | |
| Genetic reagent (Mus musculus) | Short: GPR26-Cre Tg(Gpr26-cre) KO250Gsat/Mmucd | MMRRC | RRID: MMRRC_033032-UCD | (Gerfen et al., 2013) |
| Genetic reagent (Mus musculus) | Short: PV-Cre B6;129P2-Pvalbtm1(cre)Arbr/J | Jackson Laboratory | JAX:008069 | (Hippenmeyer et al., 2005) |
| Genetic reagent (Mus musculus) | Short: Sst-Cre Ssttm2.1(cre)Zjh/J | Jackson Laboratory | JAX:013044 | (Taniguchi et al., 2011) |
| Genetic reagent (Mus musculus) | Short: VIP-Cre Viptm1(cre)Zjh/J | Jackson Laboratory | JAX:010908 | (Taniguchi et al., 2011) |
| Genetic reagent (Mus musculus) | Short: Gad2-Cre Gad2tm2(cre)Zjh/J | Jackson Laboratory | JAX:010802 | (Taniguchi et al., 2011) |
| Genetic reagent (Mus musculus) | Short: LSL-tdTomato B6.Cg-Gt(ROSA)26Sortm9(CAG-tdTomato)Hze/J | Jackson Laboratory | JAX:007909 | (Madisen et al., 2010) |
| Recombinant DNA reagent | AAV-FLEX-tdTomato | Addgene | Addgene #28306 | |
| Recombinant DNA reagent | AAV-hSyn-ChR2-YFP | U. Penn | Addgene #26973 | |
| Recombinant DNA reagent | AAV-DIO-ChR2-YFP | U. Penn | Addgene #20298 | |
| Recombinant DNA reagent | AAV-DFO-ChR2-YFP | This paper | Addgene #136916 | See Materials and methods Available from Addgene |
| Software, algorithm | Matlab analysis code and data | This paper | Zenodo doi: 10.5281/zenodo.3560697 | See Materials and methods Available from https://zenodo.org/ |
Additional files
Download links
A two-part list of links to download the article, or parts of the article, in various formats.
Downloads (link to download the article as PDF)
Open citations (links to open the citations from this article in various online reference manager services)
Cite this article (links to download the citations from this article in formats compatible with various reference manager tools)
Pathway-, layer- and cell-type-specific thalamic input to mouse barrel cortex
eLife 8:e52665.
https://doi.org/10.7554/eLife.52665


