Genetic transformation of Spizellomyces punctatus, a resource for studying chytrid biology and evolutionary cell biology
- University of Program in Genetics and Genomics, Duke University, United States
- Department of Molecular Genetics and Microbiology, Duke University, United States
- Department of Biology, University of Massachusetts, United States
- Department of Molecular Biomedical Sciences, North Carolina State University, United States
Figures
Figure 1
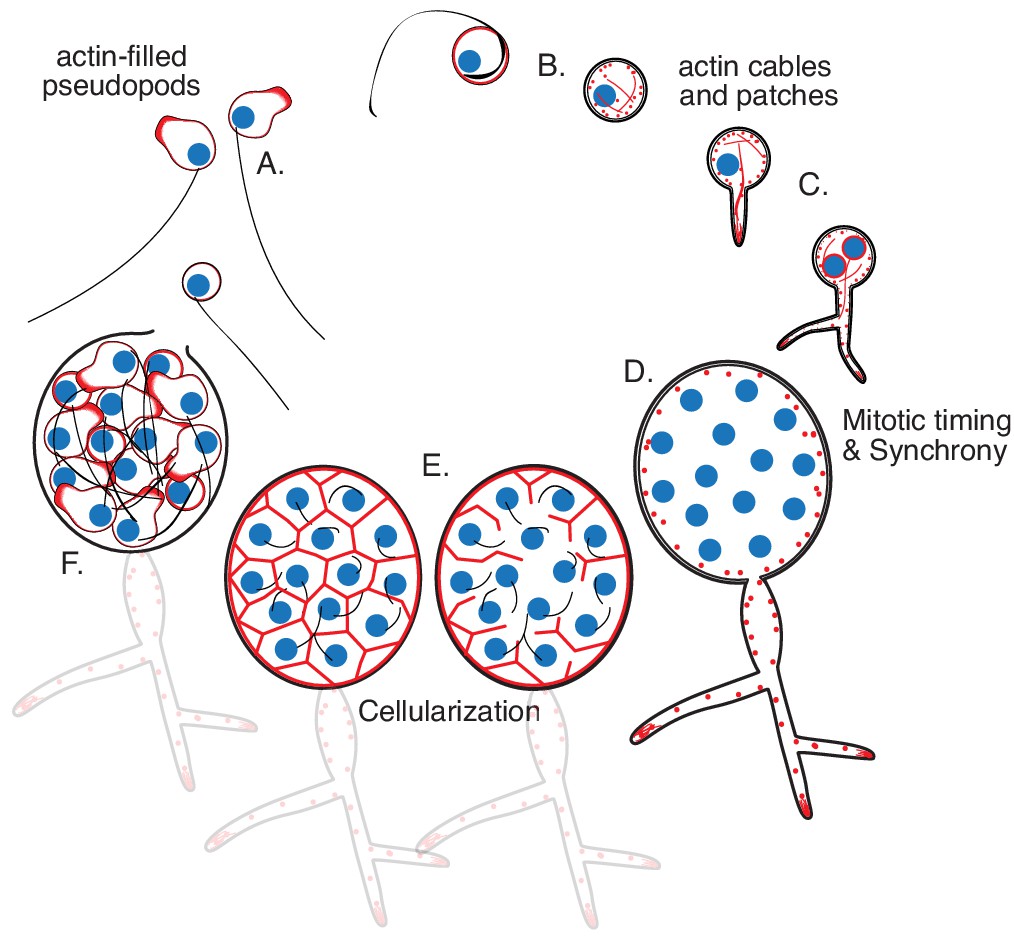
Life cycle of the chytrid Spizellomyces punctatus.
Timeline and events as measured in this work. The chytrid produces globular zoospores (3–5 µm) that swim with a motile cilium (20–24 µm). (A) The uninucleate zoospore (nucleus in blue) has a cilium associated with a basal body. Swimming zoospores can also crawl on surfaces using amoeboid-like motion (polymerized actin in red). (B) The start of encystment (before 1 hr) occurs when the cilium retracts by a lash-around mechanism, followed by formation of cell wall (Koch, 1968). (C) The cyst then germinates and forms a single germ tube (at 1–3 hr) that later expands and branches into a rhizoidal system. The nucleus remains in the cyst during germ tube expansion as the cyst develops into a single reproductive structure called the sporangium. The first mitotic event (at 8–12 hr) usually correlates with the ramification of rhizoids from the germ tube. (D) Mitosis in the sporangium is coordinated with growth, as nuclei replicate and divide in a shared compartment. There can be a total of five to eight synchronous mitotic cycles as each sporangium develops a branched rhizoid system with subsporangial swelling in the main rhizoid. (E) Mitosis halts and zoospore formation begins in the sporangium. Ciliogenesis likely occurs before cellularization as in other chytrids (Renaud and Swift, 1964). (F) The nuclei cellularize and develop into zoospores while the sporangium develops discharge papillae. Once cellularization is complete and environmental conditions are favorable, the zoospores will escape the sporangium through the discharge papillae (at 20–30 hr). Diagram not drawn to scale. Times are relative to the start of microscopy after zoospore harvest.
Figure 2 with 6 supplements

Genomic integration of H2B-tdTomato using Agrobacterium-mediated transformation.
(A) Plasmid GI3EM20C takes advantage of the divergent architecture of H2A/H2B to express an H2B-tdTomato fusion in an upstream direction (H2B promoter) while expressing hph in a downstream direction (H2A promoter). (B) Representative images from wild type (left), and transformants expressing cytoplasmic hph-tdTomato (plasmid GI3EM18) (center) and nuclear-localized H2B-tdTomato (right). Top row shows DIC and the middle row shows fluorescence microscopy at 561 nm with overlaid images on the bottom row. For comparable results, all strains are presented at the same intensity levels used for H2B-tdTomato fluorescence image. Scale bar indicates ten microns. Image acquisition conditions: POL: transmittance 32%, exposure 0.15 s; TRITC filter, maximal projection, transmittance 32%, Exposure 0.2 s, 0.3 micrometers slice thickness. (C) Southern blot of four transformants, in which genomic DNA was digested either with XbaI or KpnI and probed using the Hygromycin resistance gene (hph). We used plasmid GI3EM20C as a positive control (+). (D) Four independent transformants were transferred, every two days, in both selective and non-selective medium at 30°C for a total of 27 days (minimum of 23 life cycles or 116–185 mitotic cycles), followed by a challenge on selective medium. These strains were spotted in a twofold dilution series on non-selective and selective (+Hygromycin) plates, and incubated for 2 days at 30°C.
Figure 2—figure supplement 1

Spizellomyces promoters successfully express fluorescent protein and drug-resistance genes.
(A) Fluorescence distribution of yeast strains transformed with plasmids pGI3EM09 (Hsp70pr-hph-GFP) and pGI3EM11 (H2Bpr-hph-GFP) relative to untransformed wild-type (WT). Flow cytometry data were collected on a MacsQuant VYB with a 488 nm excitation laser and FITC emission filter (525/50 nm). Data were collected from two independent transformants. The large width of the fluorescence distribution arises from copy number fluctuations of the 2µ plasmid in Saccharomyces cerevisiae. (B) Typical time scale and transformation efficiency using Agrobacterium-mediated transformation of Spizellomyces. Data is shown for pGI3EM11 (H2Bpr-hph-GFP) and pGI3EM18 (H2Bpr-hph-tdTomato) in the absence and presence of selection (200 mg/L Hygromycin). Ampicillin and tetracycline (50 mg/L) are included to kill any Agrobacterium transferred from the co-culture plate; see Materials and methods. Small red arrows indicate three examples of tiny colonies that appeared on pGI3EM11 plate on Day 4. Photos are shown with inverted contrast to better highlight colonies.
Figure 2—figure supplement 2
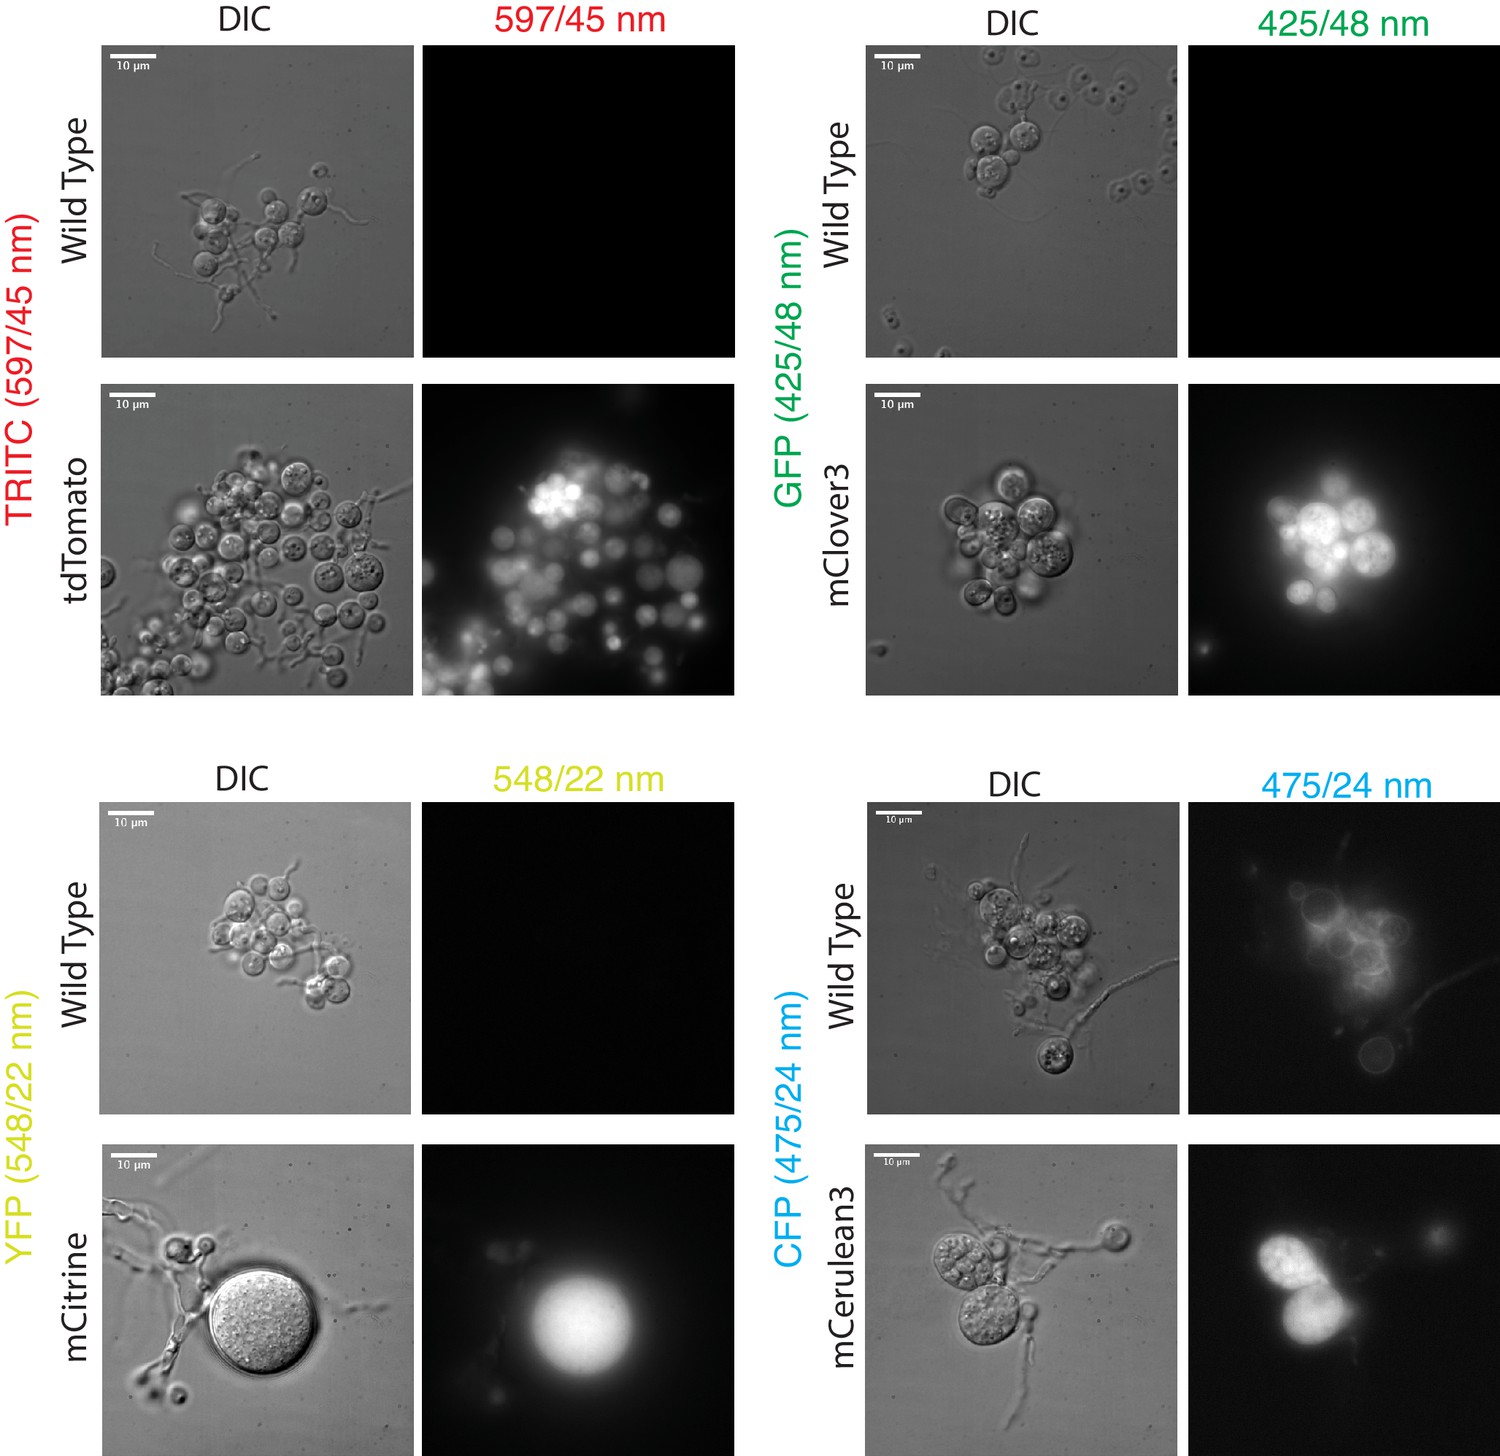
Diverse fluorescent proteins are functional in Spizellomyces punctatus.
DIC and fluorescence images were taken with a Deltavision Elite microscope using POL Transmission 32%, exposure time 0.5 s; Filter Transmission 32%, exposure time 0.3 s. TRITC filter set excitation (542/27 nm) and emission (597/45 nm); GFP filter set excitation (475/28 nm) and emission (525/48 nm); YFP filter set excitation (513/17 nm) and emission (548/22 nm); CFP filter set excitation (438/24 nm) and emission (475/24 nm). Paired wild-type and fluorescent protein strains are plotted with the same intensity range.
Figure 2—figure supplement 3
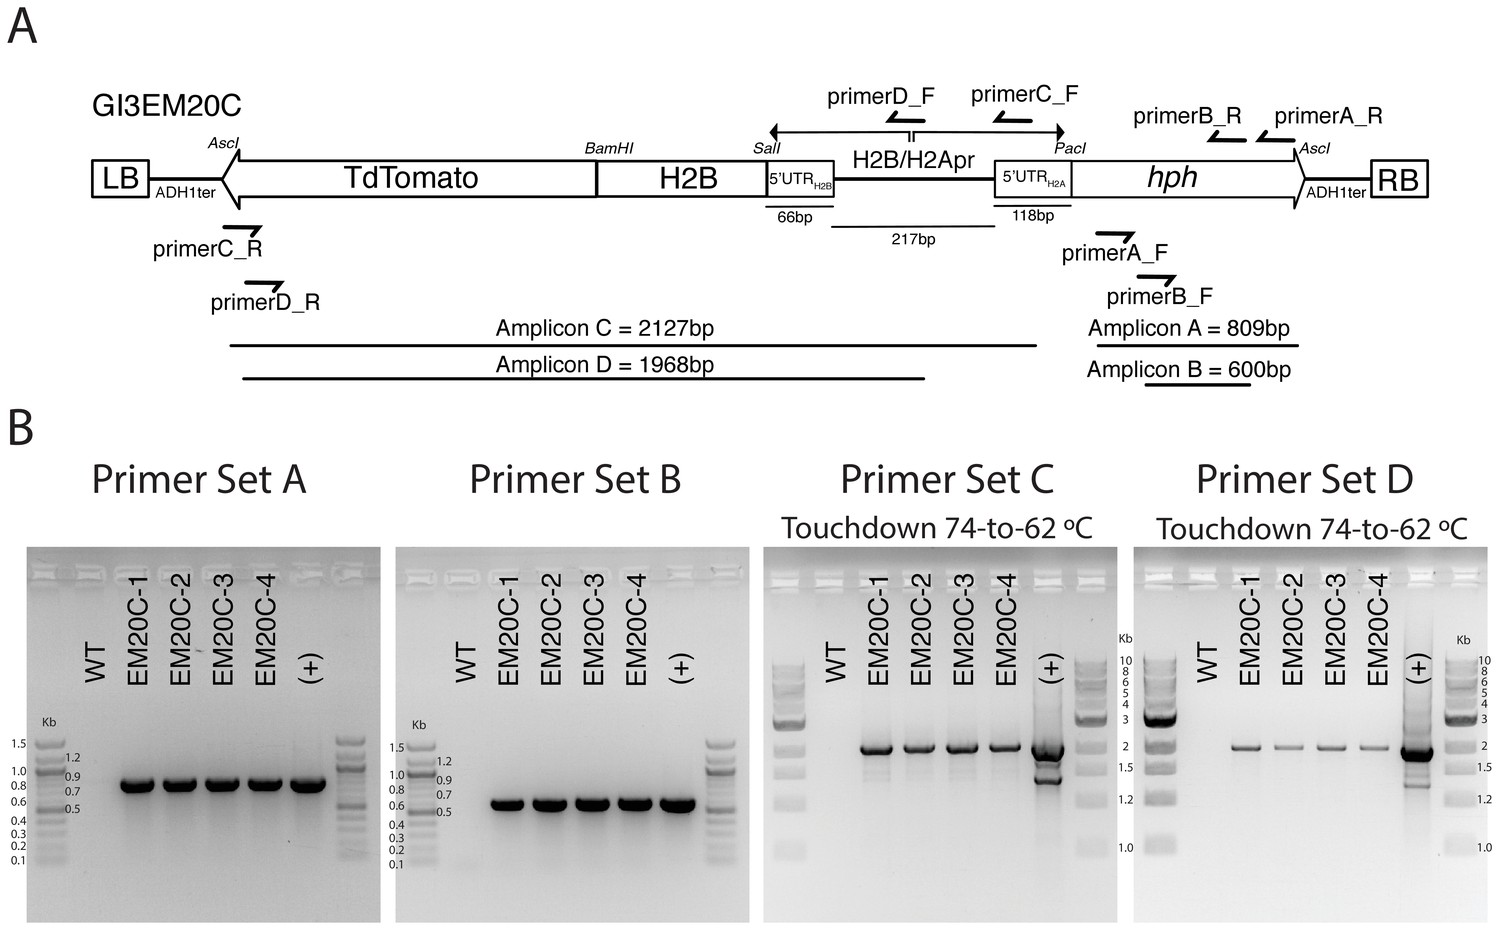
PCR validation of H2B-tdTomato transformants.
(A) Primer locations and amplicon sizes of different pGI3EM20C primer pairs. RB and LB correspond to the ‘right border’ and ‘left border’ of the T-DNA plasmid. These sequences define the T-DNA fragment that is excised and transferred into the host cell by the Agrobacterium virulence machinery. The total size of the T-DNA (LB to RB) is 4280 bp. (B) Gel electrophoresis of different PCR reactions using genomic DNA of untransformed (WT) and four independent Spizellomyces transformants. (+) control used pGI3EM20C plasmid DNA as template.
Figure 2—figure supplement 4
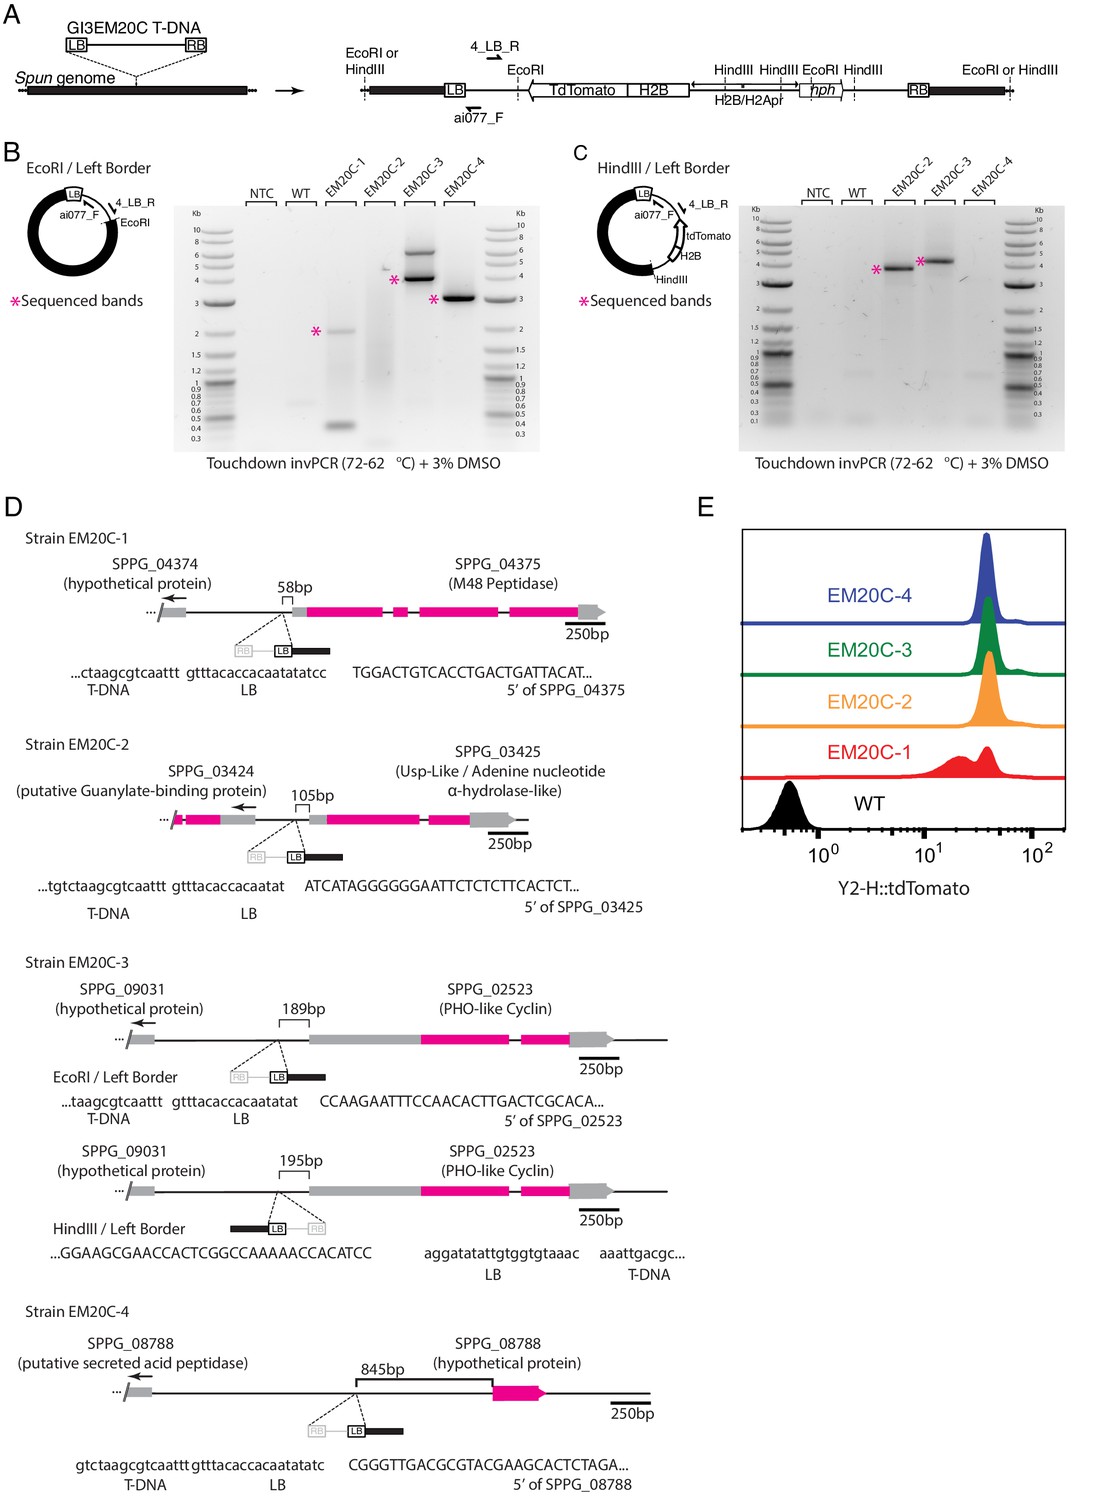
Mapping T-DNA genomic insertion sites with inverse PCR.
(A) Diagram of T-DNA integration and the location of PCR/sequencing primers and restriction sites used for inverse PCR (invPCR). We only show primers adjacent to the left border (LB) because they consistently amplified for all transformants, unlike the primers adjacent to the right border. (B) Example of amplification by invPCR of the LB-genome border after EcoRI genomic digestion and ligation for an untransformed strain (WT), four independent transformants and non-template control. (C) Amplification by invPCR of the LB-genome border after HindIII genomic digestion and ligation. T-DNA location for all transformants was confirmed by two independent biological replicates (i.e. independent genomic extractions, ligation and invPCR). (D) T-DNA insertion sites in four independent transformants of Spizellomyces. In strain EM20C-3, invPCR for EcoRI indicated LB is located toward SPPG_02523, while invPCR for HindIII shows same insertion site but with an inverted direction. The divergent invPCR results might represent an insertion of a tandem inverted T-DNA. (E) Three of the four strains (EM20C-2,3,4) have similar tdTomato fluorescence levels as determined by flow cytometry.
Figure 2—figure supplement 5
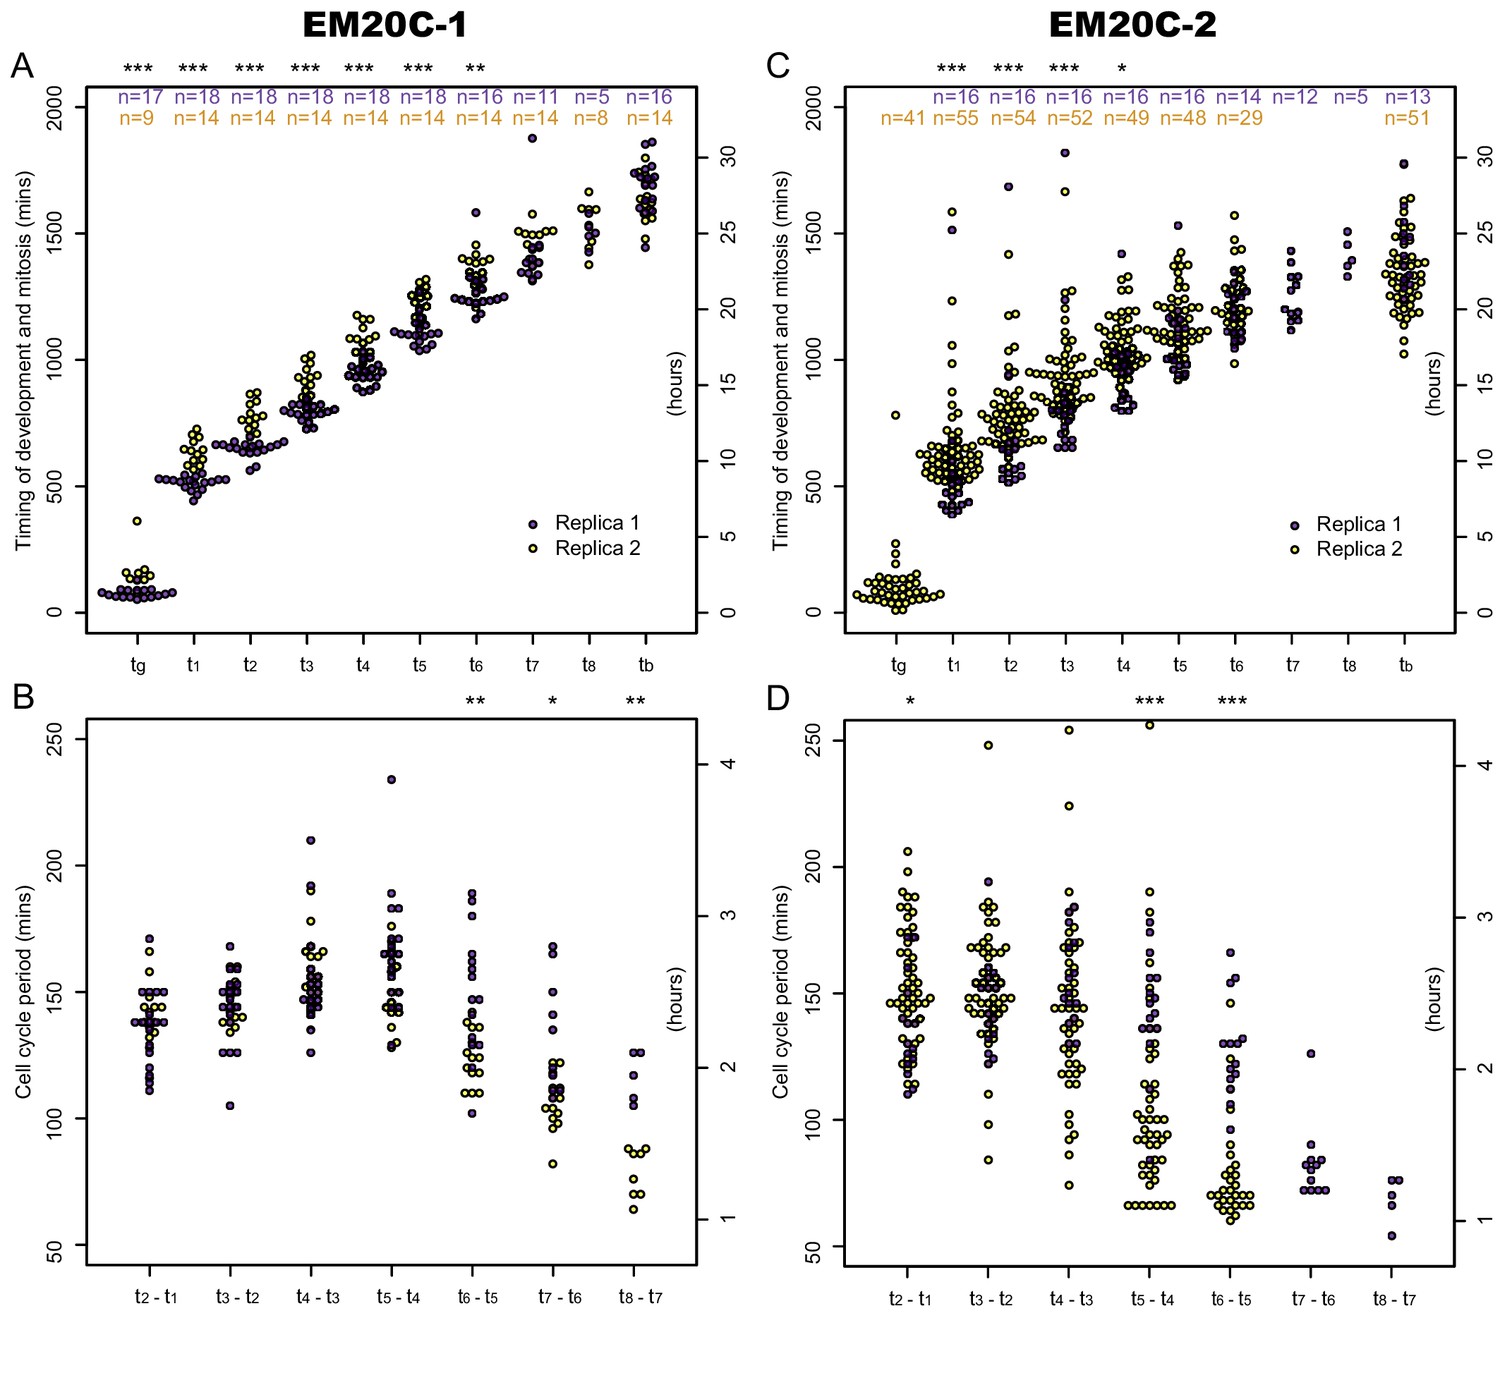
Comparison of development and cell cycle timing between EM20C-1 and EM20C-2.
Timing of germ tube emergence (), mitosis (), and bursting of the sporangium () (i.e. zoospore release) was determined through brightfield and fluorescence microscopy. Cell cycle period is the interval of time between mitotic events ( - ). (A) Timing of mitotic events and B) Cell cycle period in transformant EM20C-1. (C) Timing of mitotic events and D) Cell cycle period in transformant EM20C-2. Two biological replicates (yellow and purple) per transformant. Number of measured events per replicate are shown in the top panels. For a given strain, the variability between replicates is mostly due to a 1–2 hr shift in germ tube formation and early mitotic events. Both EM20C-1 and EM20C-2 form germ tubes at 1–3 hr, the first mitosis occurs between 8 and 12 hr, the cell cycle periods are ∼150 min before shortening in late development. EM20C-2 tends to have a shorter developmental cycle than EM20C-1 (bursting at 20–25 hr versus 25–30 hr) through a combination of shorter cell cycle periods in late development and fewer cycles before bursting. Not all germ tubes were visible and some sporangia had fewer mitotic cycles before bursting; thus, , , , have smaller sample sizes. Asterix above each plot reflects the p-value of a two-sample Kolmogorov-Smirnov test of equality of distributions between replicates (*, p<0.05; **, p<0.01; ***, p<0.001).
-
Figure 2—figure supplement 5—source data 1
Development and cell cycle timing data for EM20C-1 and EM20C-2 used to create Figure 2—figure supplement 5.
- https://cdn.elifesciences.org/articles/52741/elife-52741-fig2-figsupp5-data1-v1.xlsx
Figure 2—video 1
Time-lapse microscopy in developing H2B-tdTomato sporangia taken over the course of 32 hr with images captured every 2 min.
The left panel shows DIC microscopy, while right panel shows 561 nm fluorescence microscopy of EM20C-1. Time-stamp is hr:min. Scale bar indicates ten microns.
Figure 3 with 1 supplement

H2B-tdTomato reveals the timing and synchrony of mitotic events during sporangiogenesis.
(A) Number of nuclei as a function of time during the development of a sporangium, along with H2B-tdTomato fluorescence images from select time points. Each colored line corresponds to a different sporangium. The cell cycle period () is the interval of time between waves of nuclear division (i.e. metaphase to anaphase transition). The wave time () is the interval of time for a synchronous wave of nuclear division to sweep across the sporangium. (B) Distribution of cell cycle period (), wave time () and duration of mitosis () across multiple cell cycles. (C) Timing of mitotic events. H2B-tdTomato permits observation of (1) leakage from the nucleus likely due to fenestration of nuclear envelope by the mitotic spindle (Heath, 1980; Fuller, 1976), followed by chromosome condensation, and (2) chromosome separation during anaphase. Dotted line highlights the cell wall of the sporangium. This particular example shows a mitosis duration of 4 min (=time from nuclear leakage to anaphase). Time in hr:min. Scale 2.5 micrometers. Distributions are from one time-lapse movie of EM20C-1 (6 cells).
-
Figure 3—source data 1
Number of nuclei per cell as a function of time (min).
- https://cdn.elifesciences.org/articles/52741/elife-52741-fig3-data1-v1.xlsx
Figure 3—video 1
Time-lapse microscopy of nuclear divisions in developing H2B-tdTomato sporangia taken over the course of 24 hr with images captured every 1 min.
Time-stamp is hr:min. Scale bar indicates five microns.
Figure 4 with 1 supplement
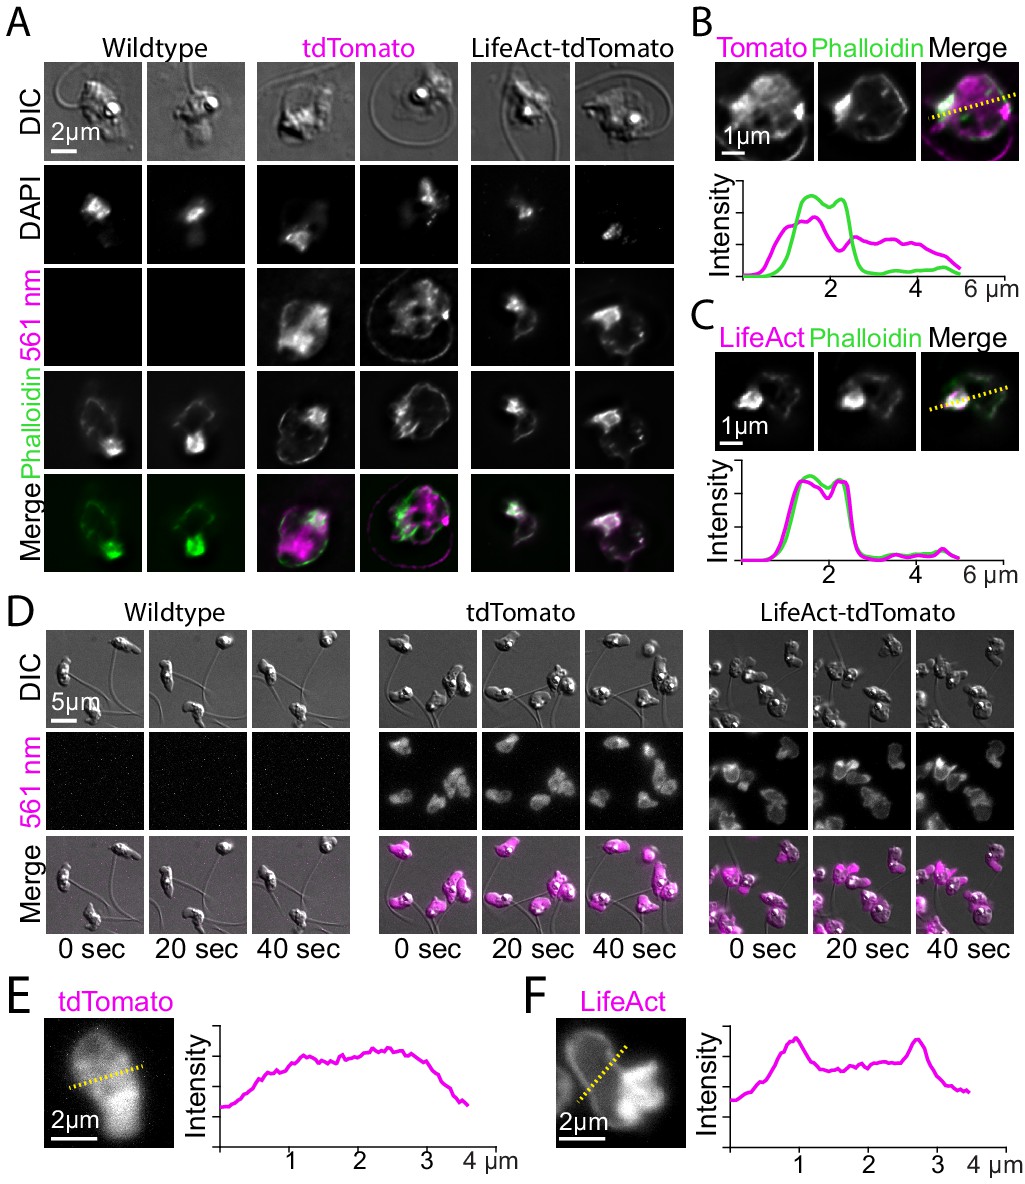
Localization of LifeAct-tdTomato in zoospores highlights cortical and pseudopod actin networks.
(A) Zoospores from wild type (left), and transformants expressing hph-tdTomato (center) and LifeAct-tdTomato (right) were fixed and stained with fluorescent phalloidin (green). Top row shows DIC and second row shows DNA stain (DAPI). The bottom row shows the phalloidin stain and 561 nm images overlaid. Scale bar indicates two microns. (B and C) Line scan of fixed and stained hph-tdTomato (B) and LifeAct-tdTomato fusion (C). The plot shows line scans of normalized fluorescence intensity of the respective fusion protein (magenta) and fluorescent phalloidin (green). The location for generating the line scans is shown by a yellow dotted line in the image above each plot. Scale bars indicate 1 µm. (D) Stills taken at 20-s intervals from timelapse microscopy of crawling zoospores from the indicated strains at the given timepoints. Images were taken using DIC microscopy (top) and 561 nm fluorescence microscopy (middle), also shown with images merged (bottom). Scale bar indicates 5 µm. E+F) Line scan of fixed and stained hph-tdTomato (E) and LifeAct-tdTomato fusion (F). The plot shows line scans of normalized fluorescence intensity of the respective fusion protein (magenta) and fluorescent phalloidin (green). The location for generating the line scans is shown by a yellow dotted line in the image above each plot. Scale bars indicate 2 µm.
Figure 4—video 1
Time-lapse microscopy of crawling wild type, cytoplasmic tdTomato and LifeAct-tdTomato zoospores taken over the course of 2 min with images captured every second, playback in real time.
The left panel shows DIC microscopy, the center panel shows 561 nm fluorescence microscopy, and the right panel shows a merge of fluorescence and DIC microscopy. Time stamp is min:s. Scale bar indicates 10 µm.
Figure 5 with 1 supplement

Localization of LifeAct-tdTomato in sporangia highlights actin patches, cables, and perinuclear shells.
(A) Sporangia from wild type (left), and transformants expressing hph-tdTomato (center) and LifeAct-tdTomato (right) were fixed and stained with fluorescent phalloidin (green). The third row shows DNA stain (DAPI). The bottom row shows the phalloidin stain and 561 nm images overlaid. Scale bar indicates 5 µm. Arrows point to examples of actin patches present in sporangia and rhizoids (‘p’), cables (‘c’) and perinuclear actin shells (‘ns’). (B) Selected stills taken from timelapse microscopy of developing sporangia from the LifeAct-tdTomato transformant strain at times indicated (hr: min). Formation of polygonal territories precedes cellularization. Images taken using DIC (top) and 561 nm (middle), also shown with images merged (bottom). Scale bar indicates ten microns. (C) Multiple planes of a single sporangium show how polygonal territories formed during later stages of cellularization encompass the entire cytoplasm.
Figure 5—video 1
Time-lapse microscopy of developing LifeAct-tdTomato sporangia taken over the course of 19 hr with images captured every 5 min.
The left panel shows DIC microscopy, the center panel shows 561 nm fluorescence microscopy, and the right shows a merge of fluorescence and DIC microscopy. Time stamp is hr:min. Scale bar indicates 10 µm.
Tables
Table 1
Comparison of nuclear division synchrony for different coenocytic organisms.
Wave time () is defined as the average interval of time for a wave of synchronized nuclear divisions to propagate across the coenocytic nuclei. The nuclear division period () is the average interval of time between waves. Organisms are listed from highest to lowest synchrony index.
| Coenocytic organism | Length scale | Wave time | Wave speed | Nuclear division | Synchrony index | References |
|---|---|---|---|---|---|---|
| (µm) | (min) | (µm min-1) | Period (min) | |||
| Physarum polycephalum (amoeba) | 1000 | 2 | 500 | 840 | 99.8% | Halvorsrud et al., 1995 |
| Spizellomyces punctatus (fungi) | 5–10 | 1 | 5–10 | 150 | 99.3% | This work |
| Creolimax fragrantissima (holozoa) | 20 | 300 | 93.3% | Suga and Ruiz-Trillo, 2013 | ||
| Drosophila melanogaster (metazoa) | 500 | 1.5 | 360 | 10 | 85.5% | Deneke et al., 2016 |
| Aspergillus nidulans (fungi) | 700 | 20 | 35 | 60 | 66.7% | Clutterbuck, 1970; Momany and Taylor, 2000 |
Table 2
Primers used in this study.
Capital letters in SLIC and Gibson primers indicate template binding regions.
| Plasmid creation | Target amplicon (Source DNA) | Primer name | Primer sequence (5’→ 3’) |
|---|---|---|---|
| pEM01 | CMV promoter (pAB1T7) | CMV_F | ccctcactaaagggaacaaaagctggagctgagctcGACATTGATTATTGACTAGTTATTAATAG |
| pEM01 | CMV promoter (pAB1T7) | CMV_R | ctttttacccatgttaattaaAGCTCTGCTTATATAGACCTCC |
| pEM01 | hph (pRS306H) | Hyg_F | tatataagcagagctttaattaacATGGGTAAAAAGCCTGAACTC |
| pEM01 | hph (pRS306H) | Hyg_R | tagaagtggcgcgccaTTATTCCTTTGCCCTCGGAC |
| pEM01 | ADH1 terminator (pNB780) | ADH1t_F | agggcaaaggaataatggcgcgccACTTCTAAATAAGCGAATTTCTTATG |
| pEM01 | ADH1 terminator (pNB780) | ADH1t_R | tgacccggcggggacgaggcaagctaaacaATATTACCCTGTTATCCCTAGC |
| pEM03 | Hsp70 promoter (Spun gDNA) | HSP70_F | actaaagggaacaaaagctggagctgagctcTTTTAAAATCTTGTCTTTGTGC |
| pEM03 | Hsp70 promoter (Spun gDNA) | HSP70_R | ggtgagttcaggctttttacccatgttaattaaATTGTGCTGATCTTTGGTCC |
| pEM09 | hph (pFA6-GFP(S65T)-hph) | HygR_F | aagatcagcacaatttaattaATGGGTAAAAAGCCTGAACTCAC |
| pEM09 | hph (pFA6-GFP(S65T)-hph) | HygR_R | tcctcctcctcctccTTCCTTTGCCCTCGGACG |
| pEM09 | GFP (pFA6-GFP(S65T)-hph) | GFP_F | gcaaaggaaggaggaggaggaggaggaAGTAAAGGAGAAGAACTTTTCAC |
| pEM09 | GFP (pFA6-GFP(S65T)-hph) | GFP_R | cgcttatttagaagtggcgcgccTATTTGTATAGTTCATCCATGC |
| Sequencing | pRS-up | aacataggagccggaagcataaagtg | |
| Sequencing | ADHt-dn | ctgccggtagaggtgtggtcaataag | |
| pGI3EM9 | Hsp70pr-hph-GFP (pEM09) | GI3EM9IIF | cgttgtaaaacgacggccagtgccaagcttttttaaaatcttgtctttgtgcac |
| pGI3EM9 | Hsp70pr-hph-GFP (pEM09) | GI3EM9IIR | aggaaacagctatgacatgattacgaattcccggtagaggtgtggtcaataag |
| pGI3EM11 | H2B promoter (Spun gDNA) | prH2B_F | cgttgtaaaacgacggccagtgccaagCTTTTATGCTCCAAGCGGAG |
| pGI3EM11 | H2B promoter (Spun gDNA) | prH2B_R | gagttcaggctttttacccattaattaaTTTGTGTGTGTGATGGATGAG |
| pGI3EM11 | HygR_up | GI3EM11up | ggatcctcctcctccTTCCTTTGCCCTCGGACG |
| pGI3EM18 | tdTomato (pKT356) | HygtdTom_F | cagcactcgtccgagggcaaaggaaggaggaggaggatccATGGTGAGCAAGGGCGAG |
| pGI3EM18 | tdTomato (pKT356) | AdhtdTom_R | tcgcttatttagaagtggcgcgcctTTACTTGTACAGCTCGTCCATG |
| pGI3EM20C | H2A/H2B promoter (Spun gDNA) | H2B2D_F | gctttttacccatttaattaatgctgtgtaaggtgtgcg |
| pGI3EM20B/C | H2A/H2B promoter (Spun gDNA) | H2B2D_R | gggtgccatgtcgacttgtgtgtgtgatggatgag |
| pGI3EM20B/C | H2B CDS (Spun cDNA) | H2Bgen_F | atcacacacacaagtcgacatggcacccaaggaagctc |
| pGI3EM20B/C | H2B CDS (Spun cDNA) | H2Bgen_R | gacctcctcgcccttgctcaccatggatccggaggaggatttagcagactggtacttcgtcac |
| pGI3EM20B/C | HygR (pEM03) | AdhHygF | cgttgtaaaacgacggccagtgccaagcttccggtagaggtgtggtcaataag |
| pGI3EM20B/C | HygR (pEM03) | AdhHygR | ccttacacagcattaattaaatgggtaaaaagcctgaactc |
| pGI3EM20B/C | invPCR T-DNA (LB) | 4_LB_R | tgtggaattgtgagcggata |
| pGI3EM20B/C | invPCR/sequencing T-DNA (LB) | ai077_F | agaggcggtttgcgtattgg |
| pGI3EM22C | LifeAct (Synthesized DNA) | TwistLifeact_F | ctataaaaggcgggcgtgt |
| pGI3EM22C | LifeAct (Synthesized DNA) | TwistLifeact_R | gcgcatgaactctttgatga |
| pGI3EM29 | mCitrine (mCitrine-PCNA-19-SV40NLS-4) | EM18Citrine_F | ccgagggcaaaggaaggaggaggaggatccATGGTGAGCAAGGGCGAG |
| pGI3EM29 | mCitrine (mCitrine-PCNA-19-SV40NLS-4) | EM18Citrine_R | aagaaattcgcttatttagaagtggcgcgcCTTGTACAGCTCGTCCATGC |
| pGI3EM30 | mClover3 (pKK-mClover3-TEV) | EM18Clover3_F | gagggcaaaggaaggaggaggaggatccATGGTGAGCAAGGGCGAG |
| pGI3EM30 | mClover3 (pKK-mClover3-TEV) | EM18Clover3_R | gaaattcgcttatttagaagtggcgcgcCTTGTACAGCTCGTCCATGC |
| pGI3EM31 | mCerulean3 (mCerulean3-N1) | EM18Cerulean3_F | ccgagggcaaaggaaggaggaggaggatccATGGTGAGCAAGGGCGAG |
| pGI3EM31 | mCerulean3 (mCerulean3-N1) | EM18Cerulean3_R | aagaaattcgcttatttagaagtggcgcgccTTACTTGTACAGCTCGTCCATG |
| mCitrine/Clover/Cerulean Sequencing | mClover_Down | gtccaagctgagcaaagacc | |
| PCR screen (Set C)/H2Bpr/Sequencing | H2BprF1 | tttatgctccaagcggagac | |
| PCR screen (Set C)/Sequencing | TomR1 | cttgtacagctcgtccatgc | |
| PCR screen (Set D)/H2Bpr/Sequencing | H2BprF2 | cgttaaatgacctgctcgaa | |
| PCR screen (Set D)/H2Bpr/Sequencing | TomR2 | ccatgccgtacaggaacag | |
| PCR screen (Set A)/Southern Blot/Sequencing | HygF1 | gatgtaggagggcgtggata | |
| PCR screen (Set A)/Southern Blot/Sequencing | HygR1 | atttgtgtacgcccgacagt | |
| PCR screen (Set B)/Sequencing | HygF2 | gtcctgcgggtaaatagctg | |
| PCR screen (Set B)/Sequencing | HygR2 | cgtctgctgctccatacaag |
Table 3
Chytrid strains available from the Buchler lab upon request.
Plasmid column lists Agrobacterium plasmids from Appendix 1 used to create chytrid strains. Integrated gene(s) are described using yeast genetic nomenclature.
| Request ID | Strain name | Plasmid | Integrated gene(s) |
|---|---|---|---|
| NBC24 | EM11-1 | pGI3EM11 | H2Bpr-hph-GFP-ScADH1ter |
| NBC34 | EM18-1 | pGI3EM18 | H2Bpr-hph-tdTomato-ScADH1ter |
| NBC25 | EM20C-1 | pGI3EM20C | H2Bpr-H2B-tdTomato-ScADH1ter:H2Apr-hph-ScADH1ter |
| NBC26 | EM20C-2 | pGI3EM20C | H2Bpr-H2B-tdTomato-ScADH1ter:H2Apr-hph-ScADH1ter |
| NBC27 | EM20C-3 | pGI3EM20C | H2Bpr-H2B-tdTomato-ScADH1ter:H2Apr-hph-ScADH1ter |
| NBC28 | EM20C-4 | pGI3EM20C | H2Bpr-H2B-tdTomato-ScADH1ter:H2Apr-hph-ScADH1ter |
| NBC1 | EM22C-1 | pGI3EM22C | H2Bpr-Lifeact-tdTomato-ScADH1ter:H2Apr-hph-ScADH1ter |
| NBC71 | EM29-1 | pGI3EM29 | H2Bpr-hph-mCitrine-ScADH1ter |
| NBC55 | EM30-1 | pGI3EM30 | H2Bpr-hph-mClover3-ScADH1ter |
| NBC44 | EM31-1 | pGI3EM31 | H2Bpr-hph-mCerulean3-ScADH1ter |
Additional files
Download links
A two-part list of links to download the article, or parts of the article, in various formats.
Downloads (link to download the article as PDF)
Open citations (links to open the citations from this article in various online reference manager services)
Cite this article (links to download the citations from this article in formats compatible with various reference manager tools)
Genetic transformation of Spizellomyces punctatus, a resource for studying chytrid biology and evolutionary cell biology
eLife 9:e52741.
https://doi.org/10.7554/eLife.52741


