Punishment insensitivity emerges from impaired contingency detection, not aversion insensitivity or reward dominance
- UNSW Sydney, Australia
- University of Technology Sydney, Australia
- St Vincent’s Centre for Applied Medical Research, Australia
Figures
Figure 1
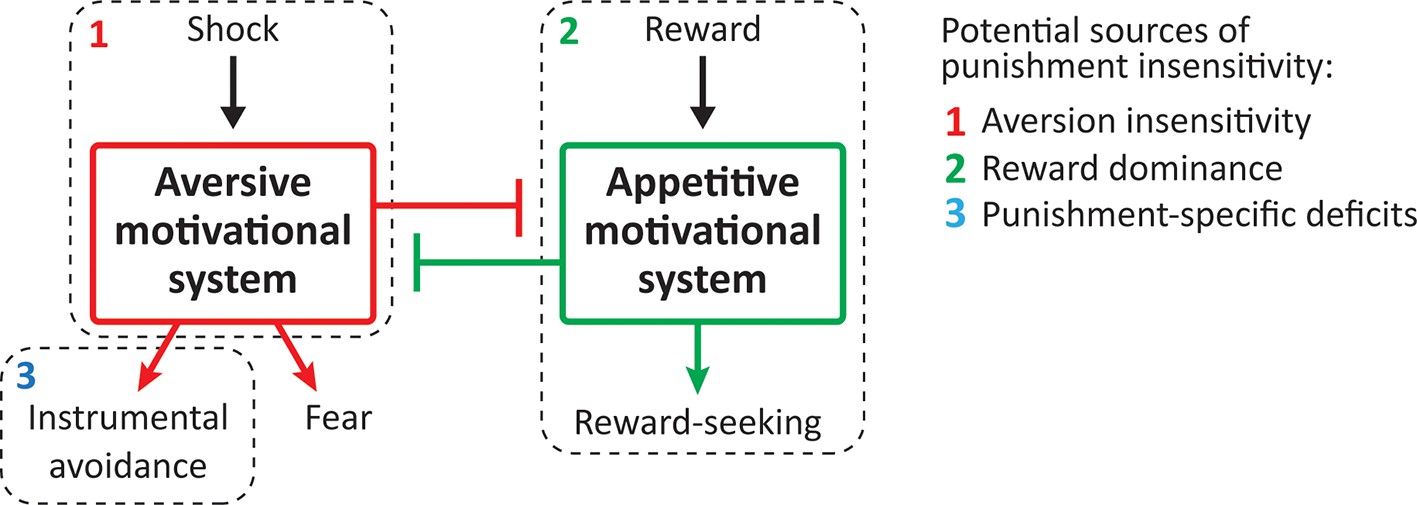
Potential sources of punishment insensitivity.
Figure 2
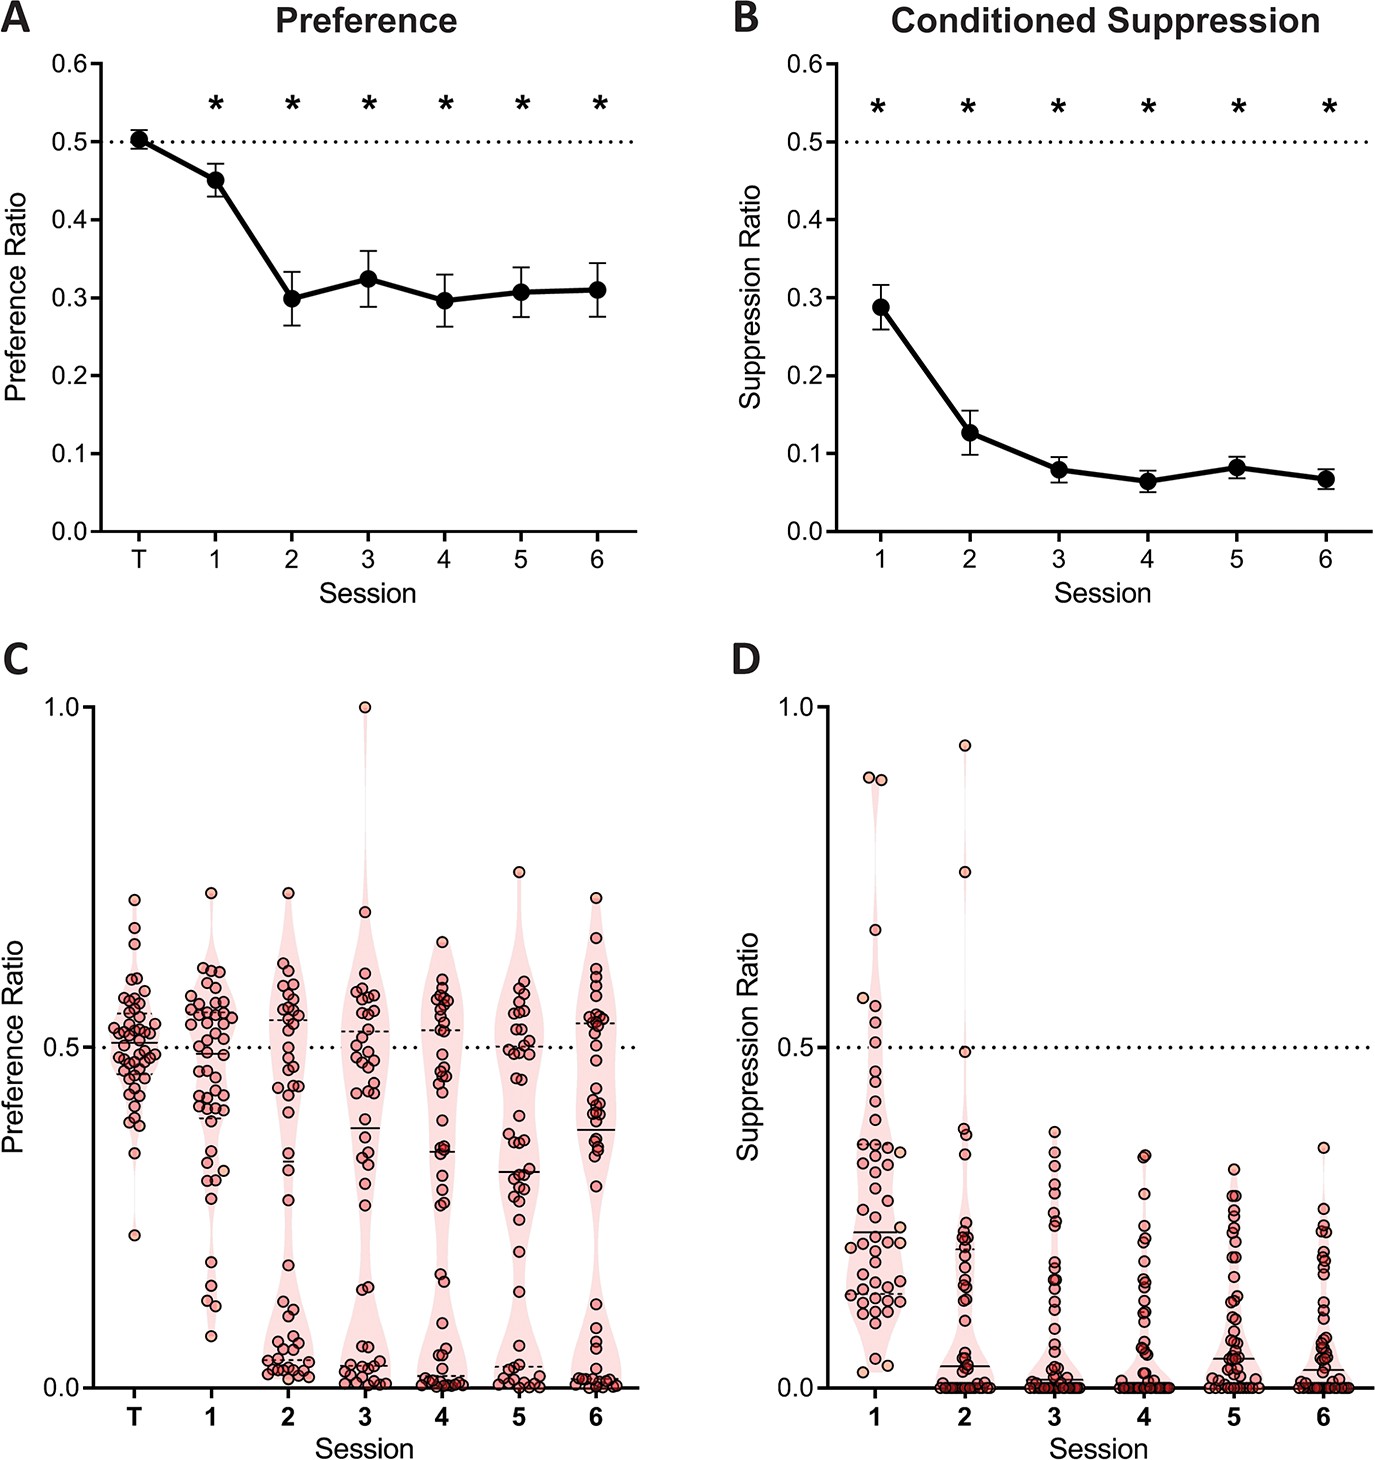
Lever preference and conditioned suppression across conditioned punishment.
(A) Mean ± SEM preference ratios showing evidence for punishment. (B) Mean ± SEM suppression ratios showing evidence for fear. (C) Violin plots and individual subject preference ratios. (D) Violin plots and individual subject conditioned suppression ratios.
Figure 3
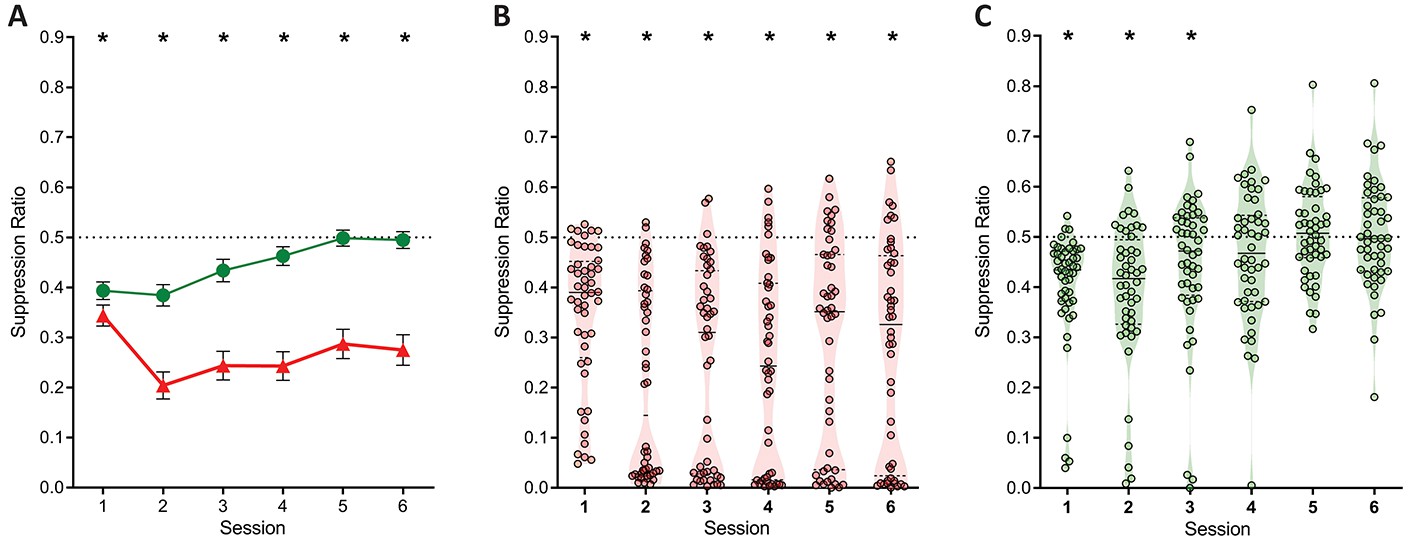
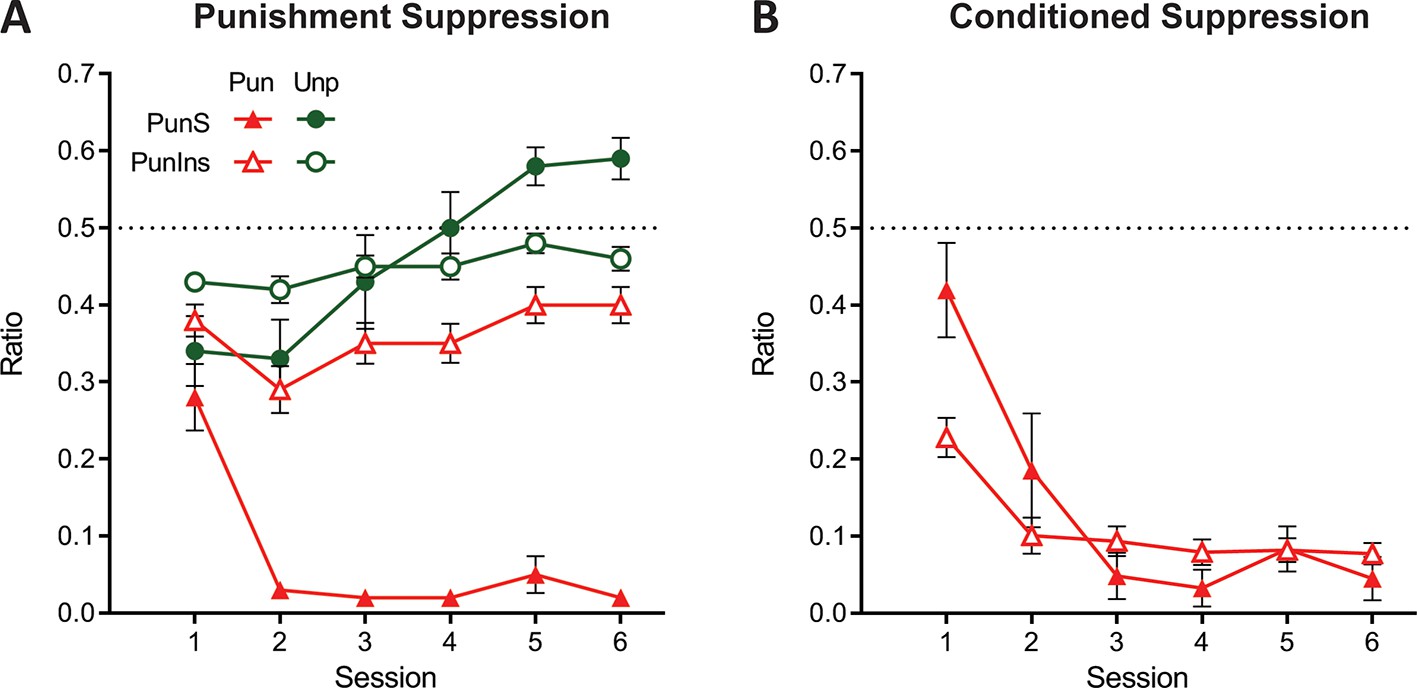
Lever-press suppression across conditioned punishment.
(A) Mean ± SEM suppression ratios for responding on the punished (red) and unpunished (green) levers relative to training. *p<0.05 punished vs. unpunished. (B) Violin plots and individual subject suppression ratios for the punished lever. *p<0.05 punished vs. null ratio (0.5). (D) Violin plots and individual subject suppression ratios for the unpunished lever. *p<0.05 punished vs. null ratio (0.5).
Figure 4
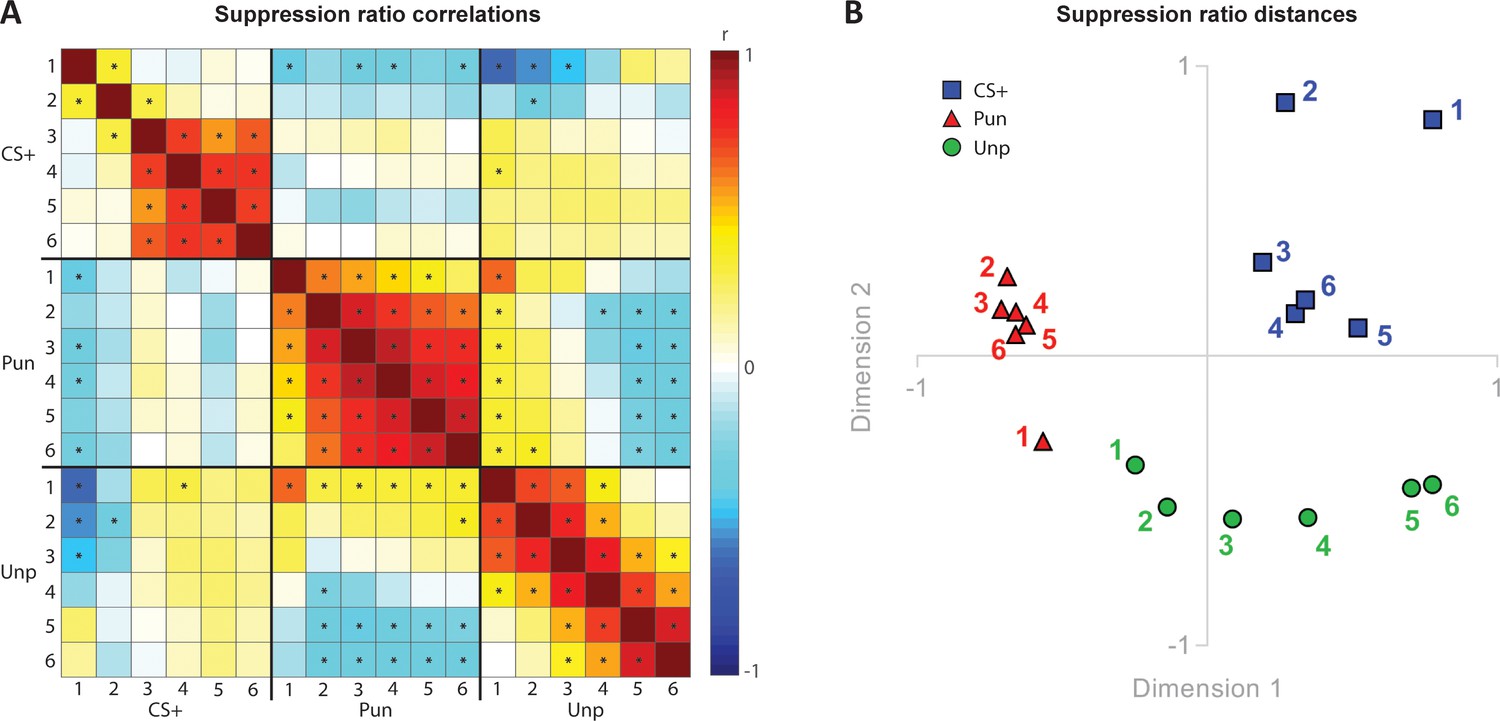
Relationships between punishment, fear and reward.
(A) Correlation matrix for suppression ratios during CS+ presentations, punished lever, and unpunished lever across conditioned punishment sessions (1-6). (B) Multidimensional scaling showing suppression ratio distances for CS+, punished lever suppression, and unpunished lever suppression across sessions (1-6).
Figure 5 with 2 supplements
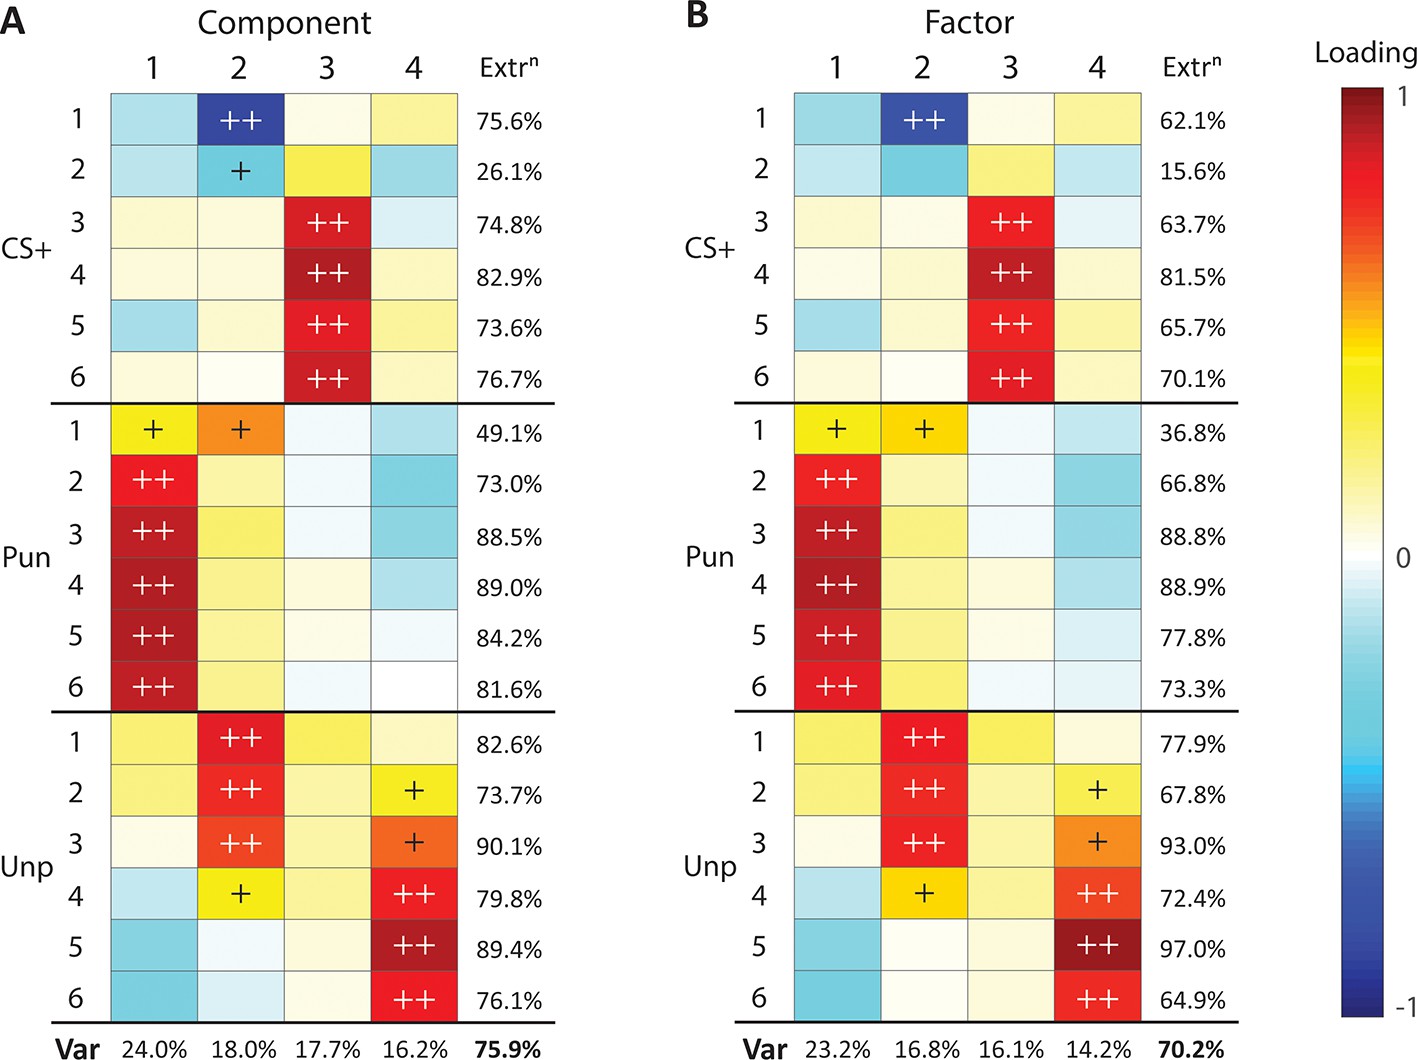
Principal component and factor analysis of suppression during conditioned punishment.
(A) Loading heatmaps for principal component analysis of suppression ratios across conditioned punishment sessions (1-6). (B) Loading heatmaps for factor analysis of suppression ratios across conditioned punishment sessions (1-6). Bottom rows indicates proportion of total variance (Var) accounted for by components/factors. Last column indicates variance of each measure accounted for by components/factors (extraction). Loadings that account for majority (>50%) or substantial (>10%) variance are indicated with ++ and +, respectively.
Figure 5—figure supplement 1
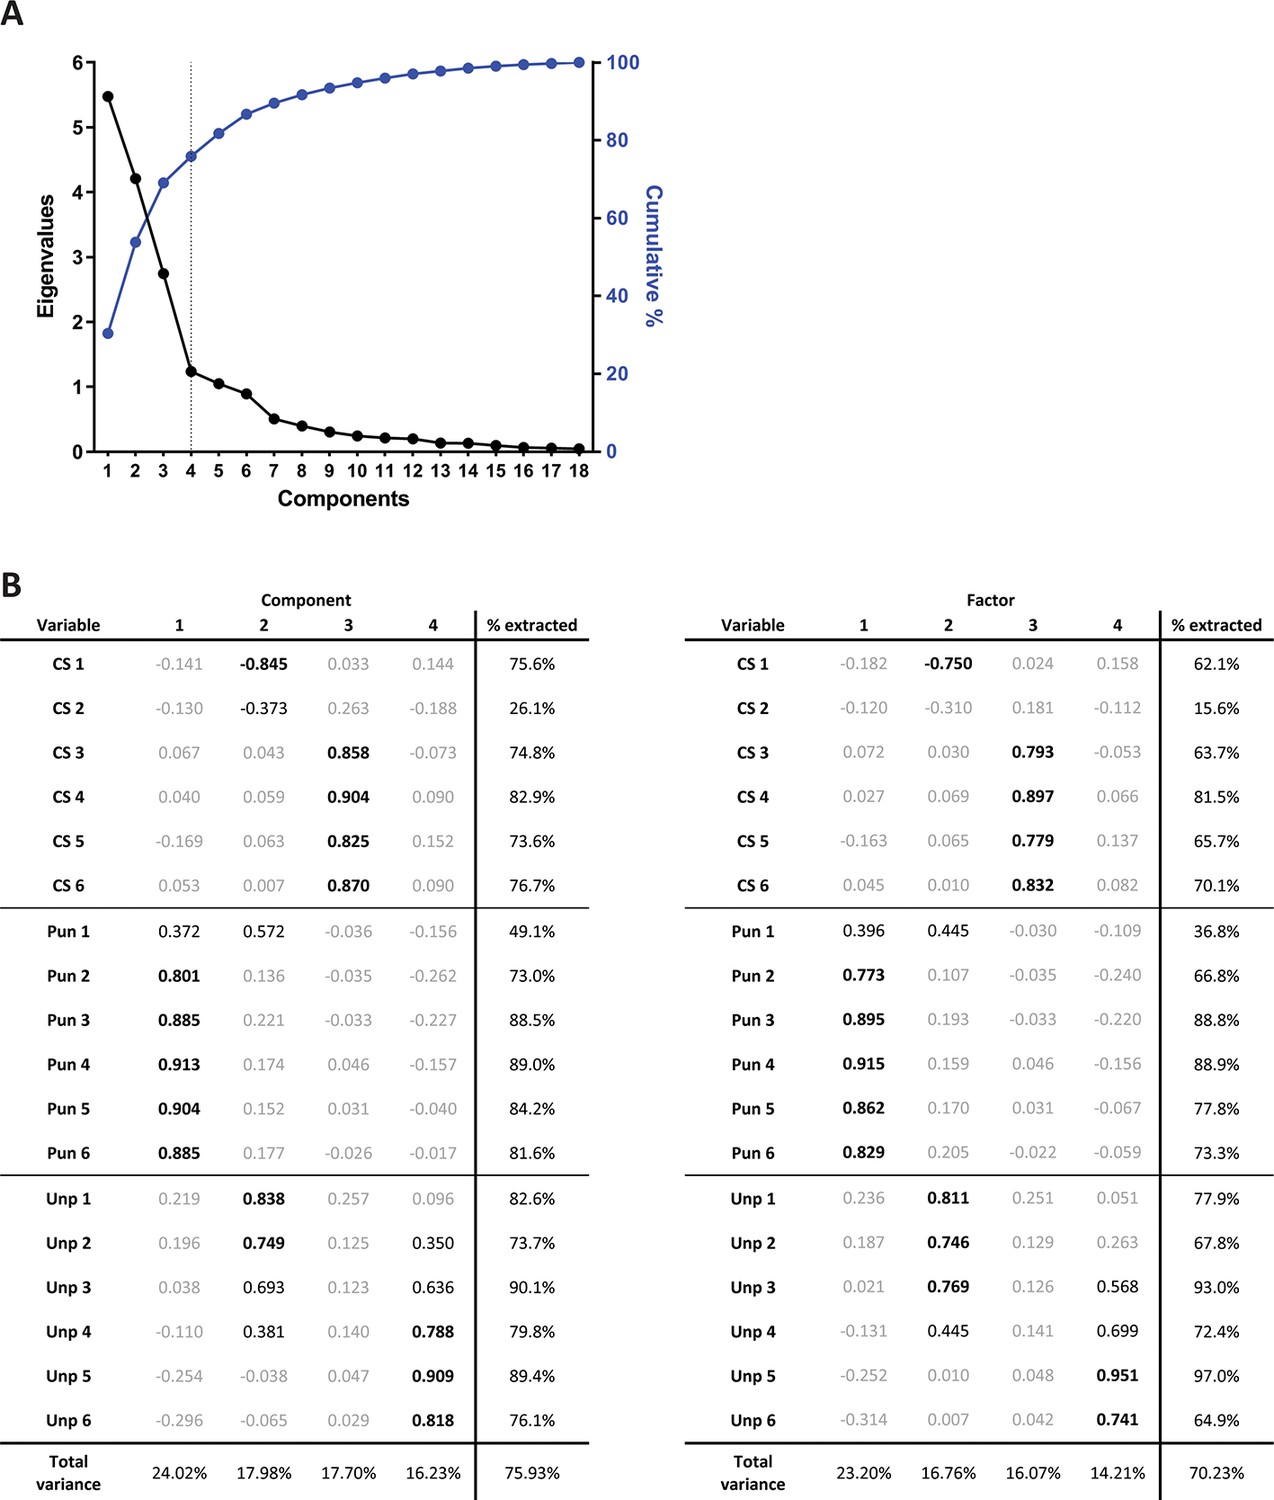
Results of dimension reduction of suppression ratios.
(A) Scree plot of eigenvalues (black line, left axis) and cumulative variance accounted for by components (blue line, right axis). Four components/factors (dotted line) was deemed optimal. (B) Results of principal component analysis (left table) and factor analysis (right table). Loadings in bold are above. 707 (>50%, that is majority, of variable’s variance). Loadings in grey are below. 316 (<10% of variable’s variance), indicative of a weak or null loading.
Figure 5—figure supplement 2
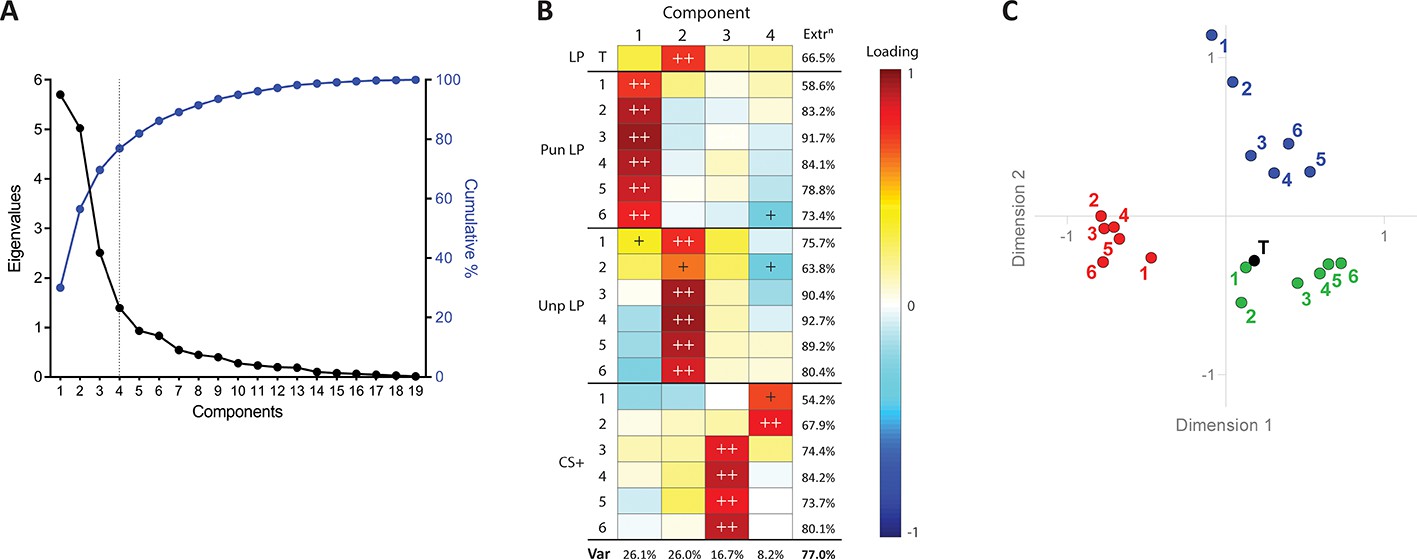
Relationships between rates of pre-punishment lever-pressing (T), ITI rates of lever-pressing (Pun LP, Unp LP) across conditioned punishment, and conditioned suppression.
(A) Scree plot of eigenvalues (black line, left axis) and cumulative variance accounted for by components (blue line, right axis). Four components/factors (dotted line) was deemed optimal. (B) Results of principal component analysis. Loadings in bold are above. 707 (>50%, that is majority, of variable’s variance). Loadings in grey are below. 316 (<10% of variable’s variance), indicative of a weak or null loading. Component one captured majority variance in punished responding. Component two captured majority variance in unpunished responding, including training lever-press rates. Components 3–4 captured majority variance of conditioned suppression. (C) Multidimensional scaling of lever-press rates and conditioned suppression. Pre-punishment lever-pressing was clustered with unpunished lever-pressing, indicating the strong relatedness of unpunished reward-seeking pre- and post-punishment. Punished reward-seeking was clustered separately, as was conditioned suppression.
Figure 6 with 1 supplement
Behaviour of groups from 2-cluster solution.
(A) Mean ± SEM punished and unpunished lever suppression for punishment-sensitive (PunS; filled) and punishment-insensitive (PunIns; empty) groups from 2-cluster solution. (B) Mean ± SEM conditioned suppression ratios for groups from 2-cluster solution.
Figure 6—figure supplement 1
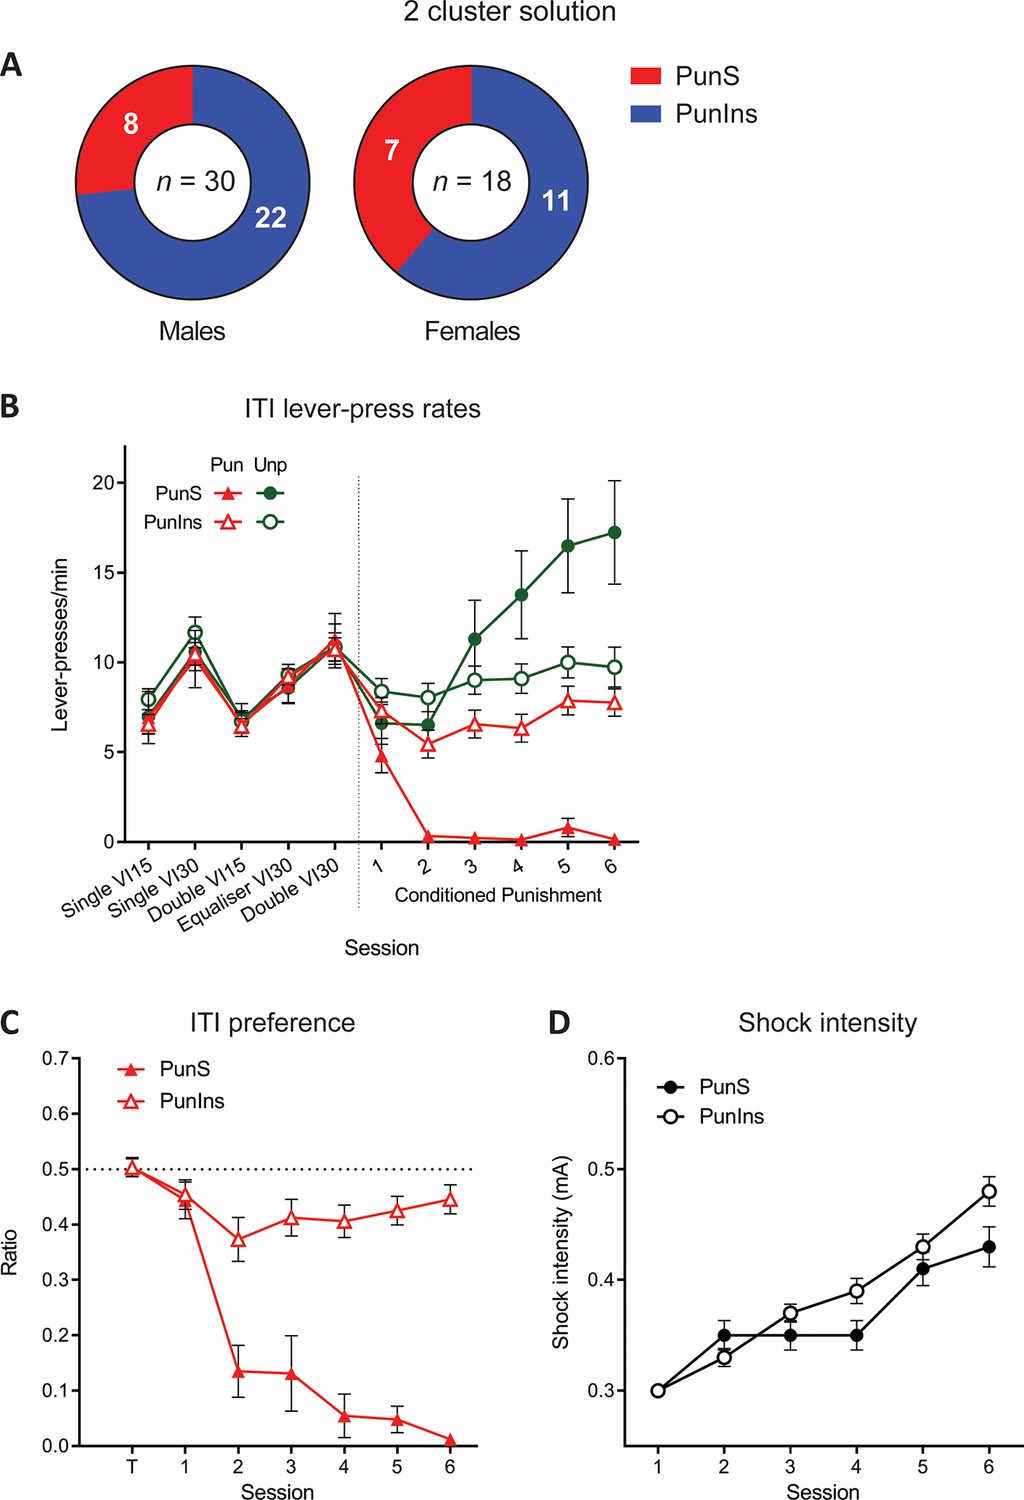
Other results of 2-cluster solution.
(A) Breakdown of cluster assignment across males and females. (B) Mean ± SEM lever-press rates during ITI for punishment-sensitive (filled symbol) and -insensitive (empty symbol) clusters. No differences were observed during training. (C) Mean ± SEM preference ratios for punishment-sensitive (filled symbol) and -insensitive (empty symbol) clusters. (C) Mean ± SEM shock intensity for punishment-sensitive (filled symbol) and -insensitive (empty symbol) clusters.
Figure 7 with 1 supplement
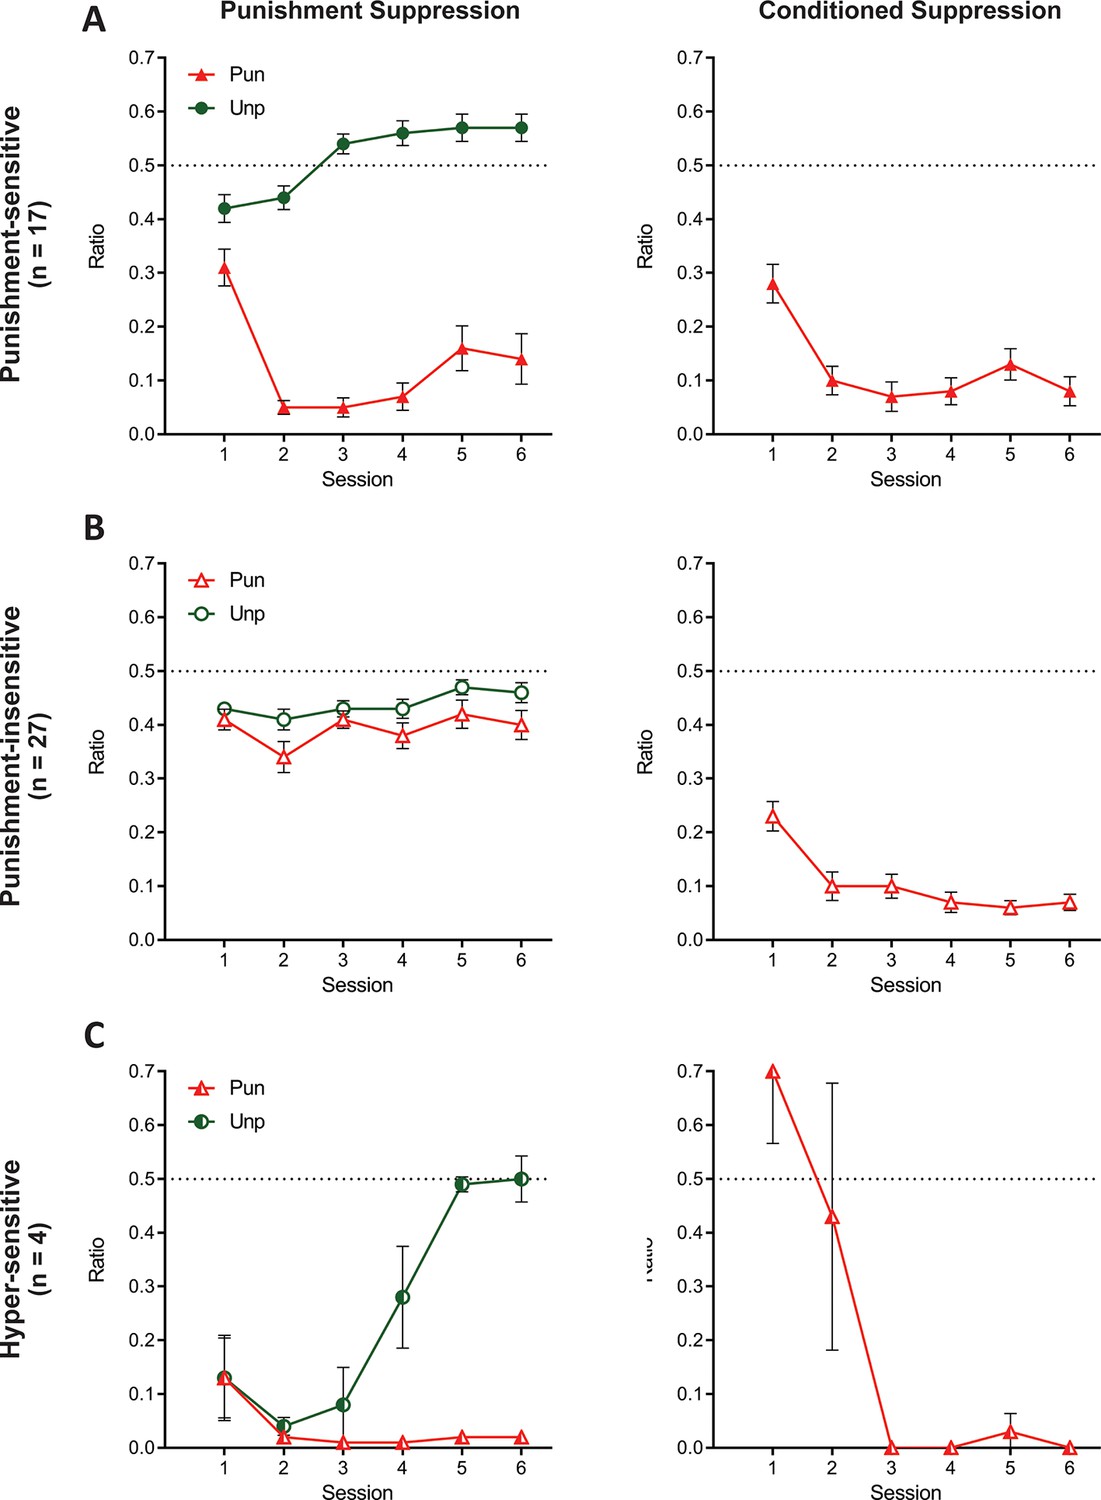
Behaviour of groups from 3-cluster solution.
(A) Mean ± SEM punishment suppression and conditioned suppression for punishment-sensitive cluster. (B) Mean ± SEM punishment suppression and conditioned suppression for punishment-insensitive cluster. (C) Mean ± SEM punishment suppression and conditioned suppression for hyper-sensitive cluster.
Figure 7—figure supplement 1
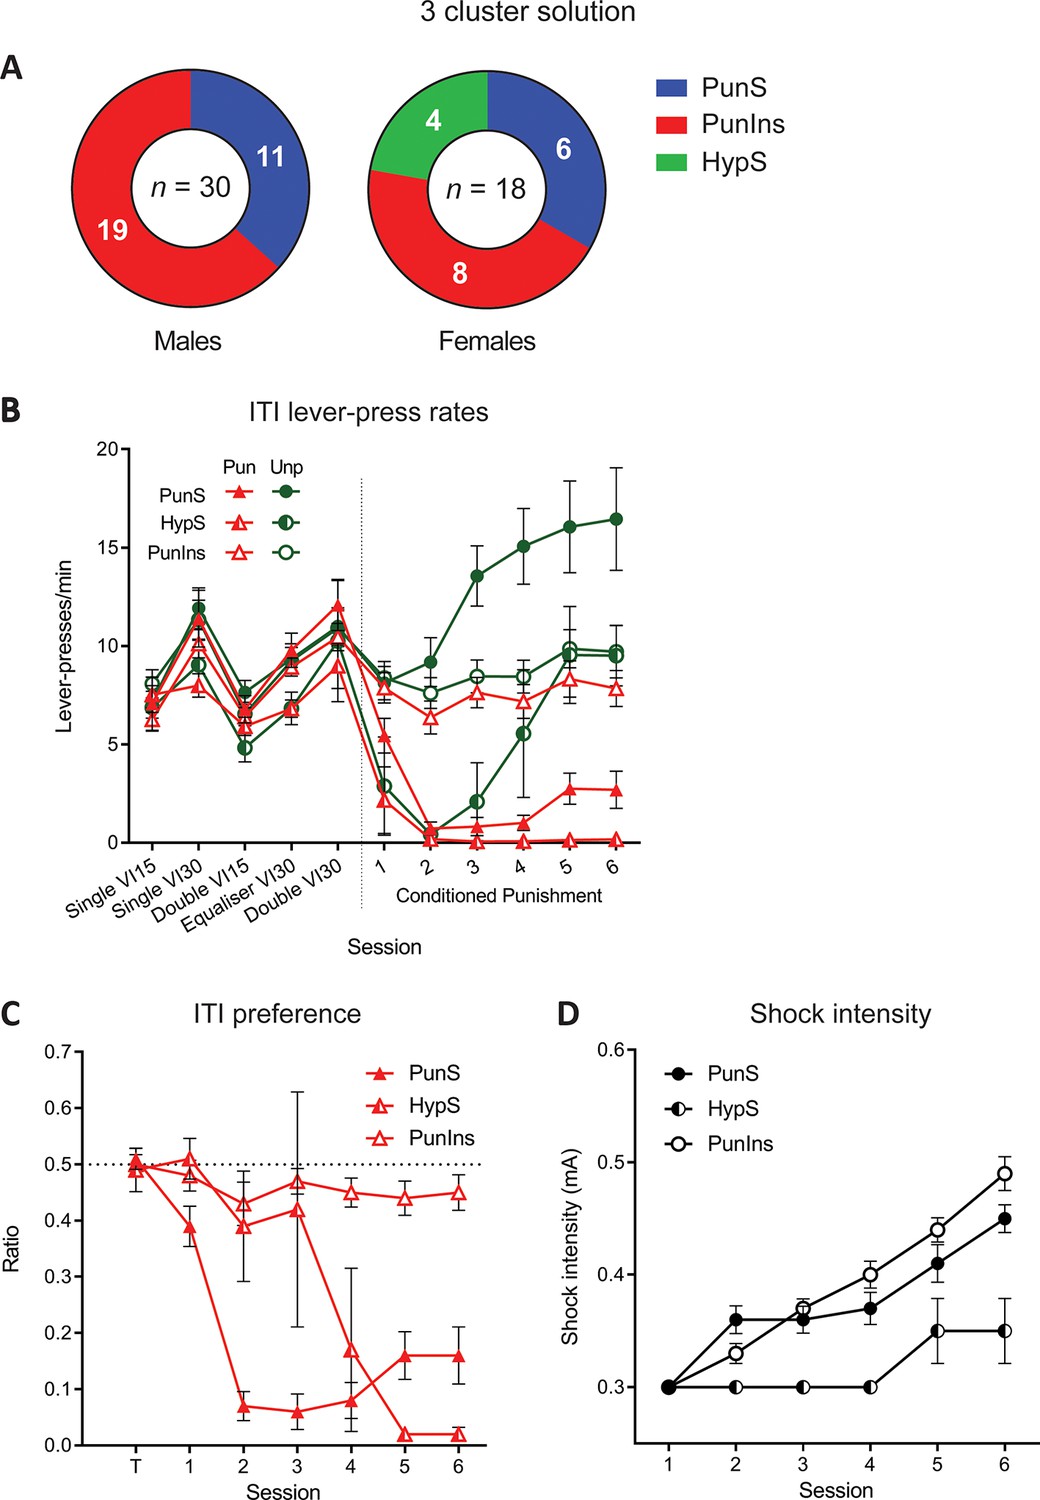
Other results of 3-cluster solution.
(A) Breakdown of cluster assignment across males and females. (B) Mean ± SEM lever-press rates during ITI for punishment-sensitive (filled symbol), -insensitive (empty symbol), and hyper-sensitive (half-filled symbol) clusters. No differences were observed during training. (C) Mean ± SEM preference ratios for punishment-sensitive (filled symbol), -insensitive (empty symbol), and hyper-sensitive (half-filled symbol) clusters. (D) Mean ± SEM shock intensity for punishment-sensitive (filled symbol), -insensitive (empty symbol), and hyper-sensitive (half-filled symbol) clusters.
Tables
Table 1
Experimental design.
| Lever | End lever-press training | Conditioned punishment |
|---|---|---|
| Punished | Food (VI30s) | Food (VI30s) CS+ → Shock (VI60s) |
| Unpunished | Food (VI30s) | Food (VI30s) CS- (VI60s) |
-
CS+ and CS- were 10 s 3 kHz tone or 5 Hz flashing light, counterbalanced. CS+ co-terminated with shock (0.5 secs, 0.3–0.6mA).
Additional files
Download links
A two-part list of links to download the article, or parts of the article, in various formats.
Downloads (link to download the article as PDF)
Open citations (links to open the citations from this article in various online reference manager services)
Cite this article (links to download the citations from this article in formats compatible with various reference manager tools)
Punishment insensitivity emerges from impaired contingency detection, not aversion insensitivity or reward dominance
eLife 8:e52765.
https://doi.org/10.7554/eLife.52765


