Identification of drug modifiers for RYR1-related myopathy using a multi-species discovery pipeline
- Program for Genetics and Genome Biology, Hospital for Sick Children, Canada
- Department of Molecular Genetics, University of Toronto, Canada
- Department of Pharmacology and Toxicology, University of Toronto, Canada
- Department of Pharmacology, University of Rochester, United States
- UNC Eshelman School of Pharmacy, SGC Center for Chemical Biology, University of North Carolina, United States
Figures
Figure 1
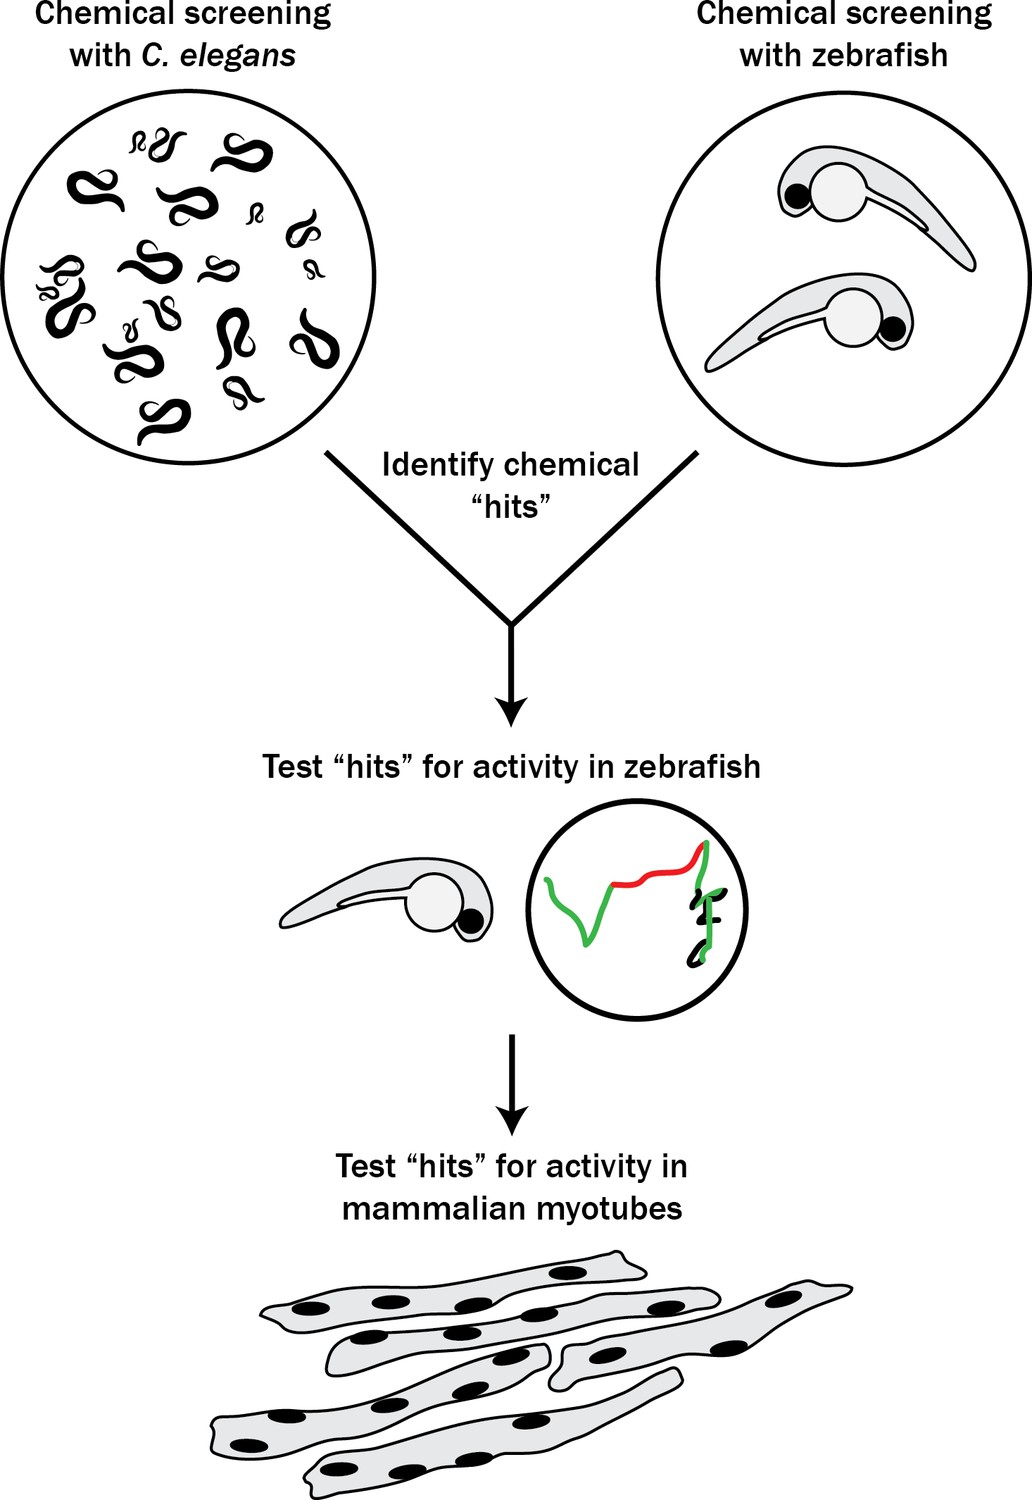
Schematic of our multi-species translational pipeline aimed at identifying potential therapeutic targets for RYR1-RM.
The pipeline involved screening C. elegans and zebrafish with thousands of compounds for suppressors of RYR1 mutant phenotypes, followed by further characterization in zebrafish and evaluation in mammalian cell lines.
Figure 2 with 5 supplements
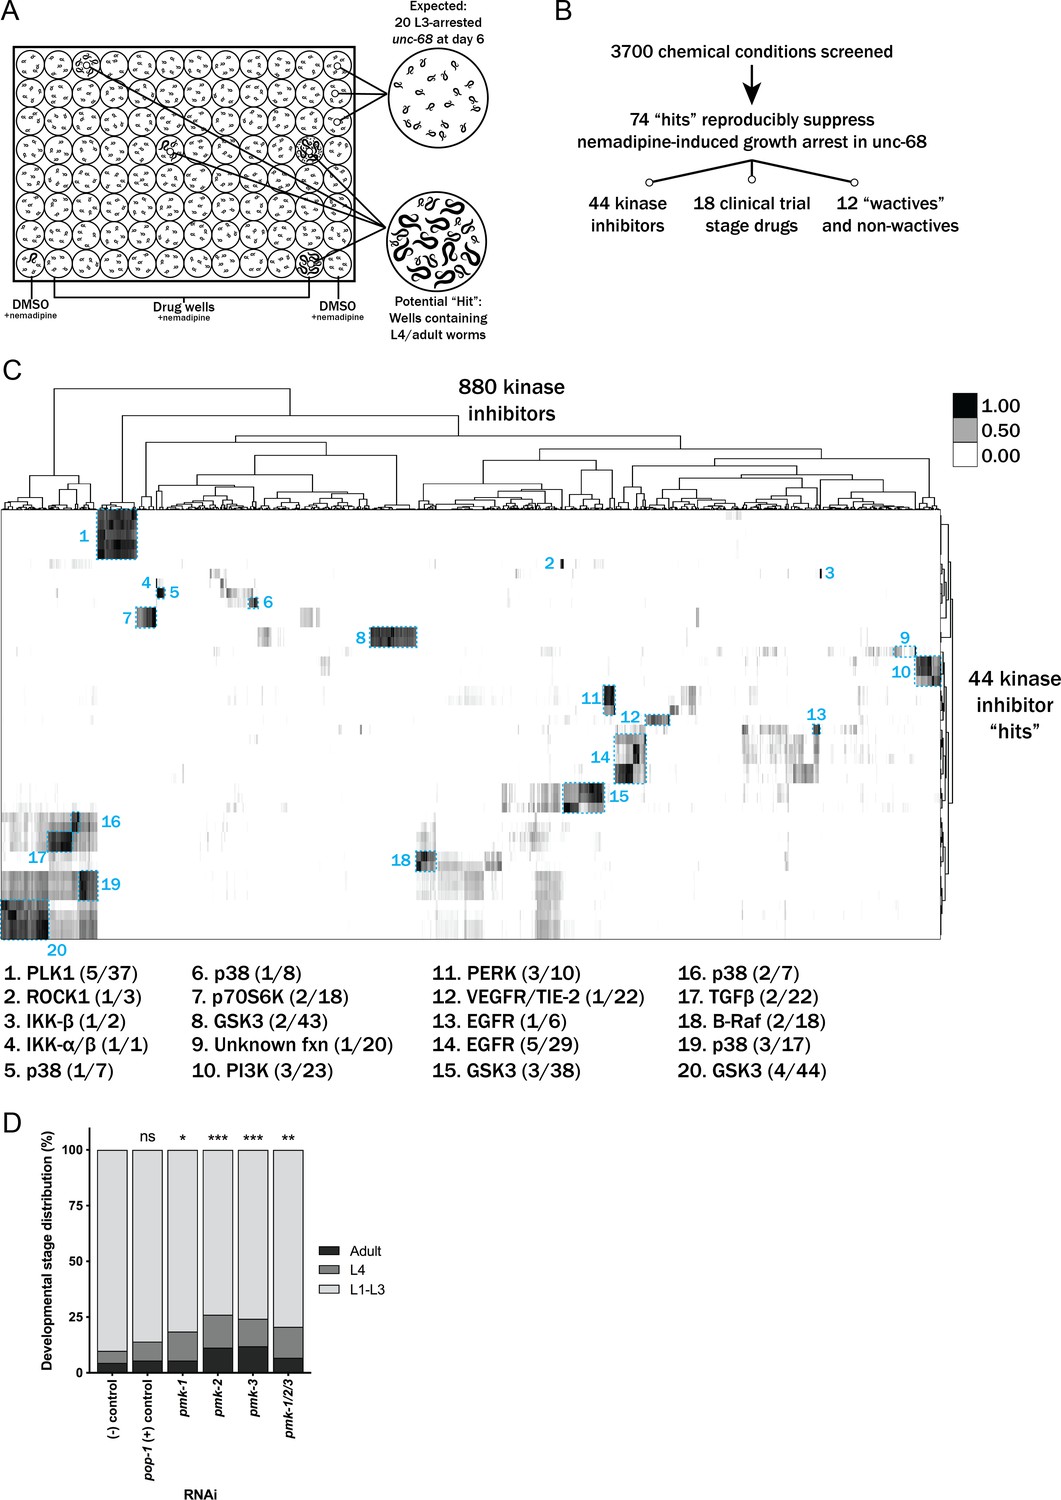
Chemical screen finds that p38 MAPK inhibition suppresses the nemadipine-A growth arrest of unc-68 mutants.
(A) Schematic of our screen methodology showing the expected growth arrest phenotype of unc-68 worms exposed to 25 μM nemadipine after 6 days of exposure and the expected phenotype of a chemical that suppresses this growth arrest. (B) Summary of the 74 ‘hits’ from this screen that reproducibly suppressed nemadipine-induced growth arrest of unc-68 mutants. (C) Heat map visualization of Tanimoto scores from the ‘hit’ compounds (y-axis) screened from the 880 compounds in the GlaxoSmithKline Published Kinase Inhibitor set (x-axis). Tanimoto scores were calculated for each pair of compounds as a measure of structural similarity and similar clusters were identified via hierarchical clustering of Tanimoto scores (legend indicates the Tanimoto score). As shown, chemicals with similar molecular fingerprints are associated with similar annotated functions/targets. Fisher’s exact test was used to determine enrichment based on the number of structurally similar members in each cluster that were either hits or not hits out of the total number of the compounds in the library. (D) RNA interference targeting either pmk-1, pmk-2, pmk-3, or a combination of the three shows that p38 MAPK gene knockdown allows a greater proportion of individual unc-68 worms to escape nemadipine-A-induced growth arrest compared to an empty vector control. Statistical analysis by Kruskal-Wallis test, followed by Dunn's post-test; ns p=0.7360, *p=0.0246, **p=0.0031, ***p<0.001; left-right: n = 406, 364, 308, 292, 276, 266.
Figure 2—figure supplement 1
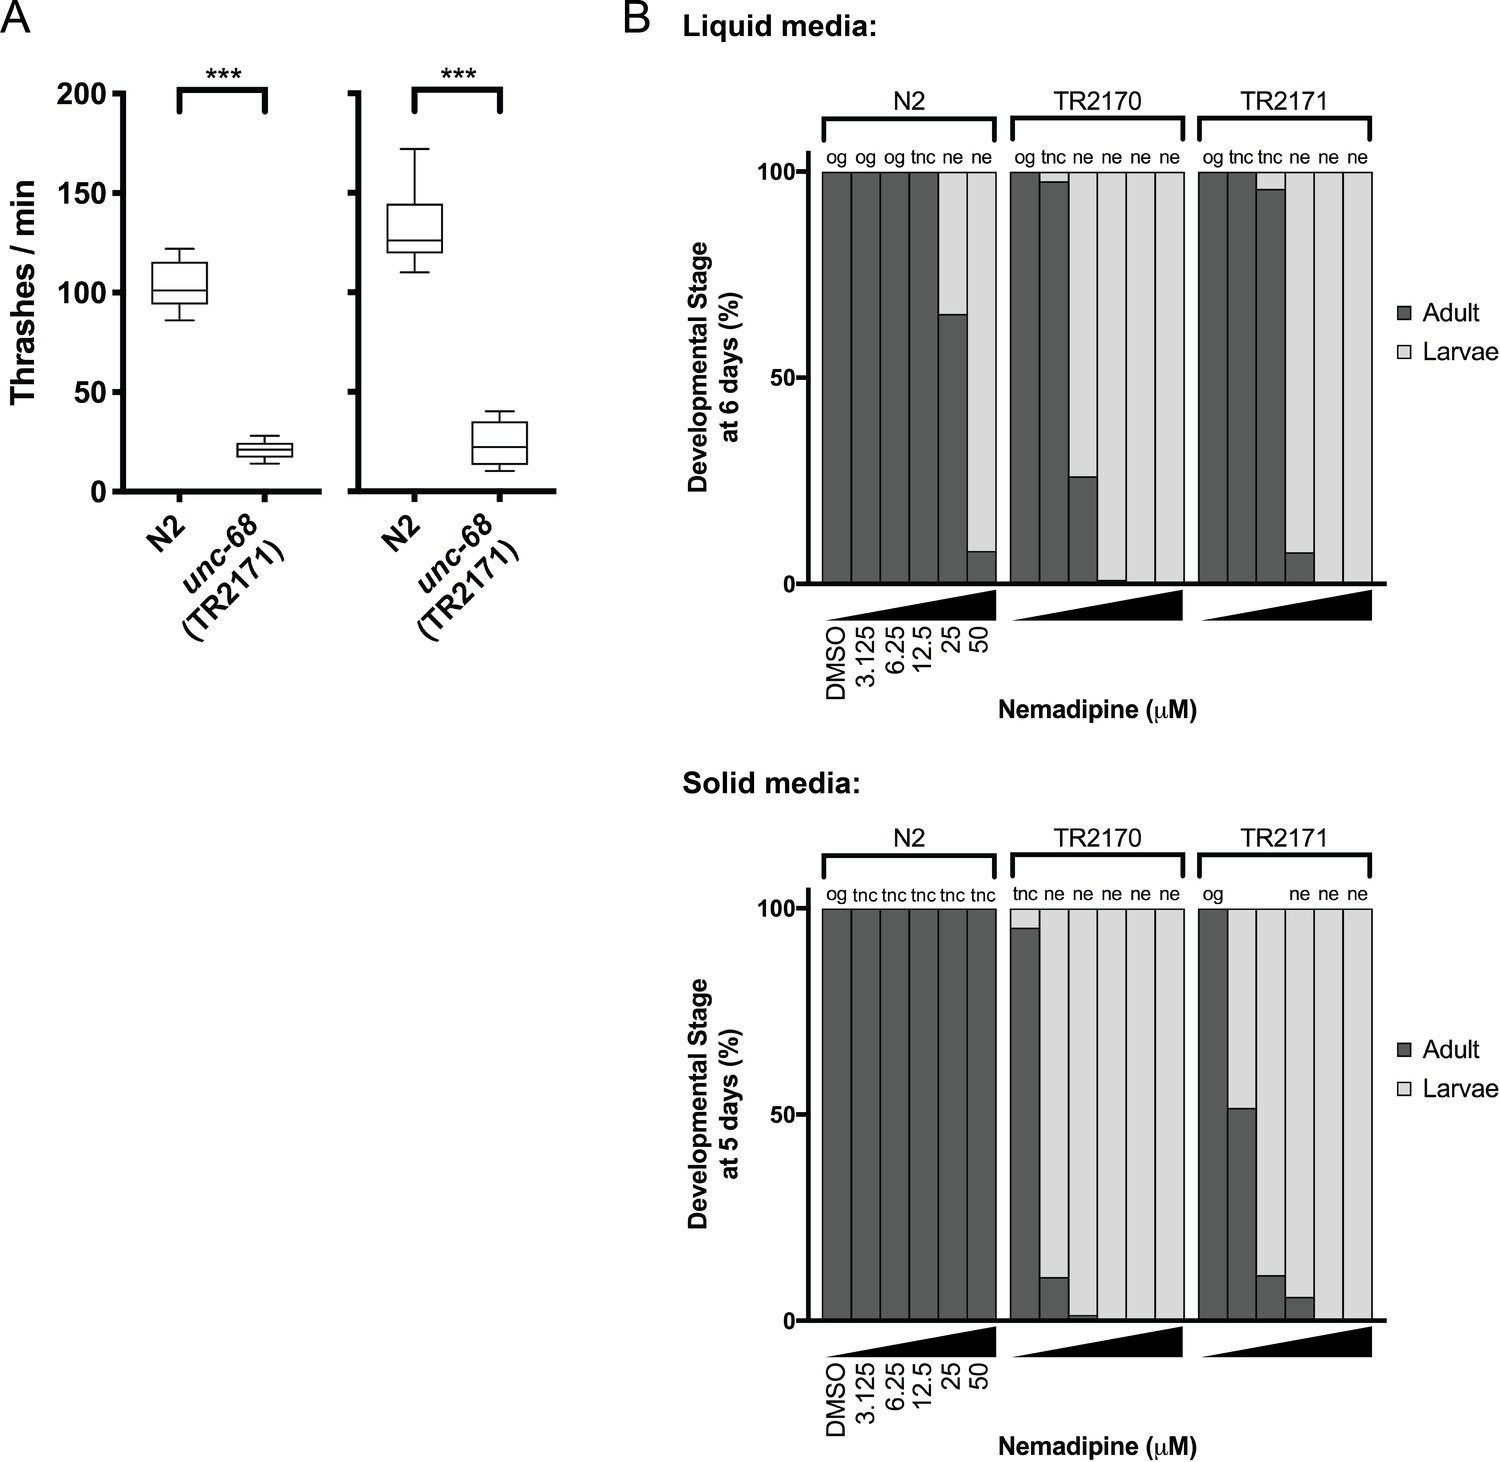
Phenotypes of unc-68 mutants considered for chemical screening.
(A) The ‘thrashing assay’ is performed by counting the waveforms propagated by individual C. elegans in one minute (Maryon et al., 1996). Consistent with previous reports (Maryon et al., 1996; Maryon et al., 1998), we found that unc-68 mutants thrash at a significantly lower rate than N2 (wild type) in two independent assays (n = 10 per genotype; Student’s T-test: ***p<0.001). (B) In both liquid and solid media, the DHPR inhibitor nemadipine-A (Kwok et al., 2006) induces concentration-dependent developmental growth arrest in unc-68(r1161) (strain TR2170) and unc-68(r1162) (strain TR2171) mutants. L1 larvae were plated in chemical at Day 0 (n = 20/well liquid 96-well plate; n = 50/well solid 24-well plate) and developmental stage was measured at Day 6 (liquid) and Day 5 (solid). Abbreviations: og = overgrown with larvae/eggs and food source depleted; tnc = larvae and eggs were too numerous to count, but food source not depleted; ne: no eggs have been laid (this phenotype is consistent with inhibition of egg-laying defective protein EGL-19, a DHPR, by nemadipine-A).
Figure 2—figure supplement 2

Post-hoc statistical analysis showing that 142 chemicals out of the 278 chemicals identified from the primary screen produced developmental stage distributions that were significantly different from random escapee wells (red arrows).
It is important to note that this was performed with the assumption that 20 worms were in each well as a means of estimating the proportion of actual L4 and adult counts in each well. In other words, we assumed #L1-L3 larvae = 20 – (#L4 + #adult). Plots shown are from independent screens of (A) 7.5 μM wactives, (B) 60 μM wactives, (C) 60 μM ‘random’ non-wactives, and (D) 60 μM US Drug Collection. Statistical analysis by Kruskal-Wallis test with Dunn’s multiple comparisons post-test where *p<0.05, **p<0.01, ***p<0.001.
Figure 2—figure supplement 3
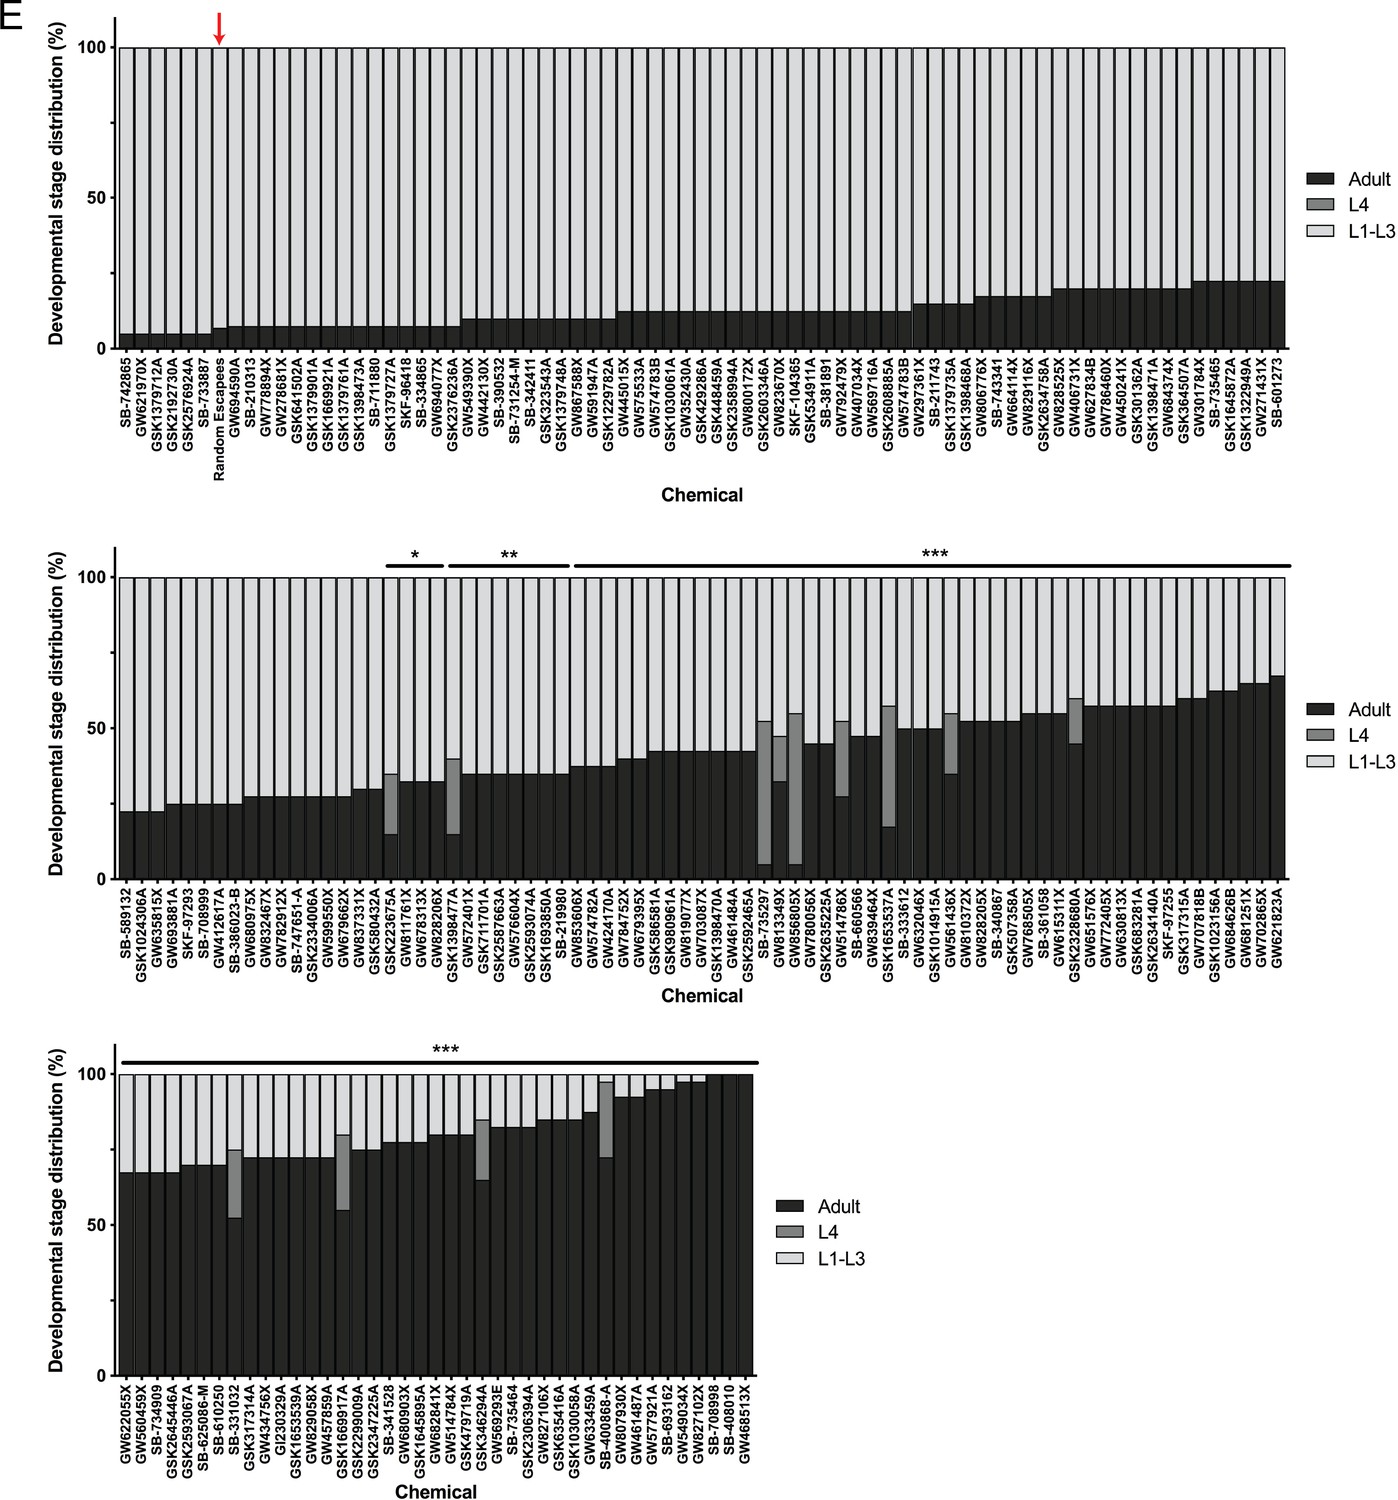
Post-hoc statistical analysis showing that 142 chemicals out of the 278 chemicals identified from the primary screen produced developmental stage distributions that were significantly different from random escapee wells (red arrows).
It is important to note that this was performed with the assumption that 20 worms were in each well as a means of estimating the proportion of actual L4 and adult counts in each well. In other words, we assumed #L1-L3 larvae = 20 – (#L4 + #adult). Plots shown are from independent screens of (E) 60 μM GlaxoSmithKline Published Kinase Inhibitor set. Statistical analysis by Kruskal-Wallis test with Dunn’s multiple comparisons post-test where *p<0.05, **p<0.01, ***p<0.001.
Figure 2—figure supplement 4
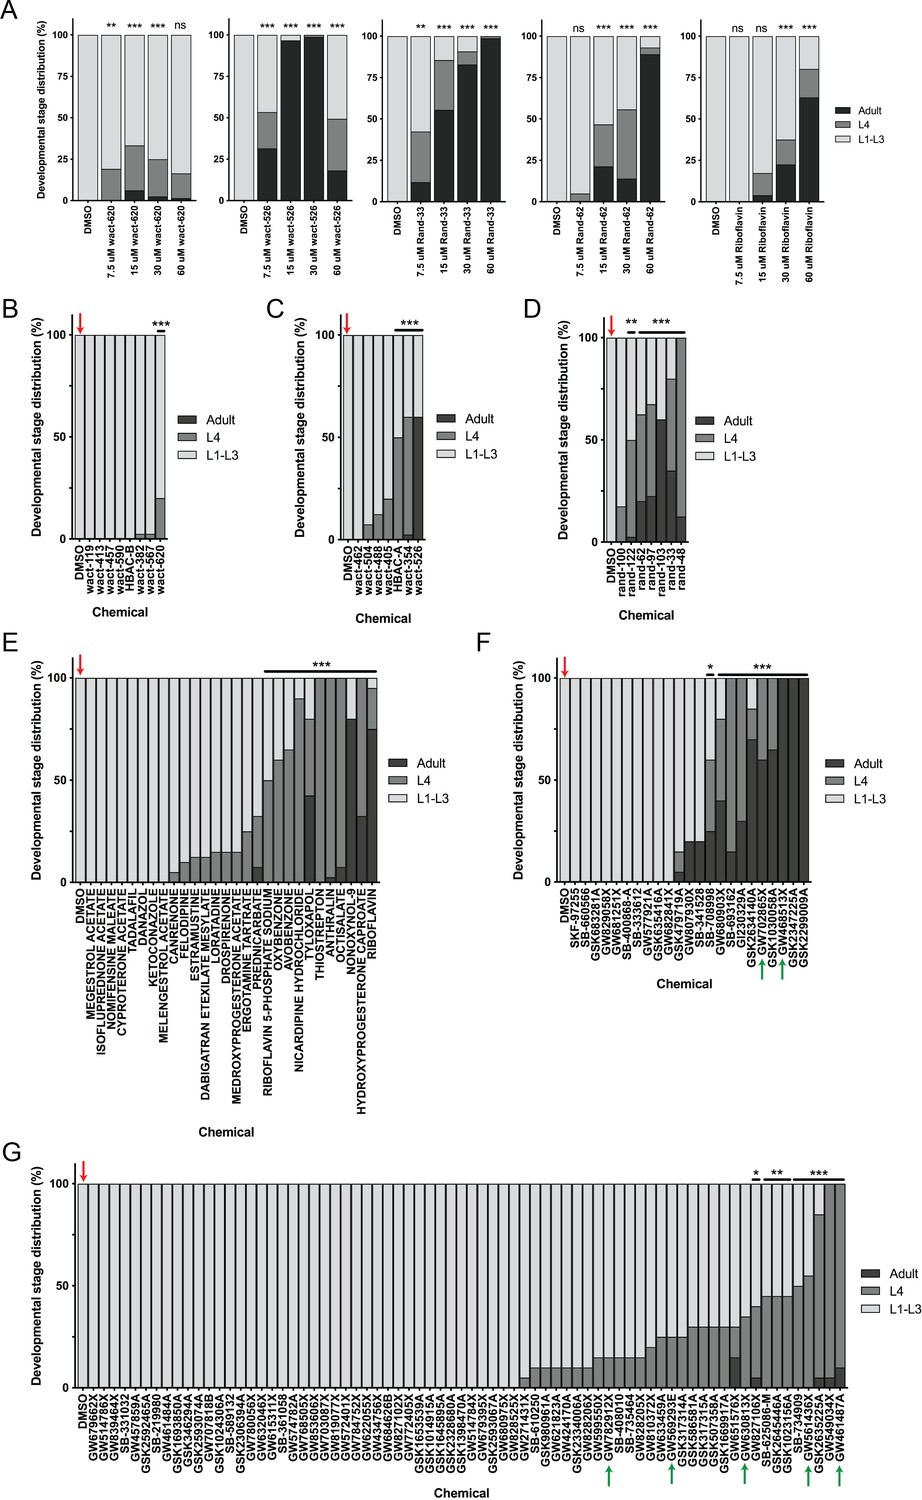
Follow-up testing for compounds identified in the primary screen.
(A) Chemical dose-response re-testing of five compounds shows consistent ability to suppress nemadipine-A-induced growth arrest of unc-68 mutants. Note: wact-526 precipitated at 30 and 60 μM and rand-62 precipitated at 60 μM. (B–G) Post-hoc statistical analysis showing the developmental stage distributions of the 145 re-tested molecules from the primary screen, and identifying those that were significantly different from DMSO wells (red arrows). Again, it is important to note that this was performed while assuming that 20 worms were in each well as a means of estimating the proportion of actual L4 and adult counts in each well. In other words, we assumed #L1-L3 larvae = 20 – (#L4 + #adult). Plots shown are from independent screens of (B) 7.5 μM wactives, (C) 60 μM wactives, (D) 60 μM ‘random’ non-wactives, (E) 60 μM US Drug Collection and (F-G) 60 μM GlaxoSmithKline Published Kinase Inhibitor (PKI) set. In the PKI set, p38 inhibitors that suppressed growth arrest are highlighted by green arrows. Statistical analysis by Kruskal-Wallis test with Dunn’s multiple comparisons post-test where *p<0.05, **p<0.01, ***p<0.001.
Figure 2—figure supplement 5

Heat map visualization of Tanimoto scores from the ‘hit’ compounds (y-axis) screened from the 1280 compounds in the US Drug Collection library (x-axis).
Tanimoto scores were calculated for each pair of compounds as a measure of structural similarity and similar clusters were identified via hierarchical clustering of Tanimoto scores (legend indicates the Tanimoto score). As shown, chemicals with similar molecular fingerprints are associated with similar annotated functions/targets. Fisher’s exact test was used to determine enrichment based on the number of structurally similar members in each cluster that were either hits or not hits out of the total number of the compounds in the library.
Figure 3 with 1 supplement
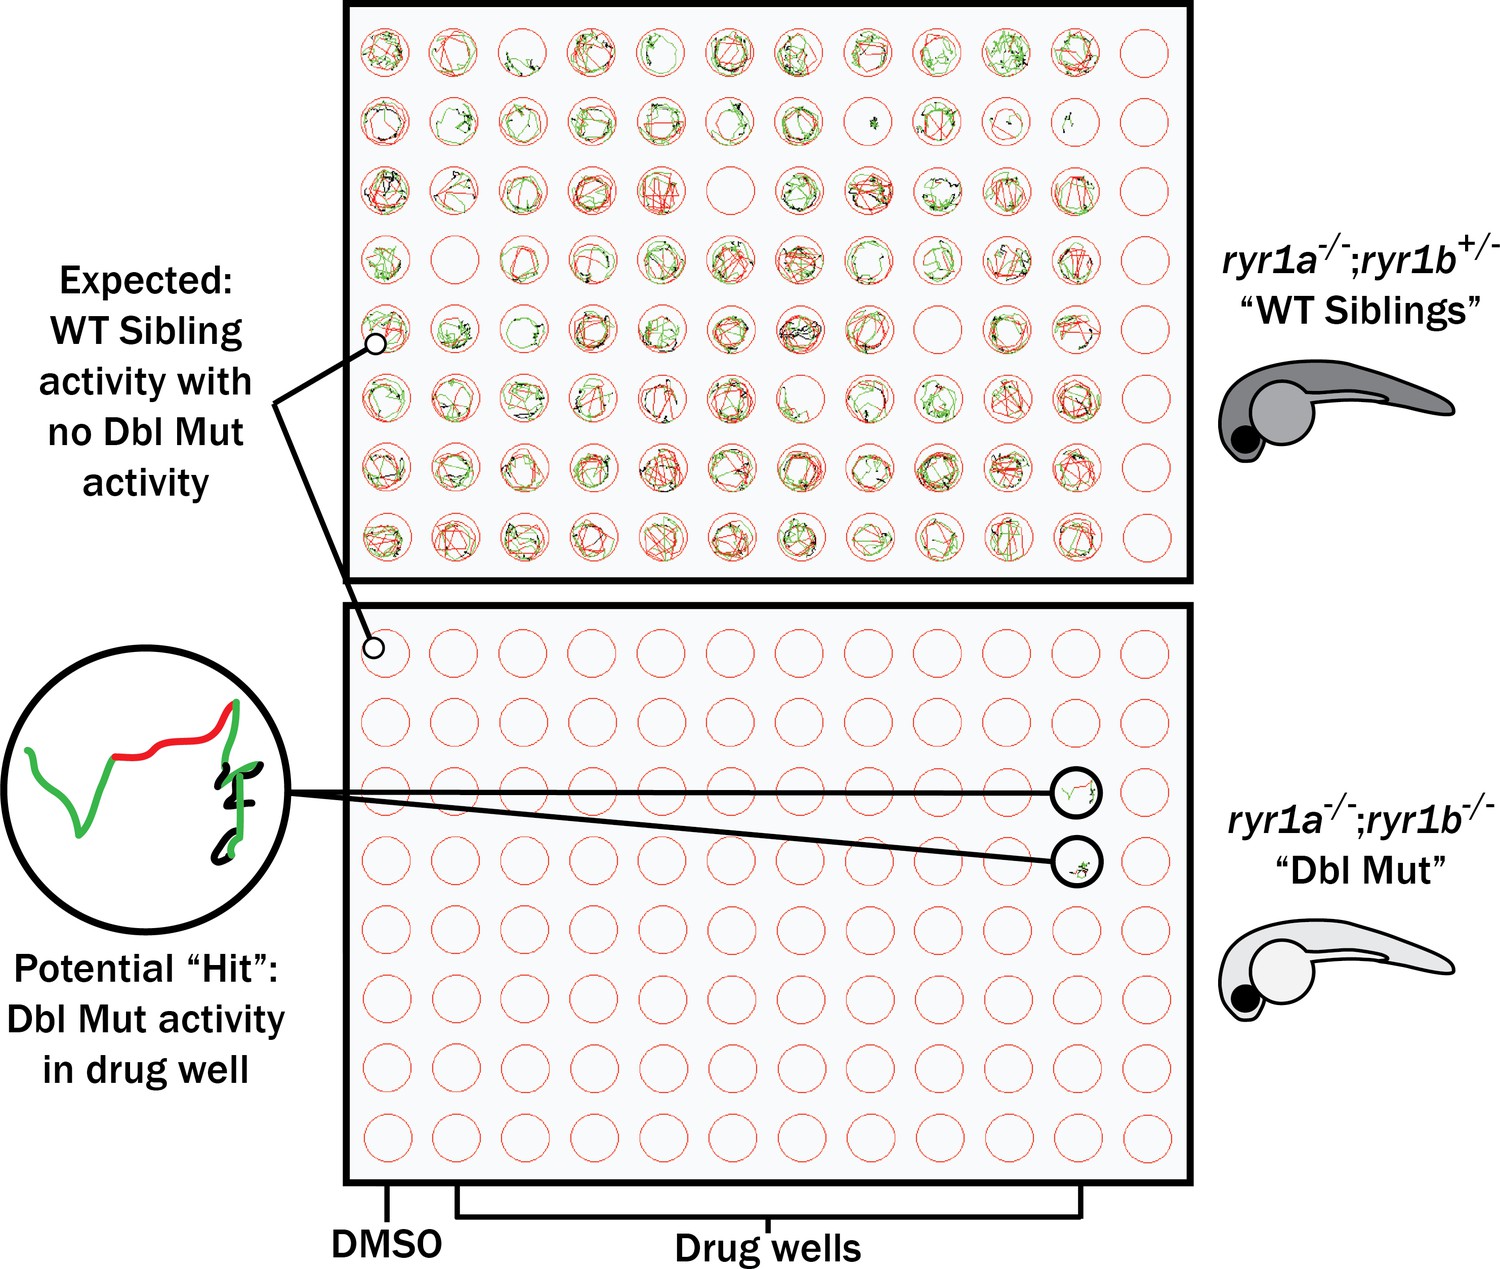
Schematic of our zebrafish screen methodology showing the expected motility of unaffected siblings (‘WT Siblings’) and double mutants (‘Dbl Mut’) and expected motility of immotile double mutants if a chemical suppressed the phenotype.
We did not identify any suppressors of the double mutant phenotype.
Figure 3—figure supplement 1
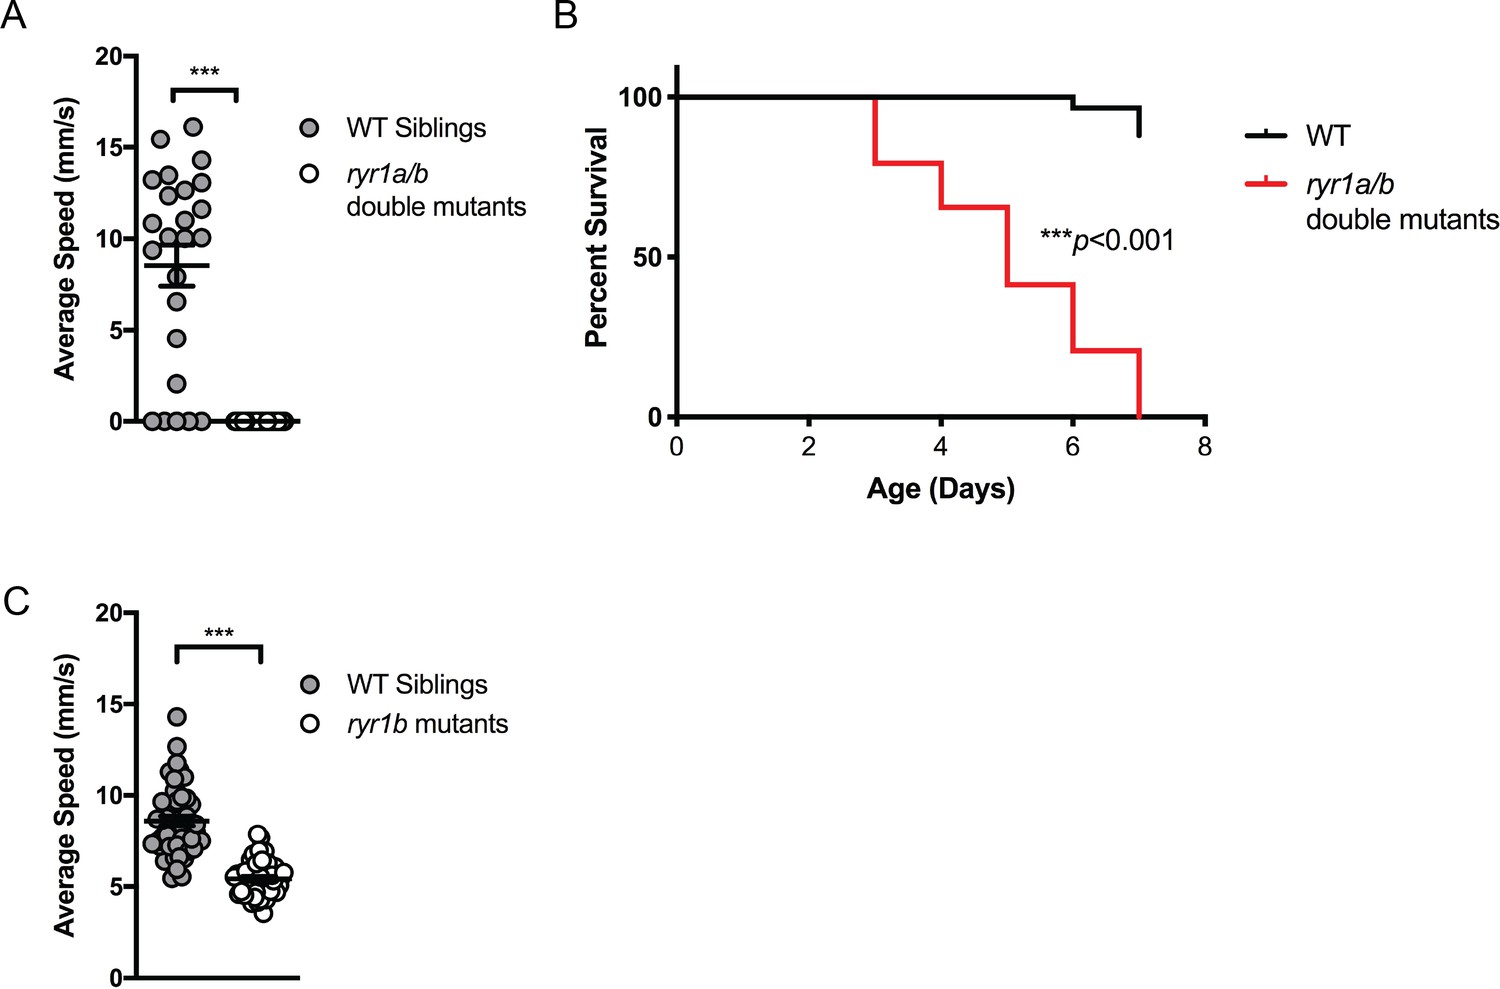
Phenotypes of zebrafish ryr1 mutants considered for chemical screening.
(A) ryr1a;ryr1b double mutants exhibit complete lack of movement as shown by optovin-6b8 induced swimming (n = 24 per genotype; Student’s T-test: ***p<0.001). They do not respond to touch stimuli either data not shown; independently shown by Chagovetz et al. (2019). (B) The ryr1a;ryr1b double mutants exhibit early larval lethality with a median survival of 5 days and maximum survival of 7 days (n = 58 per group; Mantel-Cox: ***p<0.001). (C) The ryr1b mutants show significantly reduced movement speed (n = 48; 5.42 ± 0.1327 mm/s) at four dpf by optovin-6b8 induced swimming versus WT siblings (n = 47; 8.598 ± 0.2728 mm/s) (Student’s t-test: ***p<0.001). However, there is sufficient overlap with WT siblings to preclude large-scale screening.
Figure 4 with 3 supplements
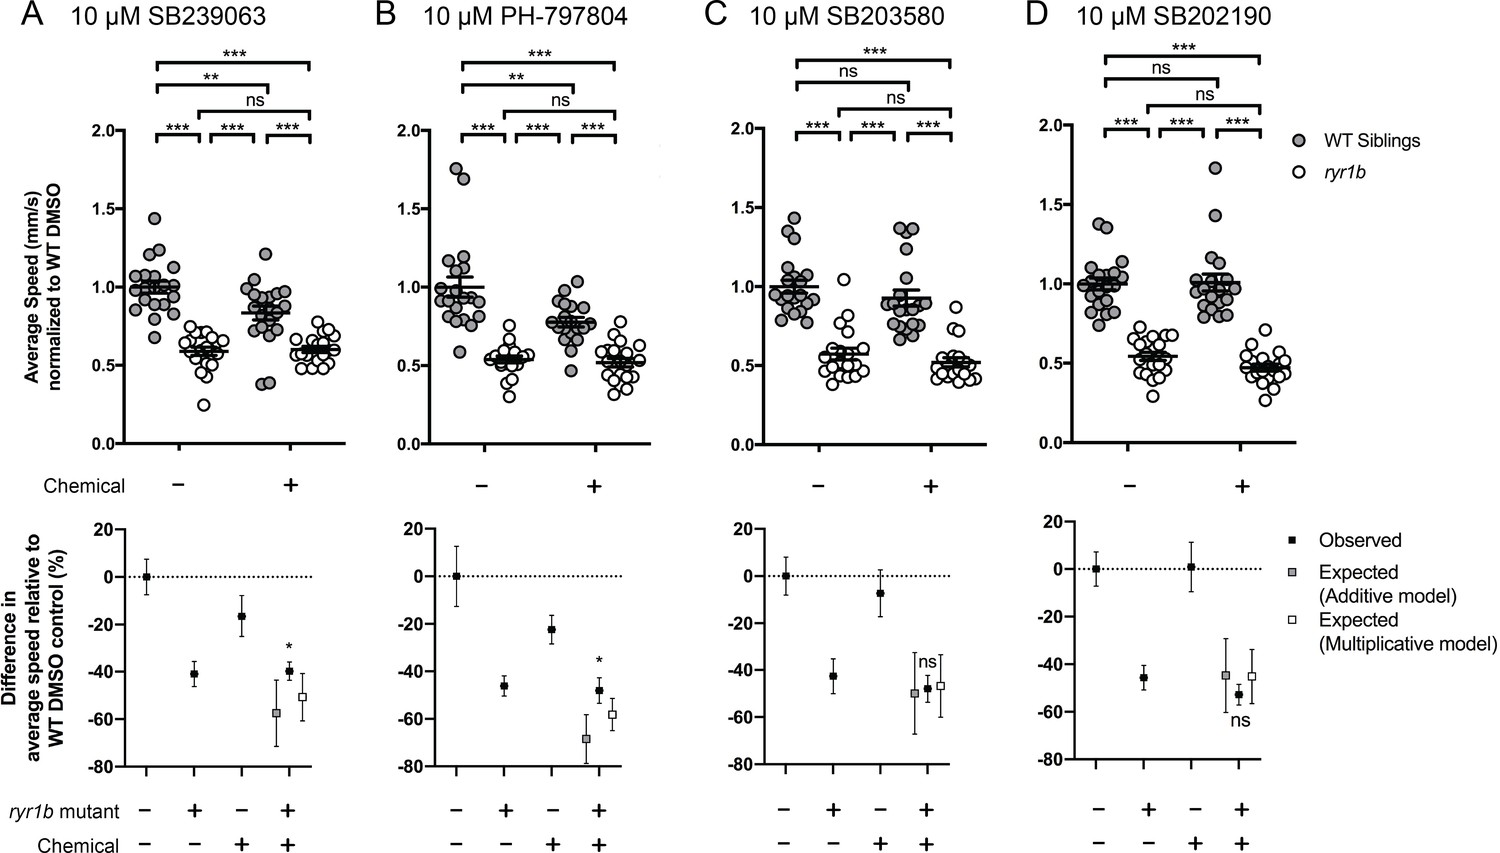
Positive chemical-genetic interactions between p38 inhibitors and ryr1b mutants were observed using zebrafish larval movement speed as a readout.
Compared to the average speed of DMSO WT controls, treatment with (A) SB239063 and (B) PH-797804 reduced the average speed of WT siblings while the expected decrease in movement speed in treated ryr1b was not observed. The difference in average speed of ryr1b+p38 inhibitor compared to WT controls (i.e. WT siblings+DMSO vehicle) is higher than expected given the effects of genotype and chemical alone, indicative of a positive chemical-genetic interaction. Chemical-genetic interactions were not observed for p38 inhibitors (C) SB203580 and (D) SB202190. Data are presented as mean ± SEM movement speed (mm/s) normalized to DMSO-treated WT siblings for n = 2 independent experiments. Statistical analysis by two-way ANOVA followed by Tukey’s multiple comparisons post-test. *p<0.05, **p<0.01, ***p<0.001; Sample size n = 19 or 20 for each treatment group in a set.
Figure 4—figure supplement 1
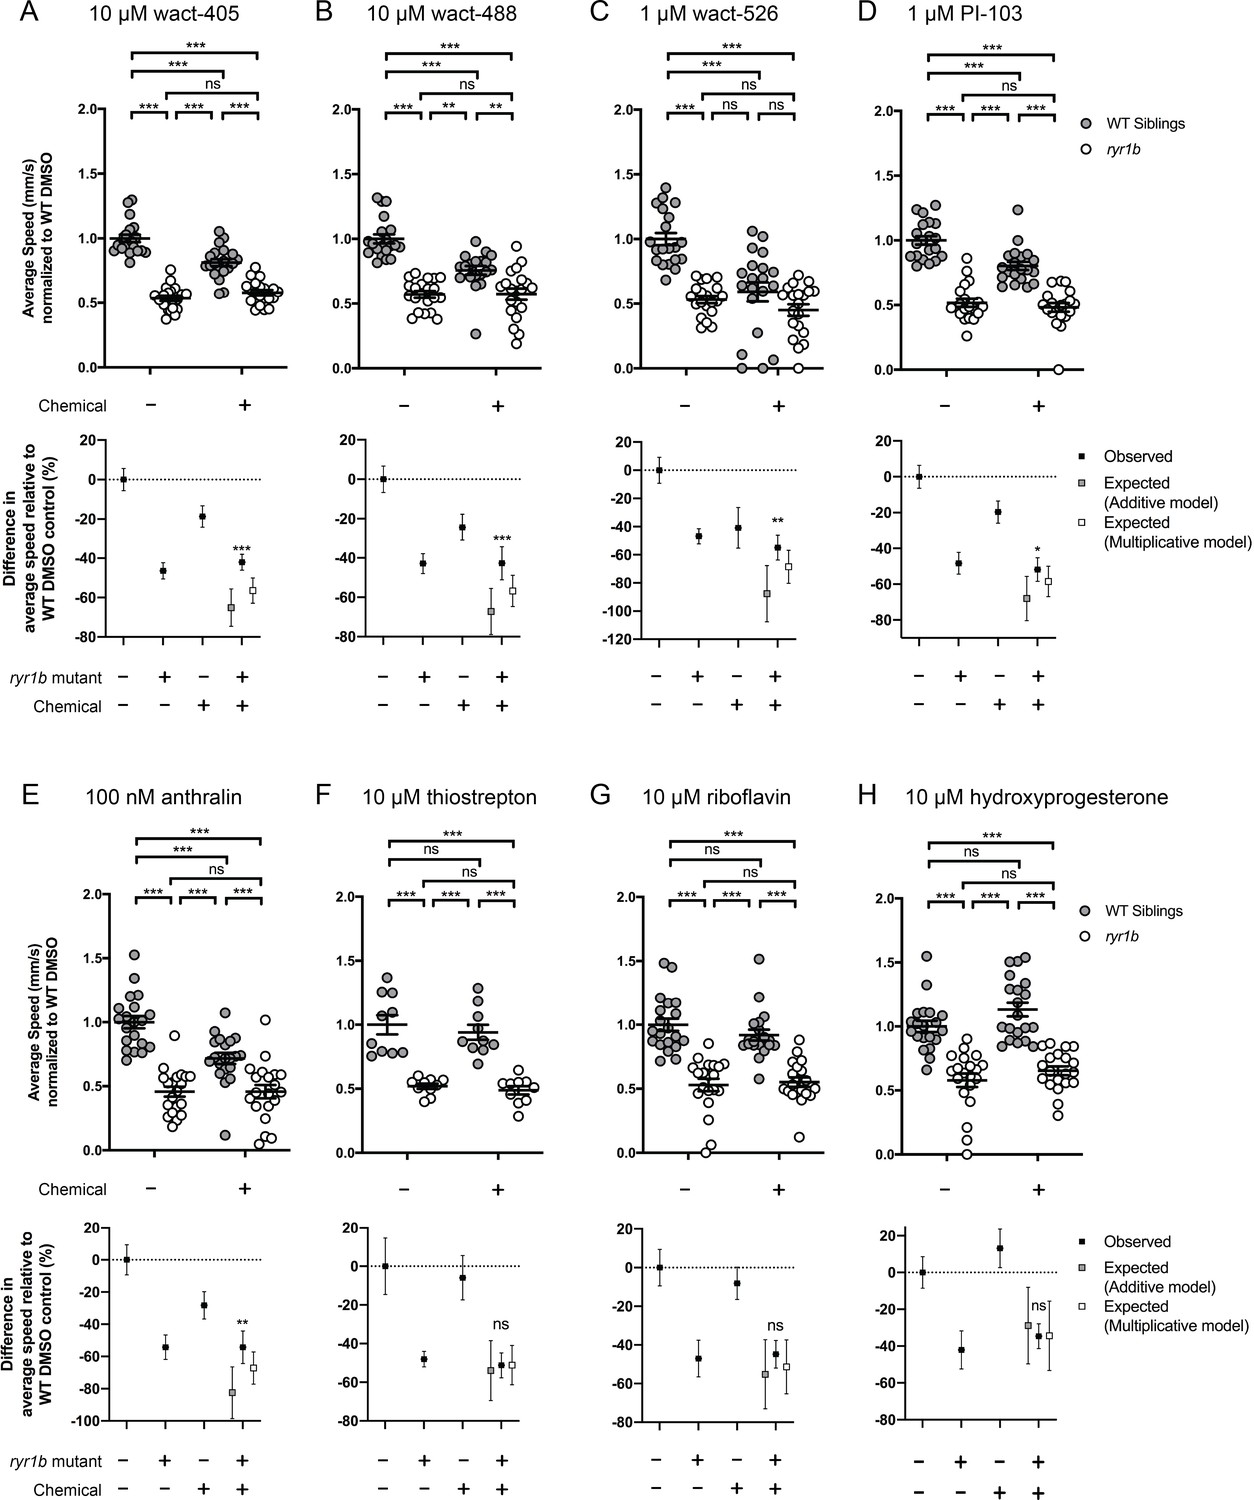
Chemical-genetic interactions were tested using zebrafish larval movement speed as a readout.
Compared to the average speed of DMSO WT controls, treatment with (A) wact-405, (B) wact-488, (C) wact-526, (D) PI3K inhibitor PI-103, and (E) anthralin reduced the average speed of WT siblings while the expected decrease in movement speed in treated ryr1b was not observed. The difference in average speed of ryr1b+p38 inhibitor compared to WT controls (i.e. WT siblings+DMSO vehicle) is higher than expected given the effects of genotype and chemical alone, indicative of a positive chemical-genetic interaction. Chemical-genetic interactions were not observed for the remaining 18 hits from the C. elegans screen when tested in this assay (Figure 4—figure supplement 2–3F–W). Data are presented as mean ± SEM movement speed (mm/s) normalized to DMSO-treated WT siblings for n = 2 independent experiments for (A–E), (G), (H), (K), (L), and R), where sample size n = 19 or 20 for each treatment group in a set and n = 1 experiment and sample size n = 9 or 10 for the remainder. Statistical analysis by two-way ANOVA followed by Tukey’s multiple comparisons post-test. *p<0.05, **p<0.01, ***p<0.001.
Figure 4—figure supplement 2
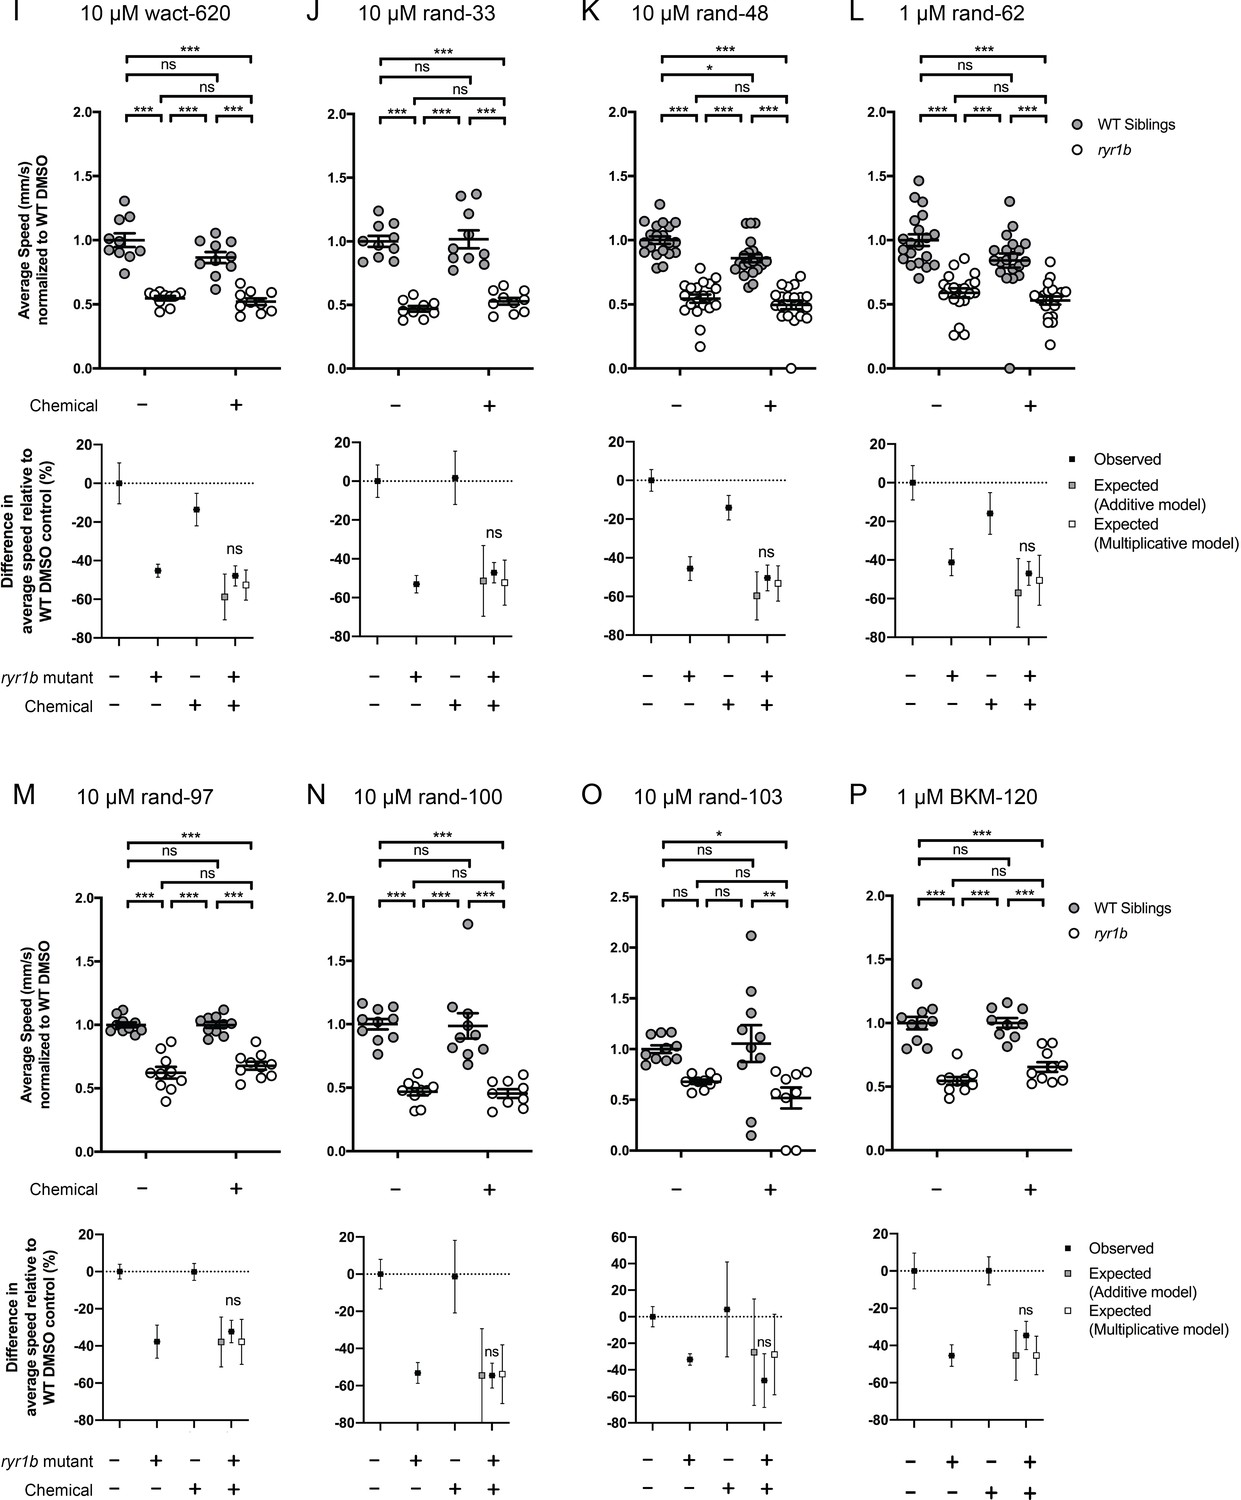
Chemical-genetic interactions were tested using zebrafish larval movement speed as a readout.
Compared to the average speed of DMSO WT controls, chemical-genetic interactions were not observed for 18 hits from the C. elegans screen when tested in this assay (Figure 4—figure supplement 2–3F–W). Data are presented as mean ± SEM movement speed (mm/s) normalized to DMSO-treated WT siblings for n = 2 independent experiments for (A–E), (G), (H), (K), (L), and (R), where sample size n = 19 or 20 for each treatment group in a set and n = 1 experiment and sample size n = 9 or 10 for the remainder. Statistical analysis by two-way ANOVA followed by Tukey’s multiple comparisons post-test. *p<0.05, **p<0.01, ***p<0.001.
Figure 4—figure supplement 3
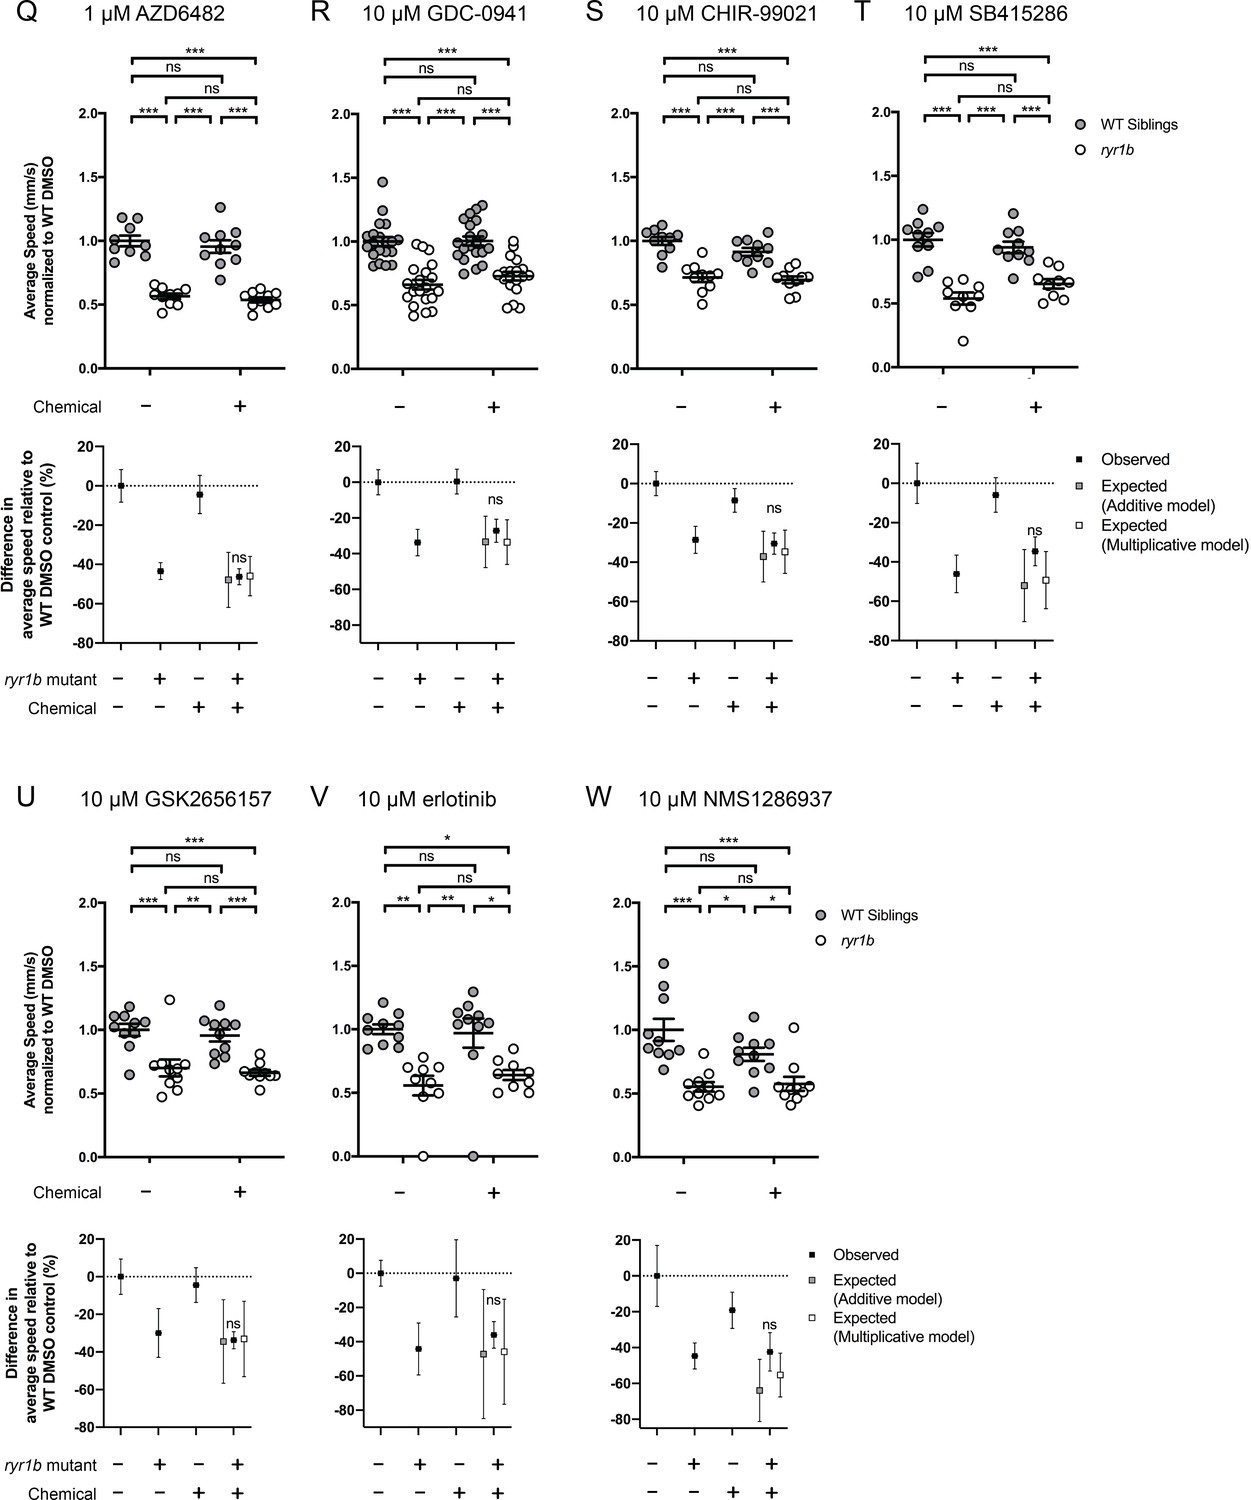
Chemical-genetic interactions were tested using zebrafish larval movement speed as a readout.
Compared to the average speed of DMSO WT controls, chemical-genetic interactions were not observed for 18 hits from the C. elegans screen when tested in this assay (Figure 4—figure supplement 2–3F–W). Data are presented as mean ± SEM movement speed (mm/s) normalized to DMSO-treated WT siblings for n = 2 independent experiments for (A–E), (G), (H), (K), (L), and (R), where sample size n = 19 or 20 for each treatment group in a set and n = 1 experiment and sample size n = 9 or 10 for the remainder. Statistical analysis by two-way ANOVA followed by Tukey’s multiple comparisons post-test. *p<0.05, **p<0.01, ***p<0.001.
Figure 5 with 4 supplements
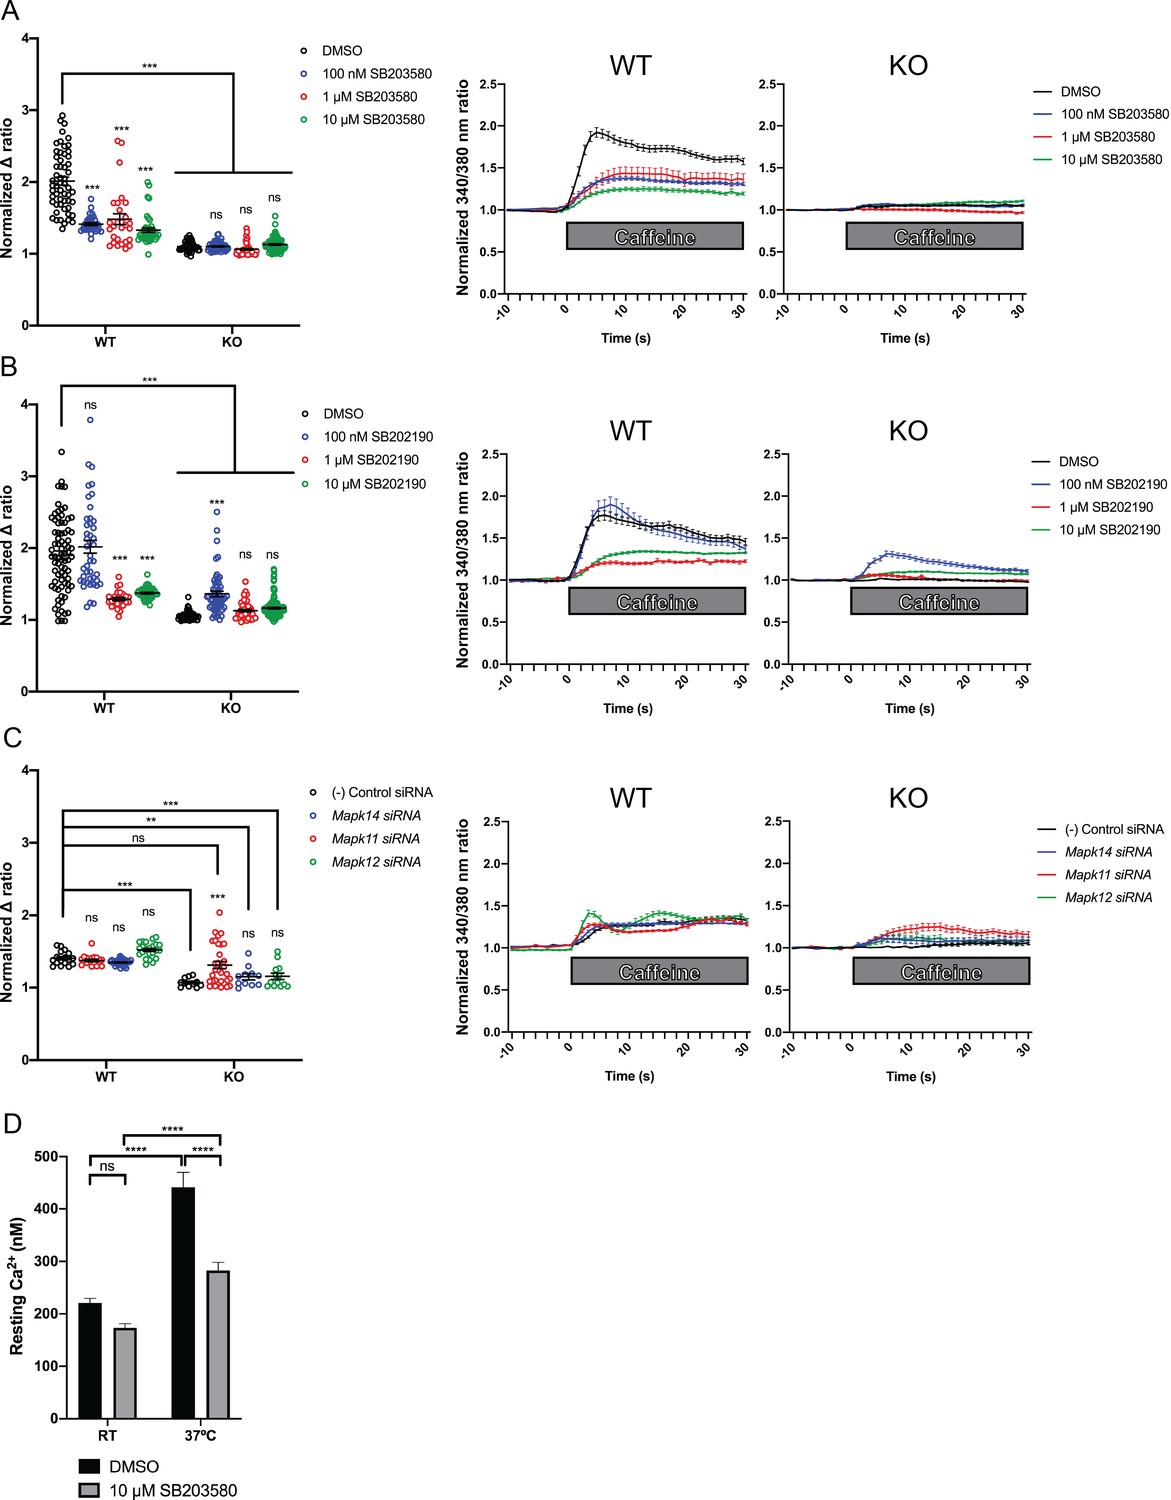
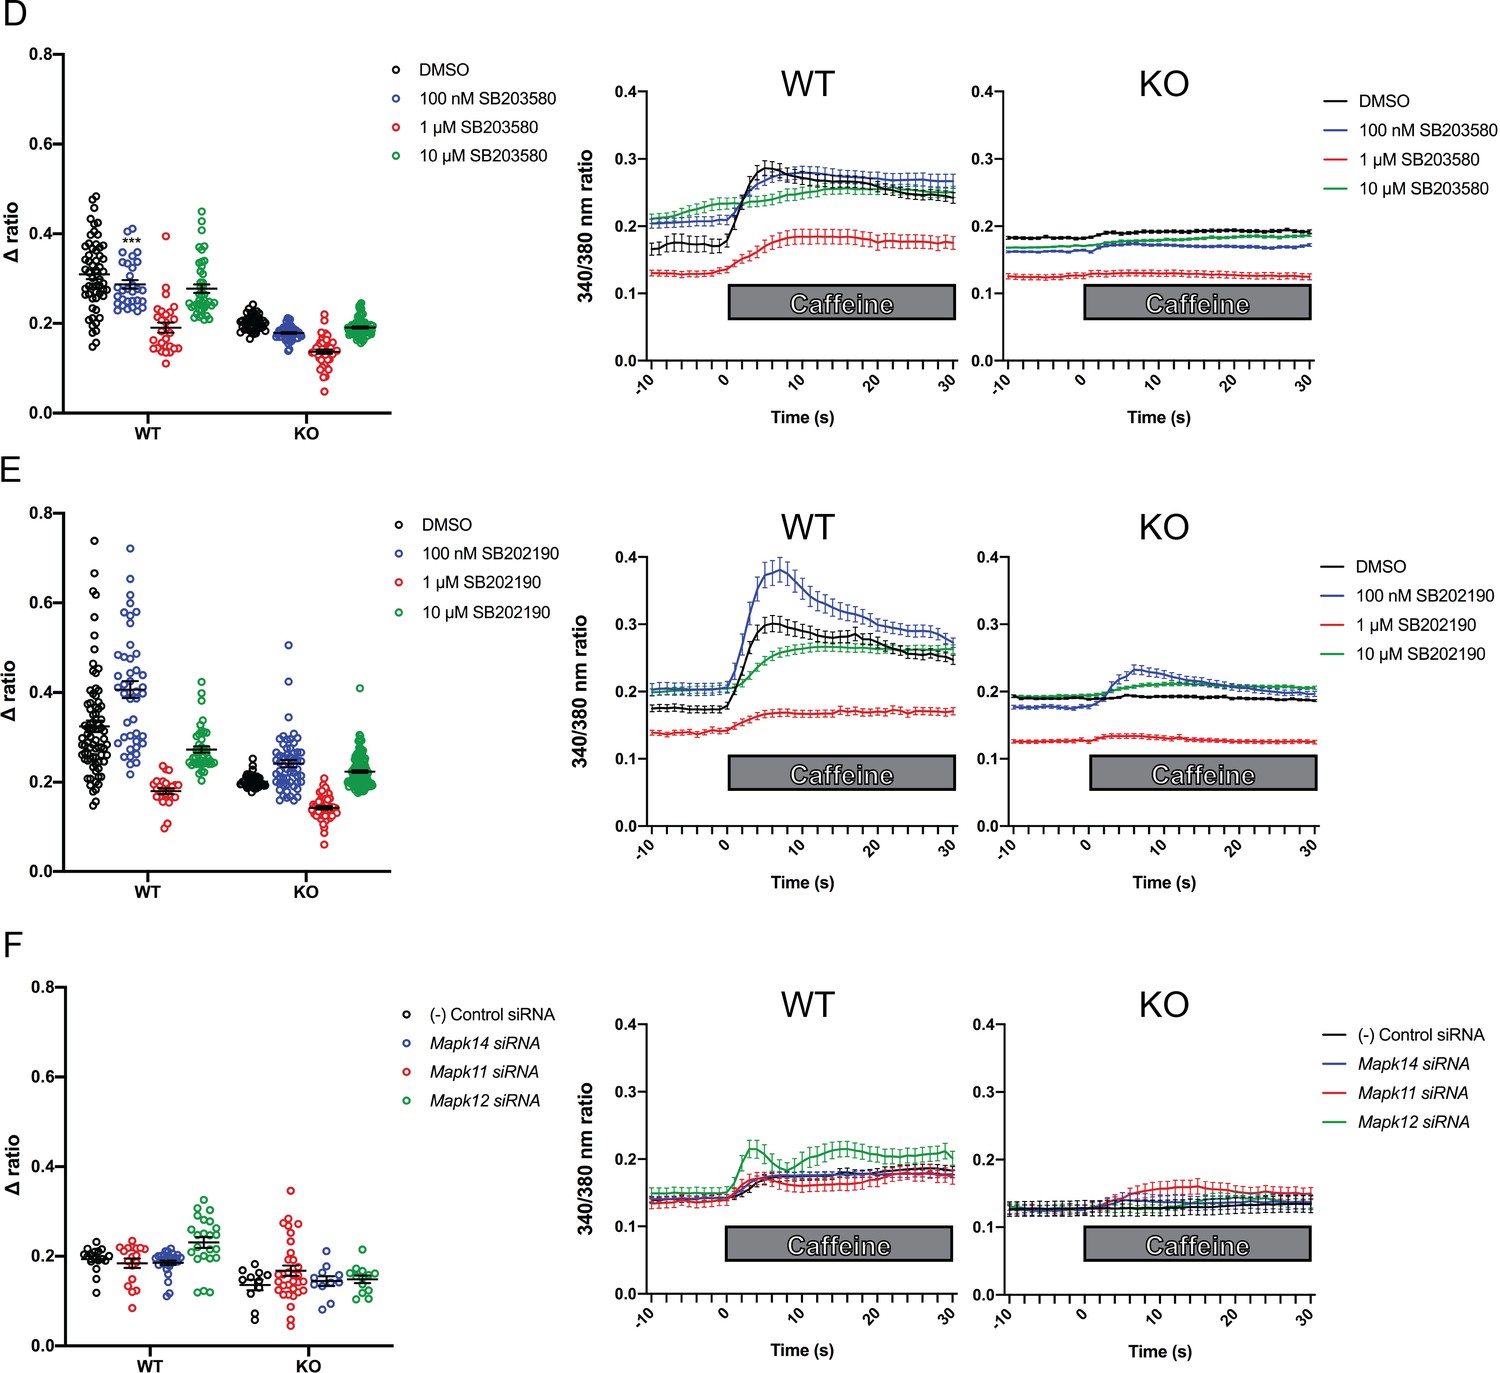
Intracellular calcium measurement in C2C12 myotubes.
Ratiometric fura-2 imaging with 10 mM caffeine induction after treatment with p38 inhibitors (A) SB203580 (# of myotubes from left-right: n = 56, 30, 28, 43, 45, 57, 46, 79) and (B) SB202190 (n = 78, 44, 25, 45, 50, 58, 50, 142) or after (C) siRNA targeting p38α (Mapk14), p38β (Mapk11), and p38γ (Mapk12) (n = 17, 27,18, 23, 11, 11, 33, 13). Panels on the left show the peak change in calcium concentration within 30 s of adding caffeine normalized to the average of 10 s of baseline resting free Ca2+ concentration ([Ca2+]i), that is normalized Δ ratio, while plots on the right show calcium levels normalized to [Ca2+]i after addition of caffeine. This data shows that p38 inhibition or knockdown impairs Ca2+ release in wild type myotubes while promoting some Ca2+ release in Ryr1 knockout cells. Note: labels directly above each group indicate the statistical significance compared to DMSO control within the same genotype. Data are presented as mean ± SEM derived from Ca2+ measurements of individual myotubes (Figure 5—figure supplement 3A–C). Corresponding plots showing [Ca2+]i levels without normalization are also provided (Figure 5—figure supplement 4D–F). Statistical analysis by two-way ANOVA followed by Tukey’s multiple comparisons post-test where *p<0.05, **p<0.01, ***p<0.001. (D) Overnight treatment of myotubes from Y522S mutant mice with 10 μM SB203580 significantly reduced a temperature-dependent increase in resting Ca2+ concentration.
Figure 5—figure supplement 1
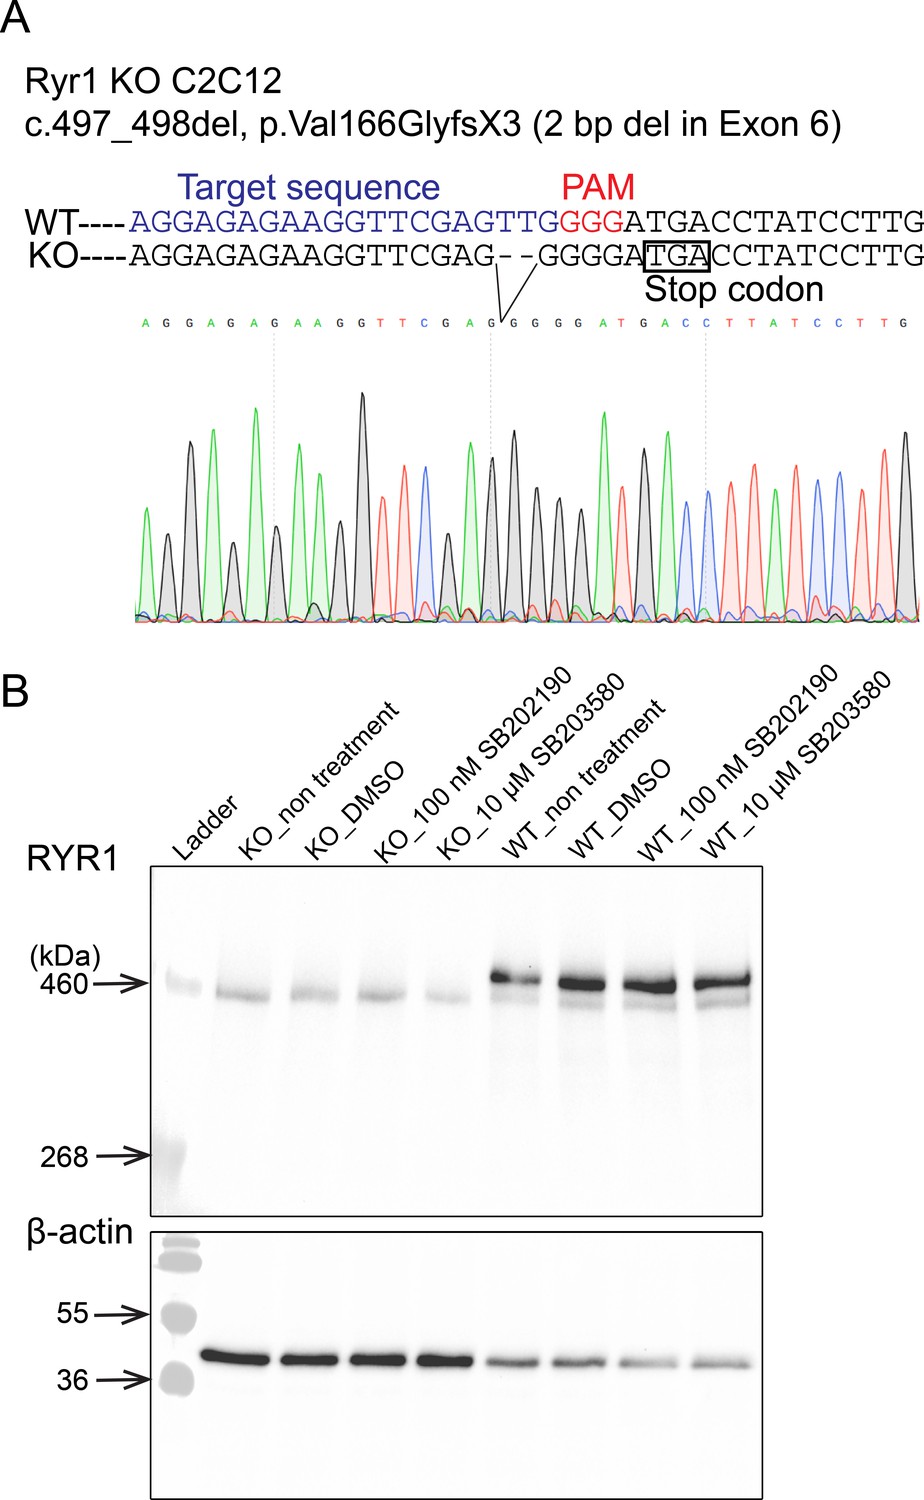
Characterization of Ryr1 knockout (KO) C2C12 cells.
(A) DNA sequence of Ryr1 KO showing frameshift mutation and premature stop codon. (B) Western blotting analysis of RyR1 in C2C12 myotubes at after 5 days of differentiation.
Figure 5—figure supplement 2
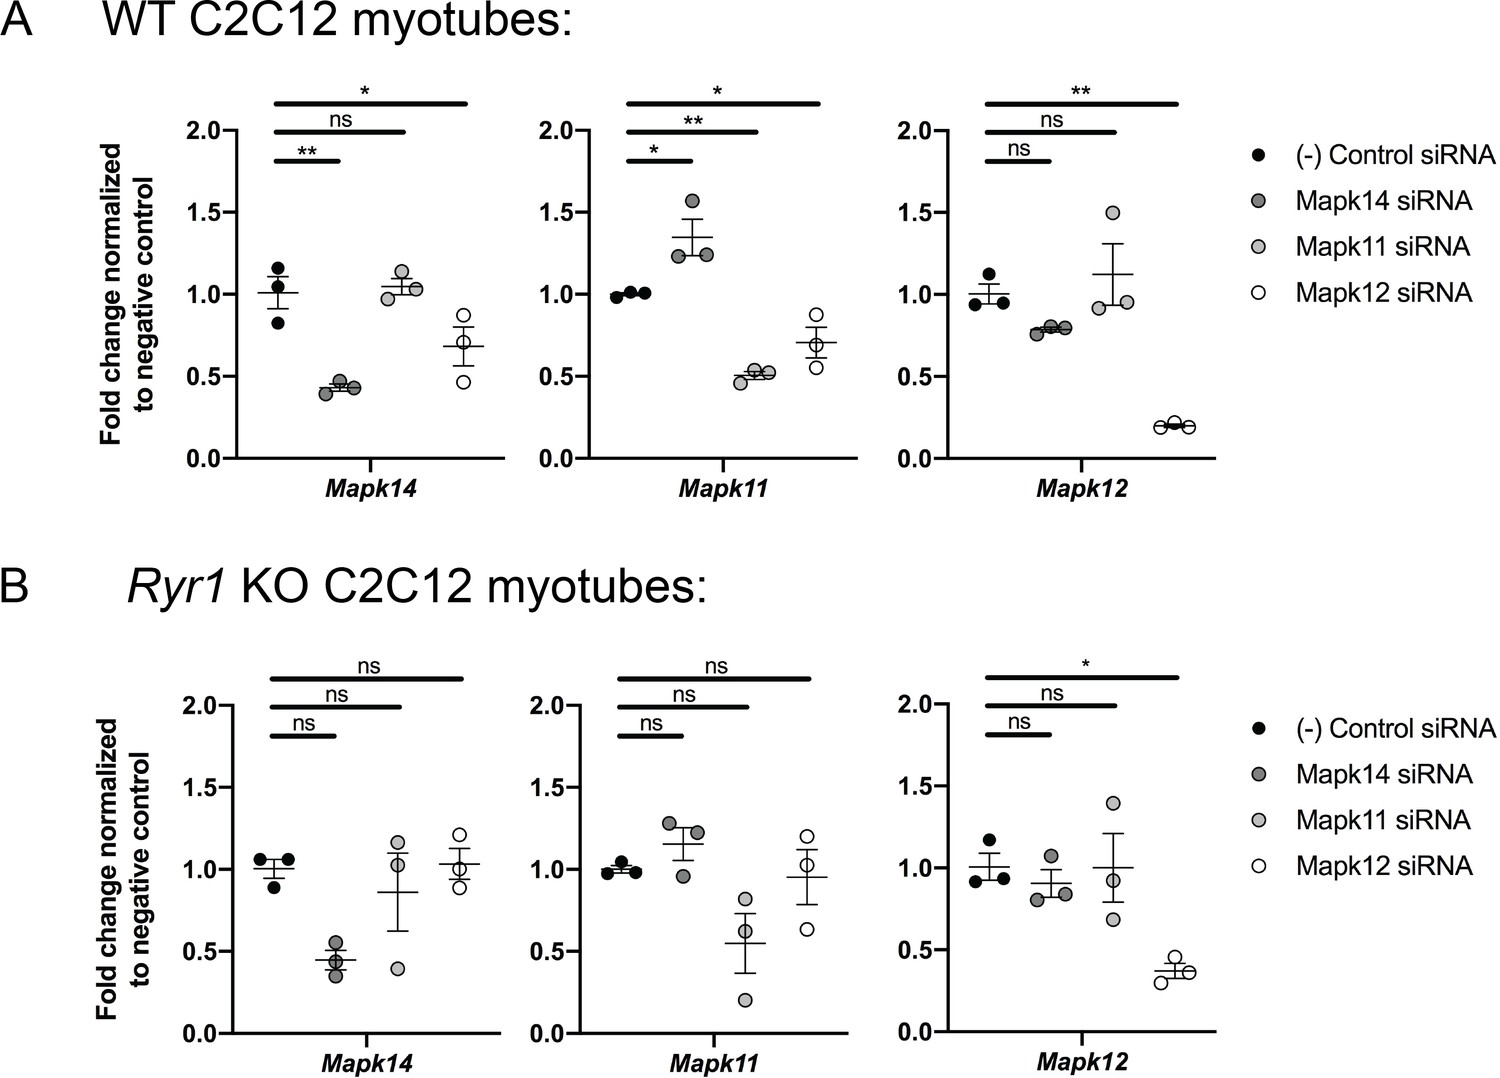
Quantitative PCR analysis was performed to validate the efficiency of siRNA knockdown of three p38 MAPK genes in both WT and Ryr1 KO myotubes.
As shown, the siRNAs reduce target gene expression by >50% in WT cells (A) while the degree of knockdown achieved in Ryr1 KO myotubes (B) was more variable. Data are presented as mean ± SEM fold change for n = 3 independent myotube cultures. Statistical analysis by one-way ANOVA followed by Holm-Sidak’s multiple comparisons post-test to compare each group to the negative control siRNA. *p<0.05, **p<0.01, ***p<0.001.
Figure 5—figure supplement 3
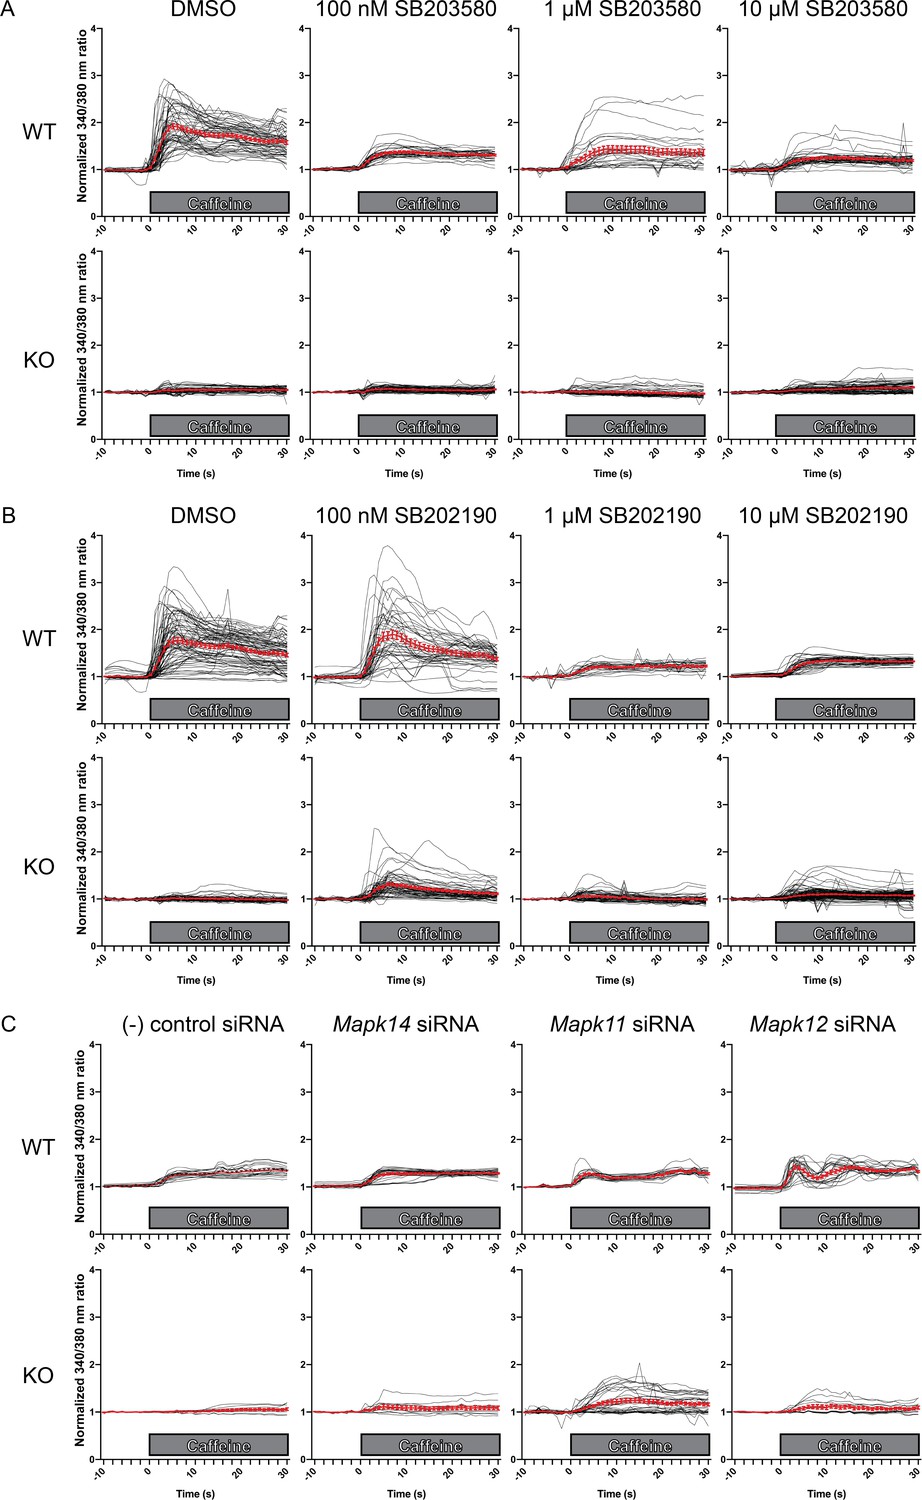
Intracellular calcium measurement in C2C12 myotubes.
Ratiometric fura-2 imaging with 10 mM caffeine induction after treatment with A) SB203580, (B) SB202190, and C) p38 MAPK siRNAs. Black lines indicate individual myofibers while red lines present the mean ± SEM as show in Figure 5. Ratiometric 340/380 data were normalized to the average of 10 s of baseline resting free Ca2+ concentration ([Ca2+]i), that is normalized Δ ratio.
Figure 5—figure supplement 4
Intracellular calcium measurement in C2C12 myotubes.
Ratiometric fura-2 imaging with 10 mM caffeine induction after treatment with D) SB203580, (E) SB202190, and F) p38 MAPK siRNAs. Panels on the left show the peak change in calcium concentration from [Ca2+]i within 30 s of adding caffeine without normalization (i.e. Δ ratio), while plots on the right show [Ca2+]i followed by changes in fura-2 340/380 nm ratio after addition of caffeine.
Tables
Key resources table
| Reagent type (species) or resource | Designation | Source or reference | Identifiers | Additional information |
|---|---|---|---|---|
| Genetic reagent (C. elegans) | unc-68(r1162) | C. elegans Genetics Center (University of Minnesota) | Strain TR2171 RRID:WB-STRAIN:WBStrain00034950 | |
| Genetic reagent (C. elegans) | unc-68(r1161) | C. elegans Genetics Center (University of Minnesota) | Strain TR2170 RRID:WB-STRAIN:WBStrain00034949 | |
| Strain, strain background (E. coli) | HB101 | C. elegans Genetics Center (University of Minnesota) | ||
| Strain, strain background (E. coli) | HT115 (DE3) | C. elegans RNAi Collection (Ahringer) from Source BioScience | Clones IV-9P08 (pmk-1), IV-4G23 (pmk-2), IV-4I01 (pmk-3), and I-1K04 (pop-1) | RNAi library |
| Genetic reagent (D. rerio) | ryr1a(z42) | Chagovetz et al., 2019 | ZFIN ID: ZDB-ALT-180925–10 | |
| Genetic reagent (D. rerio) | ryr1b(mi340) | Hirata et al. (2007) | ZFIN ID: ZDB-ALT-070928–1 | |
| Chemical compound, drug | The US Drug Collection | MicroSource Discovery Systems, Inc | Chemical library | |
| Chemical compound, drug | DiscoveryProbe Kinase Inhibitor Library | APExBIO | Catalog #L1024 | Chemical library |
| Chemical compound, drug | Nemadipine-A | ChemBridge | Catalog #5619779 | |
| Chemical compound, drug | Optovin analog 6b8 | ChemBridge | Catalog #5707191 | |
| Chemical compound, drug | SB203580 | Sigma | Catalog #S8307 | |
| Chemical compound, drug | SB202190 | Sigma | Catalog #S7067 | |
| Cell line (M. musculus) | C2C12 myoblasts | ATCC | Catalog #CRL1772 | |
| Cell line (M. musculus) | Ryr1 KO C2C12 myoblasts | This paper | 2 bp deletion in exon 6 of Ryr1: c.497_498del, p.Val166GlyfsX3 | |
| Antibody | anti-Ryanodine receptor (Mouse monoclonal) | Developmental Studies Hybridoma Bank (University of Iowa) | Catalog #34C, RRID:AB_528457 | WB (1:100) |
| Antibody | anti- beta actin (Mouse monoclonal) | Abcam | Catalog #ab8226 RRID:AB_306371 | WB (1:5000) |
| Sequence-based reagent | ON-TARGETplus Mouse Mapk11 siRNA | Horizon Discovery (Dharmacon) | Catalog # J-050928-05-0010 | Target sequence: 5’-AUGAGGAGAUGACCGGAUA-3’ |
| Sequence-based reagent | ON-TARGETplus Mouse Mapk12 siRNA | Horizon Discovery (Dharmacon) | Catalog # J-062913-05-0010 | Target sequence: 5’-AAUGGAAGCGUGUGACUUA-3’ |
| Sequence-based reagent | ON-TARGETplus Mouse Mapk14 siRNA | Horizon Discovery (Dharmacon) | Catalog # J-040125-06-0010 | Target sequence: 5’-GCAAGAAACUACAUUCAGU-3’ |
| Sequence-based reagent | ON-TARGETplus Non-targeting siRNA #1 | Horizon Discovery (Dharmacon) | Catalog # D-001810-01-05 | Target sequence: 5’-UGGUUUACAUGUCGACUAA-3’ |
| Sequence-based reagent | Tbp forward primer | This paper | Mouse Tbp gene: ENSMUSG00000014767 | 5’-TGCTGCAGTCATCATGAG-3’ |
| Sequence-based reagent | Tbp reverse primer | This paper | Mouse Tbp gene: ENSMUSG00000014767 | 5’-CTTGCTGCTAGTCTGGATTG-3’ |
| Sequence-based reagent | Mapk11 forward primer | This paper | Mouse Mapk11 gene: ENSMUSG00000053137 | 5’-CCAGCAATGTAGCGGTGAACGAG-3’ |
| Sequence-based reagent | Mapk11 reverse primer | This paper | Mouse Mapk11 gene: ENSMUSG00000053137 | 5’-GCATGATCTCTGGCGCCCGGTAC-3’ |
| Sequence-based reagent | Mapk12 forward primer | This paper | Mouse Mapk12 gene: ENSMUSG00000022610 | 5’-CACTGAGGATGAACCCAAGGCC-3’ |
| Sequence-based reagent | Mapk12 reverse primer | This paper | Mouse Mapk12 gene: ENSMUSG00000022610 | 5’-CTCCTAGCTGCCTAGGAGGCTTG-3’ |
| Sequence-based reagent | Mapk14 forward primer | This paper | Mouse Mapk14 gene: ENSMUSG00000053436 | 5’-CAGCAGATAATGCGTCTGACGGG-3’ |
| Sequence-based reagent | Mapk14 reverse primer | This paper | Mouse Mapk14 gene: ENSMUSG00000053436 | 5’-GCGAAGTTCATCTTCGGCATCTGG-3’ |
| Commercial assay or kit | RNeasy Mini Kit | Qiagen | Catalog #74104 |
Additional files
-
Source data 1
Data files for the C. elegans chemical screen, zebrafish motility assays, and myotube calcium measurements.
- https://cdn.elifesciences.org/articles/52946/elife-52946-data1-v2.zip
-
Supplementary file 1
List of 74 chemicals that suppressed the synthetic, nemadipine-A-induced unc-68 growth arrest.
- https://cdn.elifesciences.org/articles/52946/elife-52946-supp1-v2.xlsx
-
Supplementary file 2
List of individual chemicals used in this study.
This list does not include all of the chemicals present in the chemical libraries screened.
- https://cdn.elifesciences.org/articles/52946/elife-52946-supp2-v2.xlsx
-
Transparent reporting form
- https://cdn.elifesciences.org/articles/52946/elife-52946-transrepform-v2.pdf
Download links
A two-part list of links to download the article, or parts of the article, in various formats.
Downloads (link to download the article as PDF)
Open citations (links to open the citations from this article in various online reference manager services)
Cite this article (links to download the citations from this article in formats compatible with various reference manager tools)
Identification of drug modifiers for RYR1-related myopathy using a multi-species discovery pipeline
eLife 9:e52946.
https://doi.org/10.7554/eLife.52946


