A complex regulatory landscape involved in the development of mammalian external genitals
- School of Life Sciences, Ecole Polytechnique Fédérale de Lausanne (EPFL), Switzerland
- Department of Genetics and Evolution, University of Geneva, Switzerland
- Collège de France, France
Figures
Figure 1 with 1 supplement
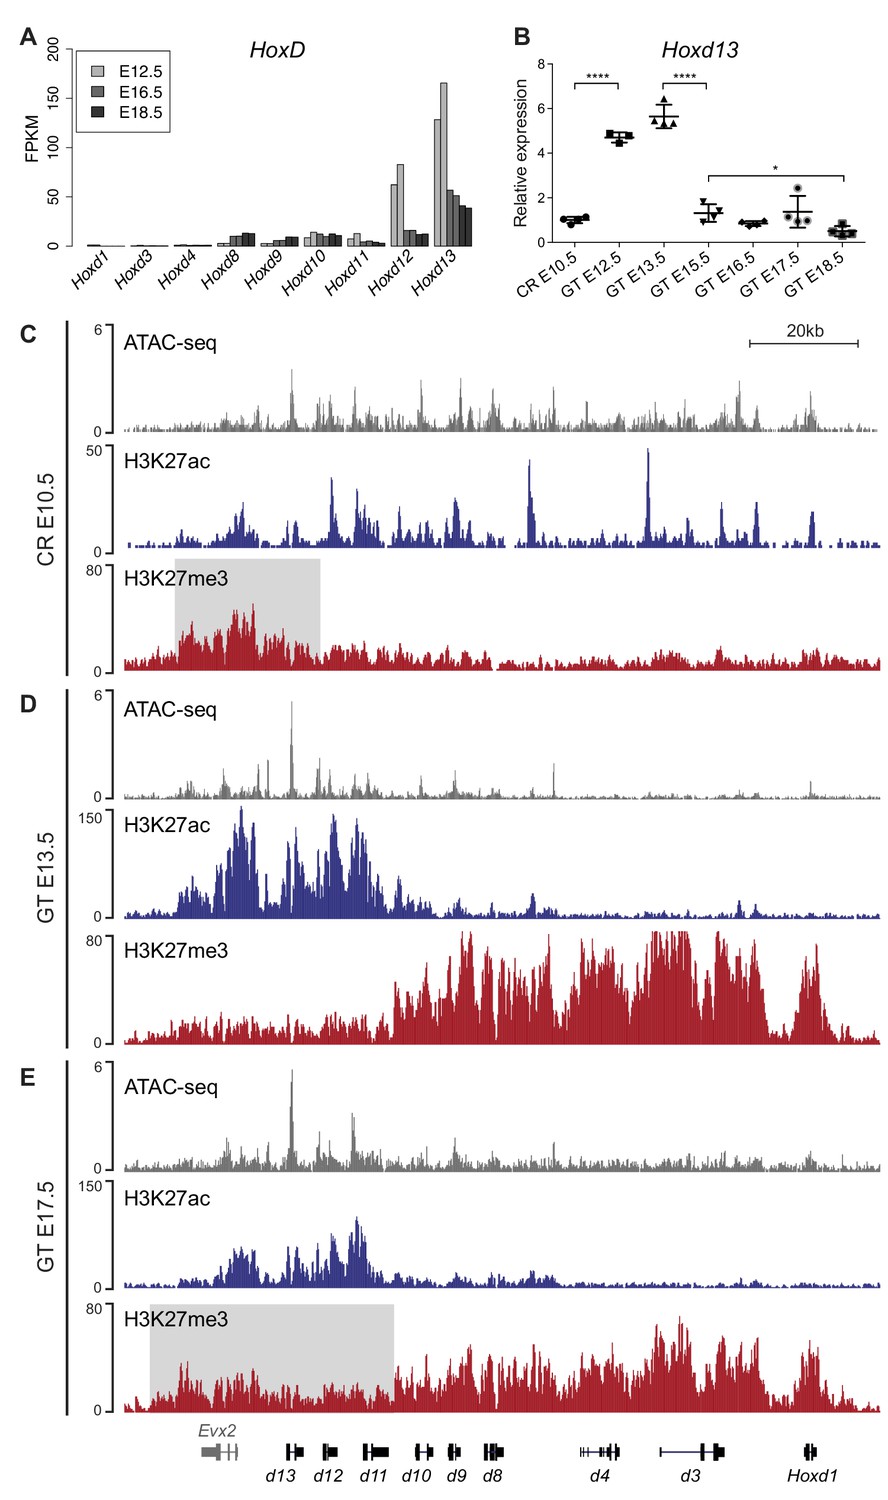
Transcription of Hoxd genes in developing GT.
(A) Quantification of Hoxd genes transcript levels by RNA-seq (FPKM values) in GT at E12.5 (Amândio et al., 2016), E16.5 and E18.5. (B) RT-qPCR of Hoxd13 mRNAs in different stages of GT development. The plotted values indicate the ratio of expression using the cloaca region (CR) as a reference (n ≥ 3 biological replicates for each sample). A Welch’s t-test was used to evaluate the putative significant changes in Hoxd13 expression. Bars indicate mean with SD, ****p<0.0001, *p=0.0175. (C–E) ATAC-seq (gray) and ChIP-seq profiles for H3K27ac (blue) and H3K27me3 (red) at the HoxD locus in E10.5 wildtype CR (C), E13.5 GT (D) and E17.5 GT (E). Coordinates (mm10): chr2:74637433–74775728. The gray box in track three indicates the enrichment of H3K27me3 at 5’-located Hoxd genes in the CR. The gray box in track nine indicates the relative gain of H3K27me3 at 5’-located Hoxd genes in E17.5 GT when compared to the E13.5 GT sample.
-
Figure 1—source data 1
Hoxgenes expression values (FPKM and RT-qPCR) during GT development.
- https://cdn.elifesciences.org/articles/52962/elife-52962-fig1-data1-v2.xlsx
Figure 1—figure supplement 1
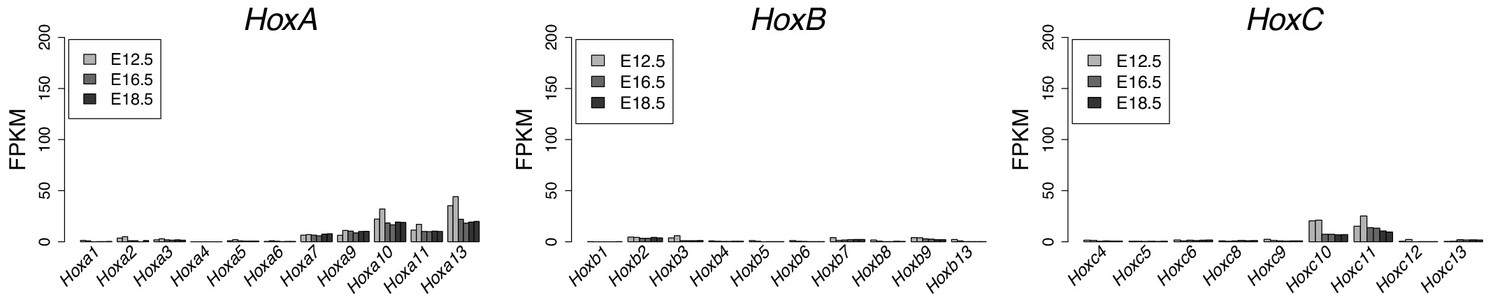
Hox genes expression profile during GT development.
Bar plots show the quantification of Hoxa, Hoxb and Hoxc genes transcripts by RNA-seq (FPKM values) in GT cells at E12.5, E16.5 and E18.5. The gene cluster is indicated on top of each bar plot.
Figure 2 with 1 supplement
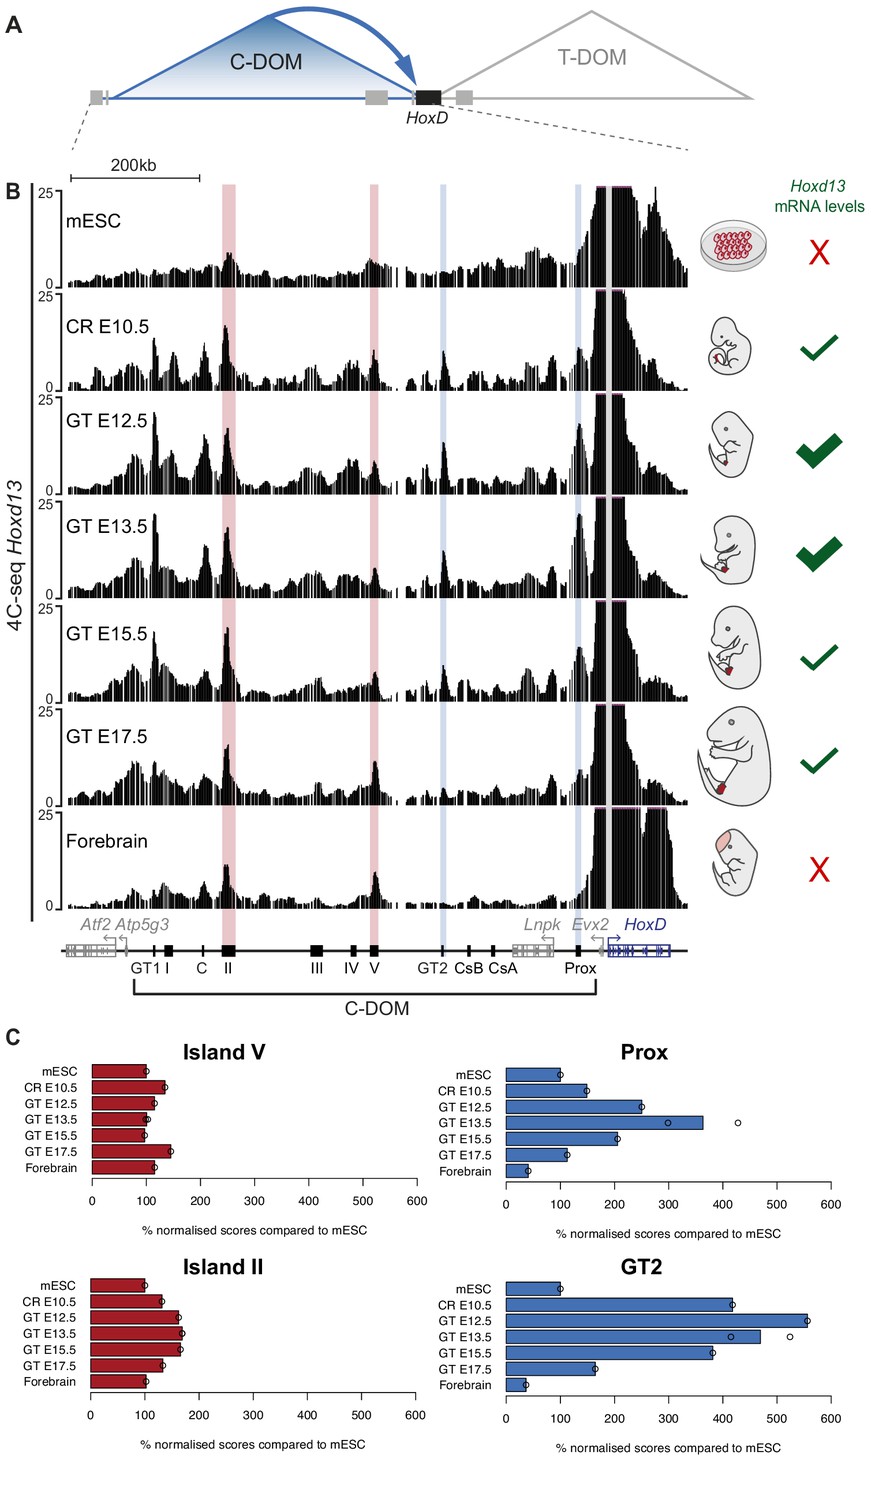
Chromatin topology of C-DOM during GT development.
(A) Schematic representation of the two regulatory landscapes, with the centromeric (C-DOM) and telomeric (T-DOM) TADs flanking the HoxD cluster (black box), which acts as a TAD boundary. Gray boxes represent non-Hox genes. The cis-regulatory elements involved in the control of Hoxd gene transcription in the GT are located in C-DOM (blue arrow). (B) 4C-seq interactions profiles between the Hoxd13 viewpoint (gray line) and both the HoxD cluster and the C-DOM. From top to bottom, 4C-seq profiles from mouse ES cells (mESC; track 1) (Noordermeer et al., 2014), E10.5 CR, E12.5 GT, E13.5 GT, E15.5 GT, E17.5 GT and fetal forebrain cells (track 7) are represented. Coordinates (mm10): chr2:73815520–74792376. A schematic representation of the HoxD cluster and the C-DOM is shown below with known enhancers as black boxes. The vertical blue lines highlight changes in chromatin interactions between Hoxd13 and both Prox and GT2 in the different developmental stages and tissues analyzed. Vertical red lines highlight the contacts between Hoxd13 and island II or island V, which remained fairly constant in all samples analyzed. The mRNA levels of Hoxd13 in each condition are schematized on the right side of the corresponding profile. (C) Bar plots showing the quantification of the ratio of the number of normalized reads (+/- 5 Mb around the viewpoint) in selected regulatory regions, using mouse ES cells as a reference. Open circles represent each individual replicate. The regulatory element analyzed is indicated on top of each plot.
Figure 2—figure supplement 1
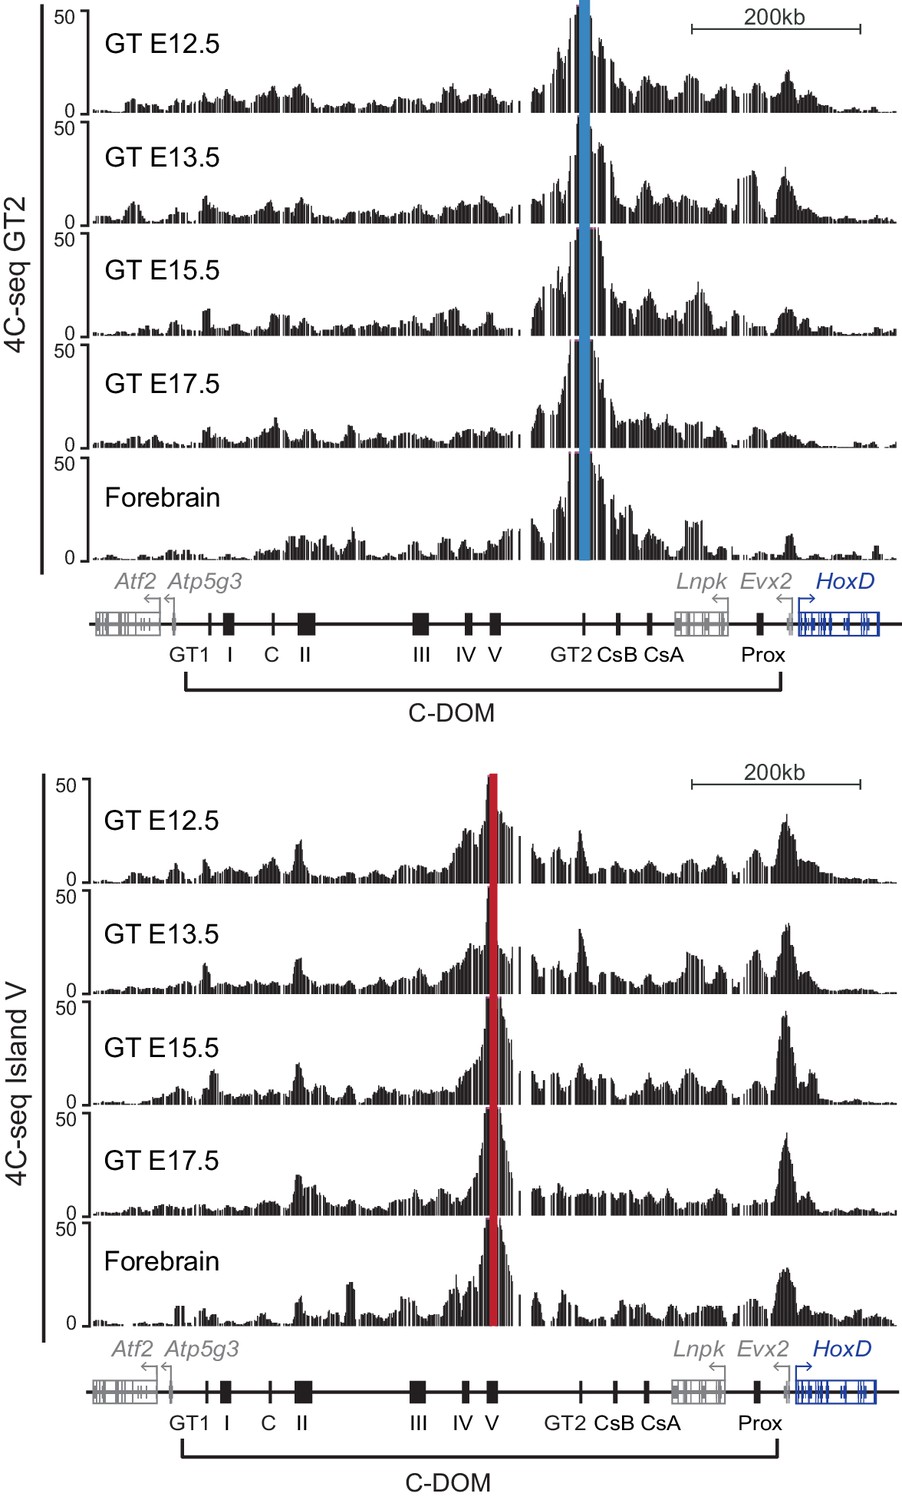
Chromatin interactions in C-DOM during GT development.
4C-seq profiles at the HoxD cluster and C-DOM, using GT cells at E12.5, E13.5, E15.5, E17.5 and forebrain cells. Coordinates (mm10): chr2:73815520–74792376. GT2 (upper panel, blue line) and island V (lower panel, red line) were used as viewpoints.
Figure 3
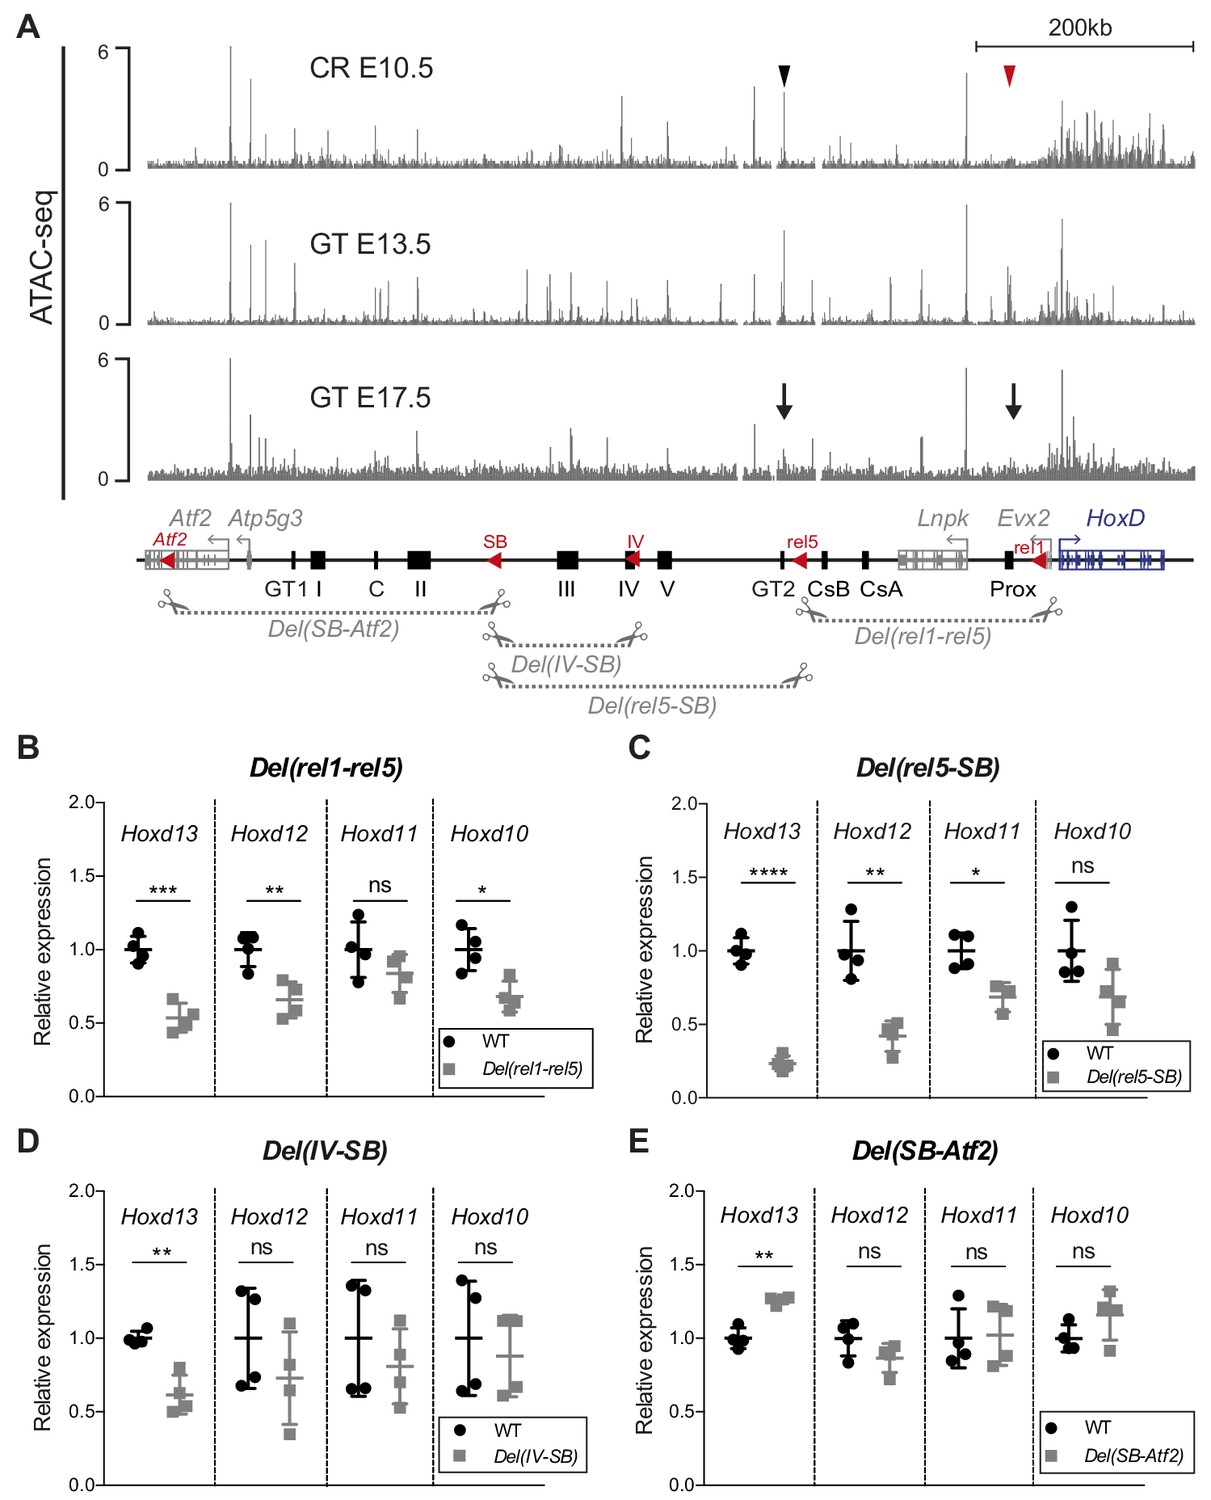
Various segments of C-DOM contribute to Hoxd13 transcription in the GT.
(A) The gray tracks show ATAC-seq profiles of E10.5 CR (average of two biological replicates, track 1), E13.5 GT (average of three biological replicates, track 2) and E17.5 GT (average of two biological replicates, track 3). In track one the red arrowhead shows the Prox enhancer and the black arrowhead the GT2 enhancer. In track 3, arrows indicate the loss of chromatin accessibility at the Prox and GT2 enhancer regions. Coordinates (mm10): chr2: 73815520–74792376. A schematic representation of the HoxD cluster and the C-DOM is shown below with known enhancers as black boxes. The red arrowheads represent the deletions breakpoints. The four large deletion alleles analyzed are depicted as gray dashed lines with scissors. (B–E) RT-qPCR of posterior Hoxd genes mRNAs for wildtype and homozygous mutant deletion alleles using E12.5 GT. The mutant allele is indicated on top of each plot. The values plotted indicate the ratio of mRNA levels using wildtype as a reference (black dots) (n = 4 biologically independent wildtype or mutant GT). A Welch’s t-test was used to evaluate the statistical significance of changes in gene expression. Bars indicate mean with SD, *p≤0.02; **p≤0.007; ***p≤0.0005, ****p≤0.0001; ns = non significant.
-
Figure 3—source data 1
RT-qPCR values ofhoxdgenes in wildtype and deletion alleles.
- https://cdn.elifesciences.org/articles/52962/elife-52962-fig3-data1-v2.xlsx
Figure 4
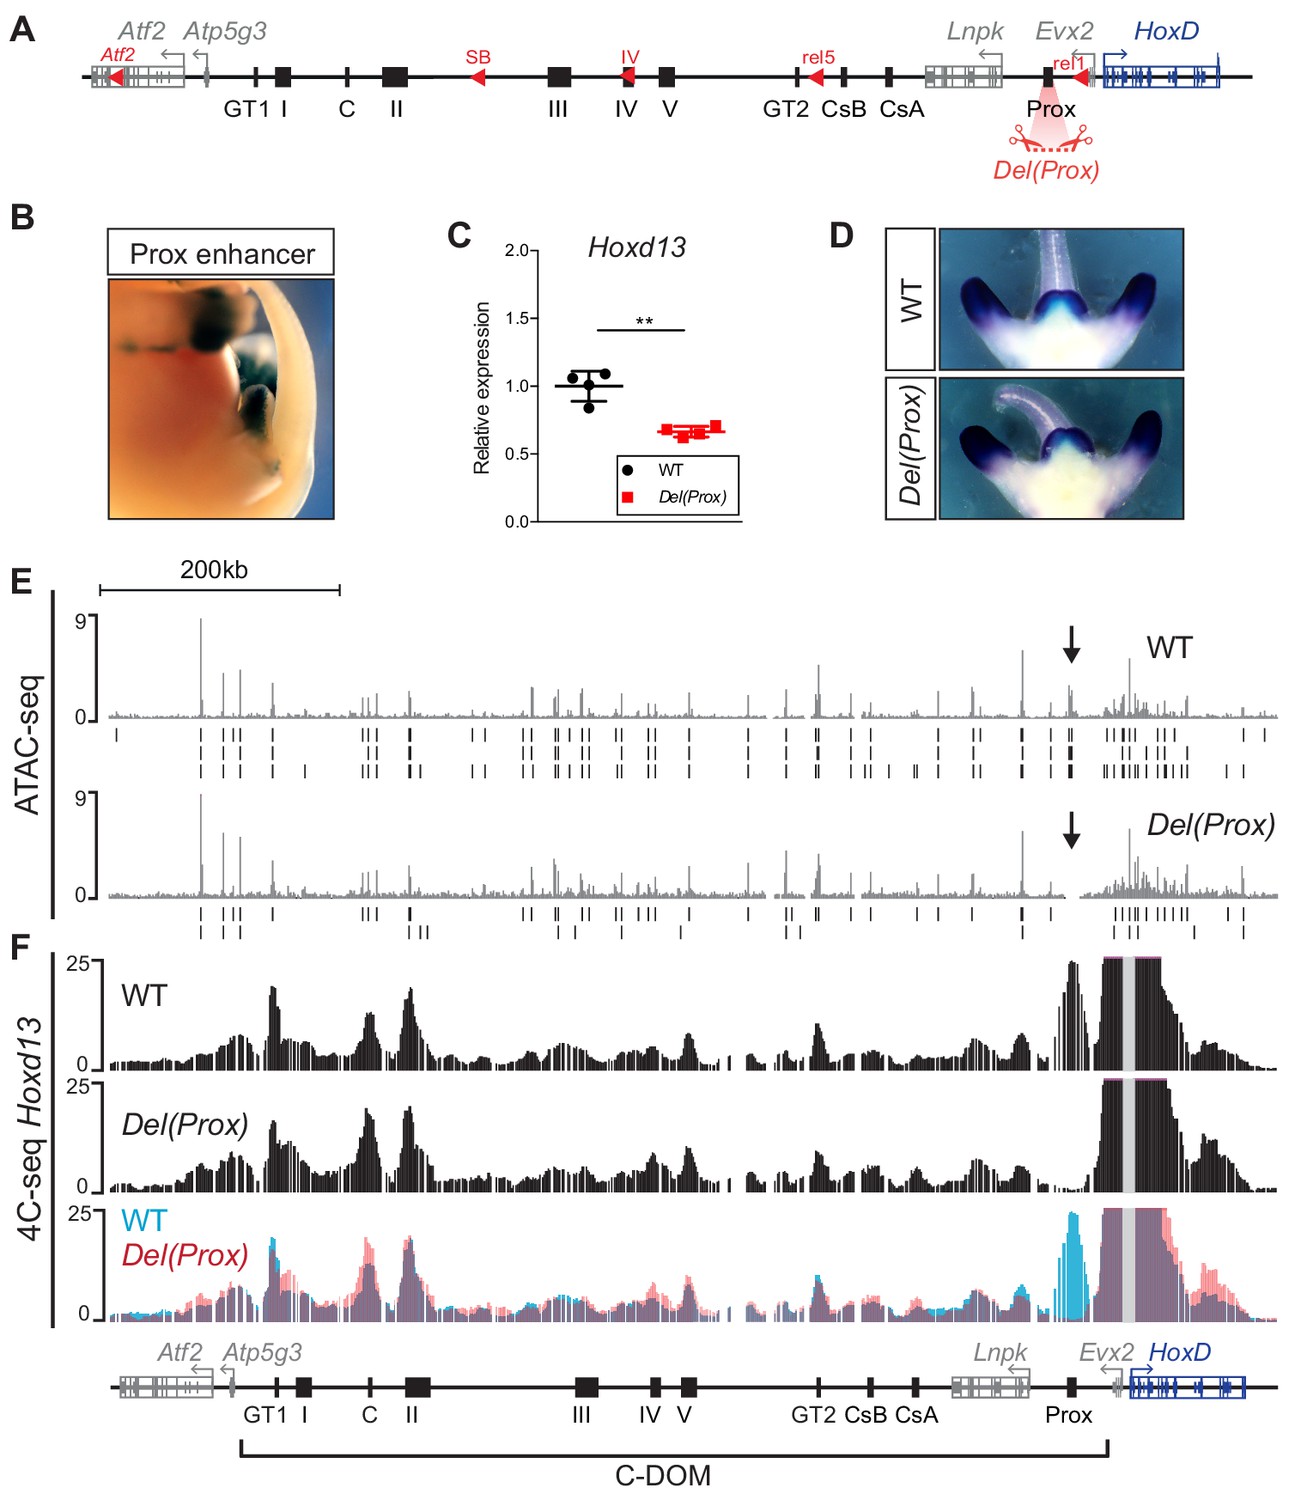
Deletion of the Prox enhancer.
(A) Schematic representation of the HoxD cluster and the C-DOM with the deletion of the Prox sequence (Del(Prox)). (B) X-gal staining showing the activity of the Prox enhancer at E13.5. (C) Hoxd13 transcripts levels obtained by RT-qPCR using wildtype and homozygous Del(Prox) mutant GTs at E12.5. The values plotted indicate the ratio of expression using wildtype as a reference (black dots) (n = 4 biologically independent WT or mutant GTs). A Welch’s t-test was used to evaluate the statistical significance expression changes. Bars indicate mean with SD, **p=0.006. (D) WISH using the Hoxd13 probe in both wildtype and Del(Prox) mutant E12.5 embryos. The Hoxd13 expression pattern remained unchanged. (E) ATAC-seq profiles covering C-DOM and HoxD in wildtype (top) and Del(Prox) mutant (bottom) E13.5 GTs. Coordinates (mm10): chr2:73815520–74792376. The wildtype profile is the average of three biological replicates whereas the Del(Prox) represents the average of two biological replicates. Peaks called using MACS2 are displayed under the corresponding tracks (vertical black lines) for each individual replicate. Black arrows highlight the deleted region. (F) 4C-seq profiles (average of two biological replicates) of wildtype and Del(Prox) mutant E13.5 GTs. The Hoxd13 viewpoint is shown as a gray line. The overlay of the two wildtype (blue) and Del(Prox) (red) tracks highlight the loss of the Prox enhancer in the Del(Prox) allele and the lack of major alterations in the frequency of contacts between Hoxd13 and discrete cis-regulatory elements. Coordinates (mm10): chr2:73815520–74792376.
-
Figure 4—source data 1
RT-qPCR values ofHoxd13in wildtype andDel(Prox)mutant GTs.
- https://cdn.elifesciences.org/articles/52962/elife-52962-fig4-data1-v2.xlsx
Figure 5
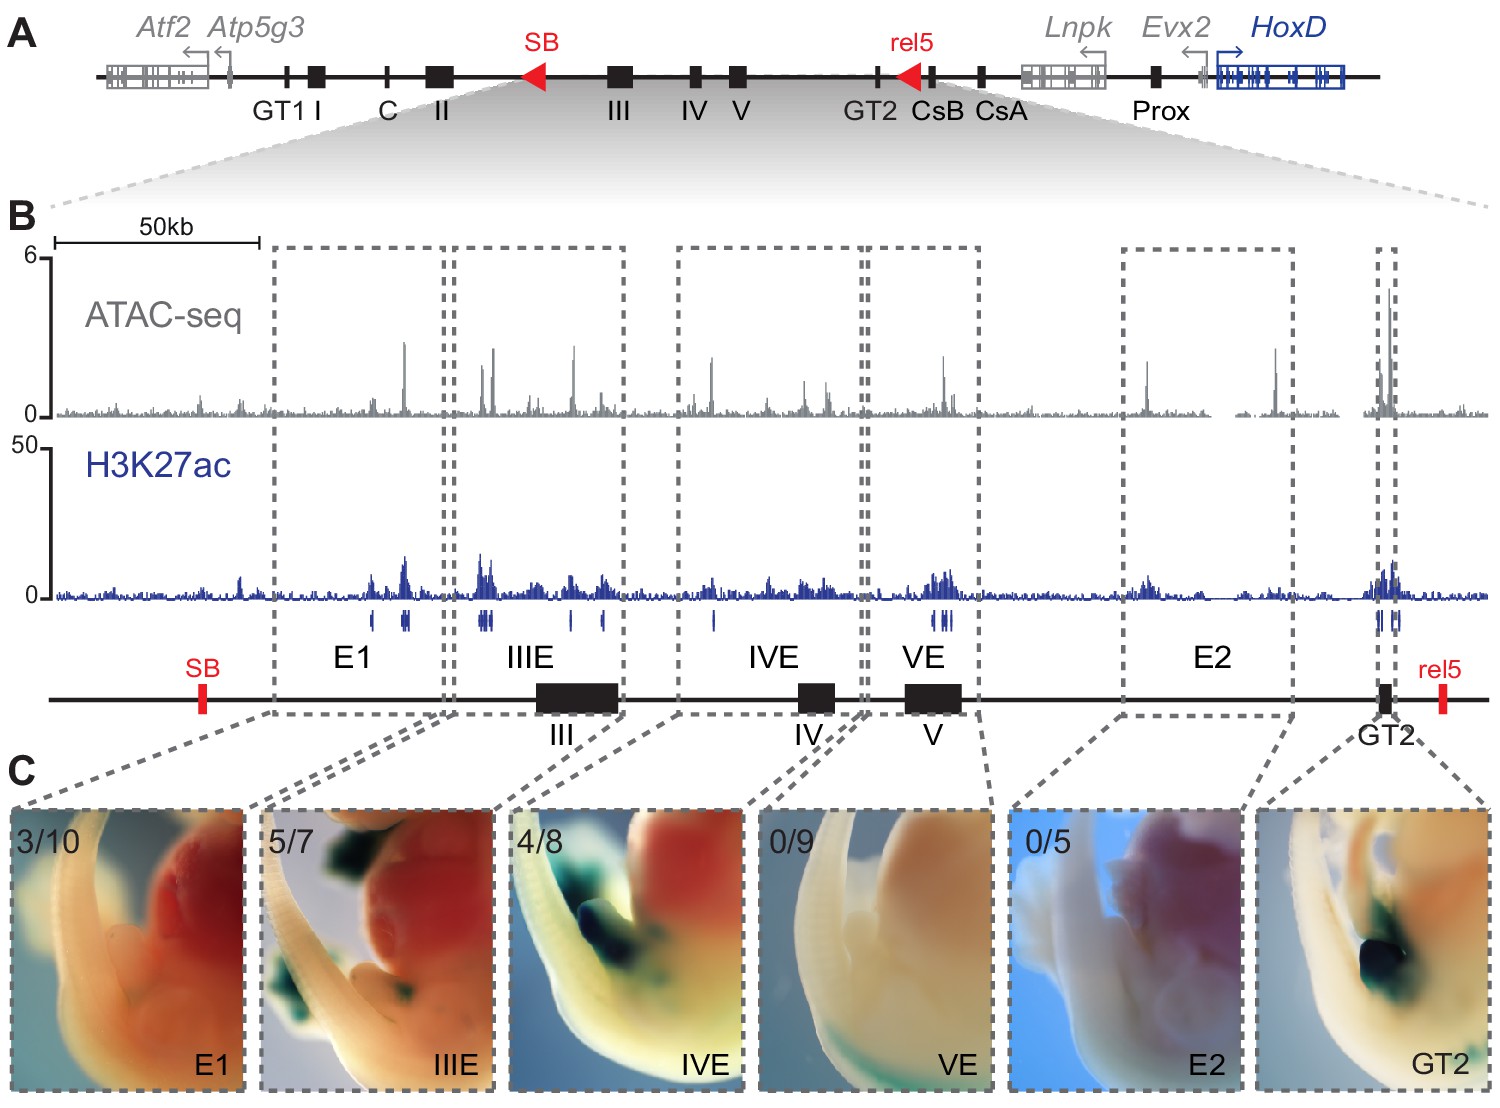
Activity of C-DOM regulatory elements in vivo.
(A) Schematic representation of C-DOM and the HoxD cluster. Previously characterized enhancers are shown as black boxes and red arrowheads point to the SB and rel5 breakpoints. (B) ATAC-seq profile (top, average of three biological replicates) and H3K27ac ChIP-seq profile (bottom) of E13.5 GTs, focusing on the DNA interval between rel5 and SB (coordinates mm10: chr2:74084880–74432824). The vertical blue lines below the H3K27ac ChIP-seq profile represent the output of the MACS2 peak caller tool using the corresponding input as control. (C) Enhancer transgene activity of all the individual regulatory sub-regions analyzed within the rel5 to SB interval. The gray dashed line boxes represent the tested sub-regions as well as the GT2 sequence. For each clone, a representative staining is shown at E13.5. The number of embryos showing lacZ reporter activity in the GT over the total number of embryos with an integrated transgene is indicated on the top left corner.
Figure 6 with 2 supplements
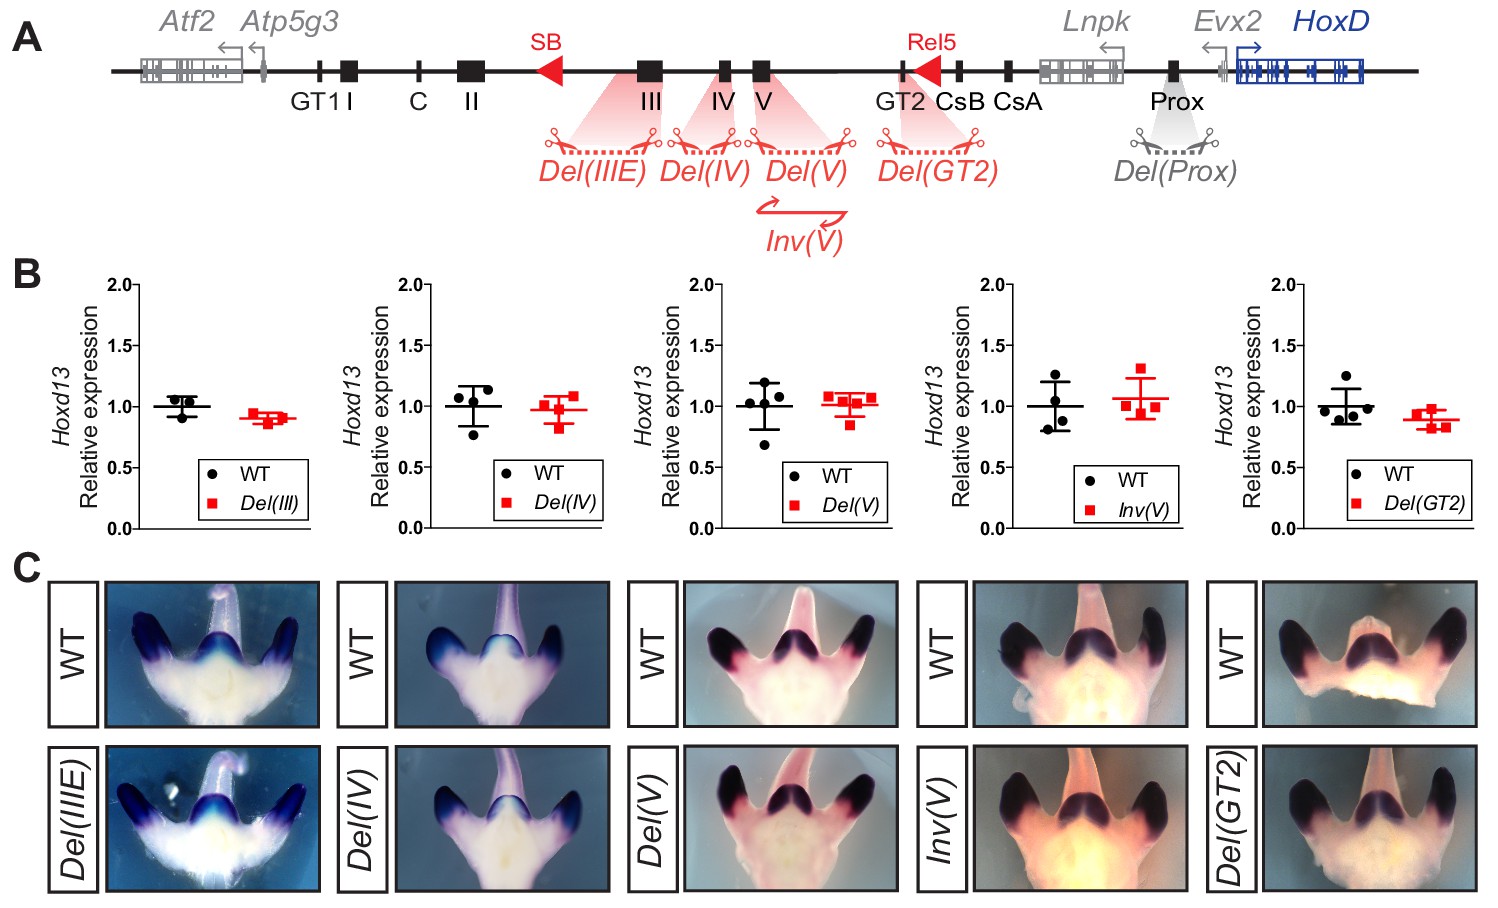
Serial deletions of single cis-regulatory elements.
(A) Schematic representation of the alleles generated by CRISPR-Cas9 editing in vivo. The extents of sequences to be deleted were selected based on ATAC-seq, H3K27ac ChIP-seq, 4C-seq datasets and transgenic assays either obtained in this work or in Lonfat et al. (2014); Montavon et al. (2011). (B) Relative expression of Hoxd13 obtained by RT-qPCR of both wildtype control and the various mutant alleles using E12.5 GT cells. The values plotted indicate the ratio of expression using wildtype as a reference (black dots) for each gene (n ≥ 3 biologically independent wildtype and mutant GTs). When using a Welch’s t-test, no statistically significant change in expression was detected. (C) WISH using the Hoxd13 probe and both wildtype and mutant E12.5 littermates. Both the mRNA levels and transcripts distribution remained globally unchanged.
-
Figure 6—source data 1
RT-qPCR values ofHoxd13in wildtype and deletion alleles.
- https://cdn.elifesciences.org/articles/52962/elife-52962-fig6-data1-v2.xlsx
Figure 6—figure supplement 1
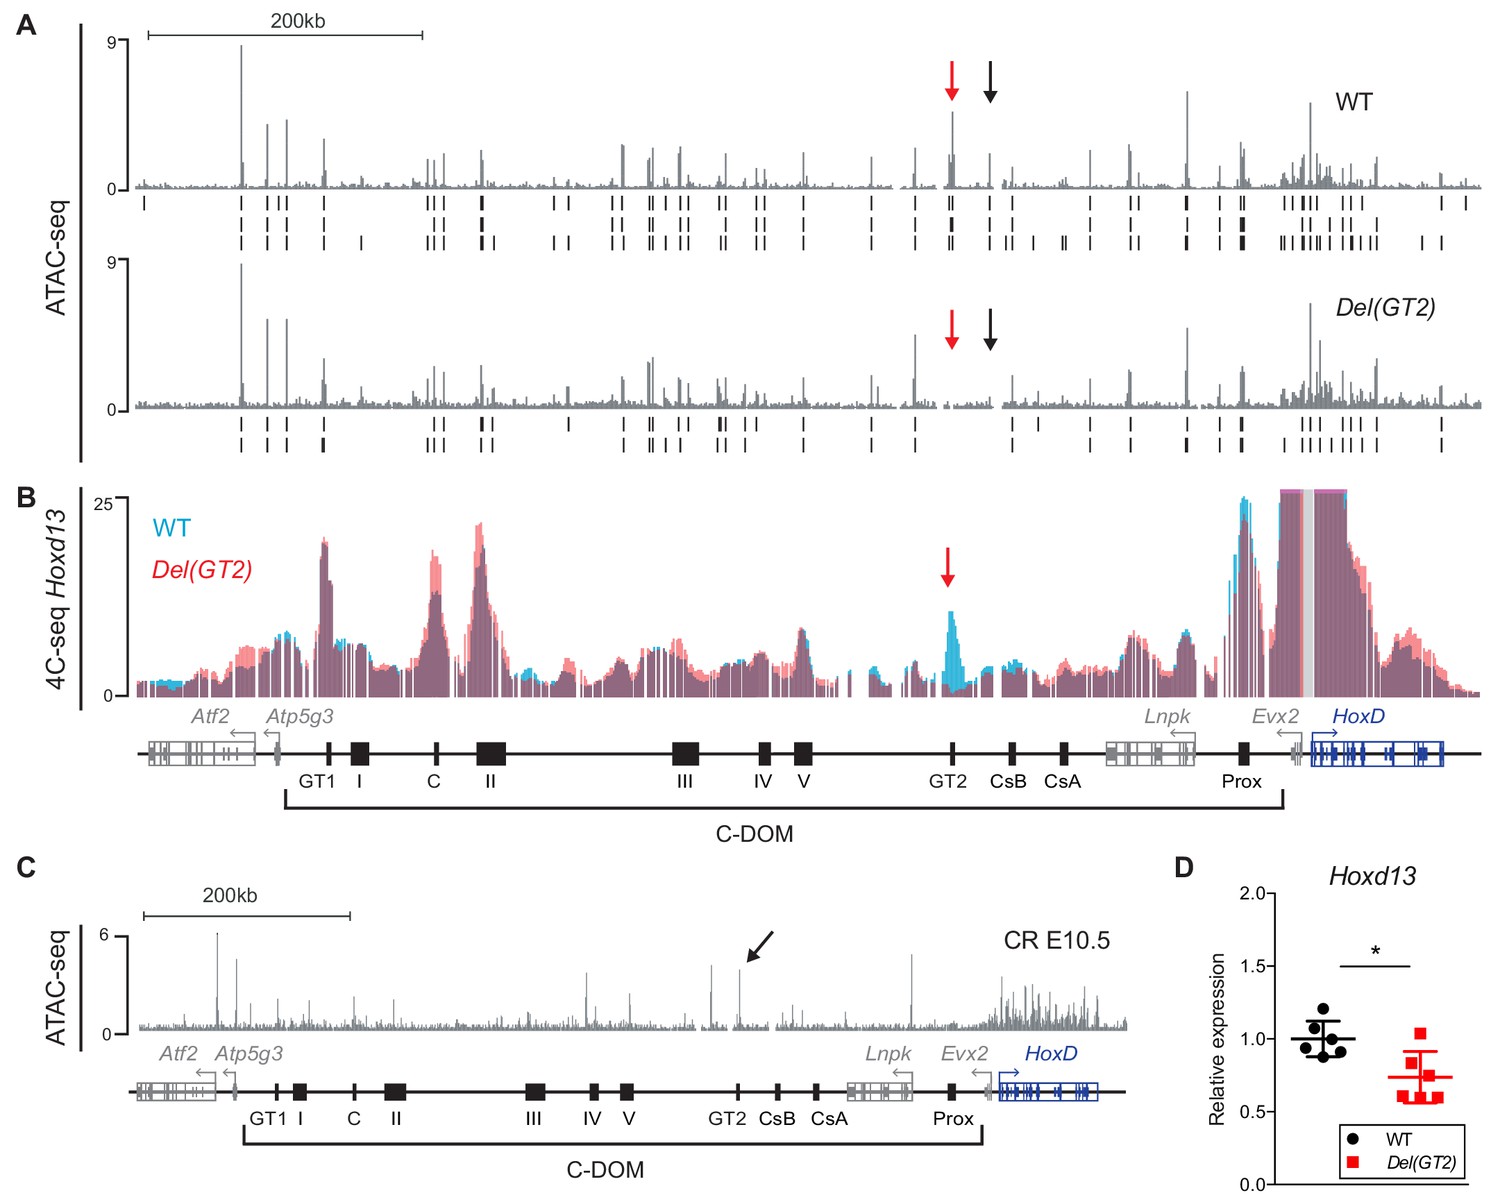
Deletion of the GT2 enhancer.
(A) ATAC-seq profiles of HoxD and C-DOM in wildtype and mutant Del(GT2) E13.5 GTs. Coordinates (mm10): chr2:73815520–74792376. The wildtype track is the average of three biological replicates and the Del(GT2) track the average of two biological replicates. Peaks called using MACS2 are displayed below, for each individual replicate (vertical black lines below). The red arrows delineate the deleted region and black arrows indicate a peak lost in Del(GT2). (B) Overlay of 4C-seq profiles of E13.5 GT cells using Hoxd13 as viewpoint, wildtype in blue and Del(GT2) in red (average of two biological replicates). Coordinates (mm10): chr2:73815520–74792376. Viewpoint is highlighted by a gray line. The red arrow indicates the deleted region. (C) ATAC-seq profile of E10.5 CR (average of two biological replicates). The black arrow points to the GT2 enhancer. Coordinates (mm10): chr2: 73815520–74792376. (D) RT-qPCR of wildtype and mutant Del(GT2) E10.5 CR. Hoxd13 mRNA levels were analyzed and the values plotted indicate the ratio of expression using wildtype as a reference (blue dots) (n = 6 biologically independent WT or mutant GTs). A Welch’s t-test was used to evaluate the statistical significance of changes in gene expression. Bars indicate mean with SD, *p=0.0125. We observed a 27% decrease in the mRNA levels of Hoxd13.
Figure 6—figure supplement 2
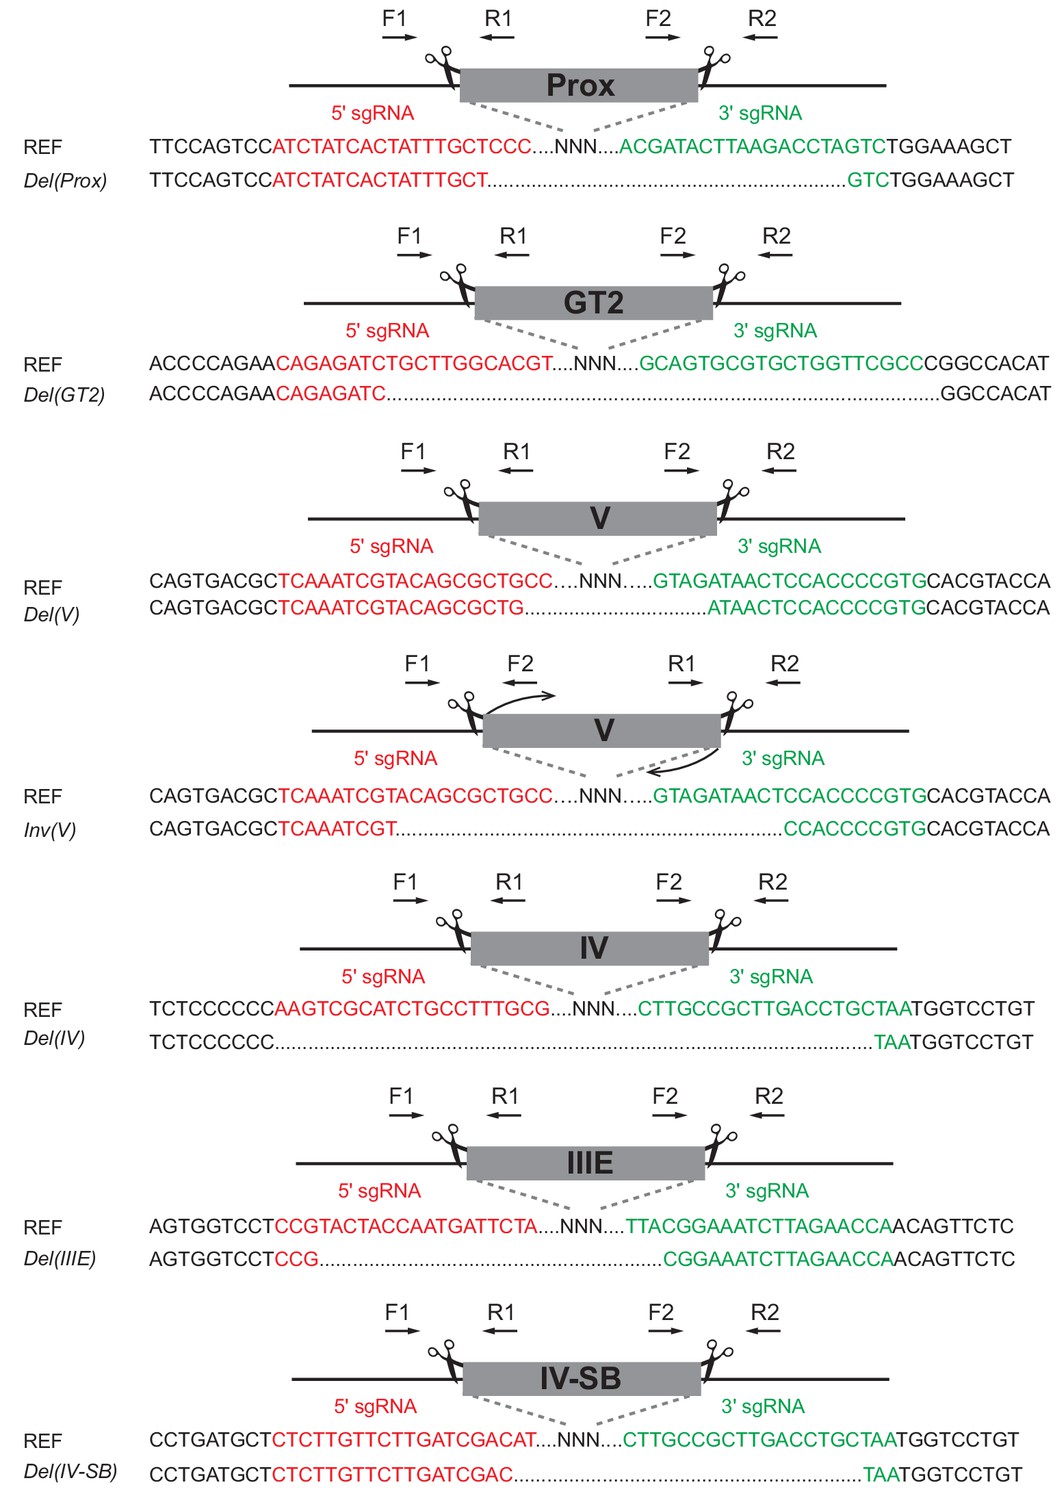
Alleles generated by CRISPR-Cas9.
Sanger sequencing results of F0 animals for all alleles generated. Scissors indicate CRISPR-Cas9 mediated breakpoints flanking each regulatory region. SgRNA sequences are marked in red or in green. PCR-based genotyping was carried out with primers designed on both sides of sgRNAs targets, deletions were screened with primers F1/R2, inversions with primers F1/F2 and R2/R1 and WT were amplified with primers F1/R1 and F2/R2. See Supplementary file 1 for all primer sequences and related PCR product sizes.
Figure 7 with 1 supplement

Deletion and inversion of the island V CTCF site in vivo.
(A) CTCF ChIP-seq profiles of wildtype and Del(V) mutant E13.5 GTs. CUT and RUN of mutant Inv(V) E13.5 GT. The upper track shows the orientations of the CTCF motives (red and blue arrowheads). The black arrow indicates the major CTCF peak on island V. (B) 4C-seq profiles (average of two biological replicates) of wildtype and mutant Del(V) E13.5 GTs. The positions of the Hoxd13 (upper tracks) and island IV (lower track) viewpoints are shown with a gray line. The profiles are displayed as overlays of wildtype (blue) and Del(V) (red). The red arrow shows the deleted region and the black arrow points to the Hoxd13 region. (C) 4C-seq profiles (average of two biological replicates) of wildtype and mutant Inv(V) homozygous E13.5 GTs. Viewpoints are highlighted by a gray line. The profiles are shown as overlays of wildtype (blue) and Inv(V) (red). The red arrow shows the inverted region and the black arrow indicates the loss of contacts between island IV and the Hoxd13 region in the Inv(V) sample. Percentages in blue (wildtype) and red (InvV) represent the proportion of the sums of interactions centromeric or telomeric to island V. (coordinates (mm10) for the quantifications: centromeric: chr2:74015789–74276083; telomeric chr2:74332870–74671433). Coordinates (mm10): chr2:73815520–74792376.
Figure 7—figure supplement 1
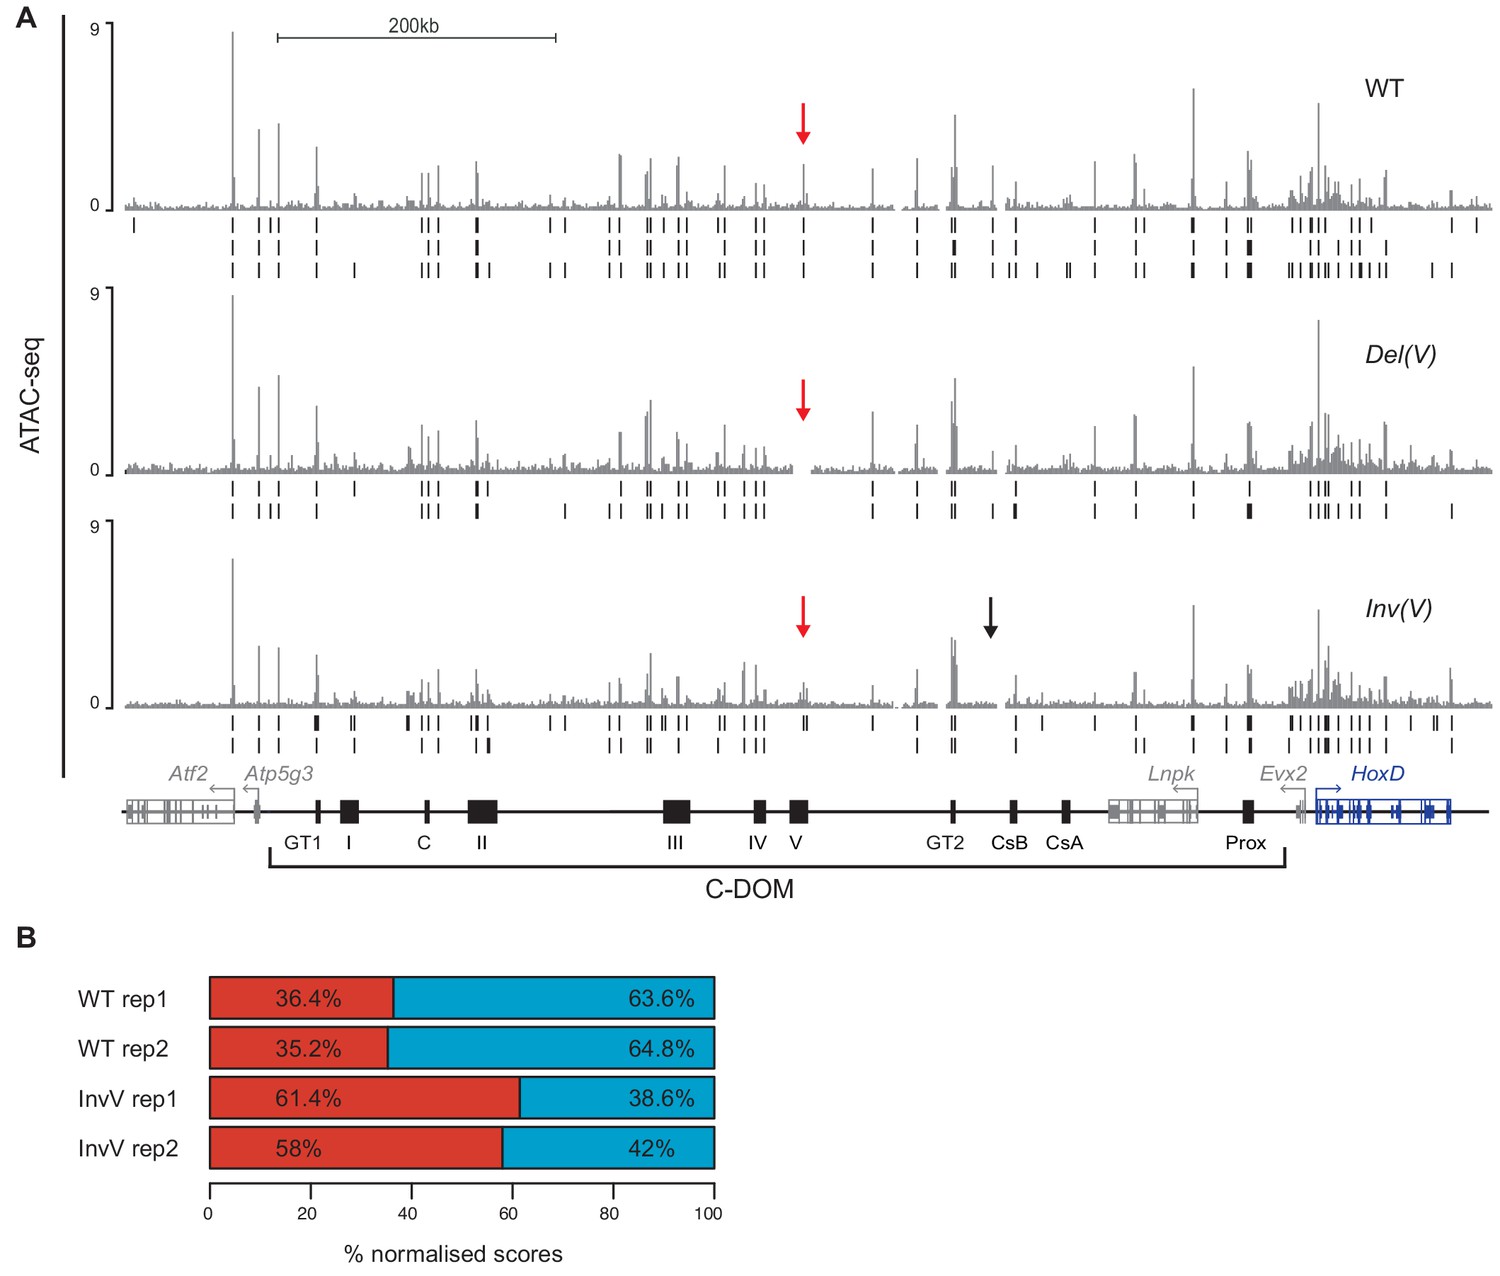
Chromatin accessibility in the deletion and inversion of the island V.
(A) ATAC-seq profiles of wildtype and mutant Del(V) and Inv(V) E13.5 GTs. Coordinates (mm10): chr2:73815520–74792376. The wildtype track is the average of three biological replicates and the Del(V) and Inv(V) tracks are the average of two biological replicates. Peaks called using MACS2 are displayed below for each individual replicate (vertical black lines below). The red arrows highlight the deleted or inverted region and the black arrow points to the loss of a peak in the Inv(V) allele. (B) Graphical representation of the percentage of interactions centromeric (red) or telomeric (blue) to island V, for each biological replicate, when using island V as a viewpoint. Coordinates (mm10): centromeric: chr2:74015789–74276083; telomeric: chr2:74332870–74671433.
Figure 8

HOX13 protein binding in C-DOM.
(A) HOX13 CUT and RUN profiles using E10.5 CR cells (red) and GT cells at E13.5 (Blue). The blue box represents the HoxD cluster and gray boxes are non-Hox genes. The profile encompasses 4 Mb and highlights the enrichment of HOX13 binding on both C-DOM and T-DOM HoxD regulatory landscapes. Coordinates (mm10): chr2: 72760109–76760109. (B) ATAC-seq and HOX13 CUT and RUN profiles of E10.5 CR cells (red) and E13.5 GT cells (Blue). Close-up view of C-DOM and the HoxD cluster (coordinates in mm10: chr2:73815520–74792376). The arrows indicate that although the Prox enhancer is bound by HOX13 in the CR at E10.5, the chromatin is not yet accessible at this element.
Additional files
-
Supplementary file 1
List of genotyping primers.
- https://cdn.elifesciences.org/articles/52962/elife-52962-supp1-v2.xlsx
-
Supplementary file 2
List of sgRNAs.
- https://cdn.elifesciences.org/articles/52962/elife-52962-supp2-v2.xlsx
-
Supplementary file 3
List of fosmids.
- https://cdn.elifesciences.org/articles/52962/elife-52962-supp3-v2.xlsx
-
Supplementary file 4
List of primers used for recombineering.
- https://cdn.elifesciences.org/articles/52962/elife-52962-supp4-v2.xlsx
-
Supplementary file 5
List of 4C-seq primers.
- https://cdn.elifesciences.org/articles/52962/elife-52962-supp5-v2.xlsx
-
Supplementary file 6
List of datasets and replicate status.
- https://cdn.elifesciences.org/articles/52962/elife-52962-supp6-v2.xlsx
-
Transparent reporting form
- https://cdn.elifesciences.org/articles/52962/elife-52962-transrepform-v2.docx
Download links
A two-part list of links to download the article, or parts of the article, in various formats.
Downloads (link to download the article as PDF)
Open citations (links to open the citations from this article in various online reference manager services)
Cite this article (links to download the citations from this article in formats compatible with various reference manager tools)
A complex regulatory landscape involved in the development of mammalian external genitals
eLife 9:e52962.
https://doi.org/10.7554/eLife.52962


