TUBB4A mutations result in both glial and neuronal degeneration in an H-ABC leukodystrophy mouse model
- Department of Neurology, The Children's Hospital of Philadelphia, United States
- Department of Physiology, the Perelman School of Medicine, University of Pennsylvania, United States
- Department of Neurology, the Perelman School of Medicine, University of Pennsylvania, United States
- Department of Neurology, Department of Molecular Biology, Cell Biology, and Biochemistry, Brown University, United States
- Department of Human Genetics and Neurobiology, University of Pittsburgh, United States
Figures
Figure 1 with 6 supplements
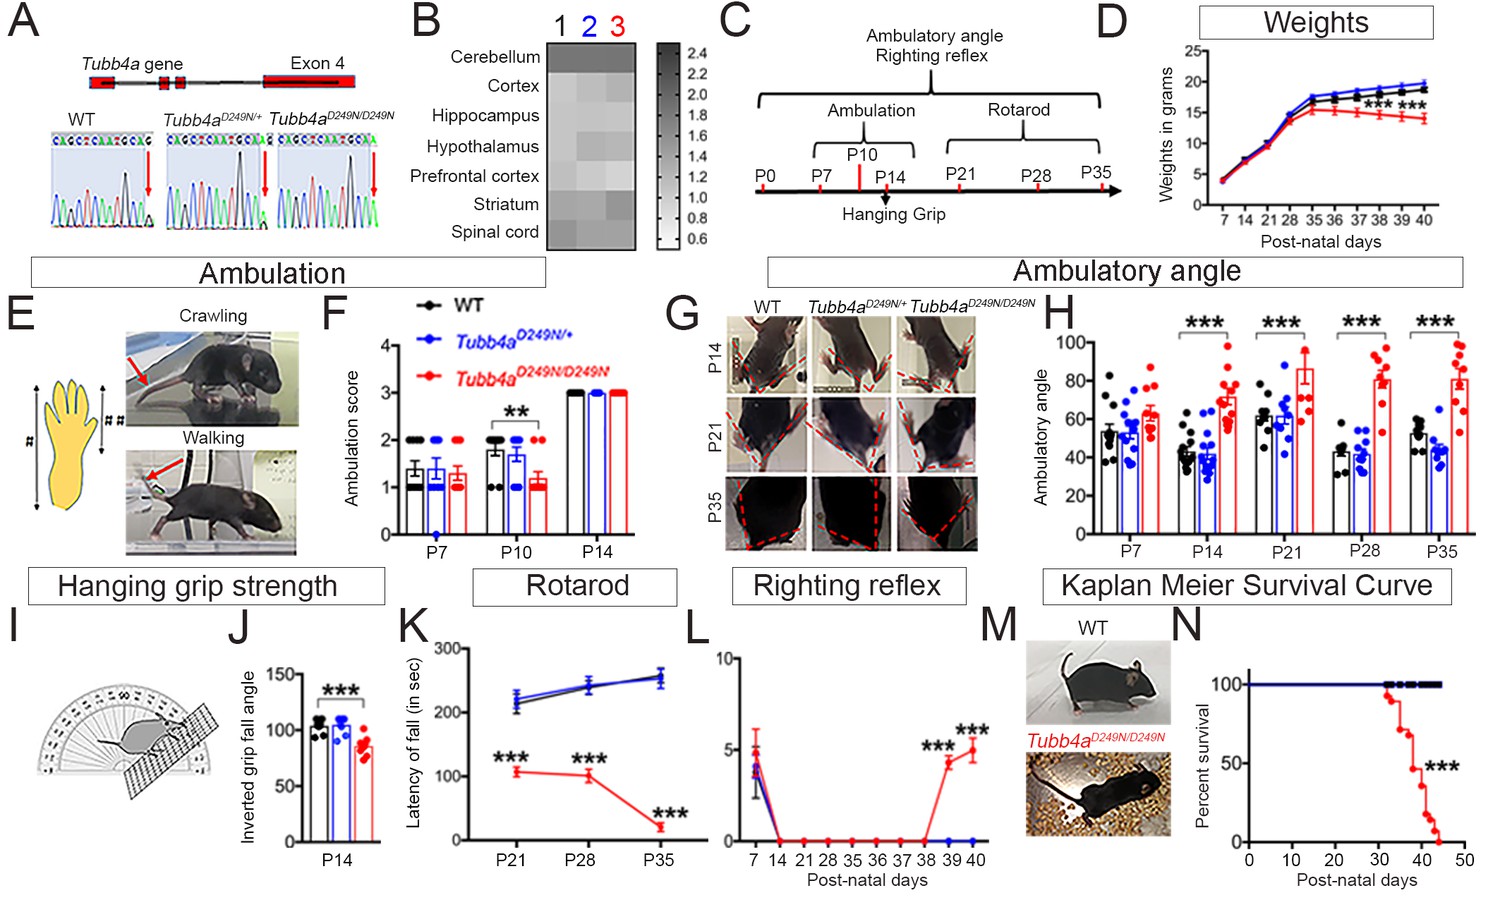
Tubb4aD249N/D249N mice show decreased survival, gait abnormalities, and progressive motor dysfunction.
(A) Schematic diagram showing mouse Tubb4a gene and sequencing chart of WT, Tubb4aD249N/+, and Tubb4aD249N/D249N mice. Red arrow indicates the position of 745 nucleotide in exon 4; WT shows one peak of ‘G’, Tubb4aD249N/+ mice show one peak each of ‘G’ and ‘A’, and Tubb4aD249N/D249N mice shows two peaks for ‘A’. (B) Heat map of Tubb4a expression in brain;1- WT, 2- Tubb4aD249N/+ and 3- Tubb4aD249N/D249N mice at end-stage (~P35-P40) (n = 3). (C) Schematic diagram displaying the time course of behavioral tests. (D) Graph for weight measurements of Tubb4aD249N/+, Tubb4aD249N/D249N, and WTs from P7, n = 10. (E) Illustration of crawling and walking: For ambulation measurement, crawling and walking was scored (see Table 1); throughout crawling; the whole hind paw touches the ground as designated by (#), walking; when the toes of the hind paw touch the ground and the heel is elevated, designated by [##]. (F) Ambulatory deficits of Tubb4aD249N/D249N mice at P7, P10, and P14. Statistical analysis by two-way ANOVA, Tukey post-hoc analysis, n = 10. (G) Representative images of ambulatory angles at P14, P21, and P35 of Tubb4aD249N/+ and Tubb4aD249N/D249N. (H) Ambulatory angle measurements of Tubb4aD249N/+ and Tubb4aD249N/D249N as compared to WT littermates at P7, P14, P21, P28, and P35. Statistical test by two-way ANOVA, post-hoc Tukey test, n = 14. (I) Pictorial presentation of hanging grip strength. (J) Grip strength measured by inverted fall angle in Tubb4aD249N/+ and Tubb4aD249N/D249N mice. Statistical test by one-way ANOVA, Tukey post-hoc analysis, n = 10. (K) Rotarod testing demonstrating latency to fall (in seconds) in Tubb4aD249N/+ and Tubb4aD249N/D249N mice at P21, P28, and P35, n = 14. (L) Righting reflex changes of Tubb4aD249N/+, Tubb4aD249N/D249N, and WT mice, n = 14. (M) Representative image of the end-stage Tubb4aD249N/D249N mouse (~P35-P40) with severe dystonia and ataxia relative to WT. (N) Kaplan-Meier survival curve of Tubb4aD249N/D249N and Tubb4aD249N/+ mice (Gehan-Breslow-Wilcoxon test, n = 28). Statistical tests performed by repeated measures two-way ANOVA, Tukey post-hoc analysis. Data presented as mean and SEM. *p<0.05, **p<0.01, ***p<0.001.
-
Figure 1—source data 1
Source files of graphical data of mRNA expression in WT,Tubb4aD249N/+andTubb4aD249N/D249N.
- https://cdn.elifesciences.org/articles/52986/elife-52986-fig1-data1-v1.docx
-
Figure 1—source data 2
Source files of graphical data for Behavioral tests.
- https://cdn.elifesciences.org/articles/52986/elife-52986-fig1-data2-v1.docx
Figure 1—figure supplement 1
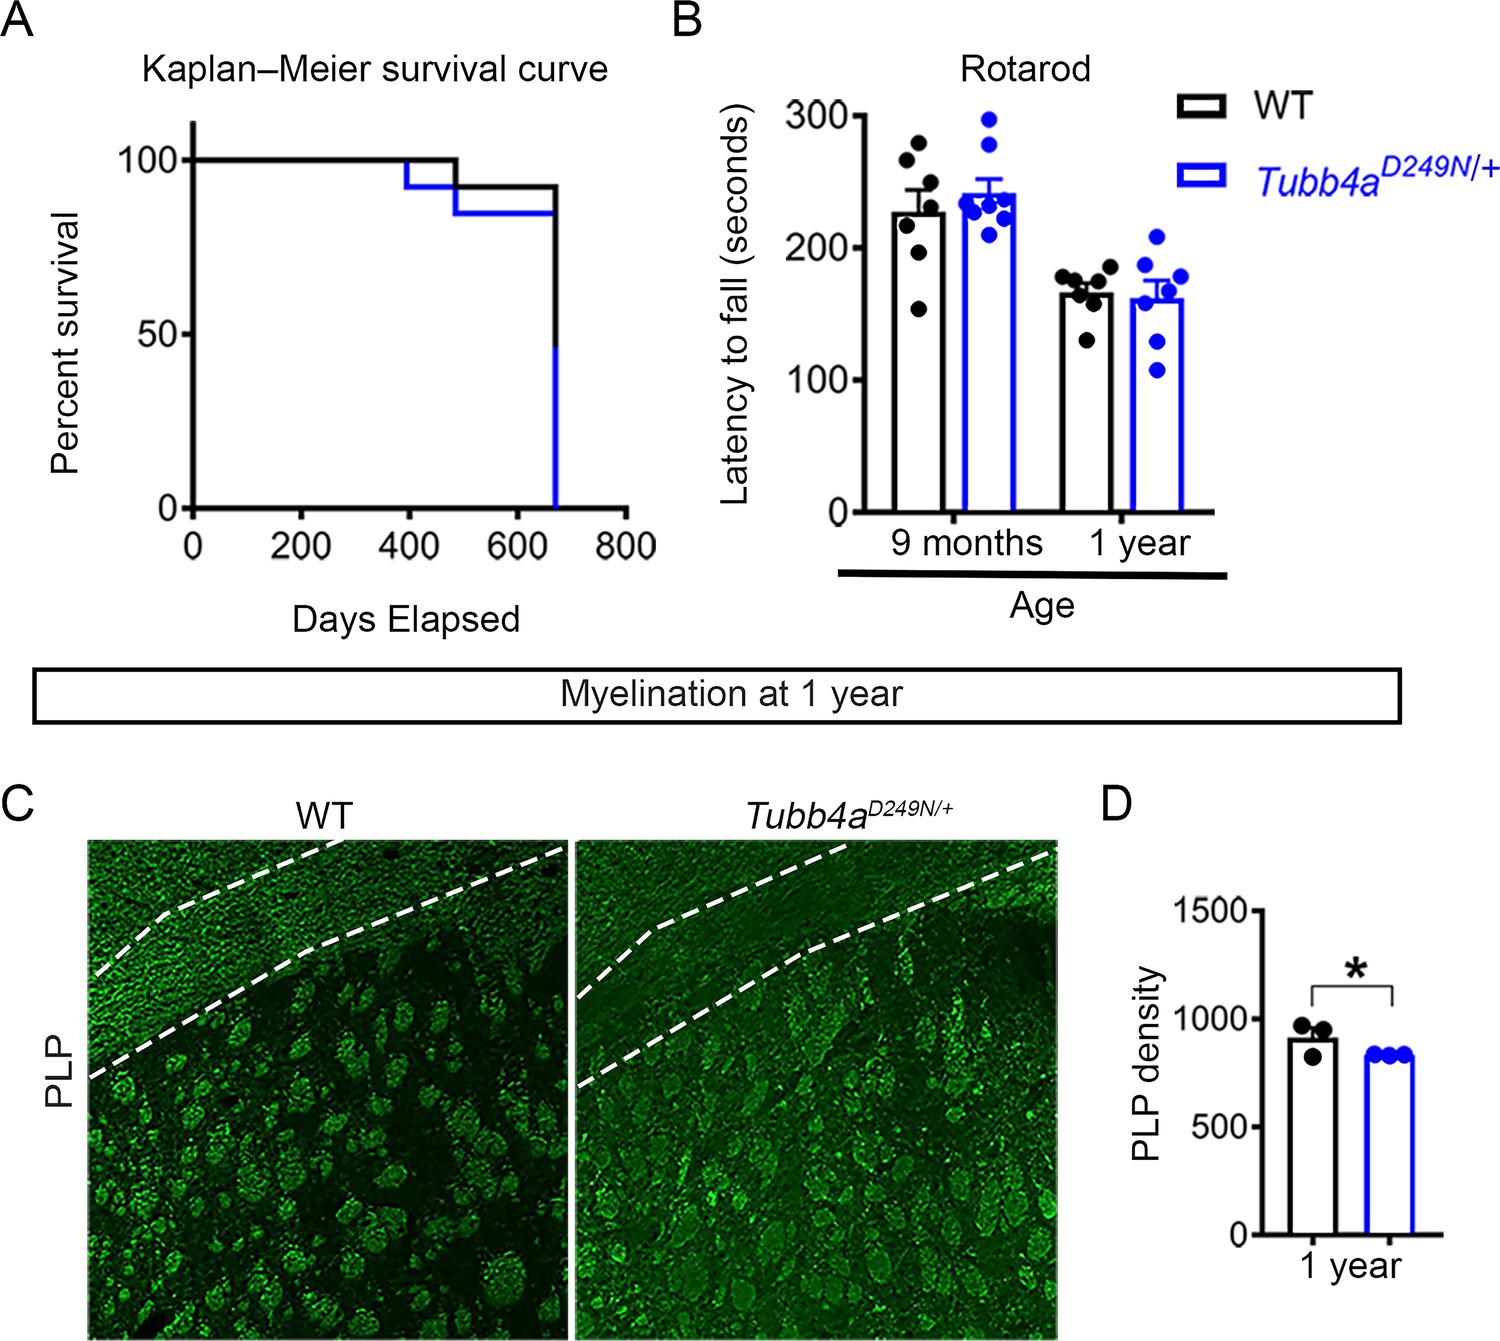
Normal survival, motor performance, and late-onset hypomyelination in Tubb4aD249N/+ mice.
(A) Kaplan-Meier survival curve of Tubb4aD249N/+ mice as compared to WTs (Gehan-Breslow-Wilcoxon test, n = 10). (B) Rotarod test performance at the age of 9 months and 1 year of Tubb4aD249N/+ mice relative to WTs, n = 7–8. Statistical test performed by one-way ANOVA, followed by Tukey post-hoc test. (C–D) Representative images (C) and quantification (D) of PLP immunostaining (green) in corpus callosum of WT and Tubb4aD249N/+ at 1 year. Scale bar = 250 µm.
Figure 1—video 1
Top view of representative WT mouse pup at P9.
Figure 1—video 2
Top view of representative Tubb4aD249N/D249N mouse pup at P9 to demonstrate the onset of tremors.
Figure 1—video 3
Progressive increase in tremors in representative Tubb4aD249N/D249N mouse at P21.
Figure 1—video 4
End-stage to Tubb4aD249N/D249N mouse with severe dystonia and ataxia.
Figure 1—video 5
The severe motor function as depicted by rotarod performance of Tubb4aD249N/D249N mouse compared to WT at P35.
Figure 2 with 2 supplements
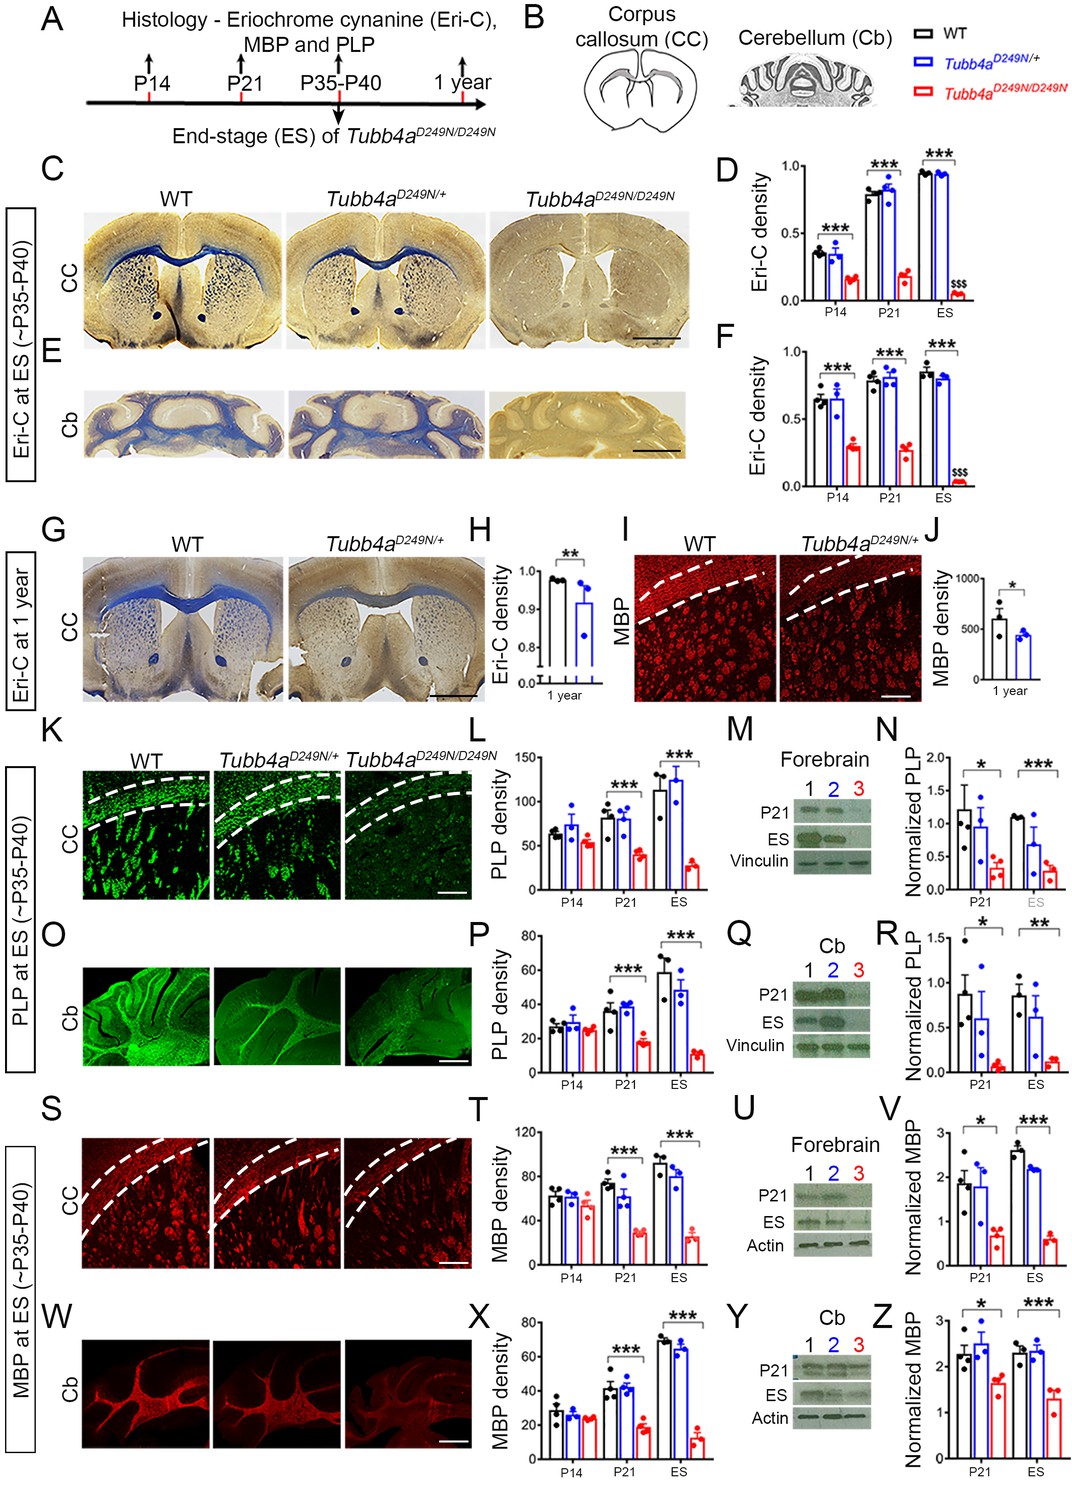
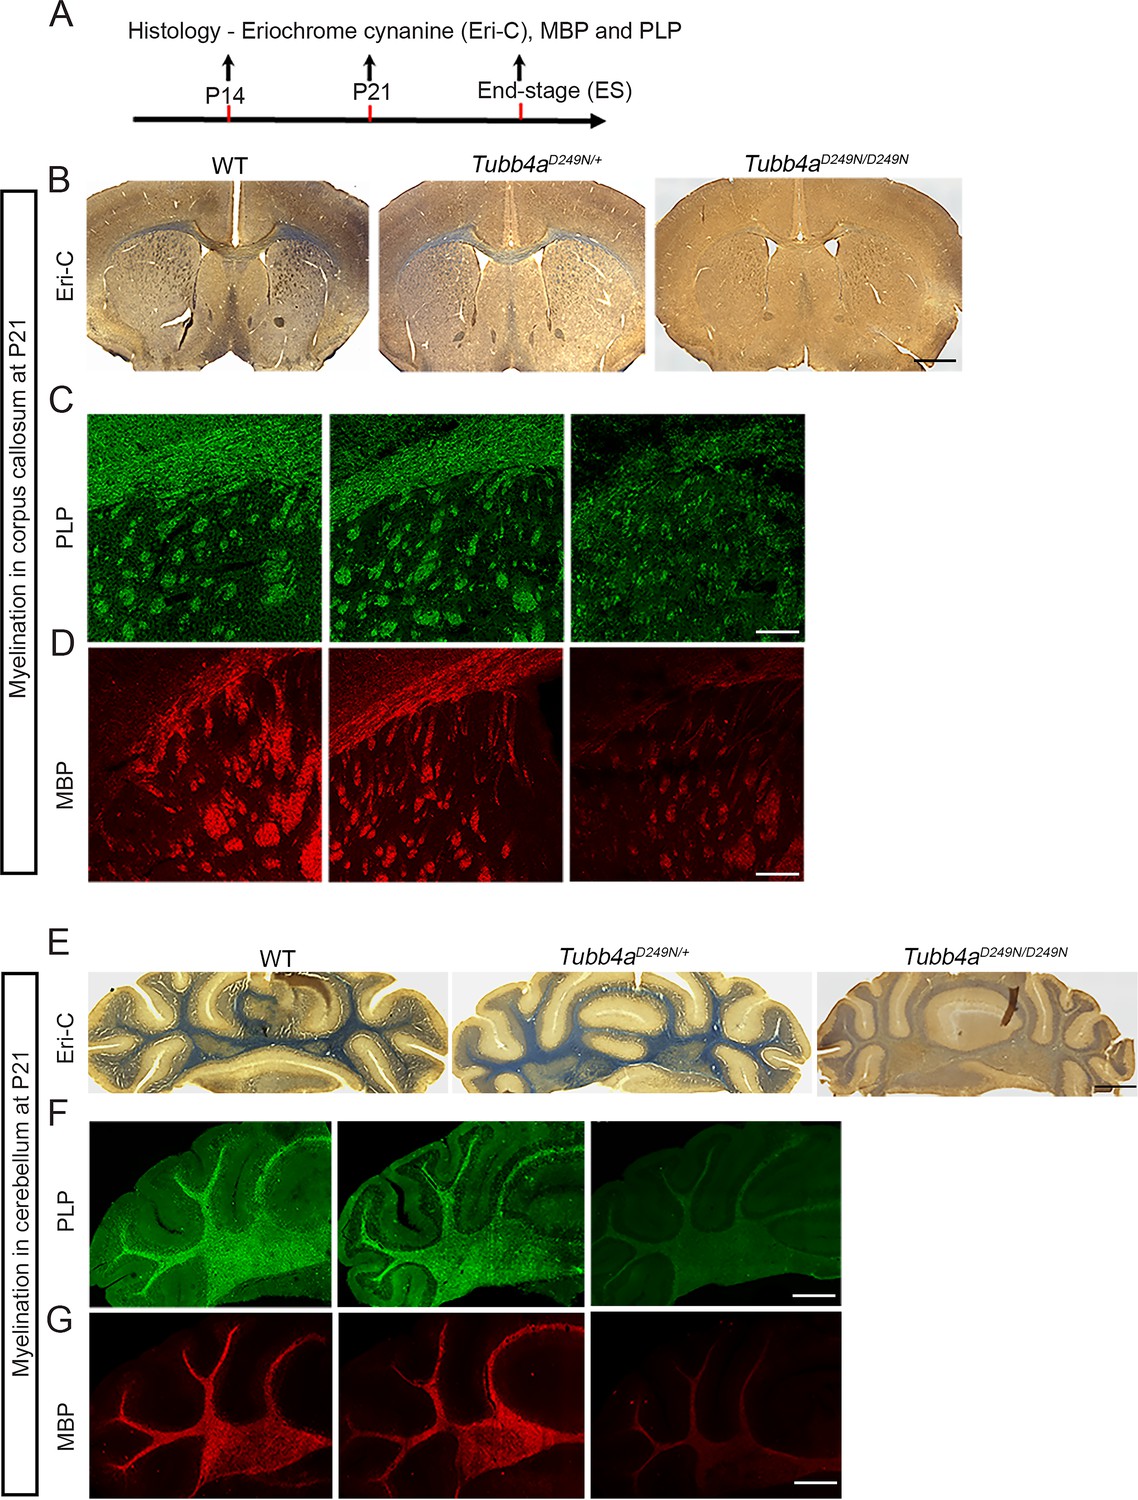
Tubb4aD249N/D249N mice have severely delayed myelination.
(A–B) Immunohistochemical assays were performed according to a time course (A) in the Corpus callosum (CC) and Cerebellum (Cb) with the analyzed area in grey. (B) For each assay, the CC and Cb were imaged and quantified in WT, Tubb4aD249N/+, and Tubb4aD249N/D249N mice at P14, P21, and at end-stage (ES;~P35-P40), except for Eriochrome cyanine (Eri-C), PLP and MBP which was also assessed at one year in WT and Tubb4aD249N/+ mice only in CC. (C–D) The CC shows significantly decreased Eriochrome cyanine (Eri-C) staining (blue) in Tubb4aD249N/D249N mice, which worsens over time. (E–F) Tubb4aD249N/D249N mice show significant and worsening decreased of Eri-C staining in the Cb. (G–J) Loss of Eri-C staining (G–H) as well as MBP immunostaining (red) (I–J) in CC seen in 1-year-old Tubb4aD249N/+ mice. (K–N) PLP immunostaining (green) of CC (K–L) and decreased protein levels by western blot in the forebrain from P21 and ES mice (M–N) demonstrate a defect in the normal expression of myelin proteins. (O–R) A similar effect is seen in PLP immunostaining (O–P) and western blot (Q–R) in Cb. (S–Z) MBP protein staining in CC (S–T) and western blot (U–V) in the forebrain, as well as the Cb (W–Z) also showed a significant and progressive decrease in Tubb4aD249N/D249N mice. Statistical tests performed by two-way ANOVA, Tukey post-hoc test or Unpaired t-test. n = 4 mice/group for P14 (except n = 3 for Tubb4aD249N/+ mice) and P21, n = 3 mice/group for ES and 1 year. Data presented as mean and SEM. *p<0.05 and ***p<0.001. Scale bar = 1 mm (C, E, G) or 250 µm (I, K, O, S, W). Western blots, lanes; 1, 2, and 3 represent WT, Tubb4aD249N/+, and Tubb4aD249N/D249N mice, respectively.
-
Figure 2—source data 1
Source files of graphical data for Myelin quantification.
- https://cdn.elifesciences.org/articles/52986/elife-52986-fig2-data1-v1.docx
-
Figure 2—source data 2
Source files of graphical data for Western blots quantification of MBP and PLP.
- https://cdn.elifesciences.org/articles/52986/elife-52986-fig2-data2-v1.docx
Figure 2—figure supplement 1
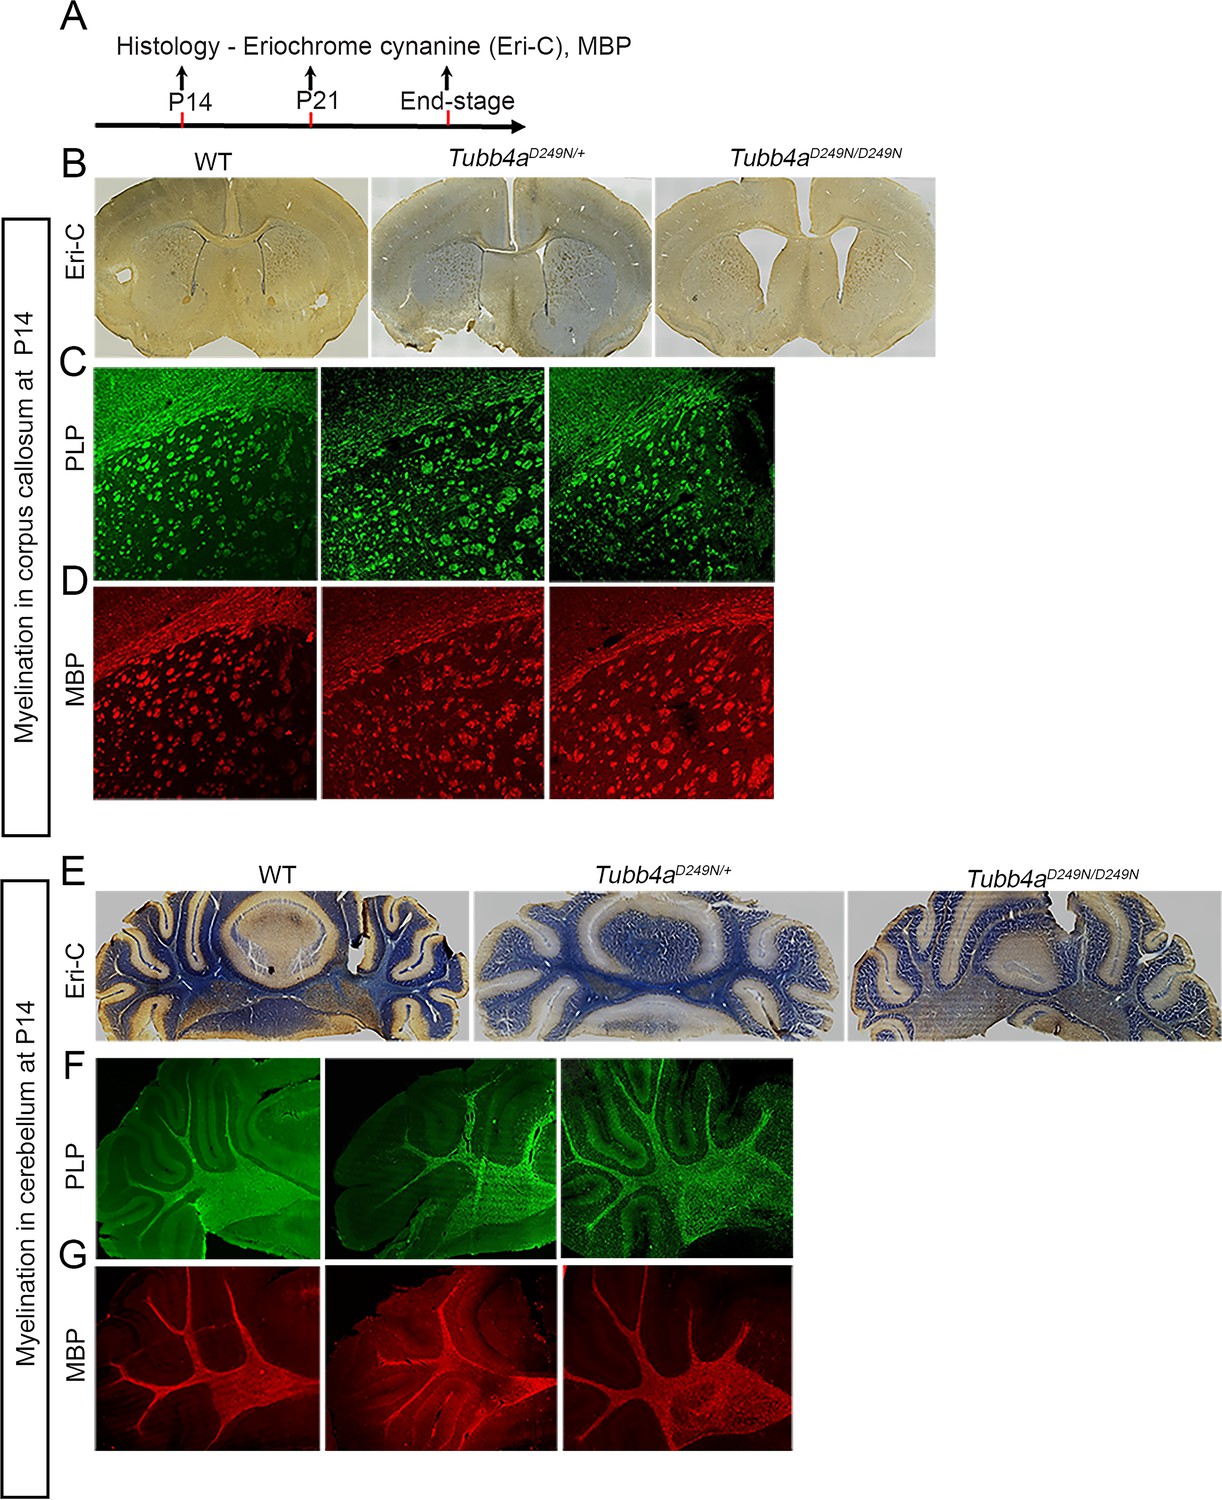
Tubb4aD249N/D249N mice show hypomyelination at P14.
(A) Schematic diagram displaying the time course of immunohistochemical assays. (B–D) Representative images of Eriochrome cyanine (Eri-C) staining for myelin (B; blue color) and immunostaining for PLP (C; green) or MBP (D; red) of corpus callosum in WT, Tubb4aD249N/+, and Tubb4aD249N/D249N mice. (E–G) Representative images of Eri-C staining of myelin (E; blue) and immunostaining for PLP (F; green) and MBP (G; red) of cerebellum in WT, Tubb4aD249N/+, and Tubb4aD249N/D249N mice. Data are quantified in Figure 2. Scale bar = 1 mm (B, E) or 250 µm (C, D, F, G).
Figure 2—figure supplement 2
Tubb4aD249N/D249N mice show hypomyelination at P21.
(A) Schematic diagram displaying the time course of immunohistochemical assays. (B–D) Representative images of Eriochrome cyanine (Eri-C) staining for myelin (B; blue color) and immunostaining for PLP (C; green) or MBP (D; red) of corpus callosum in WT, Tubb4aD249N/+, and Tubb4aD249N/D249N mice. (E–G) Representative images of Eri-C staining of myelin (E; blue) and immunostaining for PLP (F; green) and MBP (G; red) of cerebellum in WT, Tubb4aD249N/+, and Tubb4aD249N/D249N mice. Data are quantified in Figure 2. Scale bar = 1 mm (B, E) or 250 µm (C, D, F, G).
Figure 3 with 2 supplements
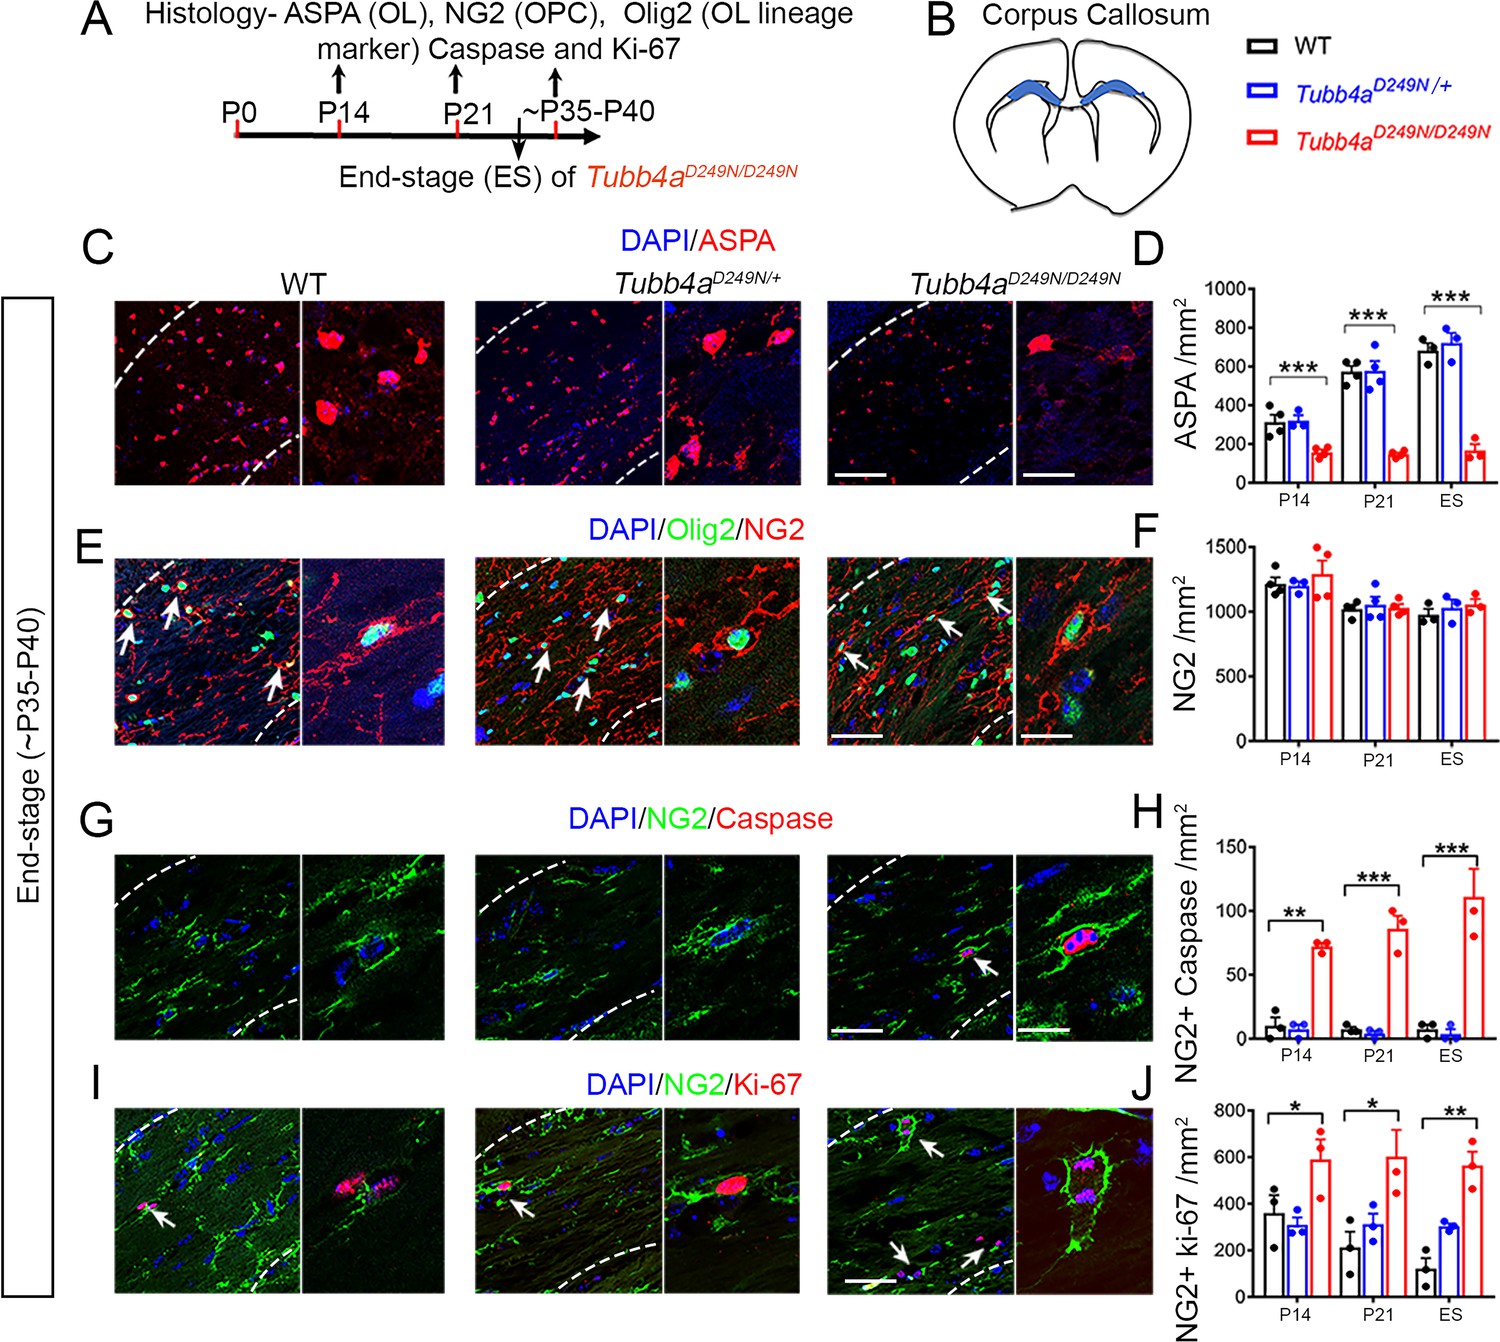
Tubb4aD249N/D249N mice display reduced number of oligodendrocytes (OLs) and apoptotic Oligodendrocytes progenitor cells (OPC).
(A) Schematic diagram displaying the time course of immunohistochemical assay. (B) Schematic diagram showing area of corpus callosum used to perform counts (blue region). (C) Representative images of ASPA-positive OLs in WT, Tubb4aD249N/+, and Tubb4aD249N/D249N mice at the end-stage (ES;~P35-P40). (D) Quantification of ASPA-positive cells/mm2 at P14, P21, and ~P35-P40 in WT, Tubb4aD249N/+, and ES Tubb4aD249N/D249N mice. (E) Representative images of double-positive NG2+ Olig2+ cells in WT, Tubb4aD249N/+, and Tubb4aD249N/D249N mice at ES. (F) Quantification of double-positive NG2+ Olig2+ cells/mm2 at P14, P21, and ~P35-P40 in WT, Tubb4aD249N/+, and ES Tubb4aD249N/D249N mice. (G) Representative images of double-positive NG2+ caspase cells in WT, Tubb4aD249N/+, and Tubb4aD249N/D249N mice at ES. (H) Quantification of double-positive NG2+ caspase cells/mm2 at P14, P21, and ~P35-P40 of WT, Tubb4aD249N/+, and ES Tubb4aD249N/D249N mice. (I) Representative images of double-positive NG2+ Ki-67 cells in WT, Tubb4aD249N/+, and Tubb4aD249N/D249N mice at ES. (J) Quantification of double-positive NG2+ Ki-67 cells/mm2 at P14, P21, and ~P35-P40 of WT, Tubb4aD249N/+, and ES Tubb4aD249N/D249N mice. Statistical test is performed by two-way ANOVA, followed by Tukey post-hoc test. Representative data of two independent experiments with n = 3–4 mice/group for P14 and P21 and n = 3 mice/group for ES. Data is presented as mean and SEM. *p<0.05 and ***p<0.001. Scale bars = 50 µm and 25 µm.
-
Figure 3—source data 1
Source files of graphical data for Oligodendrocyte lineage cells in the Corpus callosum.
- https://cdn.elifesciences.org/articles/52986/elife-52986-fig3-data1-v1.docx
Figure 3—figure supplement 1

Tubb4aD249N/D249N mice show reduced number of oligodendrocytes at P14 and P21.
(A–B) Representative images of ASPA-positive OLs in sections of the corpus callosum from WT, Tubb4aD249N/+, and Tubb4aD249N/D249N mice at the P14 (A) and P21 (B). (C–D) Representative images of double-positive NG2+ Olig2+ cells in WT, Tubb4aD249N/+, and Tubb4aD249N/D249N mice at the P14 (C) and P21 (D). (E) Quantification of counts of Olig2+ cells at P14, P21, and ES of WT, Tubb4aD249N/+, and Tubb4aD249N/D249N mice. Statistical test is performed by two-way ANOVA, followed by Tukey post-hoc test. Data is presented as mean and SEM. Scale bars = 50 µm and 25 µm.
Figure 3—figure supplement 2
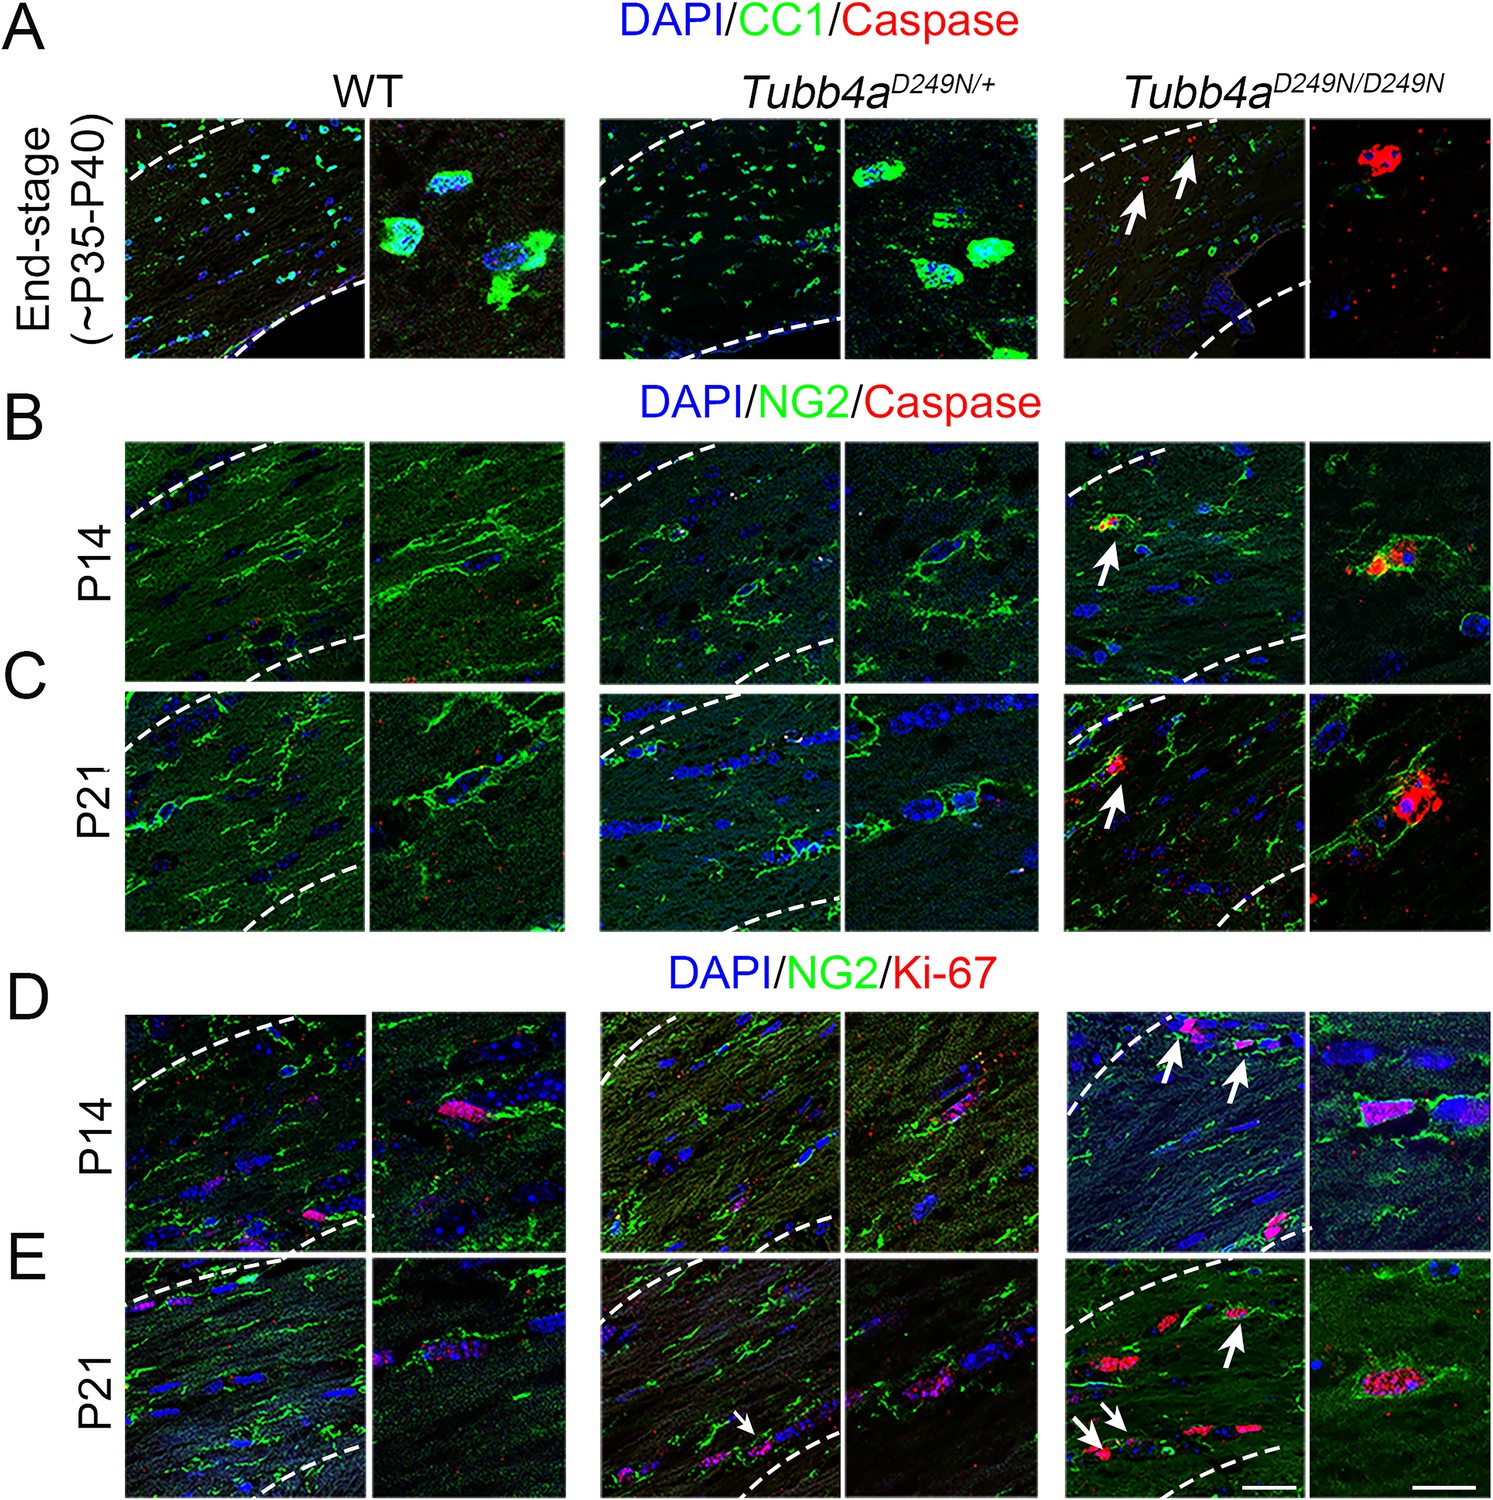
Tubb4aD249N/D249N mice show Oligodendrocyte progenitor cell (OPC) death and proliferation at P14 and P21.
(A) Representative images of double positive CC1 (OL marker) + Caspase+ in WT, Tubb4aD249N/+, and Tubb4aD249N/D249N mice at end-stage (P35–P40) of Tubb4aD249N/D249N mice. (B–C) Representative images of double positive NG2+ Caspase in WT, Tubb4aD249N/+, and Tubb4aD249N/D249N mice at P14 (B) and P21 (C). (D–E) Representative images of double positive NG2+ Ki-67+ in WT, Tubb4aD249N/+, and Tubb4aD249N/D249N mice at P14 (D) and P21 (E). Scale bars = 50 µm and 25 µm.
Figure 4 with 2 supplements
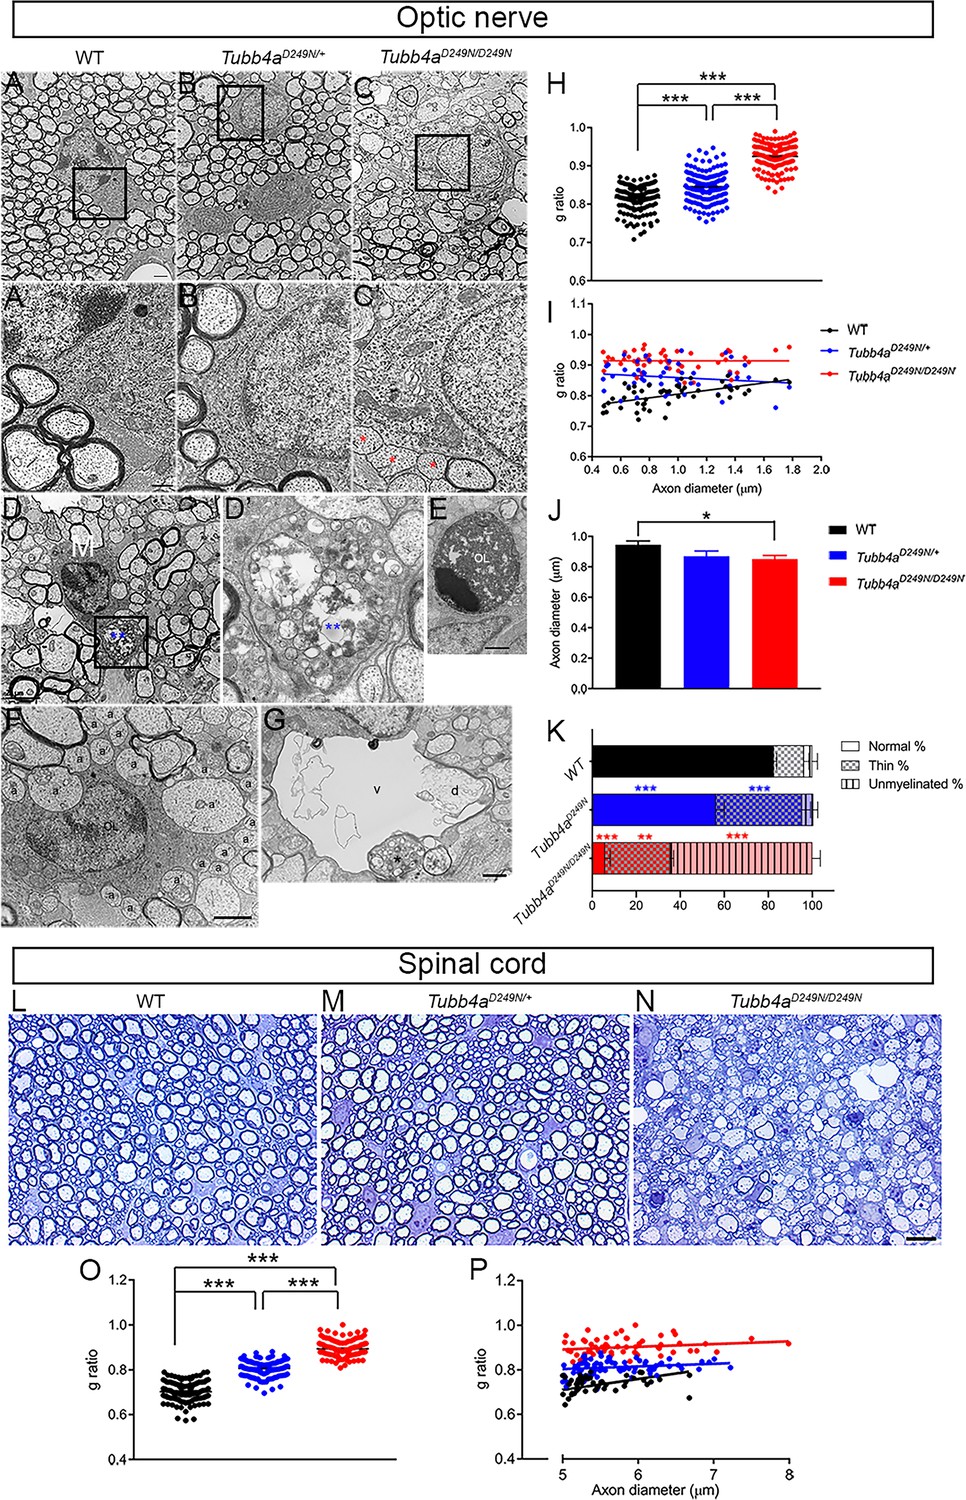
Ultrastructural myelin abnormalities in optic nerves and spinal cord of Tubb4aD249N/+ and Tubb4aD249N/D249N mice.
(A–C) Representative electron microscopic (EM) images of optic nerves from WT, Tubb4aD249N/+, and Tubb4aD249N/D249N mice at end-stage (~P35) as indicated. Scale bar = 800 nm. The regions bounded by the rectangles are shown at higher magnification in (A’–C’), and illustrate the myelin sheath thickness. Red asterisks = unmyelinated axons, black asterisk = thinly myelinated axon. Scale bar = 400 nm. (D) Microglial cell/macrophage (M) containing phagocytosed material (blue asterisks) in Tubb4aD249N/D249N. The region bounded by rectangle is shown at higher magnification in D’. Scale bar = 2 µm. (E) This electron microscopic image shows an apoptic nucleus, presumably an oligodendrocyte (OL). Scale bar = 1 μm. (F) This EM image shows unmyelinated axons that appose (a) or are surrounded by (a’) processes of an oligodendrocyte (OL). (G) A degenerating axon (d) with an incomplete axolemma, in a vacuole (v). The asterisk marks an axon containing vesicles. (H) g-ratios in optic axons from WT, Tubb4aD249N/+, and Tubb4aD249N/D249N mice. (H) g-ratio plotted against axon diameter for WT, Tubb4aD249N/+, and Tubb4aD249N/D249N mice. (I) Optic axon diameters (mean and SEM) for WT, Tubb4aD249N/+, and Tubb4aD249N/D249N mice; 50 axons per animals. (K) % myelination in the optic nerve of end stage mice (L–N) Representative semi-thin sections of spinal cord from WT, Tubb4aD249N/+, and Tubb4aD249N/D249N mice at end-stage (~P35) as indicated. Scale bar = 10 µm. (O) g-ratios in ventral funiculus of spinal cord from WT, Tubb4aD249N/+, and Tubb4aD249N/D249N mice. (P) g-ratio plotted against axon diameter in ventral funiculus of spinal cord from WT, Tubb4aD249N/+, and Tubb4aD249N/D249N mice. (n = 3 animals per group). One-way ANOVA was performed on the data set followed by Tukey post-hoc test. Data is presented as mean and SEM. *p<0.05, **p<0.001, ***p<0.001.
-
Figure 4—source data 1
Source files of graphical data for Electron microscopy.
- https://cdn.elifesciences.org/articles/52986/elife-52986-fig4-data1-v1.docx
Figure 4—figure supplement 1
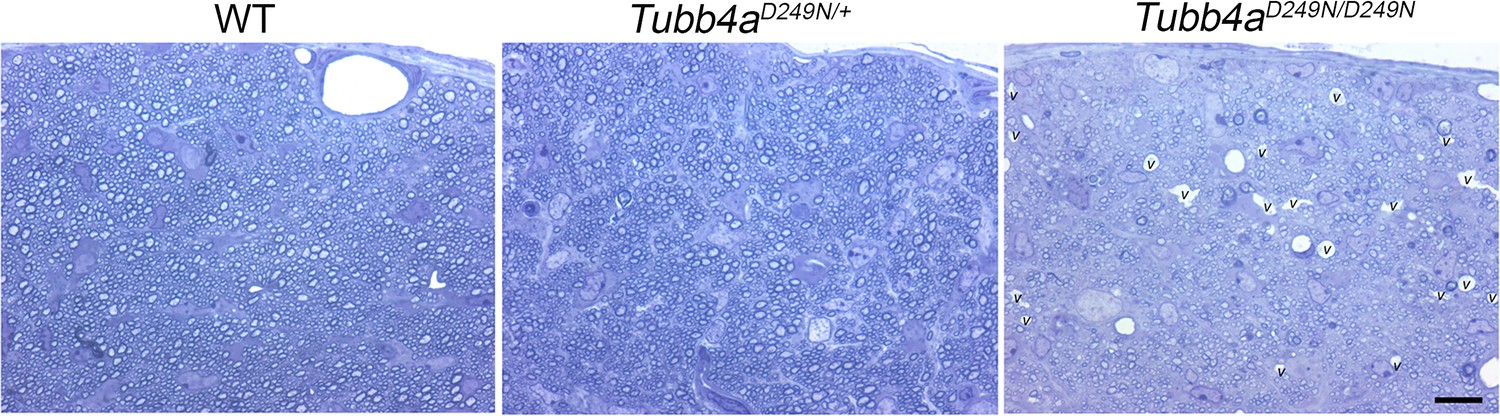
Hypomyelination and axon loss in Tubb4aD249N/D249N optic nerve at P21.
Representative light microscopic image of optic nerve from WT, Tubb4aD249N/+, and Tubb4aD249N/D249N mice at P21. Empty areas designated as ‘v’ represents vacuole suggesting dying axons in Tubb4aD249N/D249N mice.
Figure 4—figure supplement 2

Hypomyelination in Tubb4aD249N/+ and Tubb4aD249N/D249N spinal cords at end-stage (~P35-P40).
(A–C) Representative electron microscopic (EM) images of ventral spinal cord from WT, Tubb4aD249N/+, and Tubb4aD249N/D249N mice at end-stage. Scale bar = 1 μm (A’–C’) Higher magnification images showing thinner myelin sheaths surrounding large axons in Tubb4aD249N/+ and Tubb4aD249N/D249N mice compared to WT. A microglial cell/macrophage (M) contain lipid droplets is illustrated in the Tubb4aD249N/D249N images. Scale bar = 1 µm.
Figure 5 with 1 supplement

Tubb4aD249N/D249N mice show severe cerebellar granular neuronal loss and significant striatal neuronal loss.
(A) Schematic diagram displaying the time course of immunohistochemical assays. (B) Schematic diagram showing the whole brain mounts of WT, Tubb4aD249N/+, and Tubb4aD249N/D249N mice at P40. (C) Nissl stain images of cerebellum at P21 and P40 of WT and Tubb4aD249N/D249N mice. (D) Representative images of NeuN (green) showing cerebellar granular neurons at P21 and End-stage (ES;~P35-P40) of WT and Tubb4aD249N/D249N mice. (E) Quantification of cerebellar granular neuron (NeuN; green) counts/mm2 at P14, P21, and ES. (F) Representative images of double immuno-positive cerebellar granule neurons stained by NeuN+ (green) and cleaved caspase 3+ (red) (as shown by white arrow) at P21 and ES of WT and Tubb4aD249N/D249N mice. (G) Quantification of double-positive NeuN+ (cerebellar granule neurons) and caspase+ (red) counts/mm2 at P14, P21, and ES. (H) Schematic diagram of striatum showing area used for quantifying neuronal counts (by dashed box). (I) Representative images of striatal neurons stained by NeuN (green) at ES of WT, Tubb4aD249N/+, and Tubb4aD249N/D249N mice. (J) Quantification of striatal neuronal counts/mm2 at P14, P21, and ES in WT, Tubb4aD249N/+, and Tubb4aD249N/D249N mice. Statistical test was performed by two-way ANOVA, followed by Tukey post-hoc test. Representative data of two independent experiments with n = 4 mice/group for P14 and P21 (except n = 3 for Tubb4aD249N/+ for P14 time point) and n = 3 mice/group for ES. Scale bar = 1 mm (C, D, H) or 25 µm (F) or 250 µm (I). Data is presented as mean and SEM. *p<0.05 and ***p<0.001.
-
Figure 5—source data 1
Source files of graphical data for Cerebellar granule neurons and striatal neurons quantification.
- https://cdn.elifesciences.org/articles/52986/elife-52986-fig5-data1-v1.docx
Figure 5—figure supplement 1
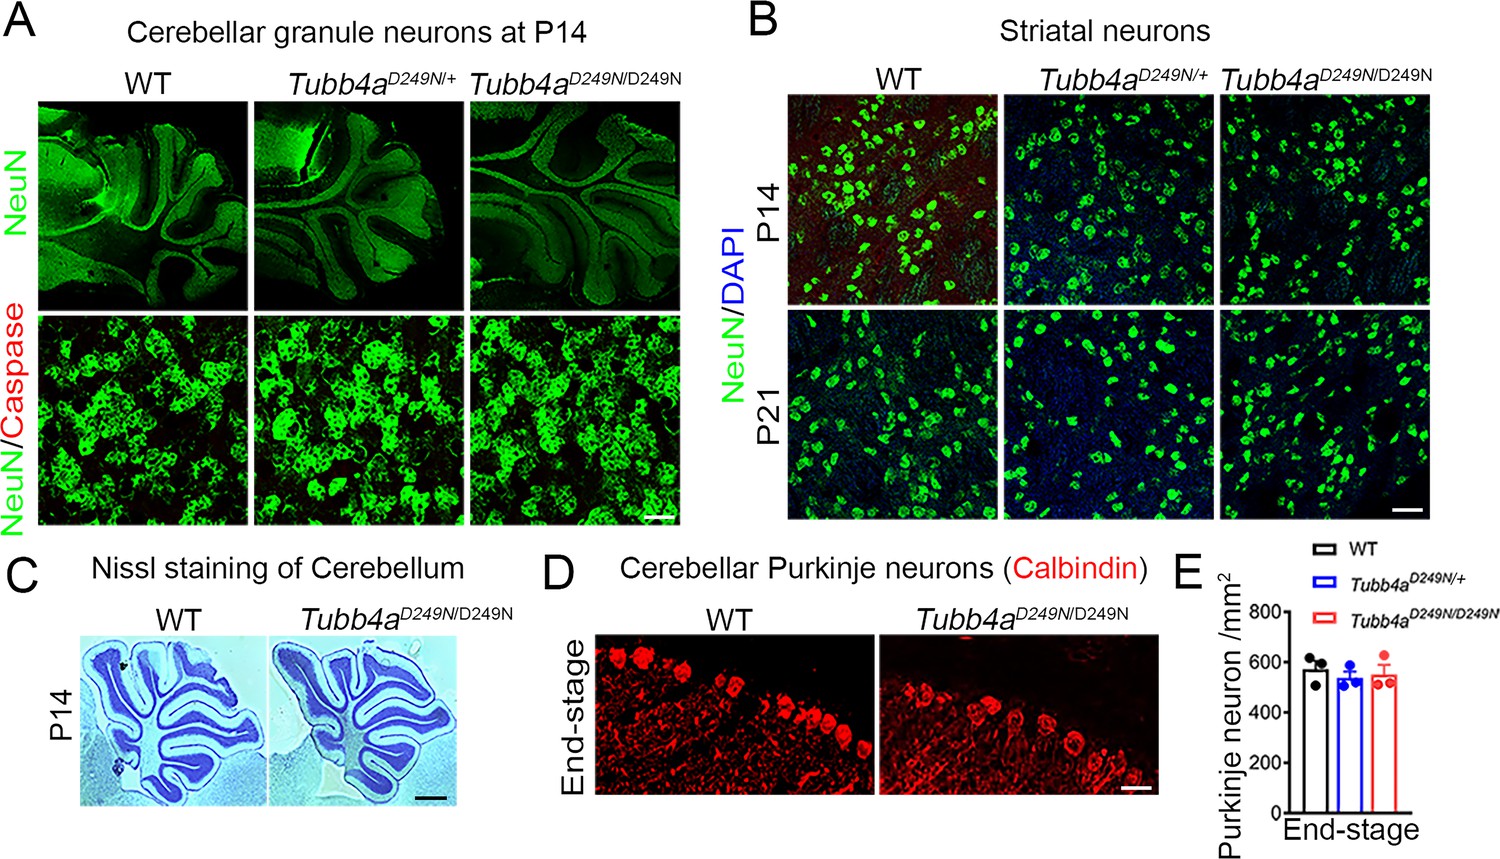
Tubb4aD249N/D249N mice show comparable Purkinje neuronal counts.
(A) Representative images of cerebellar granule neurons and caspase staining at P14 of WT, Tubb4aD249N/+ and Tubb4aD249N/D249N mice. (B) Representative images of striatal neurons at P14 and P21 of WT, Tubb4aD249N/+ and Tubb4aD249N/D249N mice. Data are quantified in Figure 5 (C) Nissl staining at P14 of WT and Tubb4aD249N/D249N mice. (D) Representative images of Purkinje neurons stained by calbindin at P21 and end-stage of WT, Tubb4aD249N/+ and Tubb4aD249N/D249N mice. (E) Quantification of Purkinje neuronal counts/mm2 at P21 and end-stage of WT, Tubb4aD249N/+ and Tubb4aD249N/D249N mice. Scale bar = 1 mm (‘A’ Upper panel and C) or Scale bar = 50 µm (‘A’ lower panel) or Scale bar = 100 µm (B, D) Statistical test is performed by two-way ANOVA, followed by Tukey post-hoc test. Data is presented as mean and SEM.
Figure 6 with 1 supplement

Oligodendrocytes and neurons from Tubb4aD249N/+ and Tubb4aD249N/D249N mice display reduced branching and processes.
(A–C) Representative images of PLP labeled oligodendrocytes (OL) isolated from WT, Tubb4aD249N/+, and Tubb4aD249N/D249N mice. Scale bar = 50 μm. (D) The number of Olig2 labeled cells were counted in coverslips from WT, Tubb4aD249N/+, and Tubb4aD249N/D249N mice and plotted as percentage of Olig2+ cells in WT animals. (E) Total number of PLP+ cells quantified from WT, Tubb4aD249N/+, and Tubb4aD249N/D249N mice were plotted as a percentage of PLP+ cells in WT animals. (F) Number of mature PLP+ cells from the total Olig2+ cells were plotted as a percent of WT animals. The experiments were repeated at least three independent times (n = 3). (G) Representative images of cortical neurons from WT mice stained with Tuj1 (axonal marker) and MAP2 (dendritic marker). (H) Representative images of cortical neurons from Tubb4aD249N/D249N mice stained with Tuj1 and MAP2. Scale bar = 75 μm. (I) Number of surviving neurons at 1 week post-plating were quantified and plotted as percent of WT neurons. (J) Axon length was measured using Neurite tracer plugin and plotted for all groups. (K) Dendritic length was measured using Neurite tracer plugin and plotted for all groups. All experiments were conducted at least three independent times, with n = 1–3 pups/genotype and technical replicate of n = 3/ pup. Data is presented as mean and SEM. One-way ANOVA was performed on the data set followed by Tukey post-hoc test. *p<0.05, ***p<0.001.
-
Figure 6—source data 1
Source files of graphical data for Oligodendrocyte and neuron culture.
- https://cdn.elifesciences.org/articles/52986/elife-52986-fig6-data1-v1.docx
Figure 6—figure supplement 1
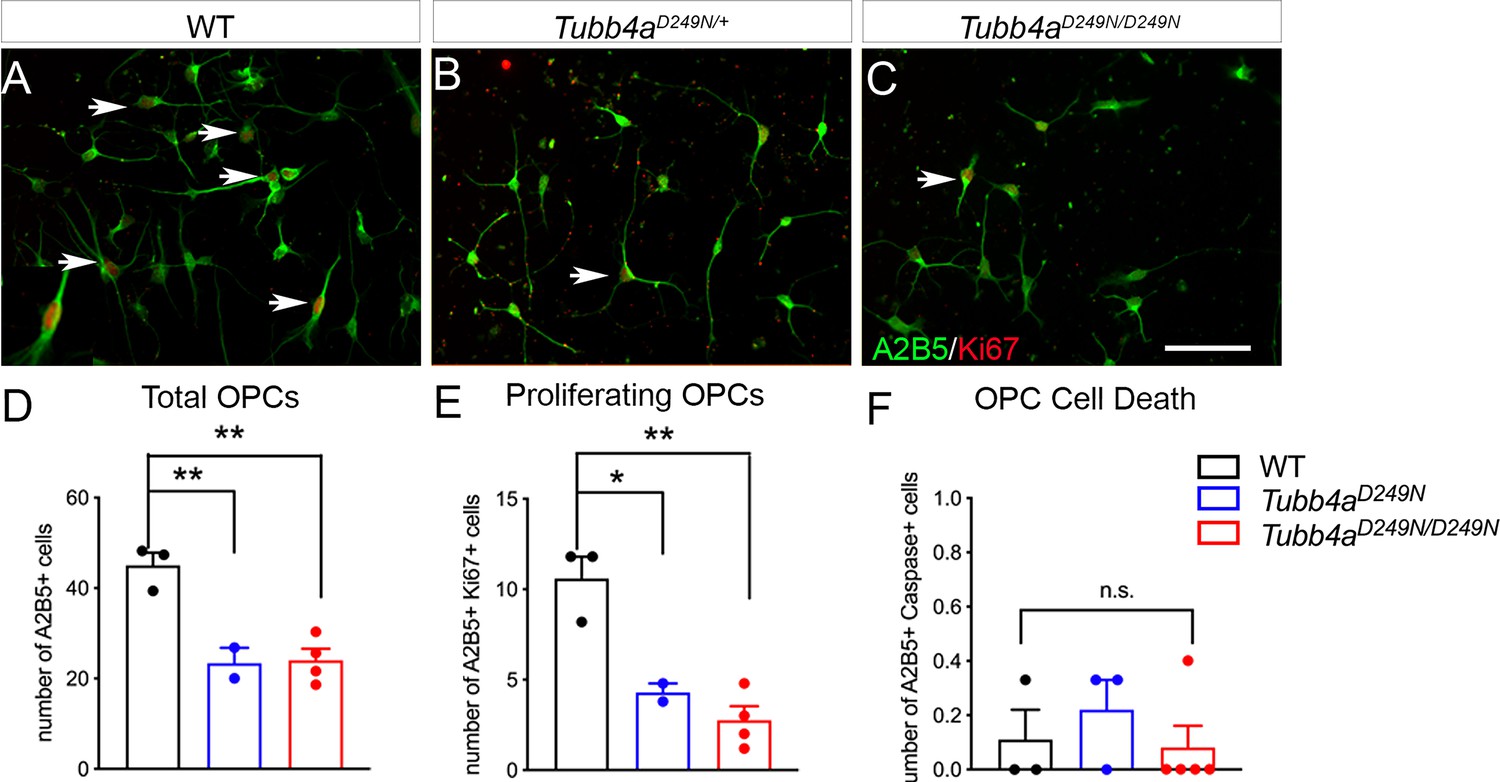
Tubb4aD249N/D249N mice show decreased proliferation and no change in OPC death in vitro.
(A) Representative images of double positive A2B5 (OPC marker) and Ki-67 cells in WT, Tubb4aD249N/+, and Tubb4aD249N/D249N mice (D) Total number of A2B5+ OPCs (E) Number of proliferating OPCs (F) Number of dying OPCs labeled with A2B5+ Caspase+ cells. Scale bar = 50 µm. n = 1–3 pups/genotype with technical replicate of n = 3/ pup.
Figure 7 with 1 supplement
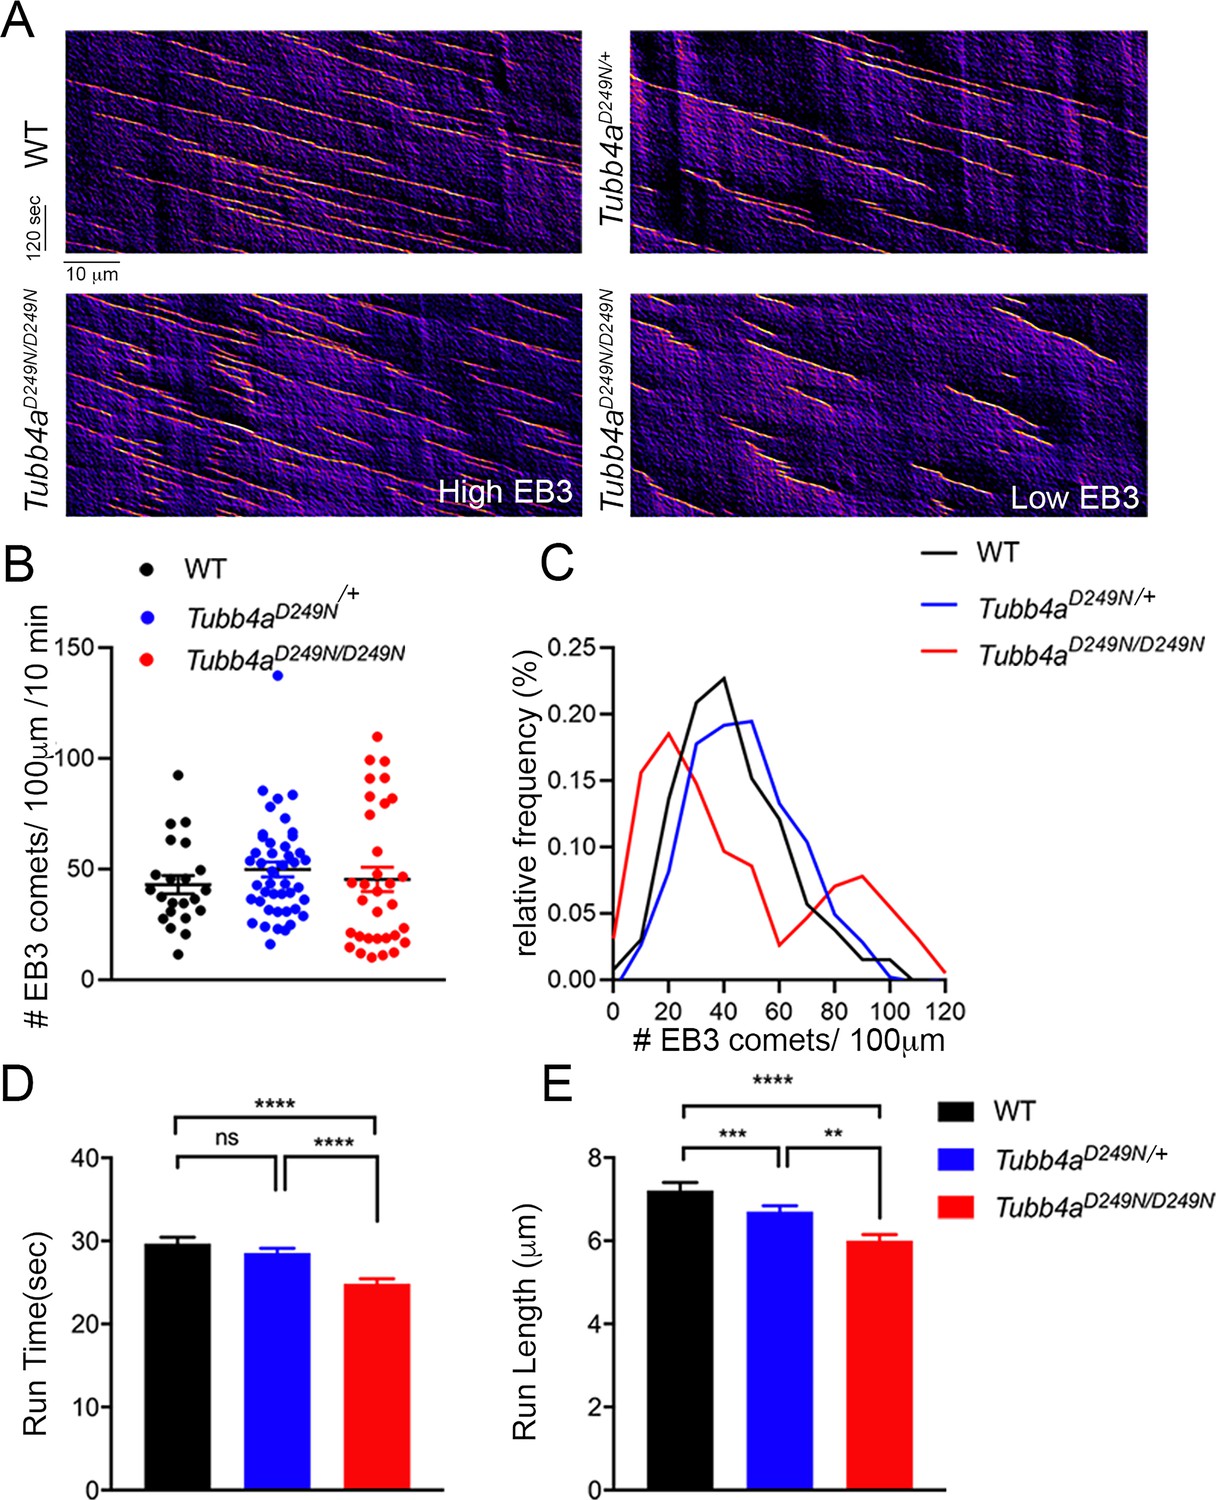
Microtubule polymerization is affected in Tubb4aD249N/+ and Tubb4aD249N/D249N mice.
(A) Example kymographs generated based on EB3 tracking from WT, Tubb4aD249N/+, and Tubb4aD249N/D249N cortical neurons. EB3 comet frequency was not significantly different (B) but a histogram depicting EB3 comet run-time relative frequency (C) suggests two different populations of EB3 comets. (D) Run-length and (E) Run-time of EB3 comets plotted for WT, Tubb4aD249N/+, and Tubb4aD249N/D249N were significantly shorter in Tubb4aD249N/+ and Tubb4aD249N/D249N mice. All experiments were conducted at least three independent times, with n = 1–3 pups/genotype and technical replicate of n = 3/pup. Data is presented as mean and SEM. One-way ANOVA was performed on the data set followed by Tukey post-hoc test. *p<0.05, **p<0.001, ***p<0.001.
-
Figure 7—source data 1
Source files of graphical data for Microtubule dynamics data.
- https://cdn.elifesciences.org/articles/52986/elife-52986-fig7-data1-v1.docx
Figure 7—figure supplement 1
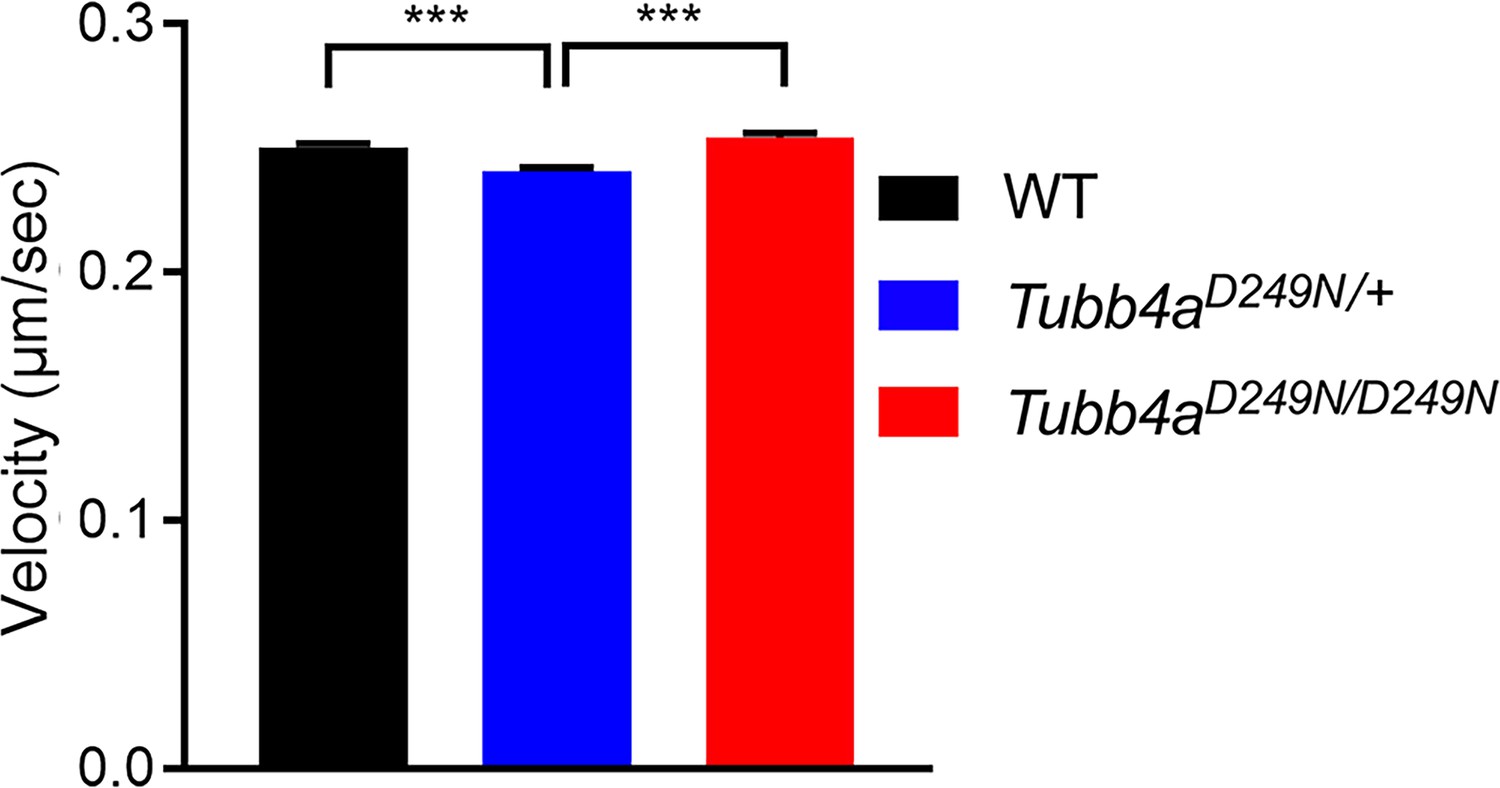
Tubb4aD249N/+ and Tubb4aD249N/D249N mice show altered MT dynamics.
Velocity plotted for WT, Tubb4aD249N/+, and Tubb4aD249N/D249N microtubule polymerization based on EB3 trafficking. n = 1–3 pups/genotype with technical replicate of for n = 3/ pup and all experiments were at least three independent times. Data is presented as mean and SEM. One-way ANOVA was performed on the data set followed by Tukey post-hoc test. ***p<0.001.
Tables
Table 1
Ambulation scores.
Mice were scored using a single trial on crawling, gait symmetry, and limb-paw movement during a straight walk. Ambulation scores were given as mentioned in table.
| Ambulatory skills | Score |
|---|---|
| No response | 0 |
| Asymmetric crawling | 1 |
| Symmetric crawling | 2 |
| Walking | 3 |
Key resources table
| Reagent type (species) or resource | Designation | Source or reference | Identifiers | Additional information |
|---|---|---|---|---|
| Genetic reagent (Mus musculus) Background: C57BL/6J | Tubb4a Accession number: NM_009451.3 | Mouse model designed at Cyagen | Mouse Tubb4a Knockin Project (CRISPR/Cas9) with p.Asn249Asn (D249N) mutation | Target region of mouse Tubb4a locus modified and D249N mutation was introduced (Tubb4aD249N/+) |
| Sequence-based reagent | gRNA sequence 1 (Matches forward strand of Tubb4a gene) | Cyagen designed | CAATGCAGATCTACGCAAGCTGG | |
| Sequence-based reagent | gRNA sequence 2 (Matches reverse strand of Tubb4a gene) | Cyagen designed | CAATGCAGATCTACGCAAGCTGG | |
| Mouse genotyping And Sequence based reagents | To identify the genotype of Tubb4aD249N/+ mouse | Taq-Takara | PCR forward and reverse primers and Sequencing | 5’CCGAGAGGAGTTTCCAGACAGACAGGATC3’ 5’GCTCTGCACACTTAACATCTGCTCG 3’ |
| Antibody | anti- PLP (Rat monoclonal) | IDDRC hybridoma, courtesy Dr. Judith Grinspan | RRID:AB_2827948 | Dilution Used for IF: 1:1 Dilution Used for Western blot: 1:1000 |
| Antibody | anti-MBP (Rabbit polyclonal) | Abcam | Cat#: ab40389 RRID:AB_1141521 | Dilution Used for IF: 1:250 Dilution Used for Western blot: 1:1000 |
| Antibody | anti-NG2 (Rabbit polyclonal) | US biological | Cat#: C5067-70D RRID:AB_2827946 | Dilution Used for IF: 1:250 |
| Antibody | anti-NG2 (Mouse monoclonal) | Thermo Fisher Scientific | Cat#: #37–2700 RRID:AB_2533307 | Dilution Used for IF: 1:100 |
| Antibody | anti-Olig2 (Rabbit polyclonal) | Millipore | Cat#: MABN50 RRID:AB_10807410 | Dilution Used for IF: 1:100 |
| Antibody | anti-NeuN (Mouse monoclonal) | Millipore | Cat#: MAB377 RRID:AB_2298772 | Dilution Used for IF: 1:100 |
| Antibody | anti-cleaved Caspase 3 (Rabbit polyclonal) | Cell signaling | Cat#: #9579 RRID:AB_10897512 | Dilution Used for IF: 1:100 |
| Antibody | anti- Ki-67 (Rabbit polyclonal) | Thermo Fisher Scientific | Cat#: #RM9106S0 RRID:AB_2341197 | Dilution Used for IF: 1:100 |
| Antibody | anti-calbindin (Rabbit polyclonal) | Swant | Cat#: CB38 RRID:AB_2721225 | Dilution Used for IF: 1:250 |
| Antibody | anti-A2B5 (Mouse monoclonal) | IDDRC hybridoma, courtesy Dr. Judith Grinspan | RRID:AB_2827951 | Dilution Used for IF: 1:1 |
| Antibody | anti-MAP2 (Mouse monoclonal) | Sigma | Cat#: 1406 RRID:AB_477171 | Dilution Used for IF: 1:200 |
| Antibody | anti-Tuj1 (Mouse monoclonal) | Abcam | Cat#: ab18207 RRID:AB_444319 | Dilution Used for IF: 1:200 |
| Transfected construct (Mouse) | end-binding protein 3 (EB3) -mCherry | Obtained by Dr. Erika Holzbaur | (Guedes-Dias et al., 2019) | |
| qRT-PCR primer | Tubb4a Primers | Integrated DNA Technologies | Custom Designed | Tubb4a primer: Probe: 5’-/5FAM/ATGACCTCC/ZEN/CAGAACTTGGCCC/3IABkFQ /- 3’ Primer 1: 5’GACACCCGTCCATCAGCA3’ Primer 2: 5’GTCGATGCCGTGCTCAT-3’ |
| qRT-PCR primer | sfrs9 Primers | Integrated DNA Technologies | Custom Designed | Probe: 5’-/5HEX/CAGACATCC/ZEN/CCAGCTTCTCGCAT/3IABkFQ /- 3’ Primer 1: 5’TTCAACCATCCCCATTCCG-3’ Primer 2: 5’CCTCCTACAACAAGACGGTCAGAT-3’ |
| Software | Graphpad Prism | Graphpad Prism | Graphpad Prism 9 RRID:SCR_002798 | |
| Other | DAPI stain | Invitrogen | Cat#: P36931 | 1 µg/mL |
Additional files
Download links
A two-part list of links to download the article, or parts of the article, in various formats.
Downloads (link to download the article as PDF)
Open citations (links to open the citations from this article in various online reference manager services)
Cite this article (links to download the citations from this article in formats compatible with various reference manager tools)
TUBB4A mutations result in both glial and neuronal degeneration in an H-ABC leukodystrophy mouse model
eLife 9:e52986.
https://doi.org/10.7554/eLife.52986


