Limitation of adipose tissue by the number of embryonic progenitor cells
- Laboratory of Molecular Genetics, The Rockefeller University, United States
- Howard Hughes Medical Institute, The Rockefeller University, United States
- Laboratory of Metabolic Regulation and Genetics, The Rockefeller University, United States
- Gene Targeting Resource Center, The Rockefeller University, United States
Figures
Figure 1 with 1 supplement

AZIP-Blastocyst Complementation with Pluripotent CAG-hTubYFP-ES Cells Using Microinjection.
(A) Schematic representation of the blastocyst complementation procedure. AZIP- and WT-blastocysts isolated from donor females cannot be distinguished and are both injected with ES cells. ES-cells of B6-Tyrc background are labeled with CAG-driven human-tubulin-YFP (CAG-hTubYFP). Chimeric animals carrying both AZIP-cells and YFP-ES cells (WT:AZIP-chimeras) have normal amounts of adipose tissue exclusively derived from ES-progenies. Chimeric animals derived from injected WT-blastocysts are used as controls (WT:WT-chimeras) and have adipose tissue derived from both blastocyst- and ES-progenies. AZIP-blastocysts that failed to incorporate ES-cells remain lipodystrophic (non-chimeric AZIP). (B) Immunohistochemistry of paraffin section of inguinal adipose tissue of one WT:AZIP-chimera. All adipocytes, as shown to be FABP4-positive cells (red), are YFP-positive (green). Nuclei are stained with DAPI (blue). WT:AZIP-Chimeras in FVB Background Showed Normalized Adiposity and Mixed Metabolic Parameters. (C) Growth curve of AZIP (solid blue circle), WT:AZIP-chimera (open blue circle), and WT:WT-chimera (open black triangle). There is no significant difference at all points measured, from 4 to 14 weeks old, among all groups of animals. (D) Body adiposity as measured by DEXA of animals. AZIP animals have generalized lipodystrophy and have no visible gross adipose tissue and measured about 9.5% adiposity (attributed by fatty livers). ES cell complementation significantly increased (p=0.0002) adiposity to wild-type levels, 17.5% for WT:AZIP-chimera and 19.3% for WT:WT-chimera. (E) Serum leptin measurements. AZIP mice showed no detectable level of leptin and complementation restored leptin to wild-type level, 8.5 ng/mL for WT:AZIP-chimera vs. 12.1 ng/mL for WT:WT-chimera. (F) Blood glucose levels at 12 weeks old. In FVB, AZIP animals are severely diabetic with >600 mg/dL blood glucose. Blood glucose level is normalized by complementation. (G) Insulin level at 12 weeks. Consistent with glucose level, WT:AZIP-chimeras have significantly lower insulin in serum, but it is not completely normalized to wild-type level. (H) Liver triglyceride level at 14 weeks old. As a result of adipose tissue being restored, WT:AZIP-chimeras have normalized liver triglyceride levels, which is significantly lower than in AZIP animals. From (A) to (E) n = 6 for AZIP (solid blue), n = 11 for WT:AZIP-chimera (patterned blue), and n = 9 for WT:WT-chimera (black). For (F), n = 3 for AZIP (solid blue), n = 5 for WT:AZIP-chimera (pattern blue), and n = 7 for WT:WT-chimera (black).
Figure 1—figure supplement 1
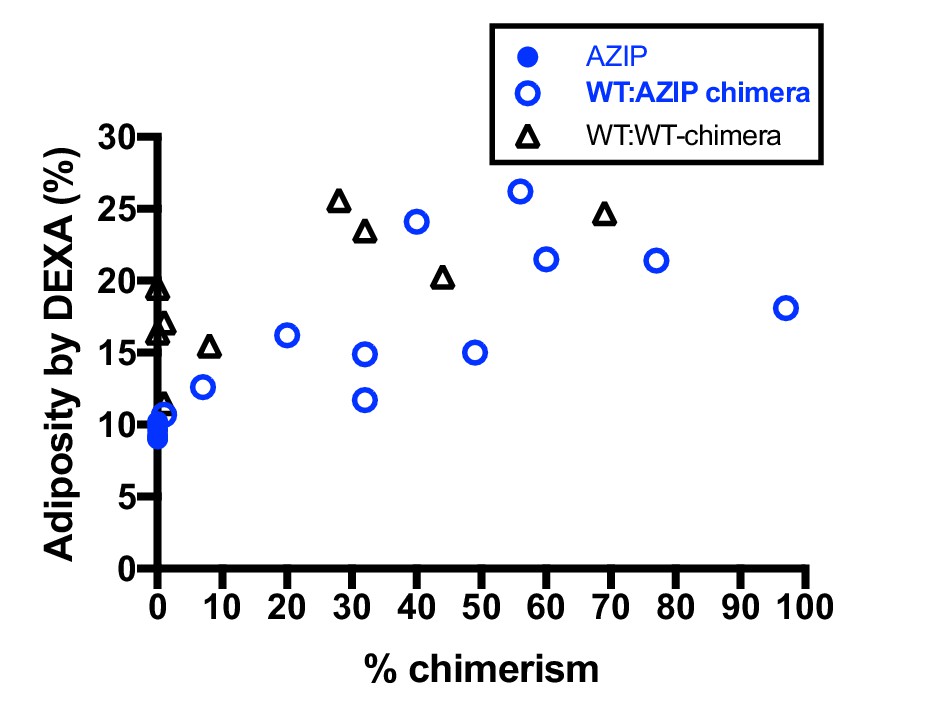
Body adiposity by DEXA of AZIPs, WT:AZIP- and WT:WT-chimeric animals vs % chimerism.
There is no significant difference between the adiposity of animals at increasing chimerism. n = 6 for AZIP(closed blue circle), n = 11 for WT:AZIP-chimera (open blue circle), and n = 9 for WT:WT-chimera (black triangle).
Figure 2 with 1 supplement

WT:AZIP-Chimeric mice in b6 background have normalized adiposity and fully complemented metabolic parameters on chow diet.
(A) Body weight of AZIPs (solid red), WT:AZIP-chimeras (open red), and WT:WT-chimeras (black triangle) from 3 weeks to 24 weeks old. No difference in body weight was observed between WT:AZIP- and WT:WT-chimeras at all ages measured, except for AZIP mice that show significantly lowered body weight at weaning age (3 and 4 weeks old) but no difference is detected afterwards. (B) Body fat content measured by MRI at 12 weeks versus chimerism. There were no significant differences between AZIP and WT:AZIP-chimeric mice but WT:AZIP-chimeric mice are generally leaner than WT:WT-chimeric mice. (C) Serum leptin levels versus chimerism. AZIP mice have non-detectable levels of leptin and WT:AZIP-chimeras show serum leptin levels ranging from 0.6 to 12.5 ng/mL that is intermediate to AZIPs and WT:WT chimeras. No correlation is seen between chimerism and leptin levels in WT:AZIPs and WT:WTs. (D) Serum leptin and percent fat content correlate well in both WT:AZIP- and WT:WT-chimeras. There is no significant difference between the slopes of the two linear regressions. Two statistical outliers of WT-chimera with high leptin were excluded. Together, the results show that AZIP-chimeras form adipose tissue with normal leptin production despite a general reduction in adiposity. (E) Blood glucose levels at 12 weeks old. AZIPs are significantly higher than WT:AZIP and WT:WT-chimeras (297 ± 24 mg/dL for AZIPs vs. 193 ± 11 mg/dL for WT:AZIPs p=0.0005) and WT:AZIPs and WT:WT were the same (193 ± 11 mg/dL for WT:AZIPs vs 182 ± 7 mg/dL for WT:WTs, p=0.4). (F) Insulin level at 12 weeks. AZIP hyperinsulinemia was rescued in WT:AZIP-chimeras, from 117 ± 10 ng/mL to 8.2 ± 3.6 ng/mL (p<0.0001). (G) Liver weight. Liver weight is normalized by complementation (5.8 ± 0.5 for AZIPs vs 2.1 ± 0.2 g in WT:AZIPs; p=6xE-4 and 1.7 ± 0.1 g for WT:WTs). For (A) to (F), n = 17 for AZIP, n = 17 for WT:AZIP, and n = 19 for WT:WT-chimeras. For (G), n = 9 for AZIP, n = 12 for WT:AZIP and n = 14 for WT-chimeras, and liver analysis are performed at 6 months old.
Figure 2—figure supplement 1
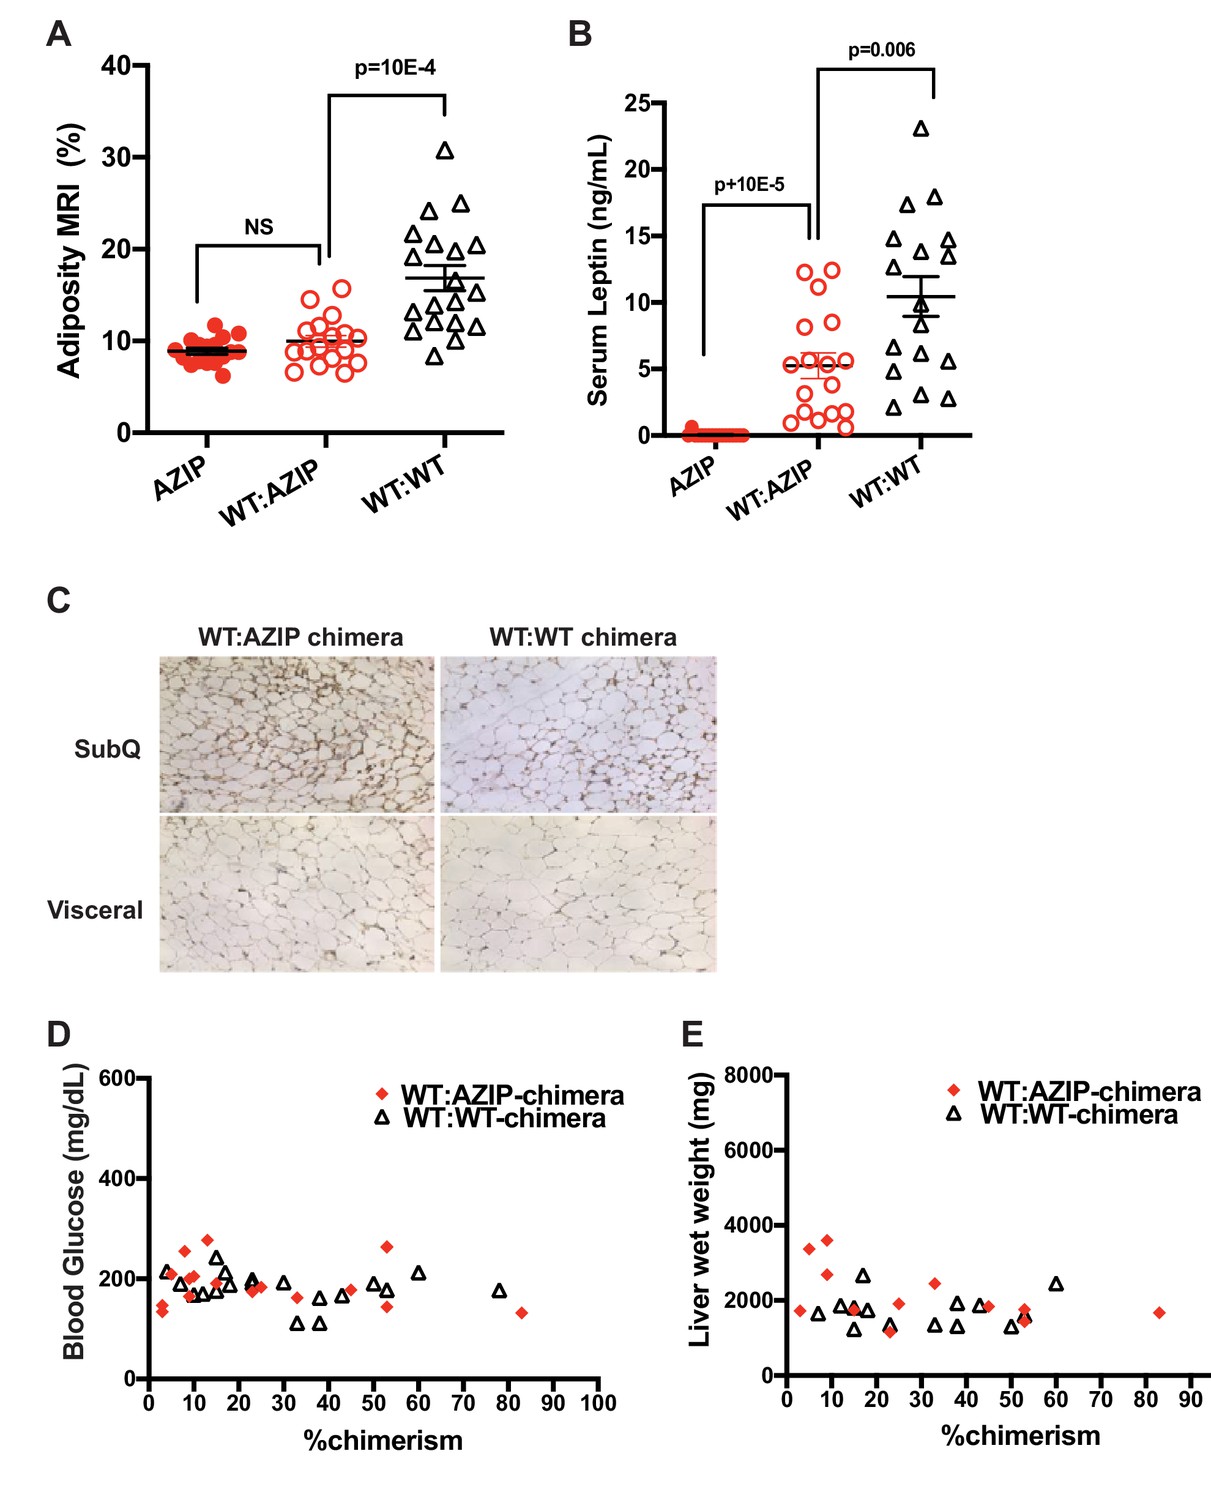
B6 Chimeras on Chow Diet.
(A) Body fat content measured by MRI at 12 weeks. There were no significant difference between AZIP and WT:AZIPs and WT:AZIP-chimeric mice are generally leaner than WT:WT-chimeric mice. (B) Serum leptin levels of three groups of animals. Complementation by ES-cells rescued hypoleptinemia phenotype, where non-chimeric AZIP mice have non-detectable levels of leptin and AZIP-chimeras show serum leptin levels ranging from 0.6 to 12.5 ng/mL. (C) Microscopy study of epididymal white adipose tissue (visceral) and inguinal subcutaneous white adipose tissue (SubQ) of WT:AZIP- and WT:WT-chimeras. AZIP-chimera shown here is 10% chimeric and WT-chimera was 8% chimeric. Brown color represents staining for YFP. Note comparable cell size in both tissues. (D) Chimerism versus blood glucose in WT:AZIP- and WT:WT-chimeras. No difference was detected between high and low percent chimerism. (E) Liver wet weight in mg in WT:AZIP and WT:WT chimeras show no relationship to degree of chimerism. For (A), (B) and (D), n = 17 for AZIP, n = 17 for WT:AZIP-chimeras, and n = 19 for WT:WT-chimeras. For (E), n = 12 for WT:AZIP-chimera, and n = 14 for WT:WT-chimeras, and liver analysis are performed at 6 months old.
Figure 3 with 1 supplement
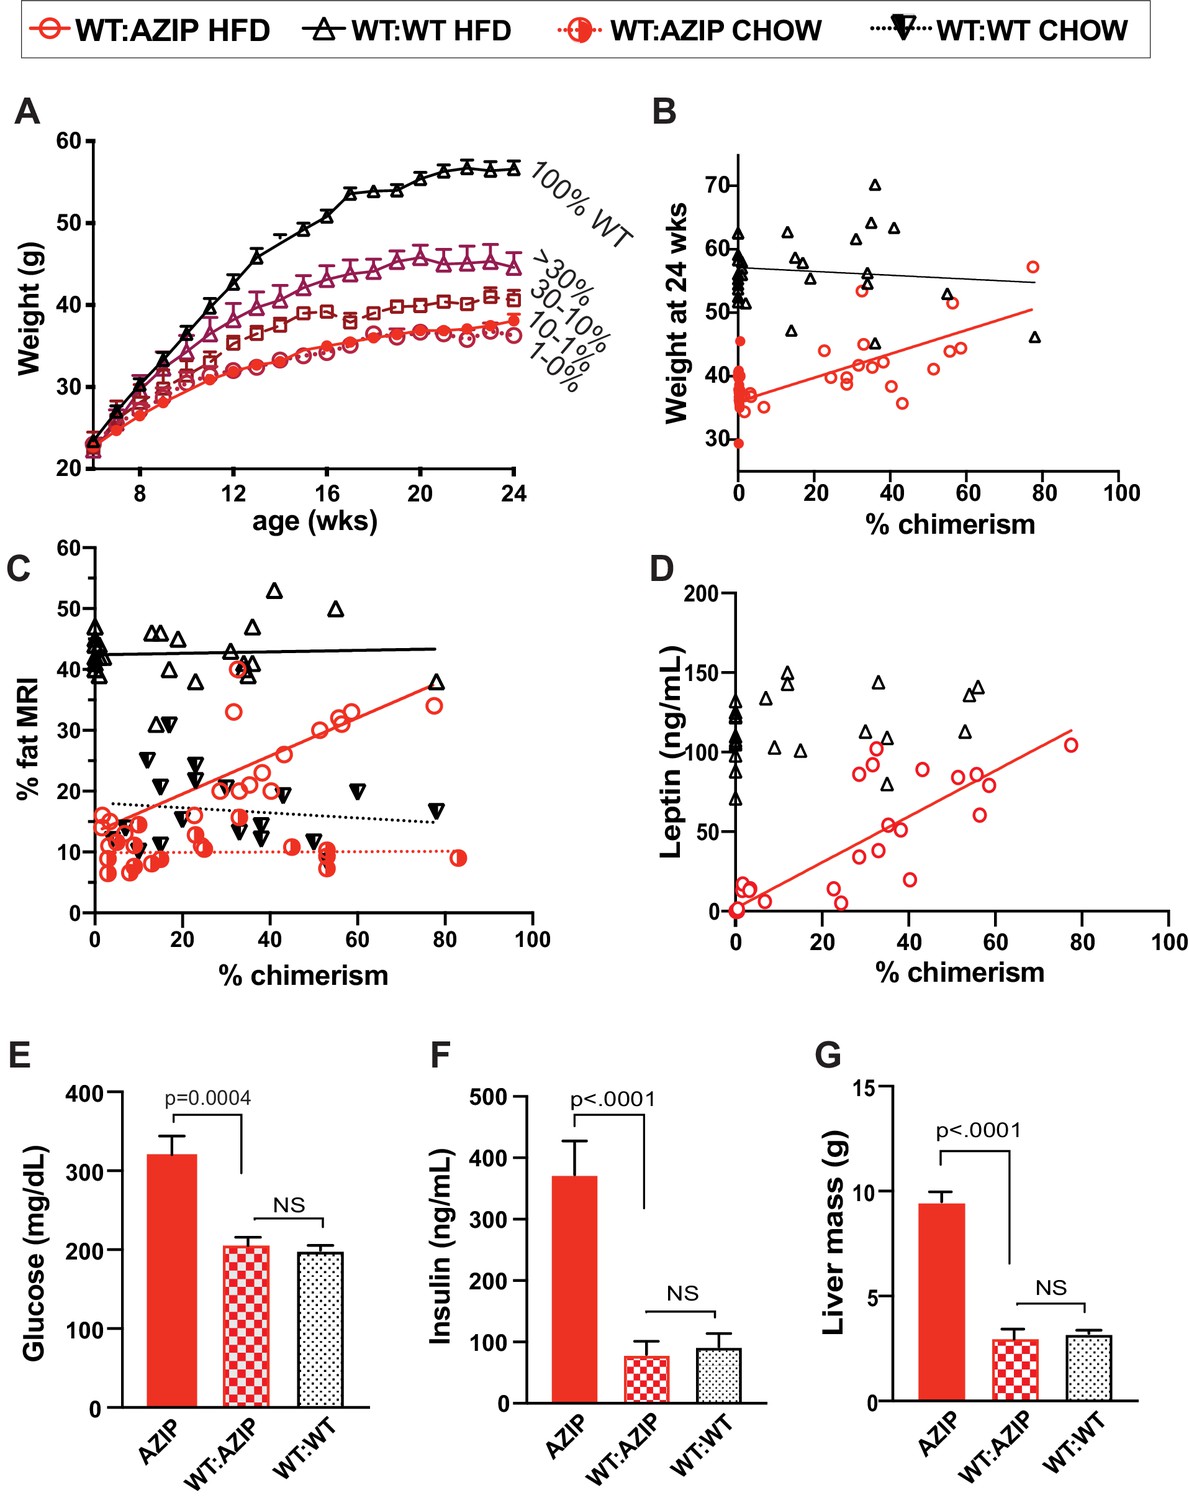
In high-fat-diet animals, adiposity and leptin are only partially complemented by chimerism while several metabolic indicators show complete rescue of the AZIP phenotype.
(A) Body weight of five groups of chimeric animals on high fat-diet between 6 and 24 weeks of age. Final average weights are AZIPs (0–1% chimerism) 38.1 ± 0.8 g (closed red dot, n = 23), 1–10% WT:AZIP at 36.3 ± 0.6 g (open red circle. n = 5), 10–30% WT:AZIP 40.6 ± 1.2 g (open red square, n = 4),>30% WT:AZIP 44.6 ± 1.8 g (open red triangle, n = 12) and WT:WT with 56.6 ± 1.0 g (black triangle, n = 30). (B) Weight at 24 weeks (after 18 weeks of HFD) vs. chimerism. Linear regression of the WT:AZIP (red circle) weights is Y = 0.1876*X+36.00, R^2 = 0.4721 and that of WT:WT (black triangle) is Y = −0.04248*X+57.26, R^2 = 0.028). (C) Percent body fat measured with MRI versus percent chimerism. The linear regression of WT:AZIP chimeras on chow (red half-closed circle; from B) and HFD (red open circle) are Y = 0.003060*X+9.885, R^2 = 0.0008 and Y = 0.3128*X+13.28, R^2 = 0.56, respectively. WT:WT chimeras on chow (black inverted triangle, from C) and HFD (open black triangle) are Y = −0.04184*X+18.12, R^2 = 0.01981 and Y = 0.01217*X+42.40, R^2 = 0.003468, respectively. (D) Leptin levels vs. chimerism. Consistent with increasing fat, leptin increases with increasing % chimerism in WT:AZIP animals (Y = 1.443*X+1.758; R^2 = 0.78), but not in WT:WT chimeras (Y = 0.2372*X+112.7, R^2 = 0.05). (E) Ad libitum glucose levels at 24 weeks in three groups of animals. Blood glucose is corrected by complementation (WT:WT 200 ± 6.4 mg/dl, WT:AZIPs 207 ± 14, AZIP 320 ± 24 mg/dl). (F) Insulin at 24 weeks in three groups of animals. Insulin level is normalized by wild-type complementation in AZIP animals (AZIPs 373 ± 55 ng/mL, WT:AZIPs 79 ± 22 ng/mL, WT:WT 92 ± 21 ng/mL). (G) Liver mass at 24 weeks in three groups of animals on HFD. Liver size of AZIPs (9.5 ± 0.4 grams) is normalized in all chimeric WT:AZIP animals (3.1 ± 0.2 grams) to WT:WT size (3.2 ± 0.2 grams). In (A) to (C) and (E) to (G), AZIPs n = 24, WT:AZIPs n = 21, and WT:WT n = 30. In (D), AZIPs n = 24, WT:AZIPs n = 21, and WT:WT n = 29. All readings done at 24 weeks after 18 weeks of HFD.
Figure 3—figure supplement 1
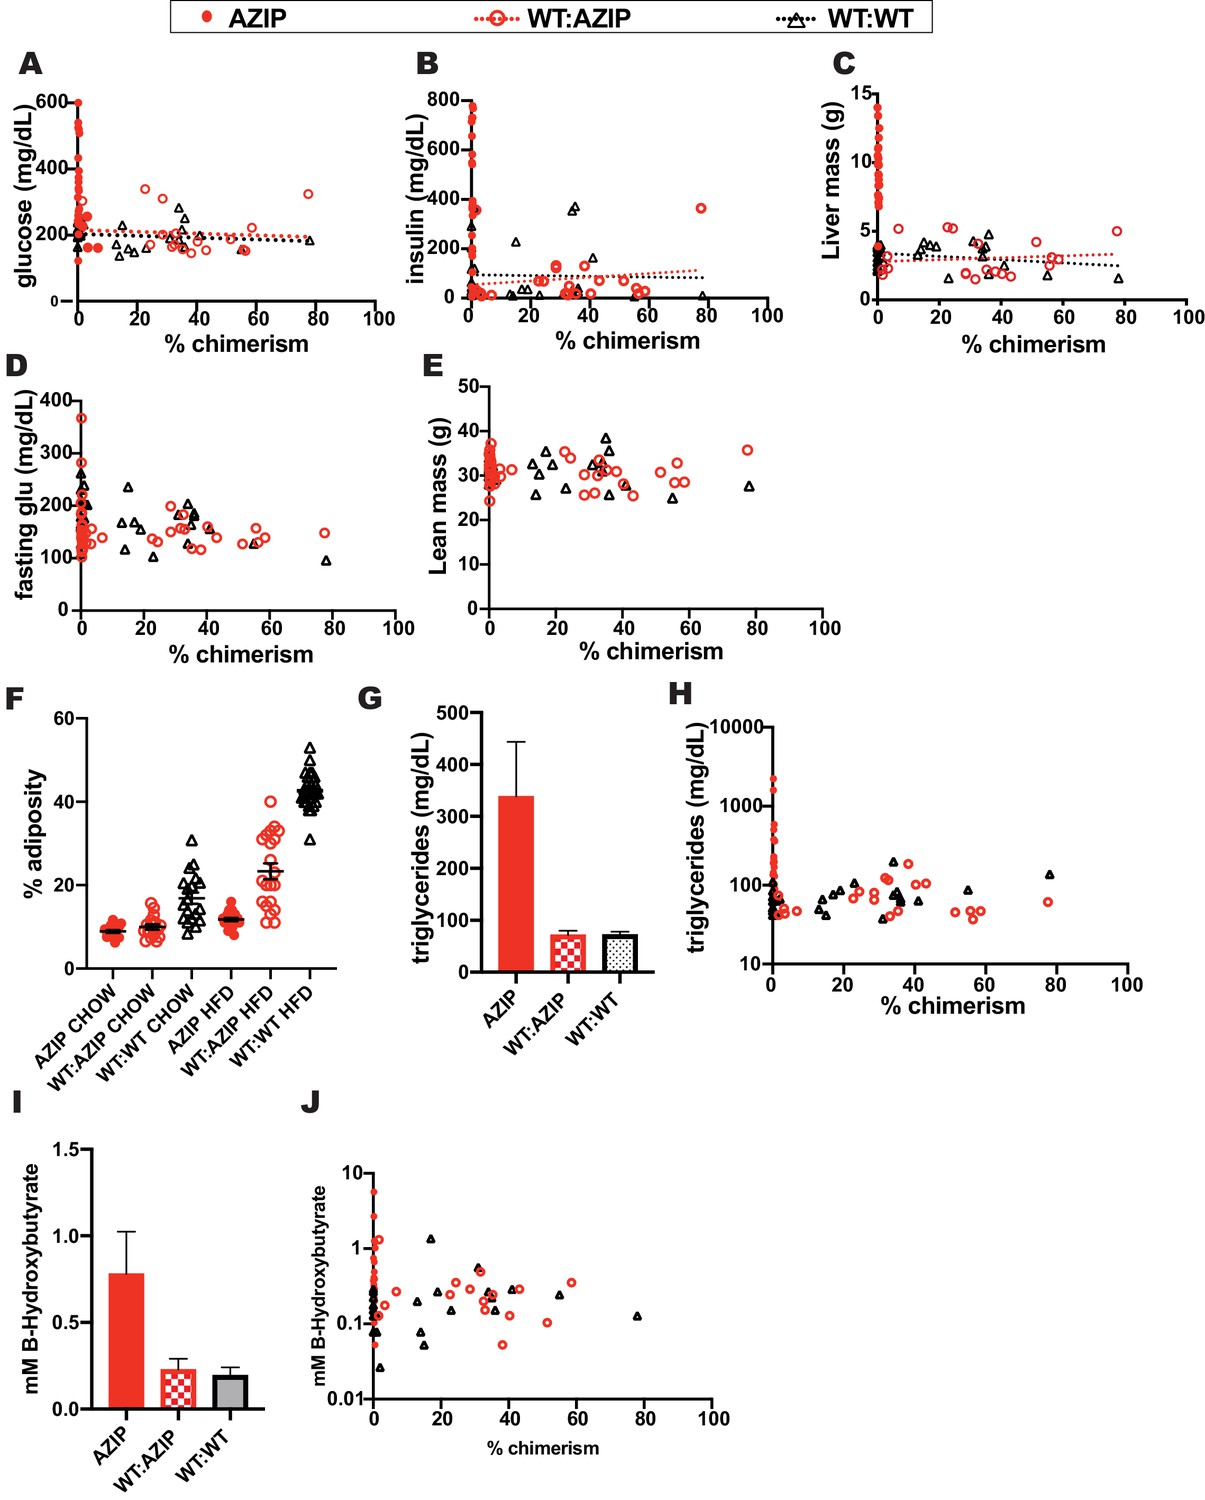
B6 Chimeras on High Fat Diet.
(A) At libitum glucose levels at 24 weeks vs. chimerism. Blood glucose is corrected by complementation and independent of chimerism. (B) Insulin at 24 weeks vs. chimerism. Insulin level is normalized by complementation and independent of chimerism. (C) Liver size vs. chimerism at 24 weeks. Liver size is normalized by complementation and independent of chimerism in WT:AZIP animals and in WT:WT chimeras. (D) Overnight fasting glucose levels at 24 weeks vs. chimerism. Blood glucose is corrected by complementation and independent of chimerism. (E) Lean body mass in 24 week high-fat-diet animals. (F) Comparison percent adiposity in non-chimeric AZIP animals, WT:AZIP and WT:WT chimeric animals on regular chow and high fat diet at 24 weeks. (G) Blood triglycerides in AZIP, WT:AZIPs and WT:WTs and versus chimerism (H). (I) and (J) mM B-Hydroxybutyrate in AZIPs, WT:AZIP and WT:WT chimeras. In (A) to (I), AZIPs n = 24, WT:AZIPs n = 21, and WT:WT n = 30. In (J), AZIPs n = 24, WT:AZIPs n = 20, and WT:WT n = 30. All readings done at 24 weeks after 18 weeks of HFD.
Figure 4
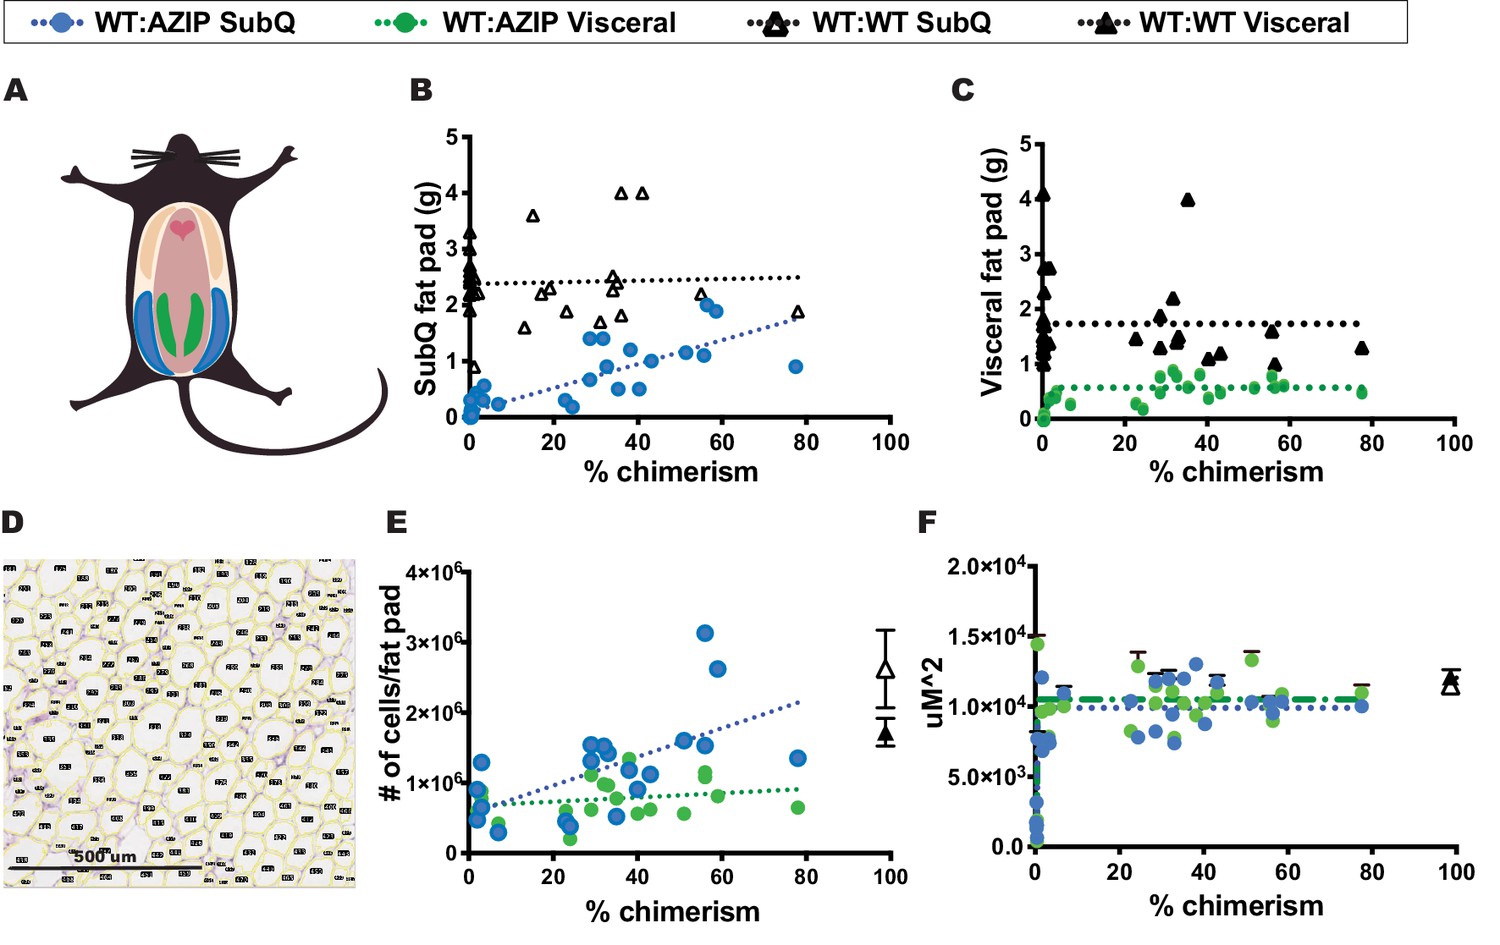
In high-fat-diet animals, the size of subcutaneous and visceral fats stores are differentially controlled.
(A) Schematic representation of subcutaneous and visceral fat pads. Subcutaneous fat pads, shown in blue, and visceral fat pads, shown in green. (B) Subcutaneous fat pad mass vs. chimerism. Subcutaneous fat mass increases with increasing chimerism in WT:AZIP-chimeras (blue circles; linear regression Y = 0.02134*X+0.09579, R^2 = 0.7147) but not in WT:WT-chimeras (black triangles; linear regression Y = 0.001482*X+2.377, R^2 = 0.002). (C) Visceral fat pad mass vs. chimerism. Visceral fat pad mass is independent of chimerism in both WT:AZIP-chimeras (green circles) and in WT:WT-chimeras (black triangles). (D) Images of 5 uM fixed H and E stained adipocytes run through Fiji Adiposoft for individual size determination of adipocytes. Scale shown. (E) Number of cells per fat pad vs. chimerism. Number of subcutaneous adipocytes per fat pad increased with increasing chimerism (blue circles; 1/slope of the linear regression is 4.900e-005 with an R^2 = 0.3737; Y = 20361*X+555585) whereas visceral adipocytes do not (green circles; 1/slope of the linear regression is 3.2e-4, R^2 = 0.05135; Y = 3043*X+671862). WT:WT subcutaneous shown as open black triangle and WT:WT visceral adipocytes as solid black triangle. (F) Average area of top 20 adipocytes per 1,875,000 uM^2 (1500 uM x 1250 uM) image. The size of WT:AZIP adipocytes, both subcutaneous (blue circles) and visceral (green circles) is independent of chimerism. Same results were found for WT:WT chimera adipocytes (black open triangle for subcutaneous adipocytes, black solid triangle for visceral adipocytes). In (A) to (F), AZIPs n = 24, WT:AZIPs n = 21, and WT:WT n = 30. Data collected at 24 weeks after 18 weeks of HFD.
Additional files
Download links
A two-part list of links to download the article, or parts of the article, in various formats.
Downloads (link to download the article as PDF)
Open citations (links to open the citations from this article in various online reference manager services)
Cite this article (links to download the citations from this article in formats compatible with various reference manager tools)
Limitation of adipose tissue by the number of embryonic progenitor cells
eLife 9:e53074.
https://doi.org/10.7554/eLife.53074


