Co-evolution within structured bacterial communities results in multiple expansion of CRISPR loci and enhanced immunity
- Laboratory of Bacteriology, The Rockefeller University, United States
- Howard Hughes Medical Institute, The Rockefeller University, United States
Figures
Figure 1 with 1 supplement
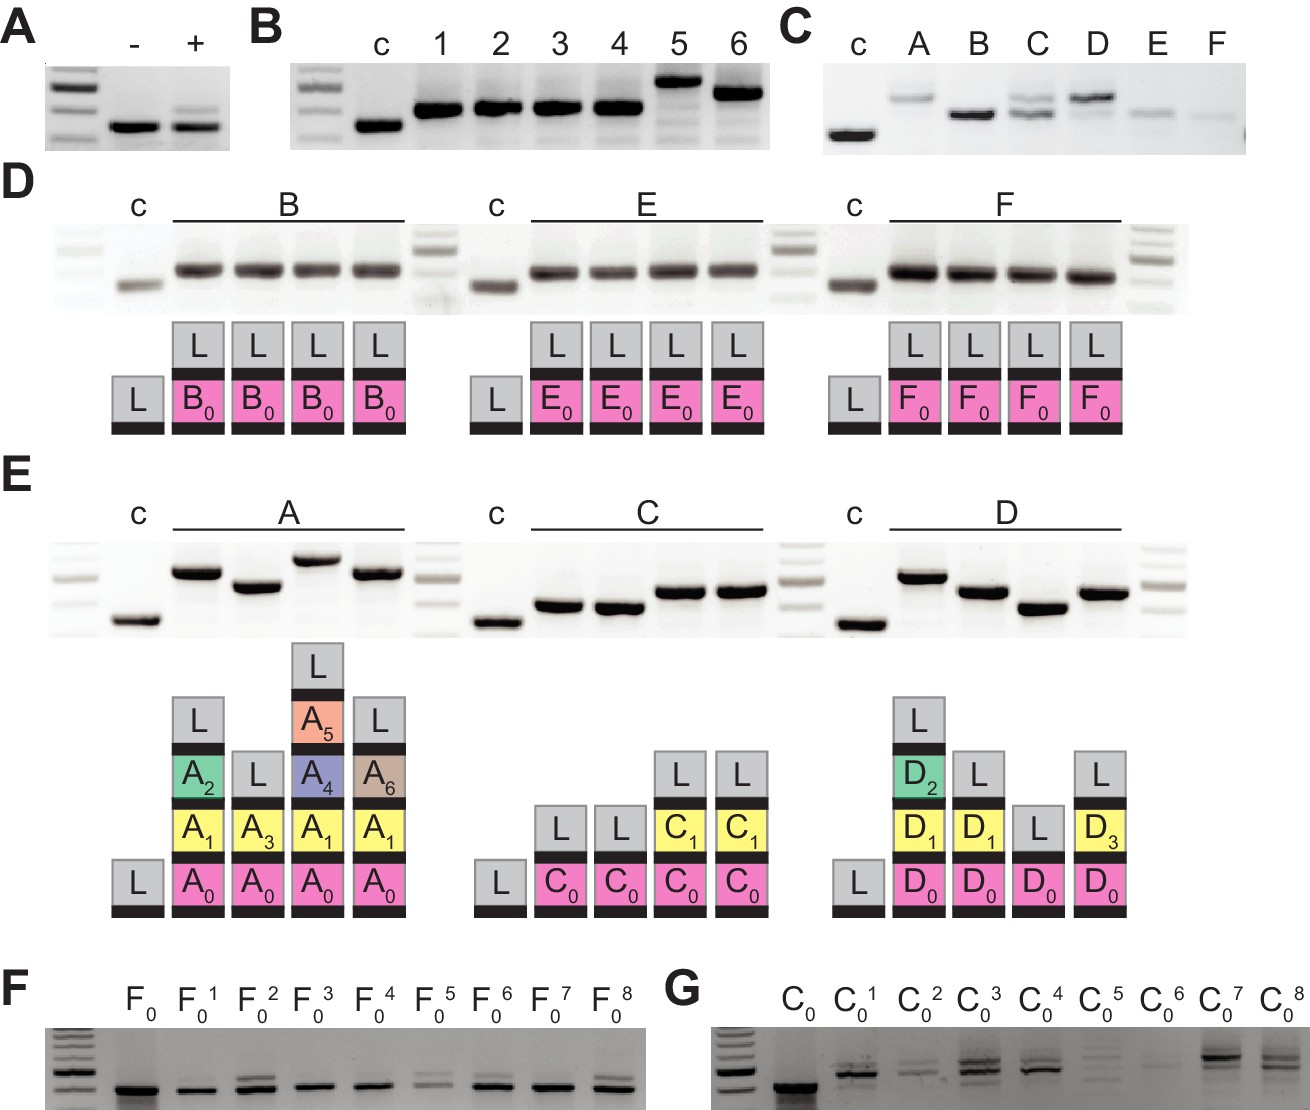
Bacteriophage-resistant colonies display two modes of spacer acquisition, determined by the sequence of the founder spacer.
Agarose gel electrophoresis of the products of the amplification of the pCRISPR array present in staphylococci infected with ϕNM4γ4, using plasmid DNA templates extracted from: (A) liquid cultures with (+) or without (-) addition of phage; (B) six colonies formed after plating the infected liquid cultures, ‘c’ indicates a no-spacer control sample; (C) bacteriophage-resistant colonies (labeled with different upper case letters) after infection in semi-solid (top agar) media, ‘c’ indicates a no-spacer control sample; (D) colonies resulting from the re-streak of mono-spacer colonies shown in (C), with a schematic of the pCRISPR array determined after sequencing of the PCR product (L, leader; black rectangle, repeat; colored boxes, acquired spacers with different colors indicating different spacer sequences within a colony); (E) same as (D) but after re-streak of multi-spacer colonies; (F) eight colonies resulting from infection in semi-solid media of cells containing pCRISPR with the founder spacer F (F0, pre-infection control); (G) same as (F) but for founder spacer C.
-
Figure 1—source data 1
Spacer sequences from the PCR products shown in Figure 1, Figure 1—figure supplement 1BC, Figure 2B, Figure 3B, Figure 4B–C, Figure 5A–B, Figure 5—figure supplement 1D–G, Figure 7A and Figure 7CD.
- https://cdn.elifesciences.org/articles/53078/elife-53078-fig1-data1-v1.xlsx
Figure 1—figure supplement 1
PCR analysis of the CRISPR array of re-streaked cells.
(A) New spacers integrate into the CRISPR array in a polarized manner, between the leader sequence (gray box, L), an AT-rich sequence that specifies the site of integration, and the first repeat (black rectangle) of the CRISPR array. Colored boxes represent different spacer sequences. (B) Agarose gel electrophoresis of the products of the amplification of the barcoded pCRISPR array present in staphylococci infected with ϕNM4γ4, using plasmid DNA templates extracted from bacteriophage-resistant colonies (labeled with different upper case letters) after infection in semi-solid (top agar) media, ‘c’ indicates a no-spacer control sample. (C) Same as (B) but using template DNA extracted from colonies resulting from the re-streak of colonies shown in (B), with a schematic of the pCRISPR array determined after sequencing of the PCR product (L, leader; black rectangle, repeat; colored boxes, acquired spacers with different colors indicating different spacer sequences within a colony).
Figure 2
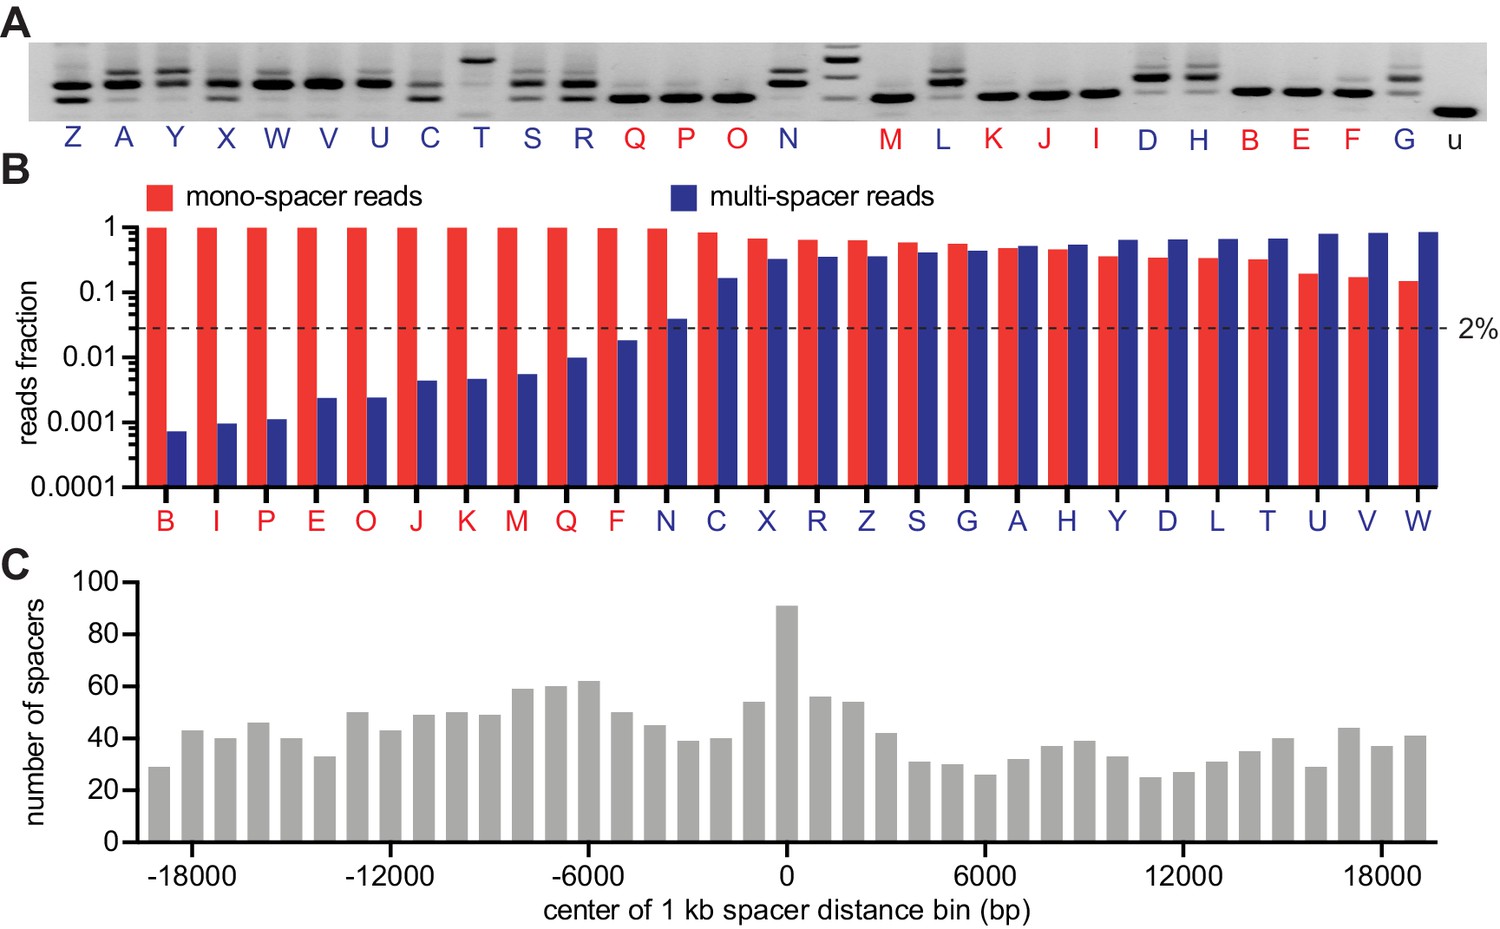
CRISPR expansion likely involves priming by the first acquired spacer.
(A) Agarose gel electrophoresis of the products of the amplification of the pCRISPR array present in staphylococci infected in semi-solid media with ϕNM4γ4, using plasmid DNA templates extracted from 26 different surviving colonies and the unexpanded array (u); red and blue letters: mono- and multi-spacer colony names. (B) Fraction of the reads obtained after NGS of the PCR products shown in (A) containing either a single or multiple spacers (red and blue bars, respectively). Dashed line indicates the 2% value, the minimal fraction of multi-spacer reads that leads to multiple PCR products after amplification of the pCRISPR array. (C) Distance between the targets in the ϕNM4γ4 genome specified by the first and second spacers acquired after infection of staphylococci carrying pCRISPR; obtained from analysis of NGS data. The number of different second spacers within 1 kb bins of the ϕNM4γ4 genome are shown; the position of first spacer acquired in each array is set as 0 kb.
-
Figure 2—source data 1
Spacer sequences, their number of reads and their position in the phage genome; obtained from next-generation sequencing of the 26 colonies reported in Figure 2B.
- https://cdn.elifesciences.org/articles/53078/elife-53078-fig2-data1-v1.xlsx
Figure 3 with 2 supplements
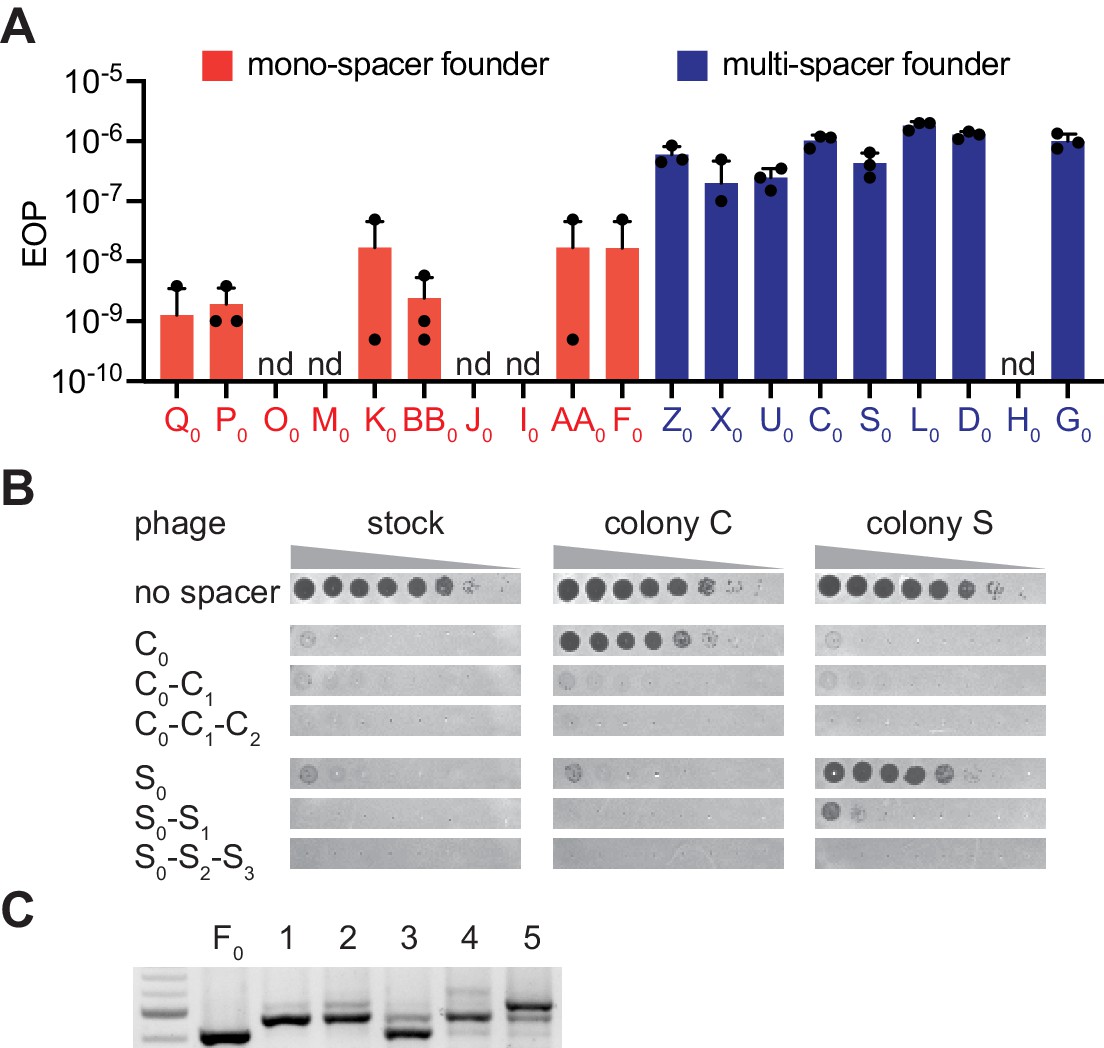
The ability of phage to escape targeting by the founding spacer determines colony heterogeneity.
(A) Efficiency of plaquing (EOP), calculated as the number of ϕNM4γ4 plaques on the test strain relative to the total number of phage particles in the stock. Different mono-spacer (red) and multi-spacer (blue, carrying only the founder spacer without additional ones) strains were tested. Mean ±STD of thee biological replicates (black dots) are reported. (B) Detection of plaques present in 10-fold serial dilutions of either ϕNM4γ4 phage stock or phage isolated from multi-spacer colonies founded by spacers C or S, spotted on lawns of non-CRISPR staphylococci (‘no spacer’) or carrying pCRISPR plasmids with an increasing spacer content. Mean ± StDev values of three independent experiments (black dots) are shown; n.d., not detected. (C) Agarose gel electrophoresis of the products of the amplification of the pCRISPR(spacer F) array present in five colonies that survived infection in semi-solid media with ϕNM4γ4 and spacer F escaper phage.
Figure 3—figure supplement 1
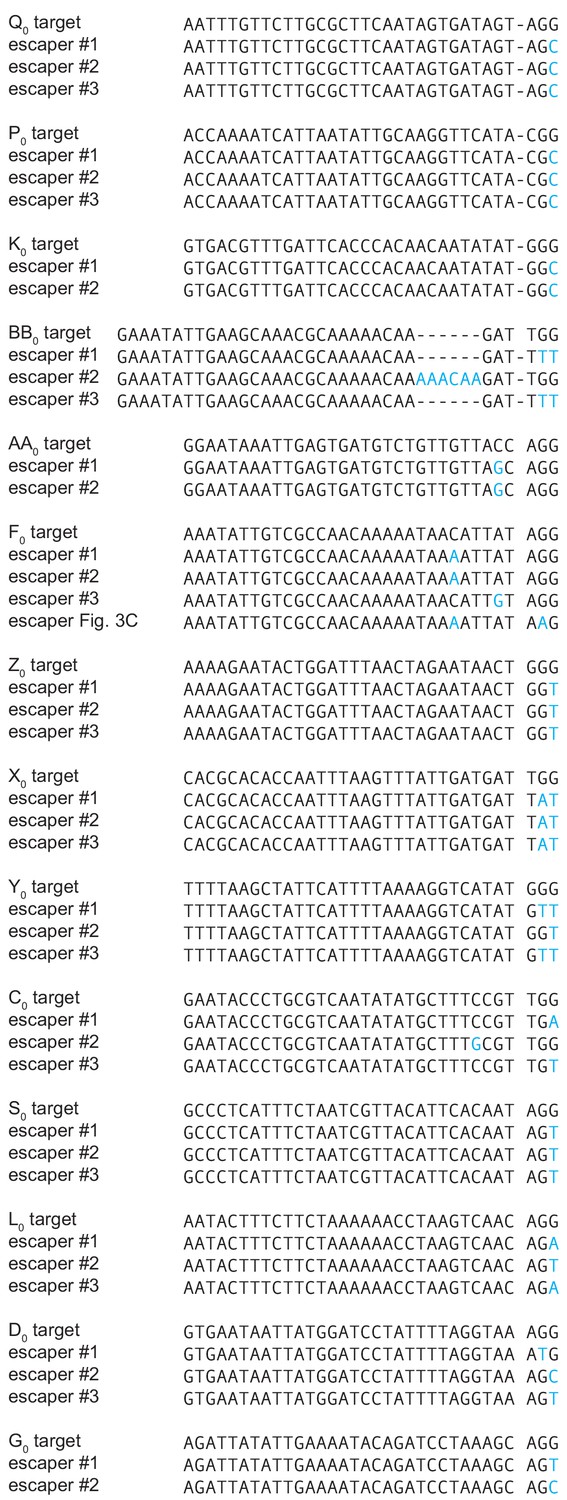
Target sequences of different escaper phages.
DNA from 2 to 4 escaper plaques obtained in the experiment described in Figure 3A was isolated and the corresponding target region was amplified with target-specific primers and sequenced as described in Materials and methods. Mutant sequences are aligned to the wild-type target (protospacer-PAM); mutations indicated in blue letters.
Figure 3—figure supplement 2
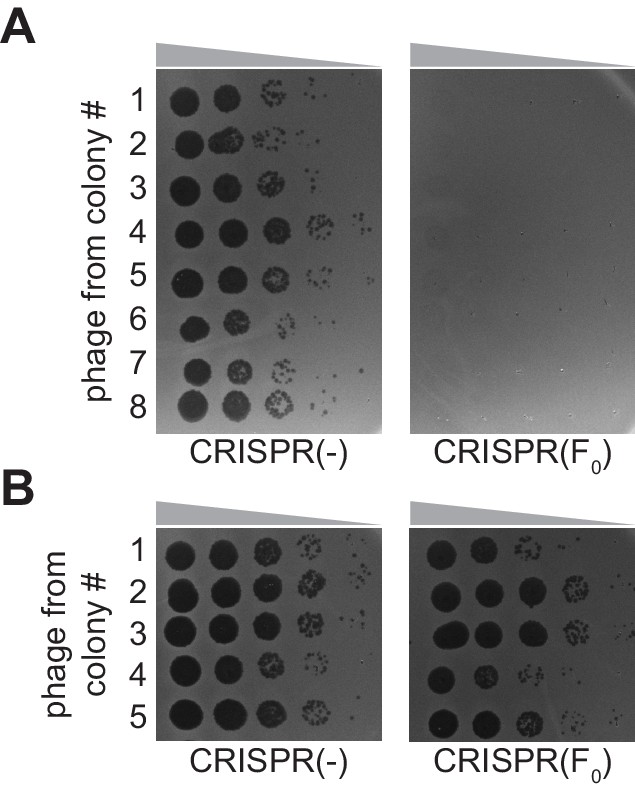
Quantification of escaper phage within spacer F founder colonies.
(A) Phage was isolates from surviving colonies obtained in the experiment described by Figure 1F and 0-fold serial dilutions were spotted on lawns of sensitive staphylococci [CRISPR(-)], or staphylococci harboring the pCRISPR plasmid programmed with the founder spacer F [CRISPR(F0)]. (B) Same as (A) but using phage extracted from surviving colonies obtained in the experiment described by Figure 3C.
Figure 4

Multi-spacer colonies have impaired growth.
(A) Enumeration of colony forming units (CFU) obtained after infection of staphylococci carrying pCRISPR or pCRISPR(Δcas2) plasmids (clear or dashed pattern bars), containing spacer C or F (red or blue bars, respectively), with ϕNM4γ4 or ϕNM4γ4 also containing spacer F escaper phage. Mean ± StDev values of three independent experiments (black dots) are shown. (B) Images of bacteriophage-resistant colonies 1 or 2 days after infection with ϕNM4γ4 phage, and PCR analysis of the spacer content in their pCRISPR plasmid. (Barrangou et al., 2007), one spacer control. (C) Same as (B) but with colonies that experienced growth over time; their letter name colored according to the spacer content: red, mono-spacer; blue, multi-spacer.
Figure 5 with 2 supplements
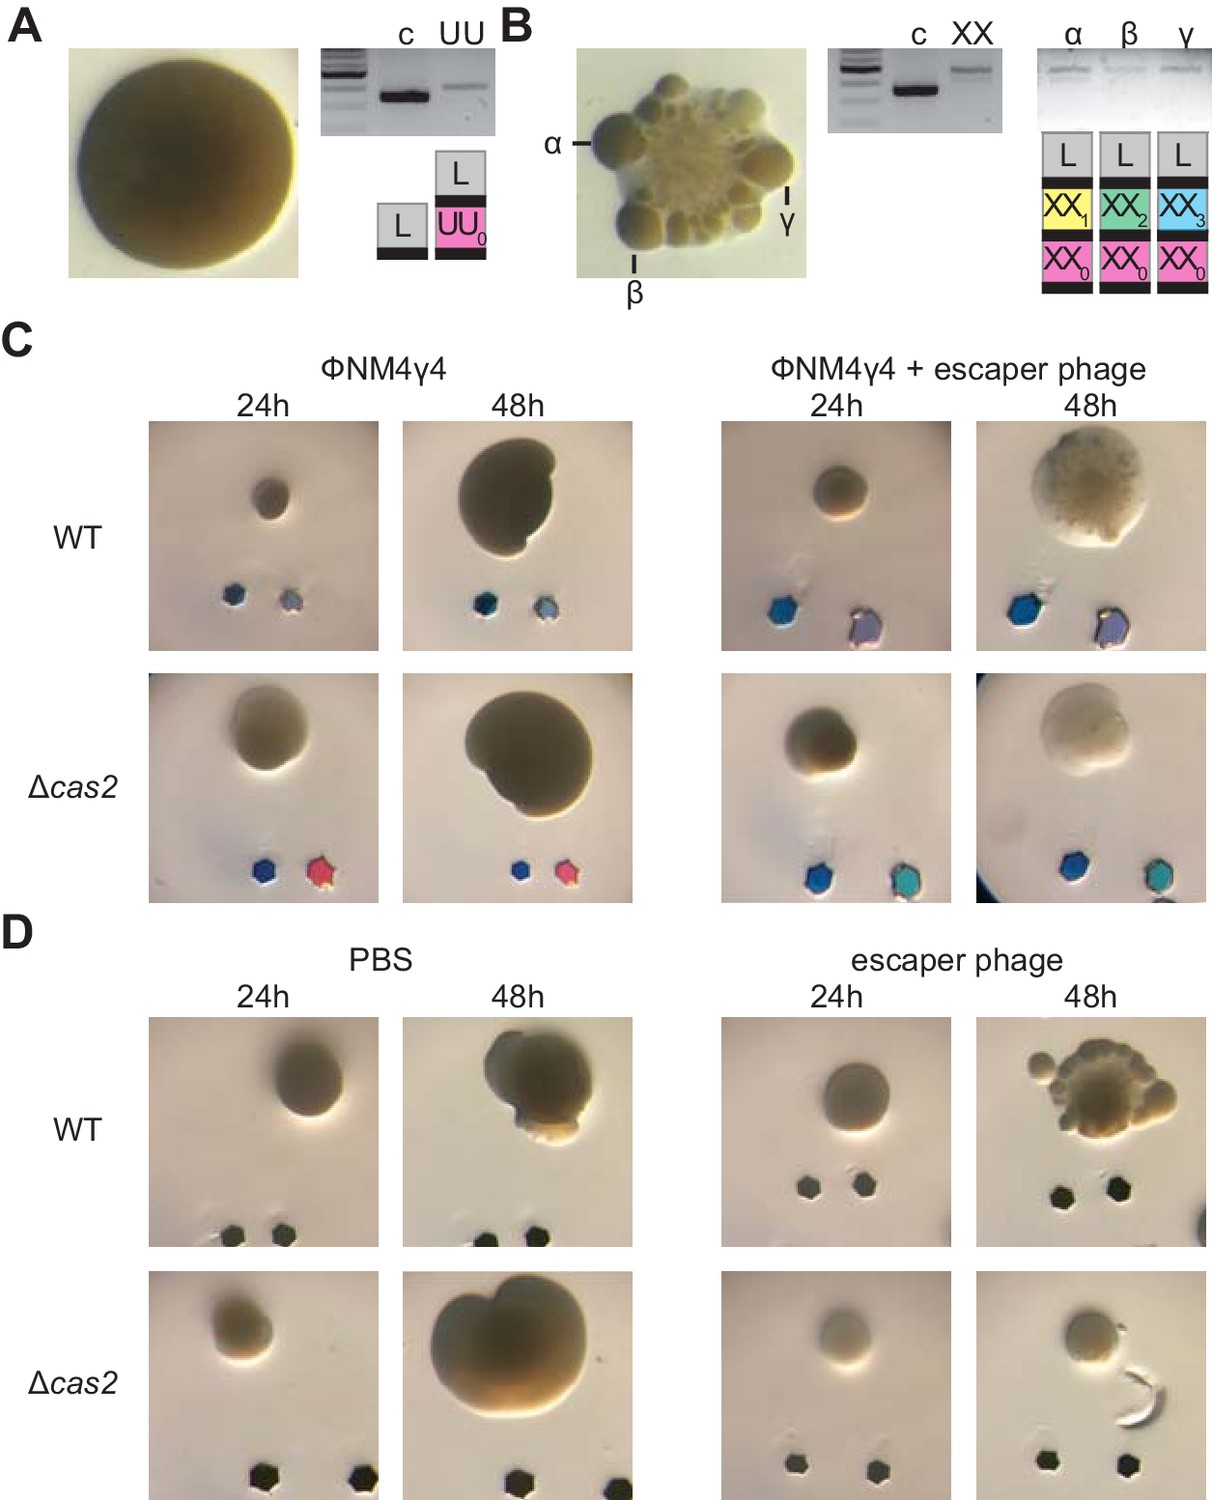
Multi-spacer colonies display sectored morphologies.
(A) Image of a smooth colony (containing the founder spacer UU) as well as the gel agarose analysis of PCR products obtained after amplification of its pCRISPR array; ‘c’ shows amplification of pCRISPR, a no-spacer control. (B) Same as (A) but for the sectored colony founded by spacer XX. Also showing the gel agarose analysis of PCR products obtained after amplification of its pCRISPR array present in three different sectors (α,β,γ) with a schematic of the pCRISPR array determined after sequencing of the PCR product (L, leader; black rectangle, repeat; colored boxes, acquired spacers with different colors indicating different spacer sequences within a colony). (C) Images of representative colonies grown 24 or 48 hr after top agar infection of wild-type or Δcas2 mono-spacer founder F cells, with ϕNM4γ4 containing or not additional spacer F escaper phage. Glitter markers are shown to normalize both the position as well as the size of the image at different times. (D) Images of representative colonies of wild-type or Δcas2 mono-spacer founder F cells grown for 24 hr in the absence of phage, when a drop of either PBS or spacer F escaper phage was added on top and a second image was obtained 24 hr after. Glitter markers are shown to normalize both the position as well as the size of the image at different times.
Figure 5—figure supplement 1
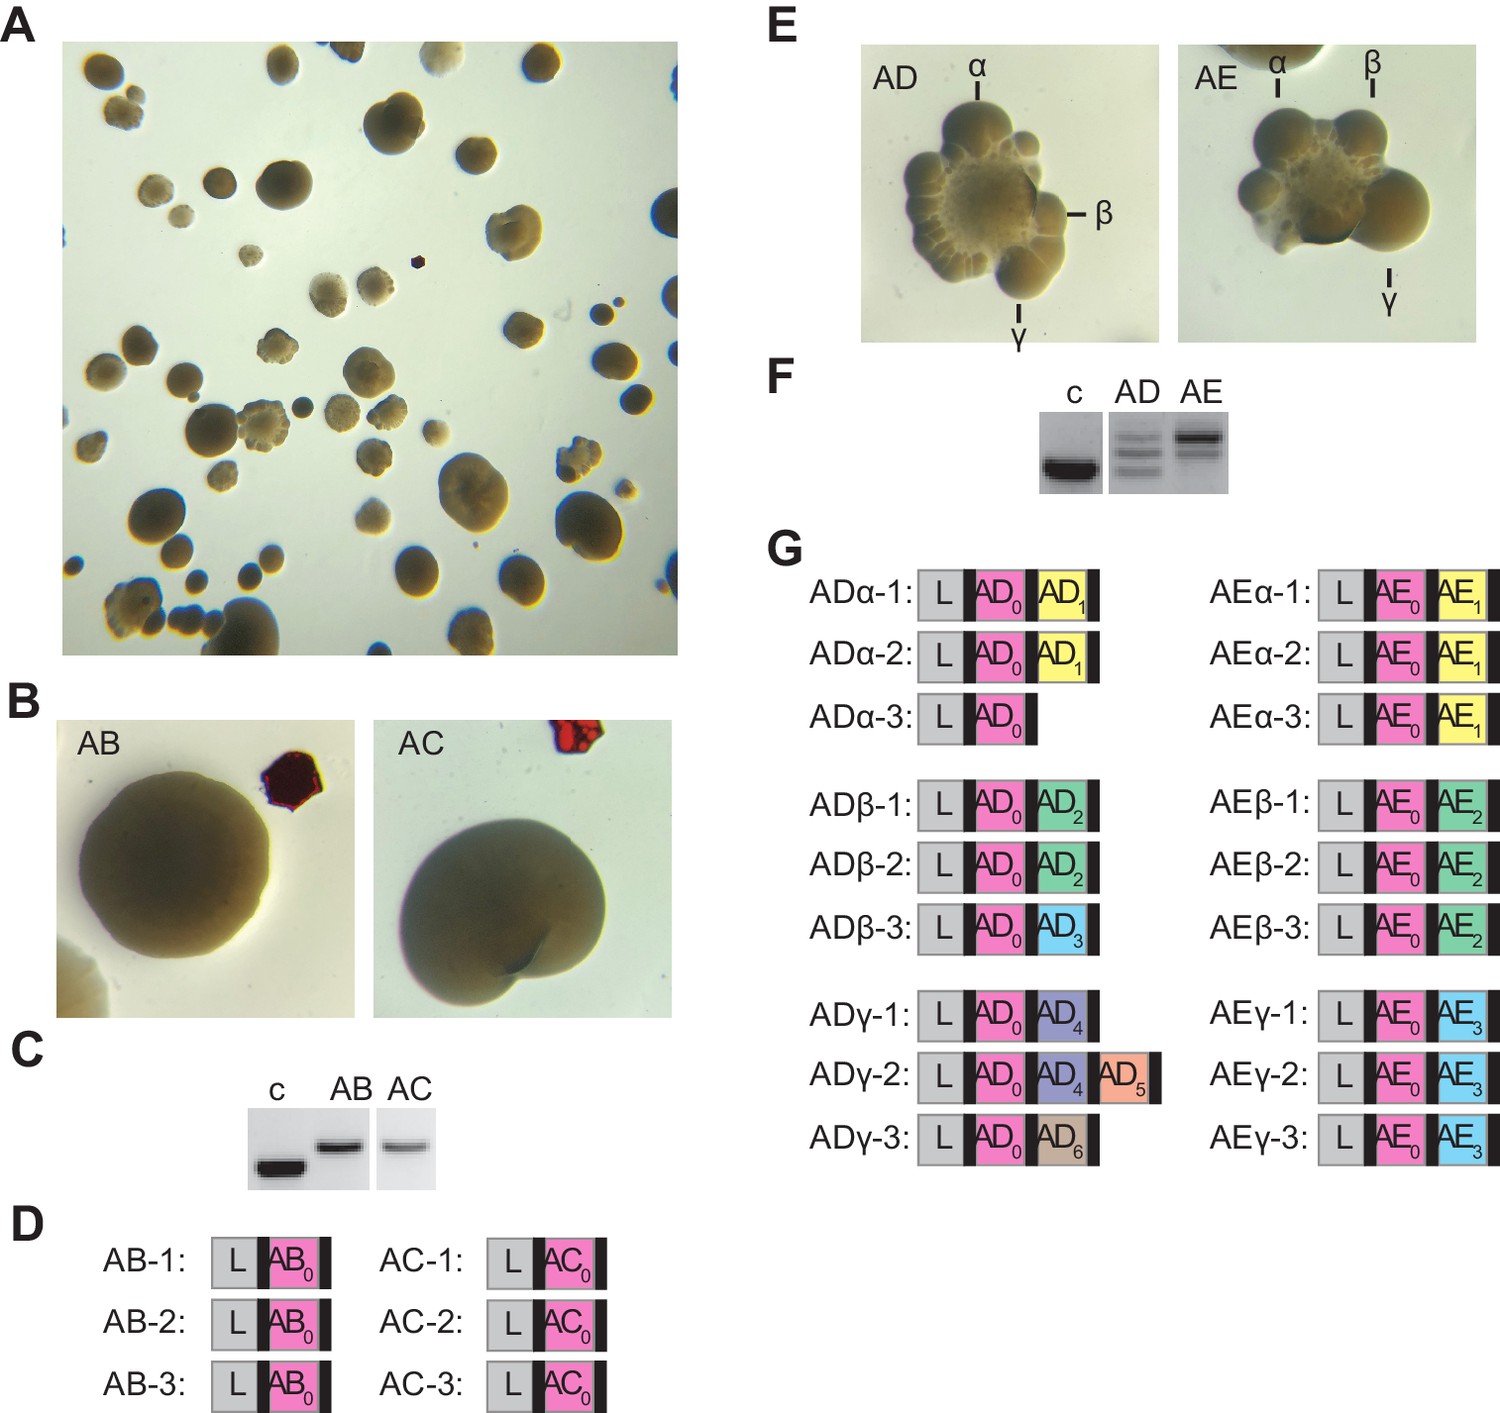
Analysis of additional smooth and sectored colonies.
(A) Image of a plate containing staphylococci carrying pCRISPR that survive ϕNM4γ4 infection in solid media. (B) Image of two smooth colonies (containing the founder spacers AB and AC) from the plate shown in (A). (C) Gel agarose analysis of PCR products obtained after amplification of the pCRISPR array of the smooth colonies shown in (B); ‘c’ shows amplification of pCRISPR, a no-spacer control. (D) Sequencing results of the PCR products shown in (C), shown as a schematic of the pCRISPR array (L, leader; black rectangle, repeat; colored boxes, acquired spacers with different colors indicating different spacer sequences within a colony). (E–G) Same as (B–D) but showing the analysis of two sectored colonies founded by spacers AD and AE; and also showing the sequencing of the pCRISPR array present in three different re-streaked sectors (α,β,γ).
Figure 5—figure supplement 2
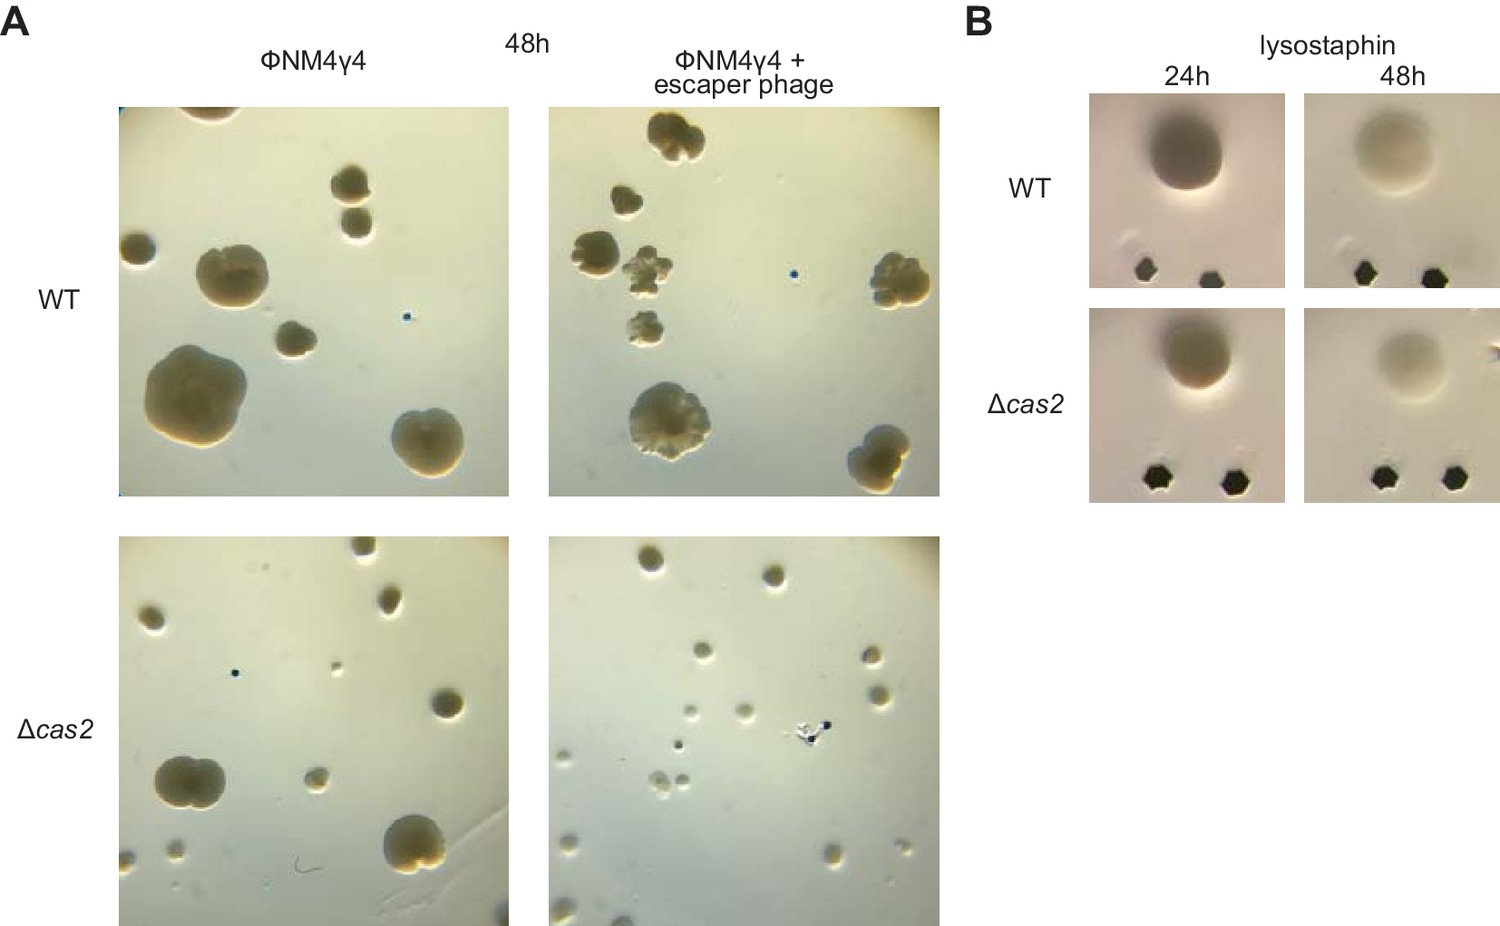
Requirement of spacer acquisition for the formation of sectored colonies.
(A) Images of a plate grown for 48 hr after top agar infection of wild-type or Δcas2 mono-spacer founder F cells, with ϕNM4γ4 containing or not additional spacer F escaper phage. (B) Images of representative colonies of wild-type or Δcas2 mono-spacer founder F cells grown for 24 hr in the absence of phage, when a drop of the cell wall degrading enzyme lysostaphin was added on top and a second image was obtained 24 hr after. Glitter markers are shown to normalize both the position as well as the size of the image at different times.
Figure 6
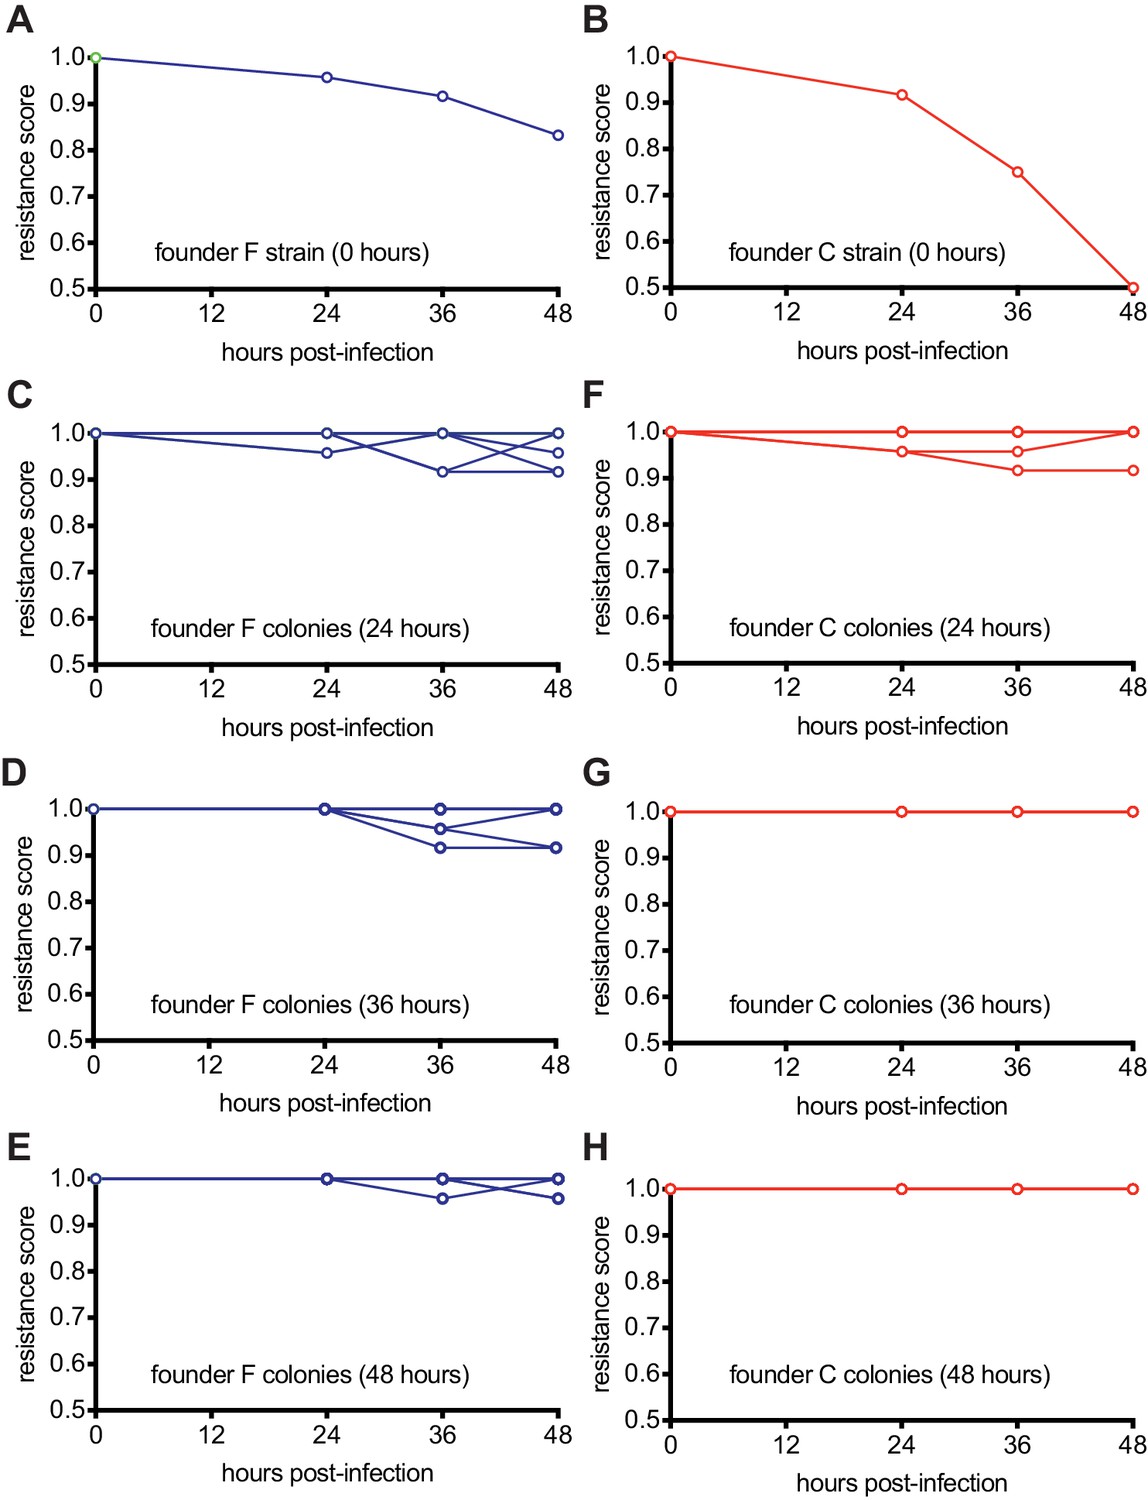
Host-phage co-evolution within multi-spacer colonies leads to increased resistance.
(A) Resistance score of staphylococci carrying the pCRISPR programmed with founder spacer F to the stock ϕNM4γ4 phage (time 0) or the phages isolated from colonies that survived 24, 36 and 48 hr after infection. (B) Same as (A) but for cells with pCRISPR programmed with founder spacer C. (C–E) Same as (A) but showing the resistance scores for 12 different colonies isolated at 24 (B), 36 (C) and 48 hr (E) after infection. To the stock ϕNM4γ4 phage (time 0) or the phages isolated from colonies that survived 24, 36 and 48 hr after infection. (F–H) Same as (C–E) but for cells with pCRISPR programmed with founder spacer C.
-
Figure 6—source data 1
Raw data used for the plots shown in Figure 6.
- https://cdn.elifesciences.org/articles/53078/elife-53078-fig6-data1-v1.xlsx
Figure 7

Analysis of S. thermophilus phage-resistant colonies.
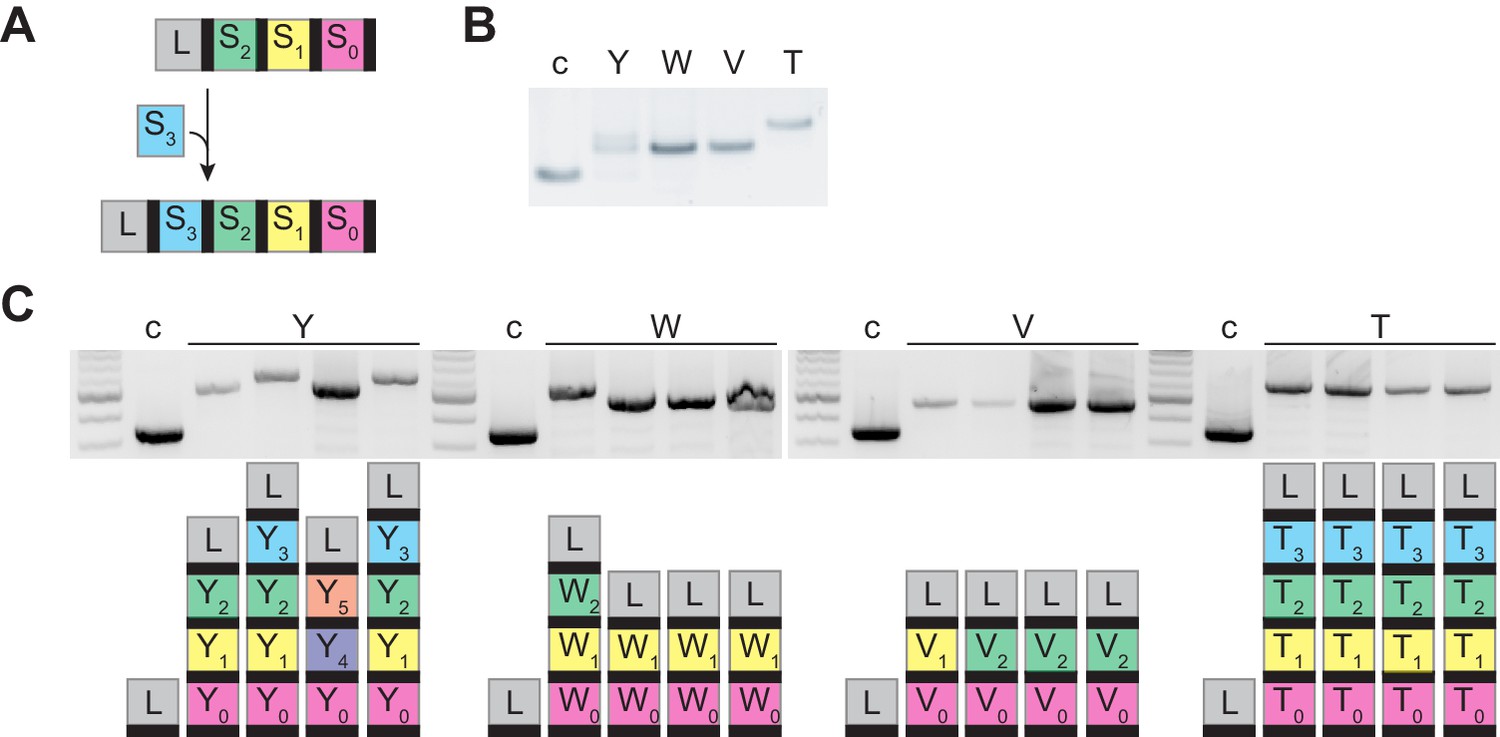
(A) Phage-resistant colonies obtained 24 or 72 hr after infection of S. thermophilus DGCC7710 with ϕ2972. Satellite colonies further analyzed are labeled (α, β and γ). (B) Agarose gel electrophoresis of the products of the amplification of the S. thermophilus CRISPR1 locus, using DNA templates extracted from the center of the colonies shown in (A); ‘c’ shows amplification of pCRISPR, a no-spacer control. (C) Colonies resulting from the re-streak of the colonies shown in (A), with a schematic of the pCRISPR array determined after sequencing of the PCR product (L, leader; black rectangle, repeat; colored boxes, acquired spacers with different colors indicating different spacer sequences within a colony); ‘c’ shows amplification of pCRISPR, a no-spacer control. (D) same as (C) but after re-streak of the satellites from colony B2. (E) Detection of plaques present in 10-fold serial dilutions of ϕ2972 phage isolated from multi-spacer colonies founded by spacers B2 or C2, spotted on lawns of streptococci lacking a targeting spacer (‘no spacer’) or carrying one or two targeting spacers.
Additional files
-
Supplementary file 1
List of oligonucleotide primers used in this study.
- https://cdn.elifesciences.org/articles/53078/elife-53078-supp1-v1.docx
-
Transparent reporting form
- https://cdn.elifesciences.org/articles/53078/elife-53078-transrepform-v1.docx
Download links
A two-part list of links to download the article, or parts of the article, in various formats.
Downloads (link to download the article as PDF)
Open citations (links to open the citations from this article in various online reference manager services)
Cite this article (links to download the citations from this article in formats compatible with various reference manager tools)
Co-evolution within structured bacterial communities results in multiple expansion of CRISPR loci and enhanced immunity
eLife 9:e53078.
https://doi.org/10.7554/eLife.53078


