Proteome-wide analysis of a malaria vaccine study reveals personalized humoral immune profiles in Tanzanian adults
- Swiss Tropical and Public Health Institute, Switzerland
- University of Basel, Switzerland
- Antigen Discovery Inc, United States
- Sanaria, United States
- Ifakara Health Institute, United Republic of Tanzania
Figures
Figure 1
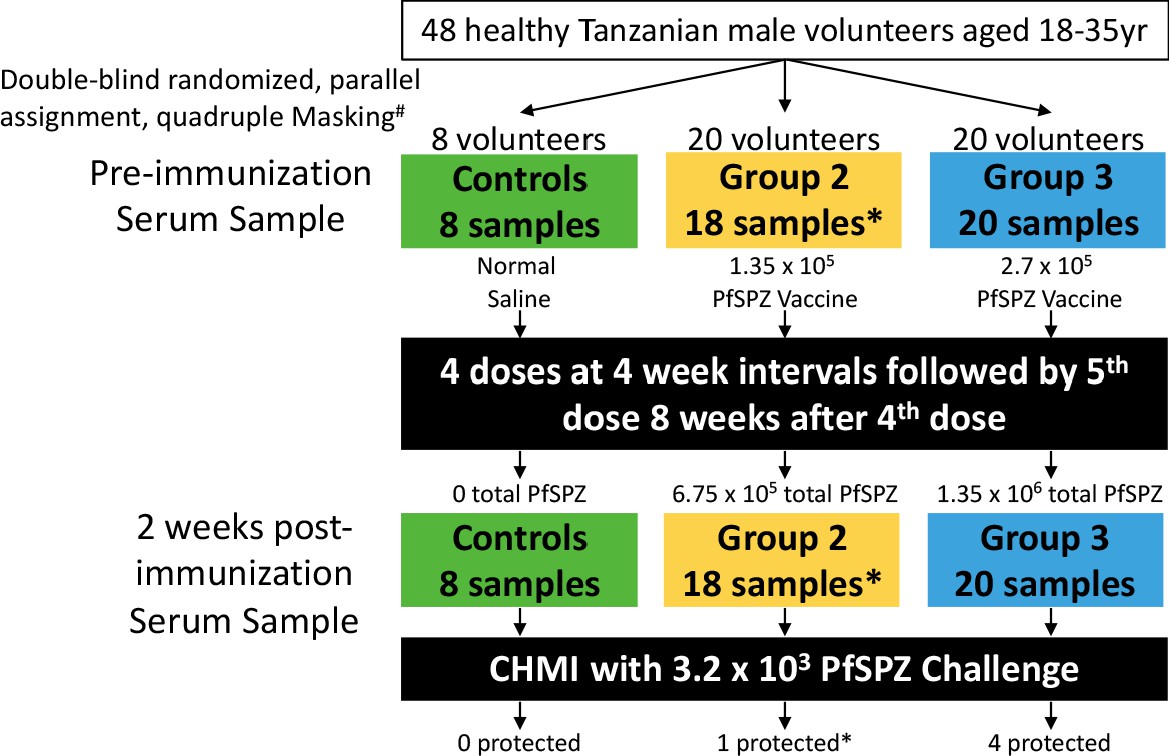
Sampling and volunteer information for proteome microarray studies.
Three arms of a randomized, double-blind Phase 1 trial of PfSPZ Vaccine were selected for antibody profiling on Pf whole proteome microarrays: normal saline controls, a lower dose (group 2, 1.35 × 10⁵ PfSPZ Vaccine/dose) and a higher dose (group 3, 2.7 × 10⁵ PfSPZ Vaccine/dose). Serum samples were collected before immunization and 2 weeks after the final immunization. Information on the protection status of the volunteers after a 3 week post-immunization CHMI is provided. #Masking included participant, care provider, investigator and outcome assessor. *Samples were unavailable for protein array screening from two group 2 volunteers, one did not receive the 5th immunization dose and one left the country before CHMI (Jongo et al., 2019). All volunteers in the clinical trial who received 5 doses of immunization and who underwent CHMI 3 weeks after last immunization dose were included in the current analysis.
Figure 2
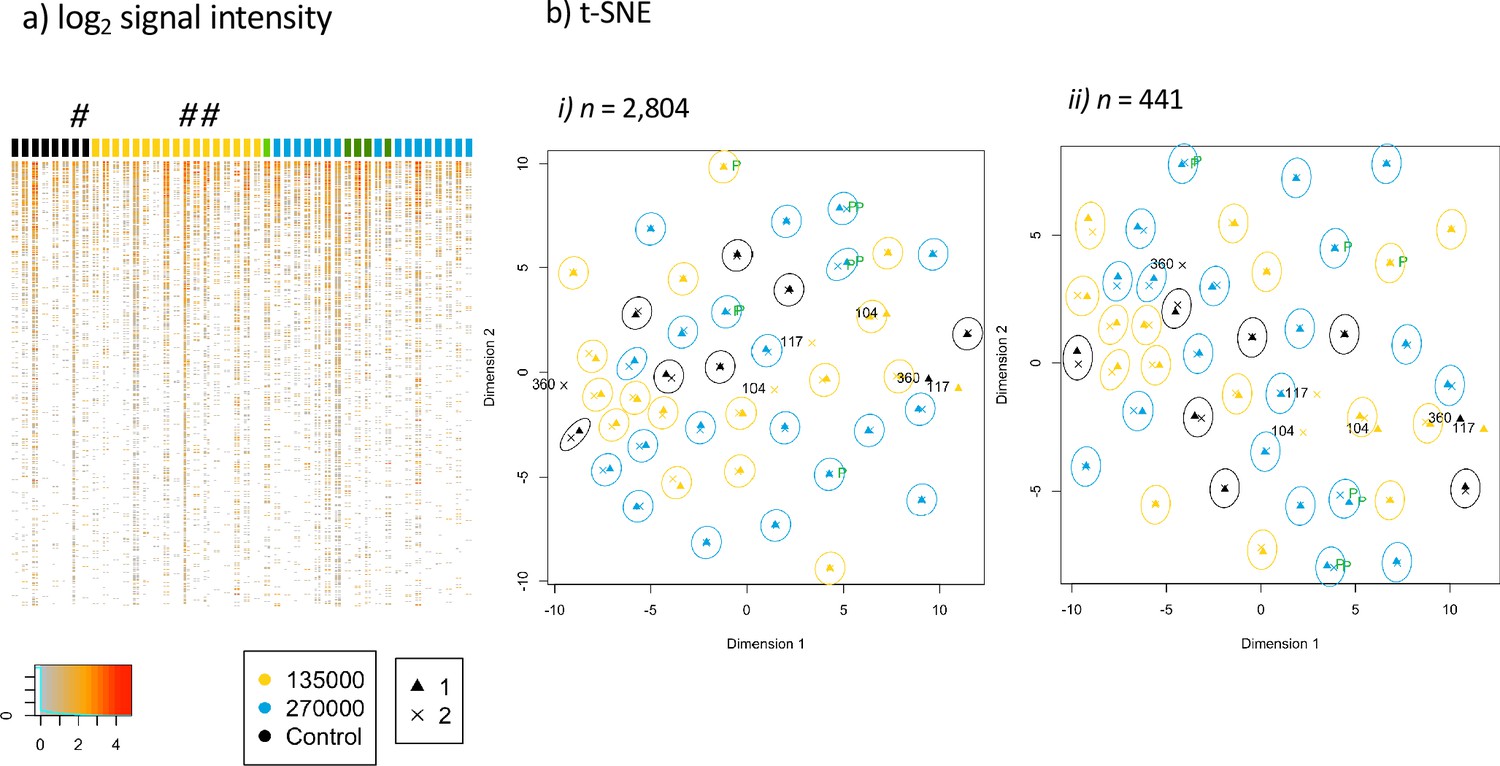
Antibody immune profile of Tanzanian healthy male adult volunteers is personalized.
The heatmap of the normalized signal intensities of each sample per subject is shown in (a), with the signal intensity of each protein or fragment (rows) displayed for the samples before and after immunization of each volunteer (columns). The colored column headers represent volunteers ordered according to treatment allocation. 8 subjects of the control group (black), CHMI unprotected subjects of group 2 (n = 17, yellow), unprotected subjects of group 3 (n = 16, blue), CHMI protected subjects (n = 5, green). The first and second columns for each subject display the results obtained from baseline and after immunization samples, respectively. The # indicates volunteers BSPZV1-360, BSPZV1-104 and BSPZV1-117. (b) A t-SNE projected dimensionality reduction of normalized signal intensities across the microarray spots measured at baseline (triangles) and after PfSPZ vaccination (crosses) is shown. In (b-i) data are shown for the total 2804 reactive spots and in (b-ii) for the subset of 441 reactive proteins fragments predicted to be expressed at the sporozoite stage (Florens et al., 2002), with the signals obtained for each subject at the two bleeding time points grouped in circles. For 3 out of 46 subjects, namely BSPZV1-360, BSPZV1-104 and BSPZV1-117, the signals do not cluster in this t-SNE analysis.
-
Figure 2—source data 1
Data frame of the normalized signal intensities of the protein microarray.
This table includes log2 signal intensities of each of the 7’455 protein spots for all samples. Serum draw, immunization dose, protection after CHMI, and description of each protein fragment are specified.
- https://cdn.elifesciences.org/articles/53080/elife-53080-fig2-data1-v2.xlsx
Figure 3
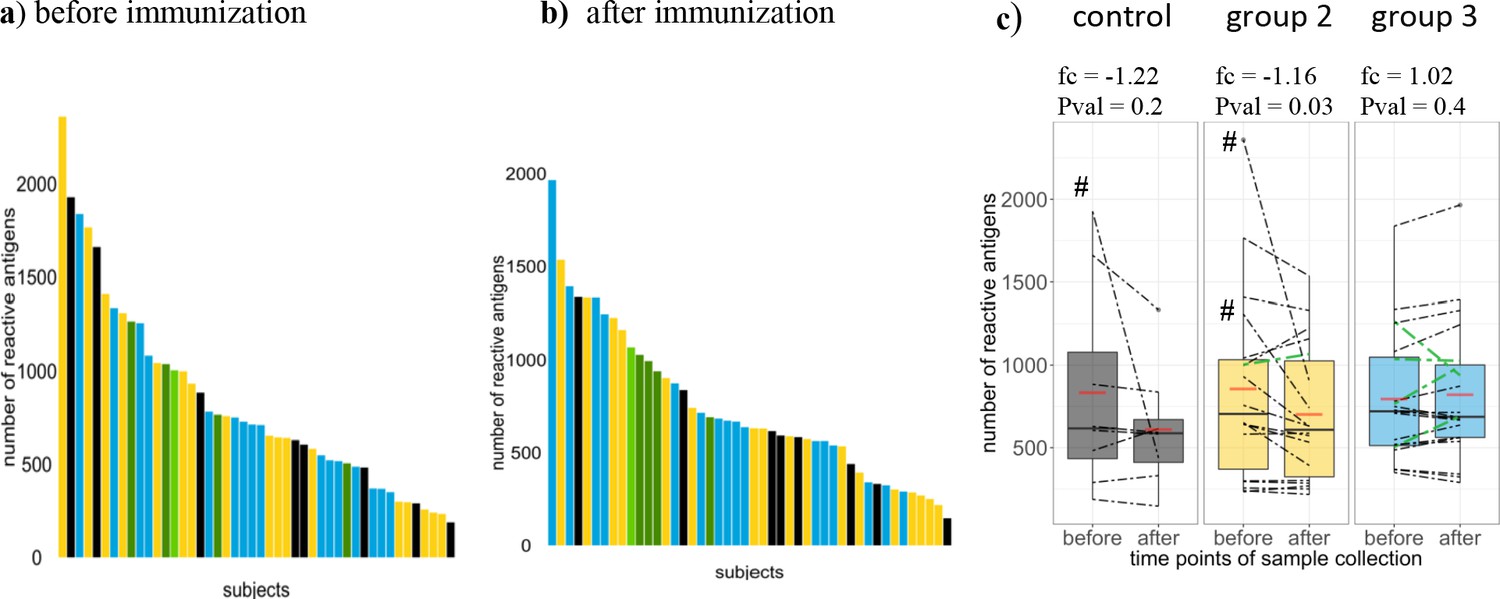
Breadth of Pf-specific humoral immunity upon PfSPZ vaccination.
Breadth of Pf-specific antibody responses per volunteer (a) before and (b) after PfSPZ vaccination, stratified according to intervention and ordered according to their respective number of seropositive responses from highest to lowest. In (c) boxplots show median, interquartile range (IQR) and 1.5xIQR limits of the antibody breadth grouped by study arm and time point, means for each group are represented by red lines, and an estimated fold change with p-value from the inverted beta-binomial test are indicated for each group. Breadth of each volunteer are indicated by dashed lines. Controls, group 2 (1.35 × 10⁵ PfSPZ Vaccine/dose) and group 3 (2.7 × 10⁵ PfSPZ Vaccine/dose) volunteers are marked in black, yellow and blue, respectively. Results of the five CHMI protected individuals are highlighted in green (light green in group 2).
-
Figure 3—source data 1
Breadth of Pf-specific humoral immunity in each sample.
- https://cdn.elifesciences.org/articles/53080/elife-53080-fig3-data1-v2.csv
-
Figure 3—source data 2
Summary statitistics on breadth per group and protection level.
An estimated effect of immunization on breadth and corresponding p-value performing the inverted beta-binomial test for paired count data using sample at basdeline and after immunization are shown in A, together with the mean and median breadth for each group at baseline and after immunization, and for the protected and unprotected group. (B) indicates the estimated regression coefficient and corresponding p values of the negative binomial regression to test differences in breadth between two groups at either baseline or after immunization.
- https://cdn.elifesciences.org/articles/53080/elife-53080-fig3-data2-v2.xlsx
Figure 4 with 3 supplements
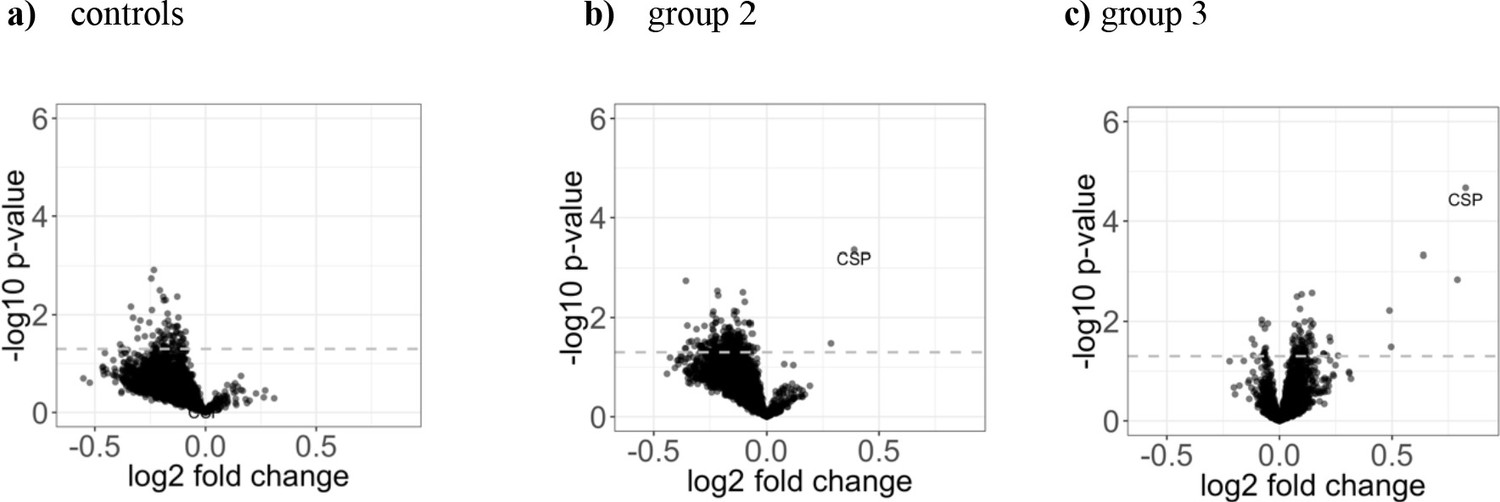
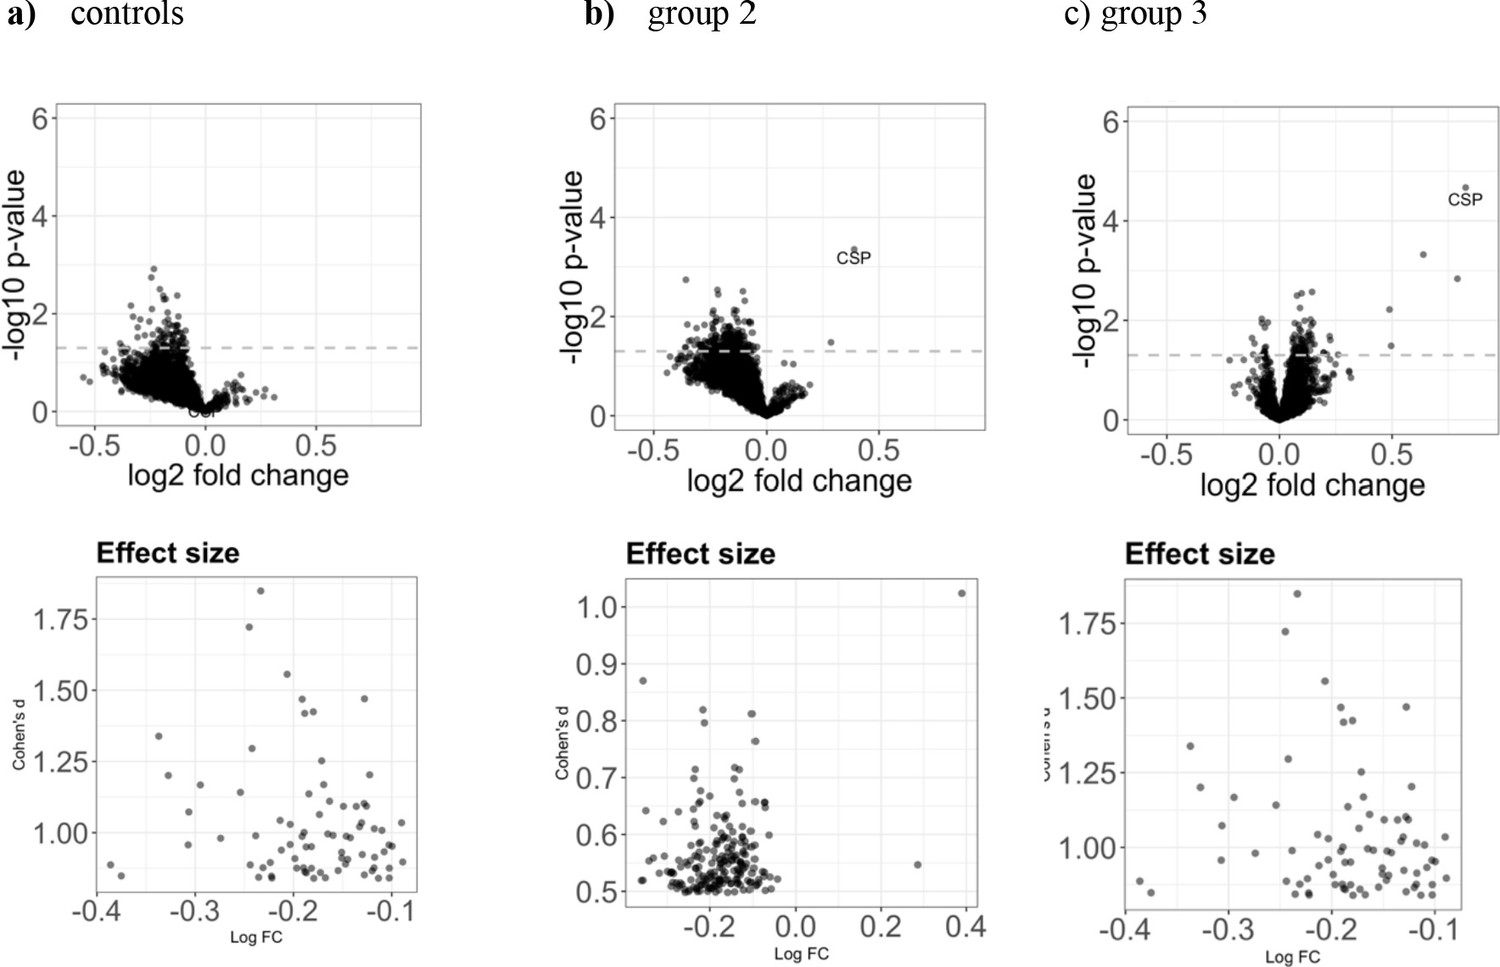
Increase in antigen recognition from baseline to after PfSPZ vaccination is moderate.
The three volcano plots in the upper row show (a) the mean fold change in the control group (n = 8), (b) in group 2 (1.35 × 10⁵ PfSPZ Vaccine/dose) (n = 18), and (c) in group 3 (2.7 × 10⁵ PfSPZ Vaccine/dose) (n = 20). In all groups, the samples collected at baseline and two weeks past last vaccination were compared. The dashed line represents the threshold of statistical significance (p=0.05) not adjusted for the FDR (none of the antigens had a FDR adjusted p-value<0.05). For effect size estimates see Figure 4—figure supplement 1.
-
Figure 4—source data 1
Source data for plot a.
- https://cdn.elifesciences.org/articles/53080/elife-53080-fig4-data1-v2.csv
-
Figure 4—source data 2
Source data for plot b.
- https://cdn.elifesciences.org/articles/53080/elife-53080-fig4-data2-v2.csv
-
Figure 4—source data 3
Source data for plot c.
- https://cdn.elifesciences.org/articles/53080/elife-53080-fig4-data3-v2.csv
Figure 4—figure supplement 1
Effect size for the increase in antigen recognition from baseline to after PfSPZ vaccination.
Upper row: The three volcano plots in the upper row show (a) the mean fold change in the control group (n = 8), (b) in group 2 (n = 18), and (c) in group 3 (n = 20). In all groups, the samples collected at baseline and two weeks past last vaccination were compared. The dashed line represents the threshold of statistical significance (p=0.05) not adjusted for the FDR (none of the antigens had a FDR adjusted p-value<0.05). Lower row: for each volcano plot the corresponding effect size for all antigens with a significant (p value < 0.05) fold change is shown.
Figure 4—figure supplement 2
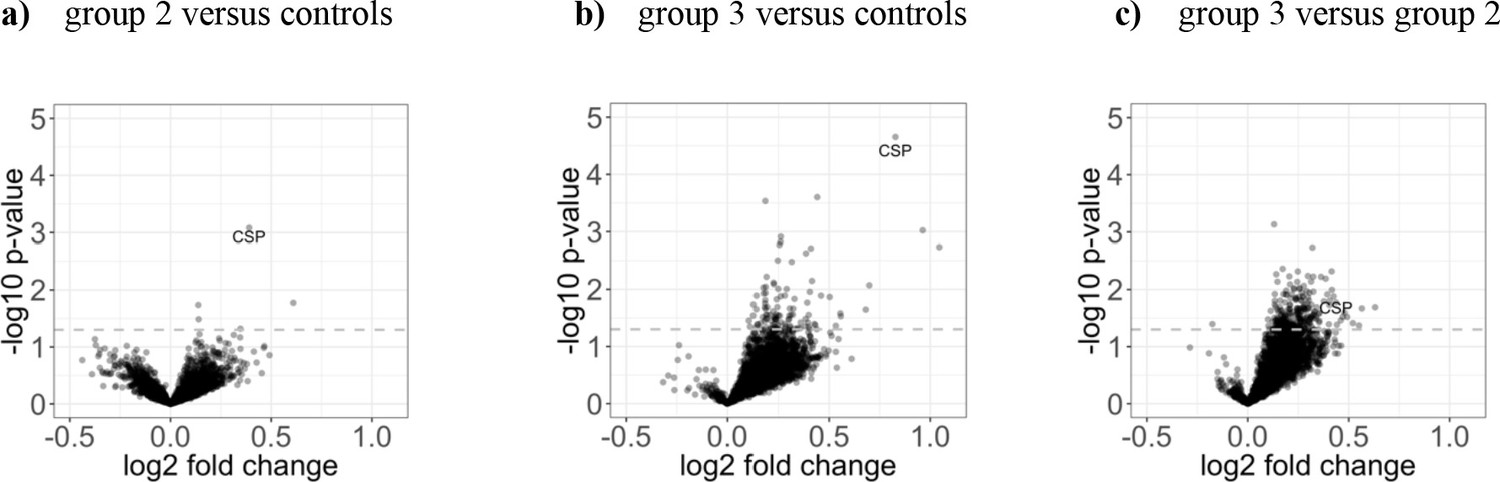
Differential antigen reactivity between control and immunization groups is moderate.
The three volcano plots illustrate (a) the mean fold change of the differential antigen reactivity before and 2 weeks after immunization between controls (n = 8) and group 2 (n = 18), (b) between controls and group 3 (n = 20), and (c) between group 2 and group 3. The dashed line represents the threshold of statistical significance (p=0.05) not adjusted for the FDR (none of the antigens had a FDR adjusted p-value<0.05).
-
Figure 4—figure supplement 2—source data 1
Source data for plot a.
- https://cdn.elifesciences.org/articles/53080/elife-53080-fig4-figsupp2-data1-v2.csv
-
Figure 4—figure supplement 2—source data 2
Source data for plot b.
- https://cdn.elifesciences.org/articles/53080/elife-53080-fig4-figsupp2-data2-v2.csv
-
Figure 4—figure supplement 2—source data 3
Source data for plot c.
- https://cdn.elifesciences.org/articles/53080/elife-53080-fig4-figsupp2-data3-v2.csv
Figure 4—figure supplement 3
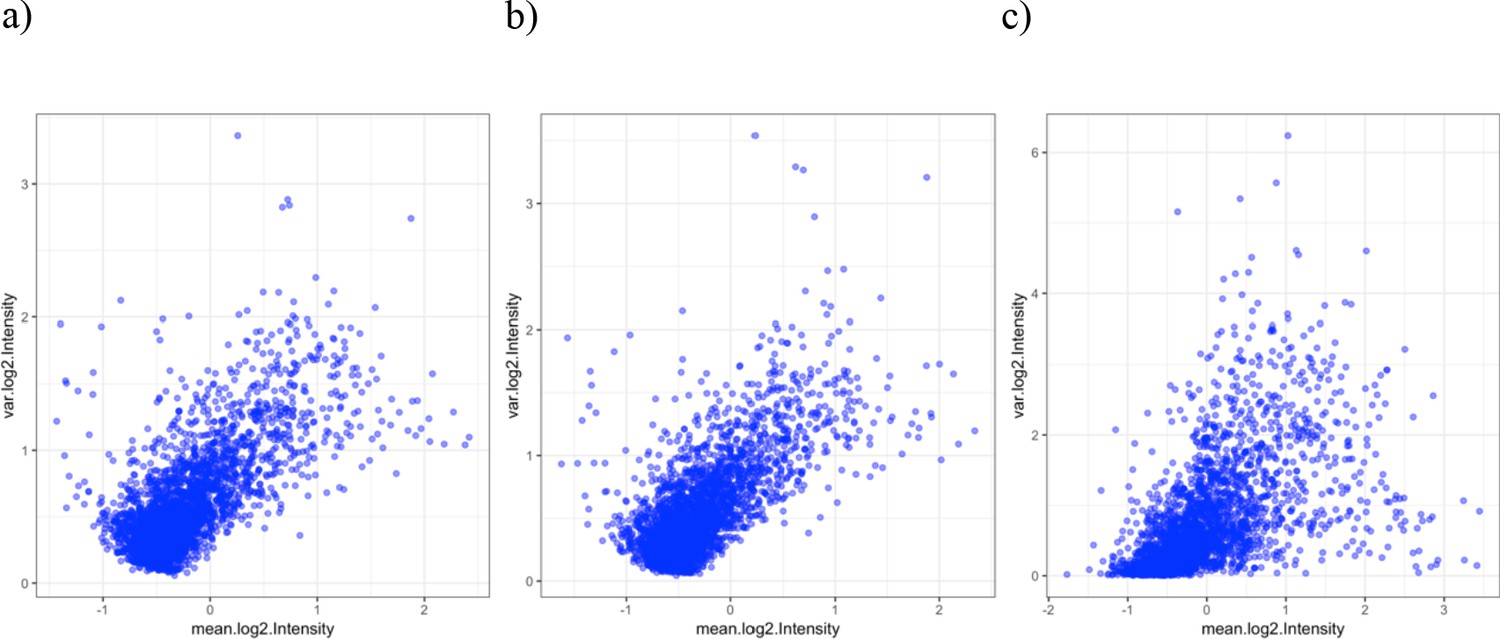
Variance and mean of the log2 signal intensities.
Mean (x-axis) and variance (y-axis) of the normalized log2 signal intensities of each of the 2804 reactive antigens across (a) all samples at baseline (n = 46), (b) samples 2 weeks after immunization in the unprotected group (n = 33) and (c) samples 2 weeks after immunization in the protected group (n = 5).
Figure 5 with 3 supplements
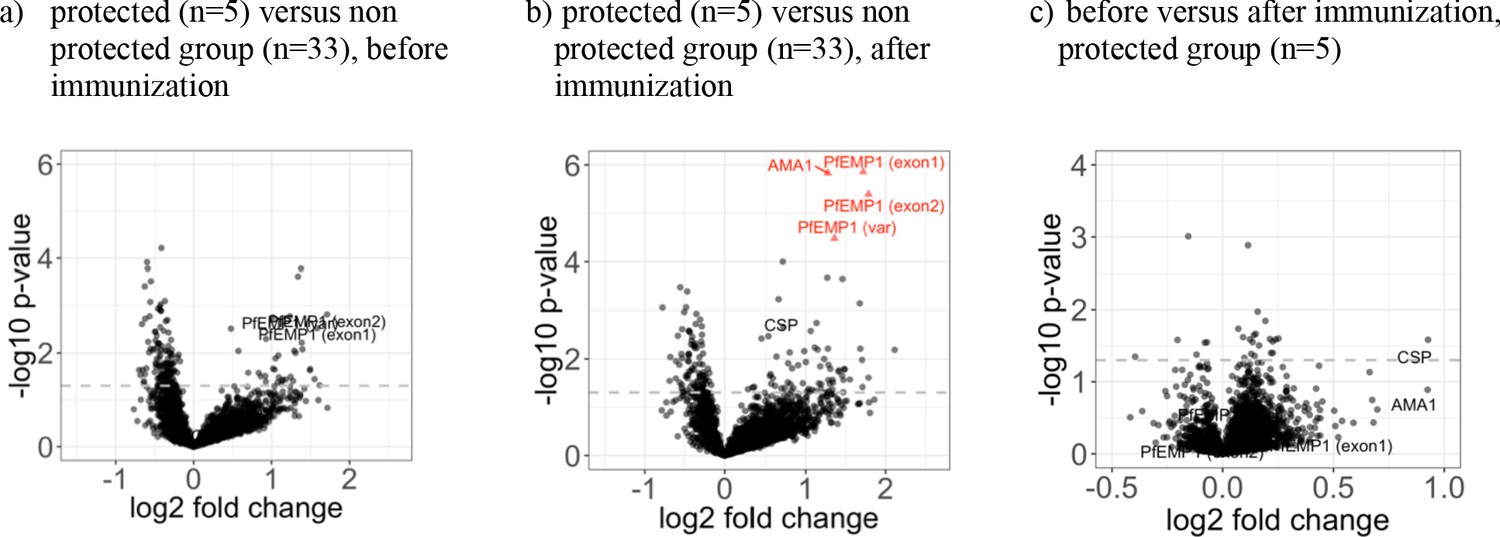
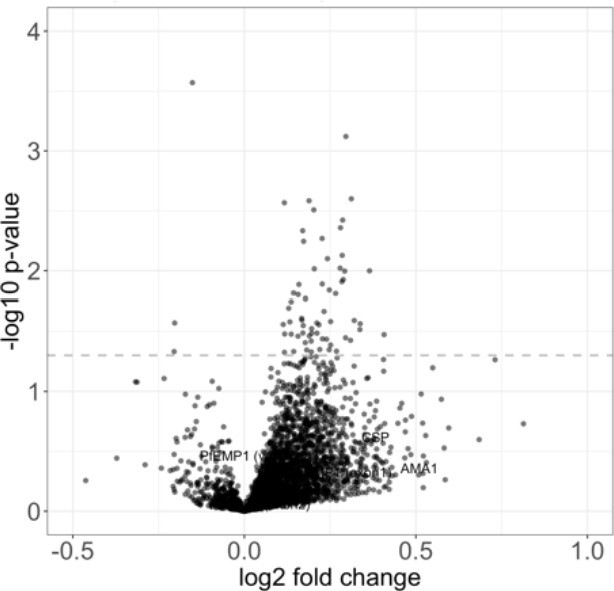
The five volunteers protected against homologous CHMI showed higher recognition of four distinct proteins after immunization.
The mean fold change between antigen reactivity in the protected (n = 5) and the non-protected (n = 33) individuals from groups 2 and 3 are represented in volcano plots (a) for baseline and (b) after PfSPZ vaccination, plotted against the inverse log10 t-test p-value. In the protected group (n = 5), the samples collected at baseline and two weeks past last vaccination were compared and the mean fold change of the increased immunogenicity is showed in (c). Red triangles represent antigens with significant differences in antibody levels between protected and non-protected volunteers after BH adjustment of p-values, although size effect measured by Cohen’s distance remains low (see Figure 5—figure supplement 1). The dashed line represents the threshold of statistical significance for the unadjusted p=0.05.
-
Figure 5—source data 1
Source data for plot a.
- https://cdn.elifesciences.org/articles/53080/elife-53080-fig5-data1-v2.csv
-
Figure 5—source data 2
Source data for plot b.
- https://cdn.elifesciences.org/articles/53080/elife-53080-fig5-data2-v2.csv
-
Figure 5—source data 3
Source data for plot c.
- https://cdn.elifesciences.org/articles/53080/elife-53080-fig5-data3-v2.csv
Figure 5—figure supplement 1

The increased recognition of four distinct proteins in the protected group show small effect size.
The volcano plot in (a) shows the mean fold change in the protected group (n = 5) compared to the unprotected group (n = 33) two weeks past last vaccination were compared. The dashed line represents the threshold of statistical significance for the BH unadjusted (p=0.05) analysis. The effect size measured as Cohen’s distance (x-axis) for each signal (y-axis) is shown in (b) and indicate small effect size (lower than 0.5) for all protein fragments, including the four protein fragments identified as significantly increased in the protected group. Red triangles represent antigens with significant differences in antibody levels between protected and non-protected volunteers after BH adjustment of p-values. (c) shows the quantile-quantile plots of the four identified protein framgents in the protected and non-protected group before and two weeks after immunization, comparing randomly generated, independent standart normal data on the x-axis to the sample population on the y-axis for sample before immuniazion (in black), after immunization (in blue) in the non-protecgted group (upper rows) and protected group (lower rows) for the three identified PfEMP1 protein fragments and PfAMA1.
Figure 5—figure supplement 2
No antigens show a significant differential antigen reactivity between the protected and unprotected group.
The volcano plot shows the mean fold change of the differential antigen reactivity before and 2 weeks after immunization between the protected group (n = 5) and unprotected group (n = 33). The dashed line represents the threshold of statistical significance for the BH unadjusted (p=0.05) analysis. However, no antigen remained as statistically significantly changed when using the BH adjustment.
-
Figure 5—figure supplement 2—source data 1
Source data for plot.
- https://cdn.elifesciences.org/articles/53080/elife-53080-fig5-figsupp2-data1-v2.csv
Figure 5—figure supplement 3
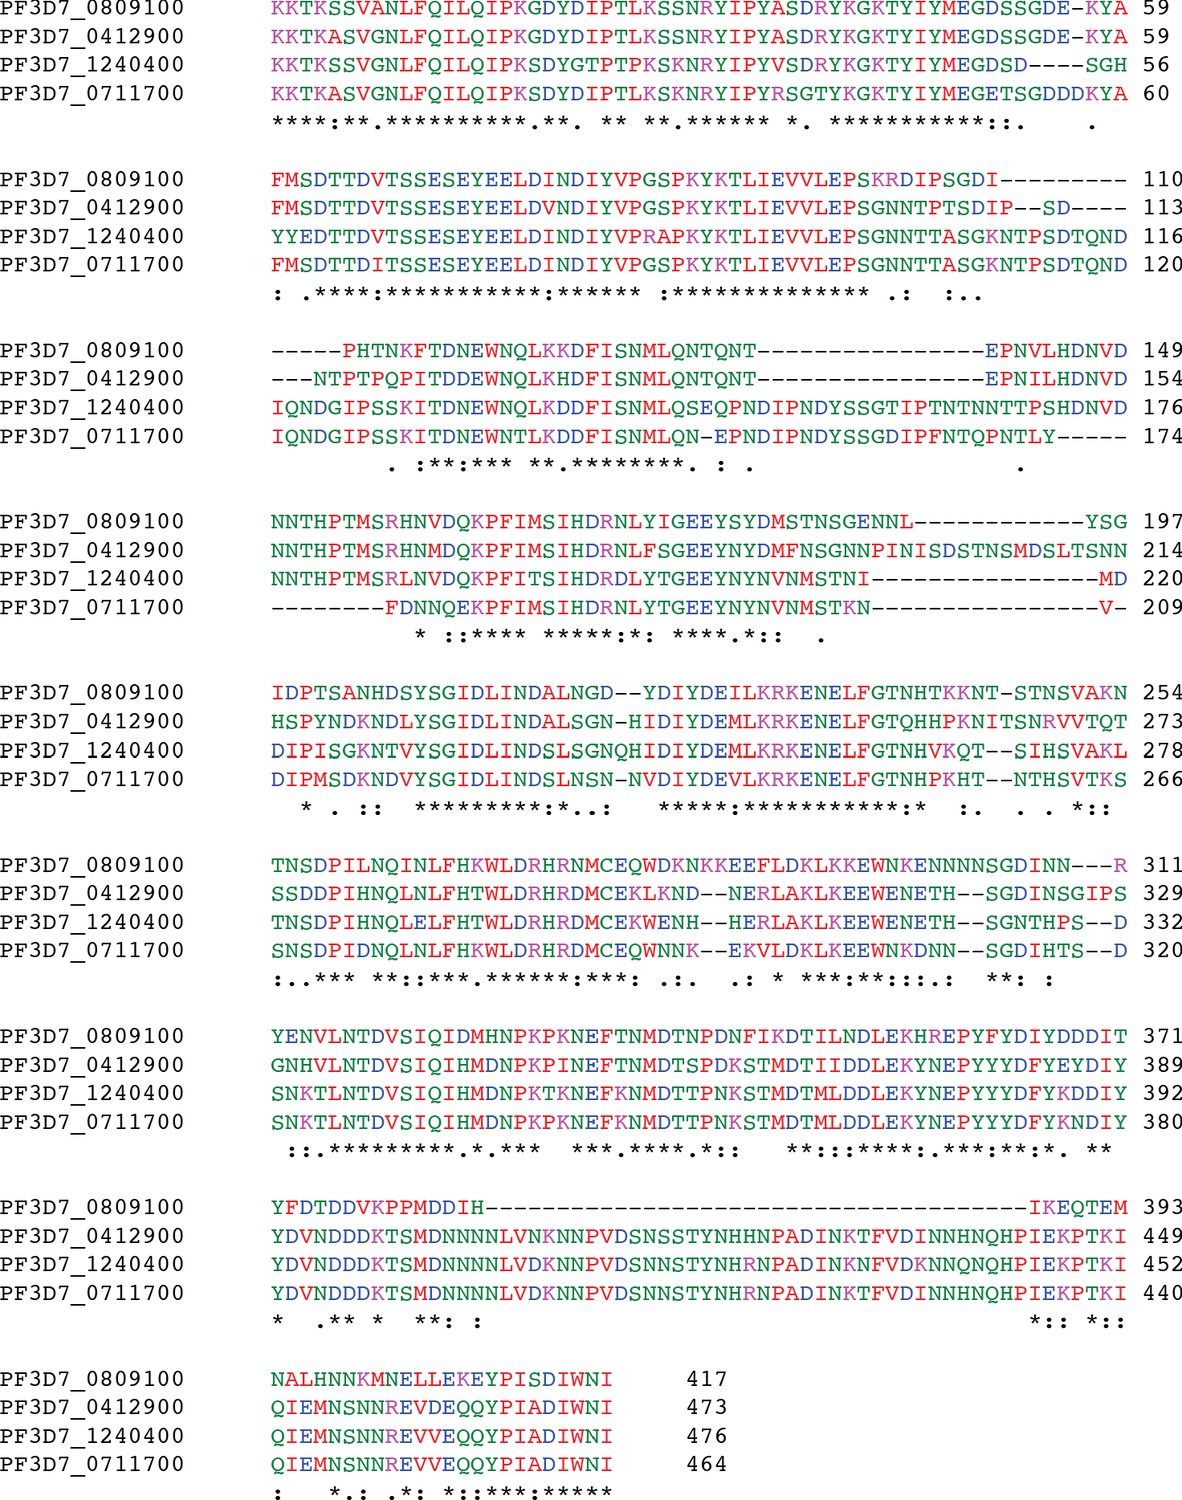
Multiple sequence alignment of four PfEMP1 protein fragments.
PfEMP1 sequence named NF54_SpzPfEMP1 or PF3D7_0809100 (Zanghì et al., 2018) is compared to the sequences of the three PfEMP1 protein fragments found to be associated with protection in this study (gene ID PF3D7_0412900, PF3D7_1240400, PF3D7_0711700). * (asterisk) indicates positions which have a single, fully conserved residue.: (colon) indicates conservation between groups of strongly similar properties and. (period) indicates conservation between groups of weakly similar properties. Alignment was performed using the Clustal Omega program which uses seeded guide trees and HMM profile-profile techniques to generate alignments from the European Bioinformatics Institute (EMBL-EBI).
Figure 6
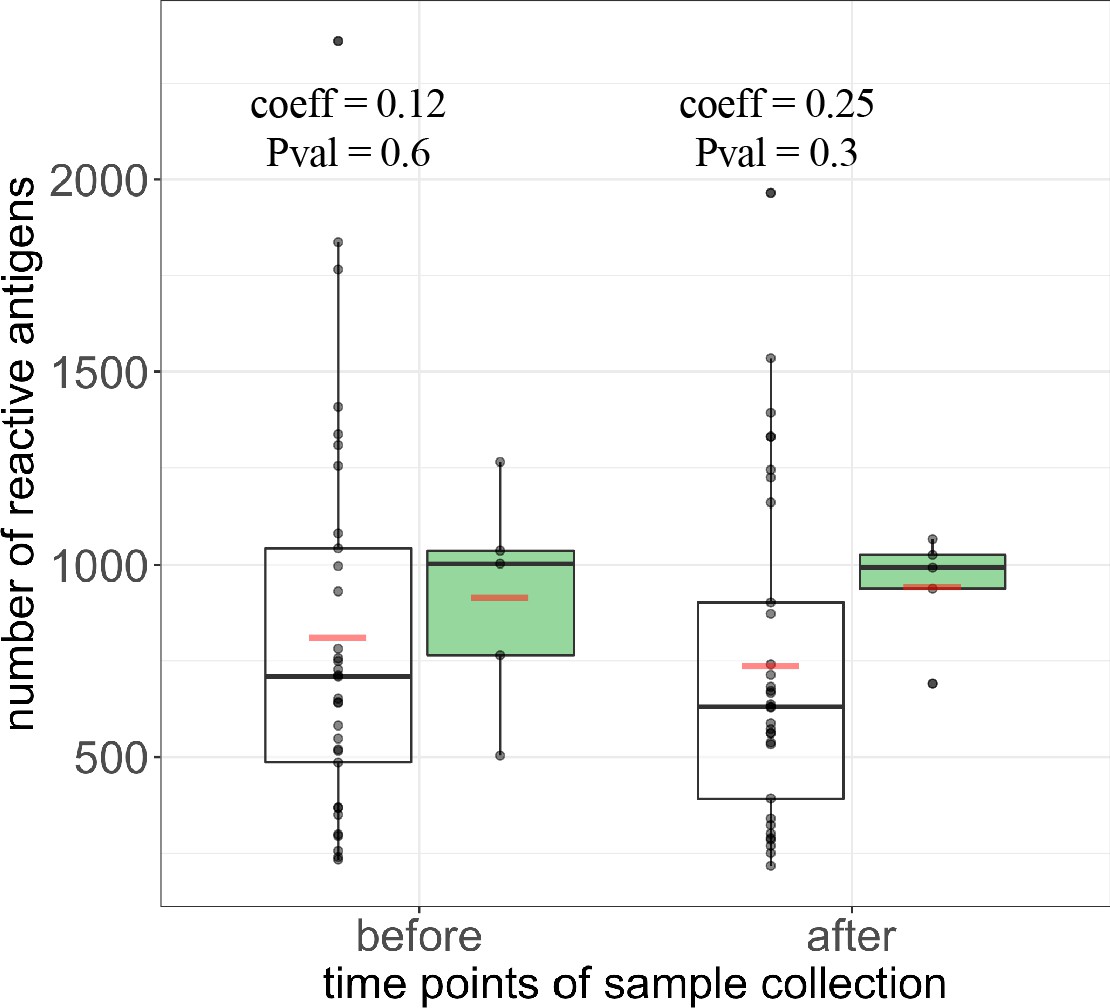
Breadth and magnitude of Pf-specific humoral immunity in protected and unprotected individuals.
(a) Breadth counts of all PfSPZ vaccinees grouped by protection status following CHMI, with protected group in green and non-protected volunteers depicted in white, before and after immunization. The coefficient estimate with corresponding p-values from the negative binonial test is indicated for each time point. Boxplots show median, interquartile range (IQR) and 1.5xIQR limits and red bars represent the mean.
Figure 7 with 1 supplement
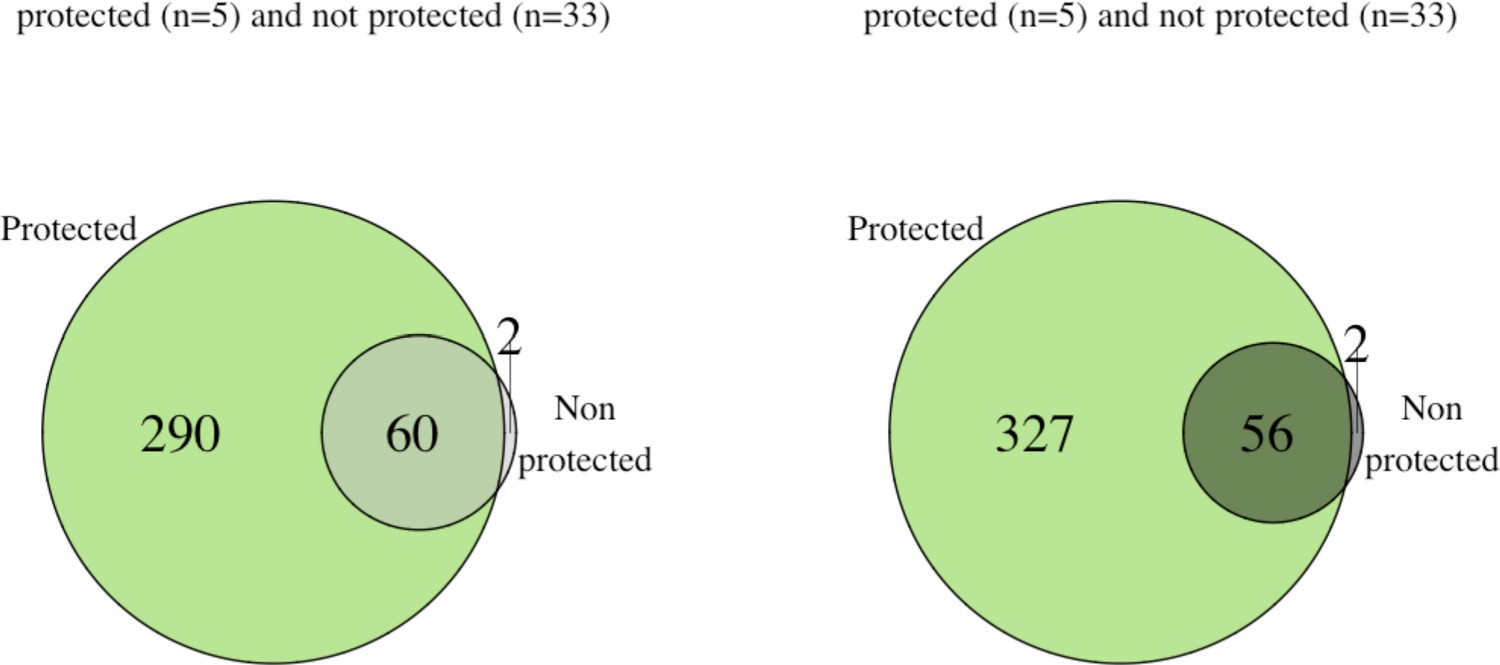
Protected individuals showed higher numbers of reactive antigens compared to the non protected group.
The number of antigens that were reactive in at least 80% of the individual in each group are represented for (a) baseline for the protected group (green, n = 5) and the unprotected group (grey, n = 33) and for (b) after immunization for the protected group (green) and unprotected group (grey).
-
Figure 7—source data 1
Table of commonly recognized antigens .
List of the antigens that increased in reactivity following immunization, or that were reactive after immunization in at least 50% (highlighted in blue) of a given group are listed, including the ID, gene ID, Description, and the number of volunteers for which the antigen was reactive or had increased reactivity following immunization.
- https://cdn.elifesciences.org/articles/53080/elife-53080-fig7-data1-v2.xlsx
Figure 7—figure supplement 1
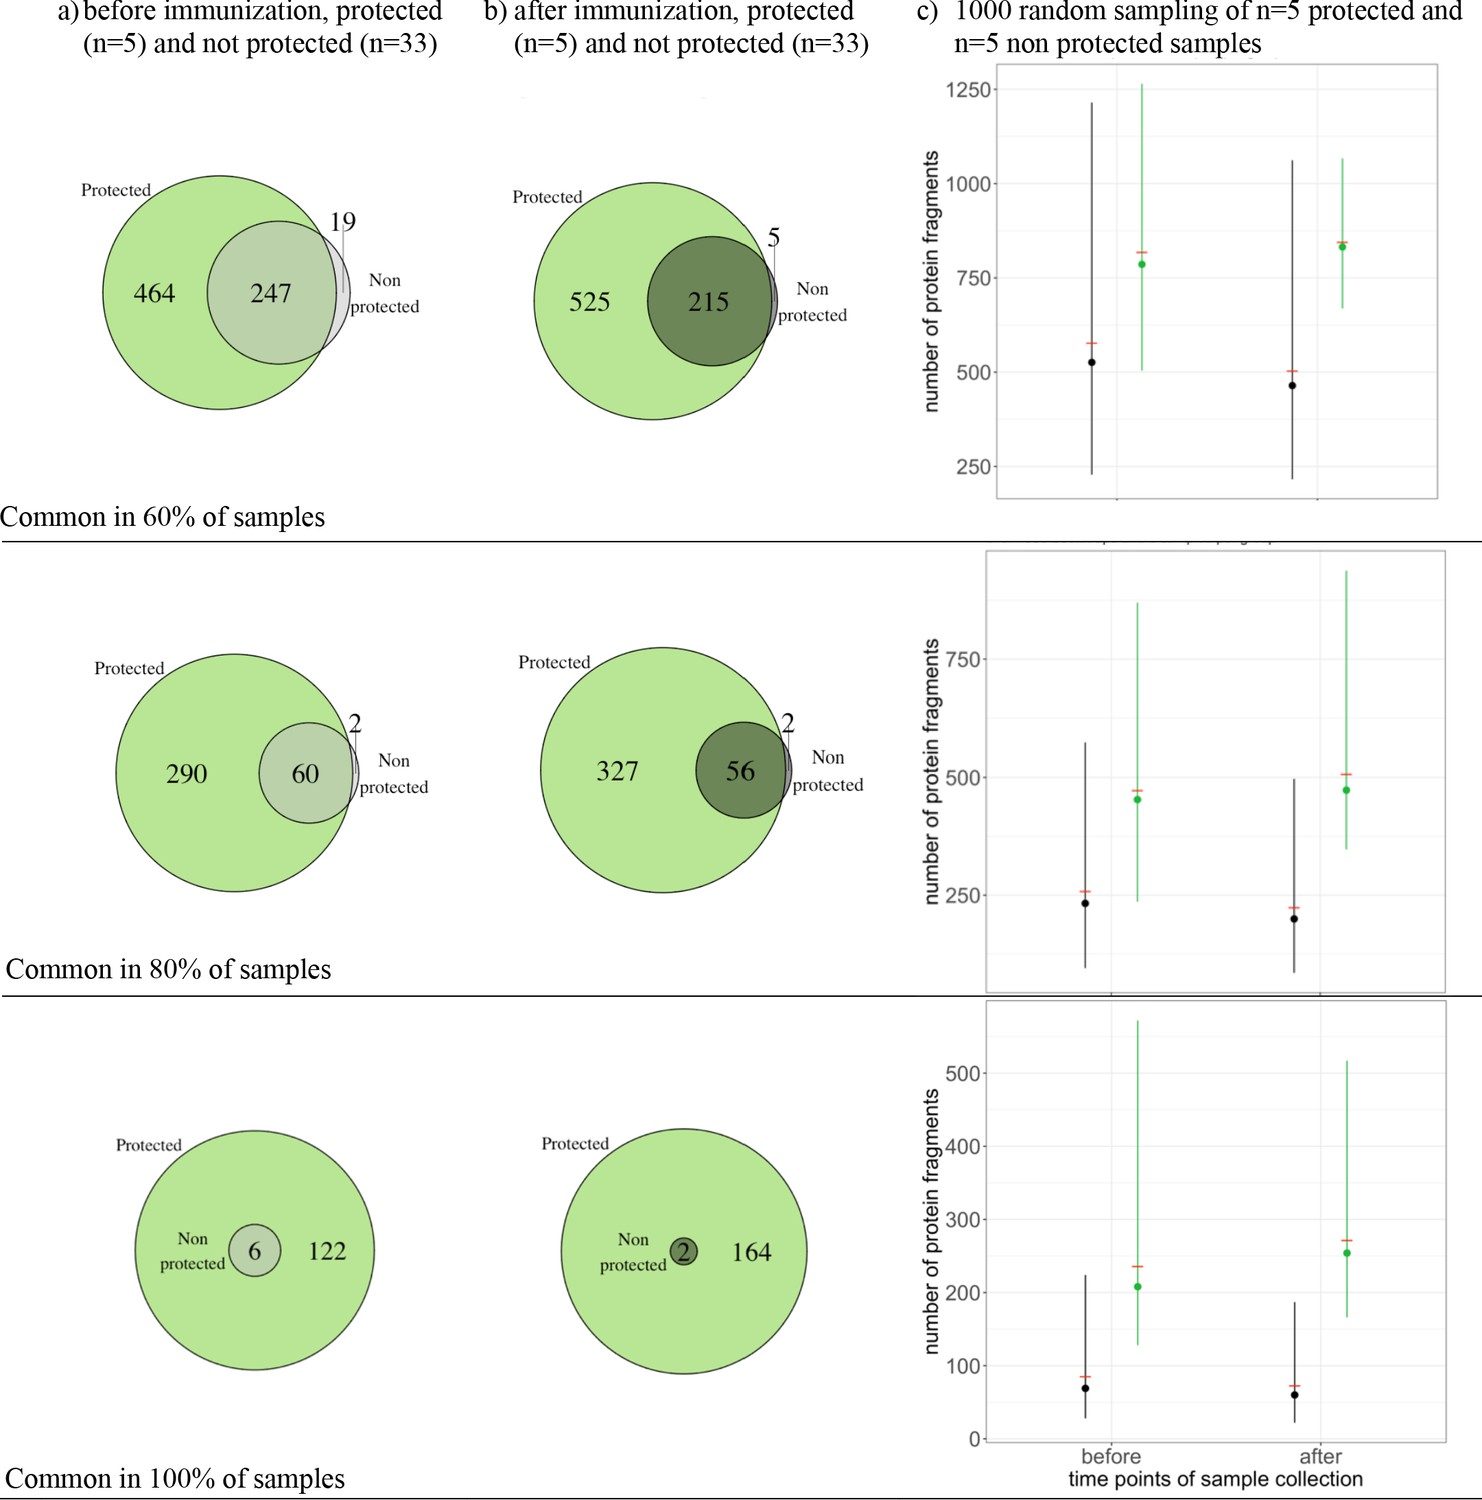
The number of commonly recognized antigens, per threshold.
The number of antigens that were reactive in at least 60% (upper row), 80% (middle row), and 100% (lower row) of the individual in each group are represented for (a) baseline for the protected group (green, n = 5) and the unprotected group (grey, n = 33), for (b) after immunization for the protected group (green, n = 5) and unprotected group (grey, n = 33), and for (c) randomly selected samples for the protected group (green, n = 5) and the unprotected group (black, n = 5) before and after immunization. (c) shows the 95 percent confidence interval, the dots represents median and the red bars the means per group, across 1000 draws.
Tables
Table 1
Intracellular proteins are the most abundant reactive proteins.
The frequencies of reactive antigens allocated into the different subcellular localization categories (rows) for each group (columns), tested using 2-propotions Z-test and p-values adjusted using the Benjamini-Hochberg method (BH) (Benjamini and Hochberg, 1995), are shown (for all reactive proteins with p-values<0.05). Column two indicate the total number of reactive antigens, and columns 3–8 detail the number of significantly differentially reactive proteins localized in each compartment across samples before immunization, after immunization, in the protected group before and after immunization, in the unprotected group before and after immunization, respectively. The first row shows extracellular proteins, the second row is cell membrane associated proteins and the following rows are predicted intracellular proteins split according to subcellular localisation. The percentage of the reactive proteins found in each group compared to all samples (first column) are indicated in parenthesis.
| Subcellular localization | N reactive proteins | Baseline reactivity | Post-Immz reactivity | Baseline reactivity (protected) | Post-Immz reactivity (protected) | Baseline reactivity (unprotected) | Post-Immz reactivity (unprotected) | |
|---|---|---|---|---|---|---|---|---|
| Extracellular | 53 | 3 (6%) | 3 (6%) | 10 (19%) | 12 (23%) | 3 (6%) | 3 (6%) | |
| Cell membrane | 208 | 11 (5%) | 8 (4%) | 63 (30%) | 70 (34%) | 10 (5%) | 5 (2%) | |
| Intracellular (N = 1978) | Cytoplasm | 661 | 14 (2%) | 16 (2%) | 73 (11%) | 79 (12%) | 12 (2%) | 14 (2%) |
| Endoplasmic reticulum | 429 | 12 (3%) | 11 (3%) | 53 (12%) | 60 (14%) | 11 (3%) | 10 (2%) | |
| Golgi apparatus | 76 | 2 (3%) | 2 (3%) | 13 (17%) | 15 (20%) | 2 (3%) | 2 (3%) | |
| Lysosome/Vacuole | 32 | 1 (3%) | 1 (3%) | 3 (9%) | 2 (6%) | 1 (3%) | 1 (3%) | |
| Mitochondrion | 150 | 3 (2%) | 3 (2%) | 11 (7%) | 14 (9%) | 3 (2%) | 3 (2%) | |
| Nucleus | 624 | 24 (4%) | 20 (3%) | 107 (17%) | 115 (18%) | 17 (3%) | 18 (3%) | |
| Peroxisome | 3 | 0 (0%) | 0 (0%) | 0 (0%) | 0 (0%) | 0 (0%) | 0 (0%) | |
| Plastid | 3 | 2 (67%) | 2 (67%) | 2 (67%) | 2 (67%) | 2 (67%) | 2 (67%) | |
| Total | 2239 | 72 (3%) | 66 (3%) | 335 (15%) | 369 (16%) | 61 (3%) | 58 (3%) |
-
Table 1—source data 1
The full list of reactive antigens and DeepLoc subcellular localization predictions.
- https://cdn.elifesciences.org/articles/53080/elife-53080-table1-data1-v2.xlsx
Additional files
-
Source data 1
Gene Ontology prediction for the molecular function of the Pf genes.
- https://cdn.elifesciences.org/articles/53080/elife-53080-data1-v2.csv
-
Source data 2
Gene Ontology prediction for the cellular component of the Pf genes.
- https://cdn.elifesciences.org/articles/53080/elife-53080-data2-v2.csv
-
Source data 3
Gene Ontology prediction for the biological process of the Pf genes.
- https://cdn.elifesciences.org/articles/53080/elife-53080-data3-v2.csv
-
Source data 4
Pfam database for the prediction of protein families.
- https://cdn.elifesciences.org/articles/53080/elife-53080-data4-v2.csv
-
Supplementary file 1
Gene and protein families present in the protected versus non protected groups.
This table lists Pfam protein family prediction (El-Gebali et al., 2019), and gene ontology prediction available on Plasmodb.org (Huntley et al., 2015) and identified protein characteristics and distinct functional categories which were identified as being reactive in at least 80% of the protected or non protected group before and after immunization. Reactive proteins were associated to each group using the Fisher’s exact test, and p value correct using the Benjamini-Hochberg method (BH) (Benjamini and Hochberg, 1995). Pfam and GO description were found in https://www.ebi.ac.uk/QuickGO/ and https://biocyc.org/ and https://www.ebi.ac.uk/QuickGO/ and https://biocyc.org/, respectively. See also Source datas 1–4.
- https://cdn.elifesciences.org/articles/53080/elife-53080-supp1-v2.xlsx
-
Transparent reporting form
- https://cdn.elifesciences.org/articles/53080/elife-53080-transrepform-v2.docx
Download links
A two-part list of links to download the article, or parts of the article, in various formats.
Downloads (link to download the article as PDF)
Open citations (links to open the citations from this article in various online reference manager services)
Cite this article (links to download the citations from this article in formats compatible with various reference manager tools)
Proteome-wide analysis of a malaria vaccine study reveals personalized humoral immune profiles in Tanzanian adults
eLife 9:e53080.
https://doi.org/10.7554/eLife.53080


