Supramammillary nucleus synchronizes with dentate gyrus to regulate spatial memory retrieval through glutamate release
- Department of Pharmacology, University of North Carolina, United States
- Neuroscience Center, University of North Carolina, United States
- International Institute for Integrative Sleep Medicine (WPI-IIIS), University of Tsukuba, Japan
- The McGovern Institute for Brain Research, Massachusetts Institute of Technology, United States
- Neurobiology Curriculum, University of North Carolina, United States
- Department of Neurology and Biomedical Research Imaging Center, University of North Carolina, United States
Figures
Figure 1 with 2 supplements

Ca2+ activities of the SuM and DG at home cage and during the spatial memory test.
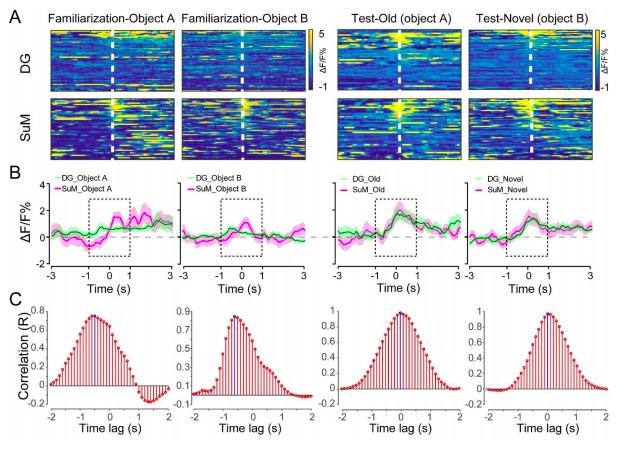
(A) Experimental diagram of the DG and SuM calcium recording at the home cage. (B) Coronal sections showing photometry fiber traces and CaMKII-GCaMP/tdTomato expressed neurons in the DG (left) and SuM (right). Scale bar = 100 µm. (C) A sample of normalized ΔF/F of GCaMP6f signals from the DG and SuM. The traces of GCaMP activity were moderately correlated with R = 0.31, p < 0.0001 at home cage. (D) Sample of GCaMP6f traces of the DG and SuM in 0.1–0.5 Hz spectrum. The traces of GCaMP signals were moderately correlated with R = 0.48, p < 0.0001. (E) Mean correlation of SuM and DG calcium activity in 0.1–0.5 Hz spectrum. n = 10 mice, R = 0.40, p<0.0001. (F) Experimental illustration of in vivo fiber photometry recordings during the NPR test. After 3 days of habituation, mice were recorded for calcium activity during distinct phases (spatial memory encoding versus retrieval) of the NPR test. (G) Time spent exploring the objects during the NPR test. In the test phase, time spent exploring the novel-location object (B) was significantly increased (n = 8 mice, paired t-test, t1,7 = 6.843, **p < 0.01). No difference was found during familiarization (n = 8 mice, paired t-test, t1,7 = 1.593, p = 0.16). (H, L) Scaled color plot of DG and SuM calcium activity while exploring object A (old location) and object B (novel location) during familiarization (H) and test (L) phase, respectively. n = 49, 62, 39, 59 trails. (I, M) Averaged DG and SuM calcium activities during familiarization (I) and test (M). Semi-transparent borders indicate ± SEM. (J, N) Cumulative DG and SuM calcium activities in the NPR test. Time points when mice started to explore the objects were defined as 0 s. Calcium activity was aligned within a 2 s time window at each phase: pre-exploring (−3 ~ −1 s), exploring (−1 ~ 1 s) and post-exploring (1 ~ 3 s). Cumulative activity = ∆F/F × Time (2 s). Calcium activity in both the DG and SuM increased when mice were exploring objects/locations during familiarization (J) and test (N). (K, O) Correlation of the SuM and DG calcium activity during familiarization (K) and test (O). Calcium activity of the SuM and DG during exploration was highly correlated (R = 0.9292, p < 0.0001) during spatial memory retrieval, as compared to a moderate correlation (R = 0.5438, p<0.0108) during spatial memory encoding. (P, Q) Cumulative activity of the DG (P) and SuM (Q) was increased during test, compared to familiarization. DG: Unpaired t-test, t207 = 2.009, *p=0.0459. SuM: Unpaired t-test, t207 = 1.975, *p = 0.0496.
Figure 1—figure supplement 1
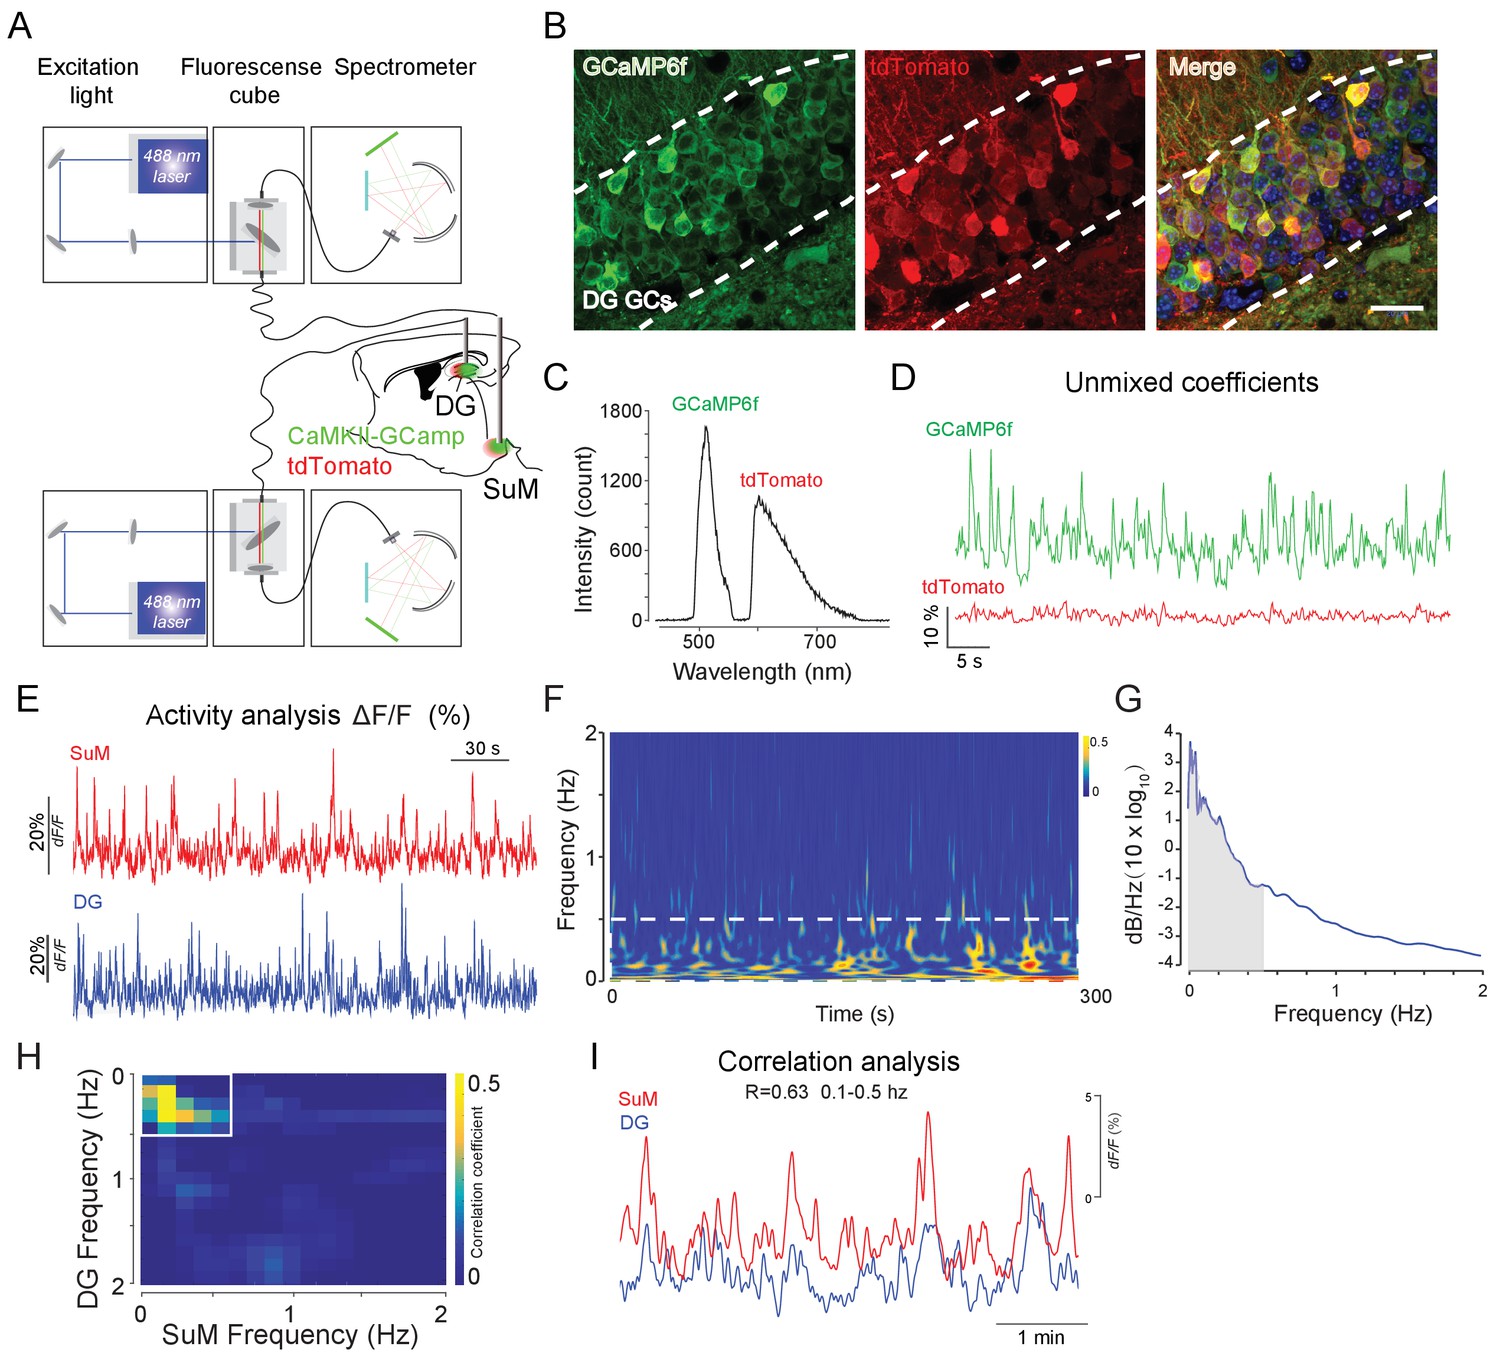
Experimental protocol of fiber photometry recording.
(A) Schematic illustration of the photometry system used for measuring red and green fluorescent sensors in the SuM and DG. CaMKII-GCaMP6f and CAG-tdTomato were delivered to the left DG and SuM. (B) Co-expression of GCaMP6f and tdTomato in DG GCs. Scale bar = 20 µm. (C) Mixed emission spectrum of GCaMP6f and tdTomato. (D) Unmixing coefficients of GCaMP6f and tdTomato by fitting signals to standard emission curves. TdTomato signals were further used as motion correction during recording. (E) Sample traces of simultaneous recording from the SuM and DG post unmixing and normalized process. Those data were used for activity analysis. (F) The color code sample frequency of SuM and DG calcium signals were mainly appeared at 0.1–0.5 Hz. (G) The calcium signals > 0.5 Hz were lower than 0.01 dB/Hz. Due to the low calcium signal associated with >0.5 Hz, we selected 0.1–0.5 Hz frequency range to analyze correlation of calcium activities from the SuM and DG. (H) Heatmap of the correlation coefficient in SuM and DG GCaMP frequency spectrum. (I) Correlation of SuM and DG GCaMP signals in 0.1–0.5 Hz range during home cage recording.
Figure 1—figure supplement 2
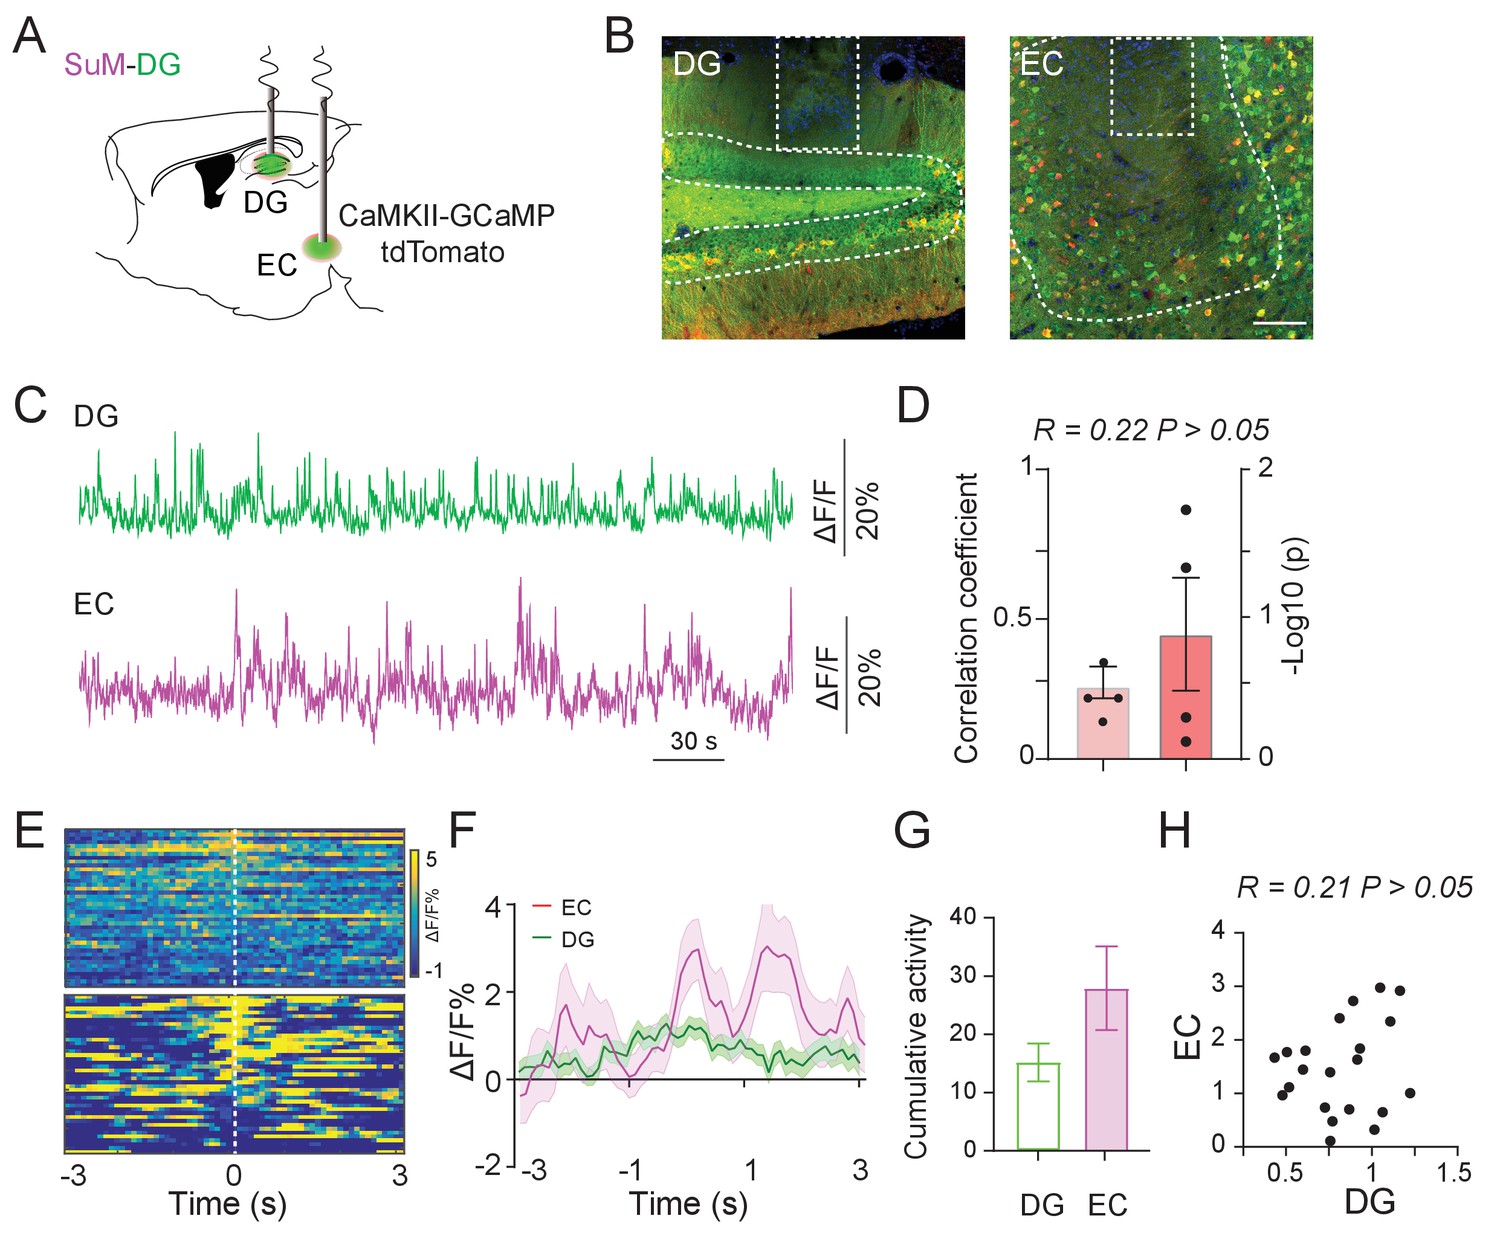
Low correlation of GCaMP activity in EC and DG at home cage and during the NPR test.
(A) Experimental diagram of the DG and EC calcium recording. (B) Coronal sections showing photometry fiber traces and CaMKII-GCaMP/tdTomato expressing neurons in the DG (left) and EC (right). Scale bar = 100 µm. (C–D) Samples (C) and correlation (D) of calcium activities of the DG and EC from mice at home cage. n = 4, R = 0.22, p > 0.05. Correlation of SuM and DG calcium activities in 0.1–0.5 Hz range were analyzed. (E) Scaled color plot of DG and EC GCaMP activities in NPR test period, n = 41 trails. (F) Average of DG and EC calcium activities in the test period. Transparent borders indicate ± SEM. During the exploring period, both DG and EC activities were increased. (G) Cumulative activity of the DG and EC during the exploring period (−1 ~ 1 s) in the NPR test. (H) Correlation of averaged DG and SuM calcium activity during the NPR test period. R = 0.21, p > 0.05.
Figure 2 with 3 supplements
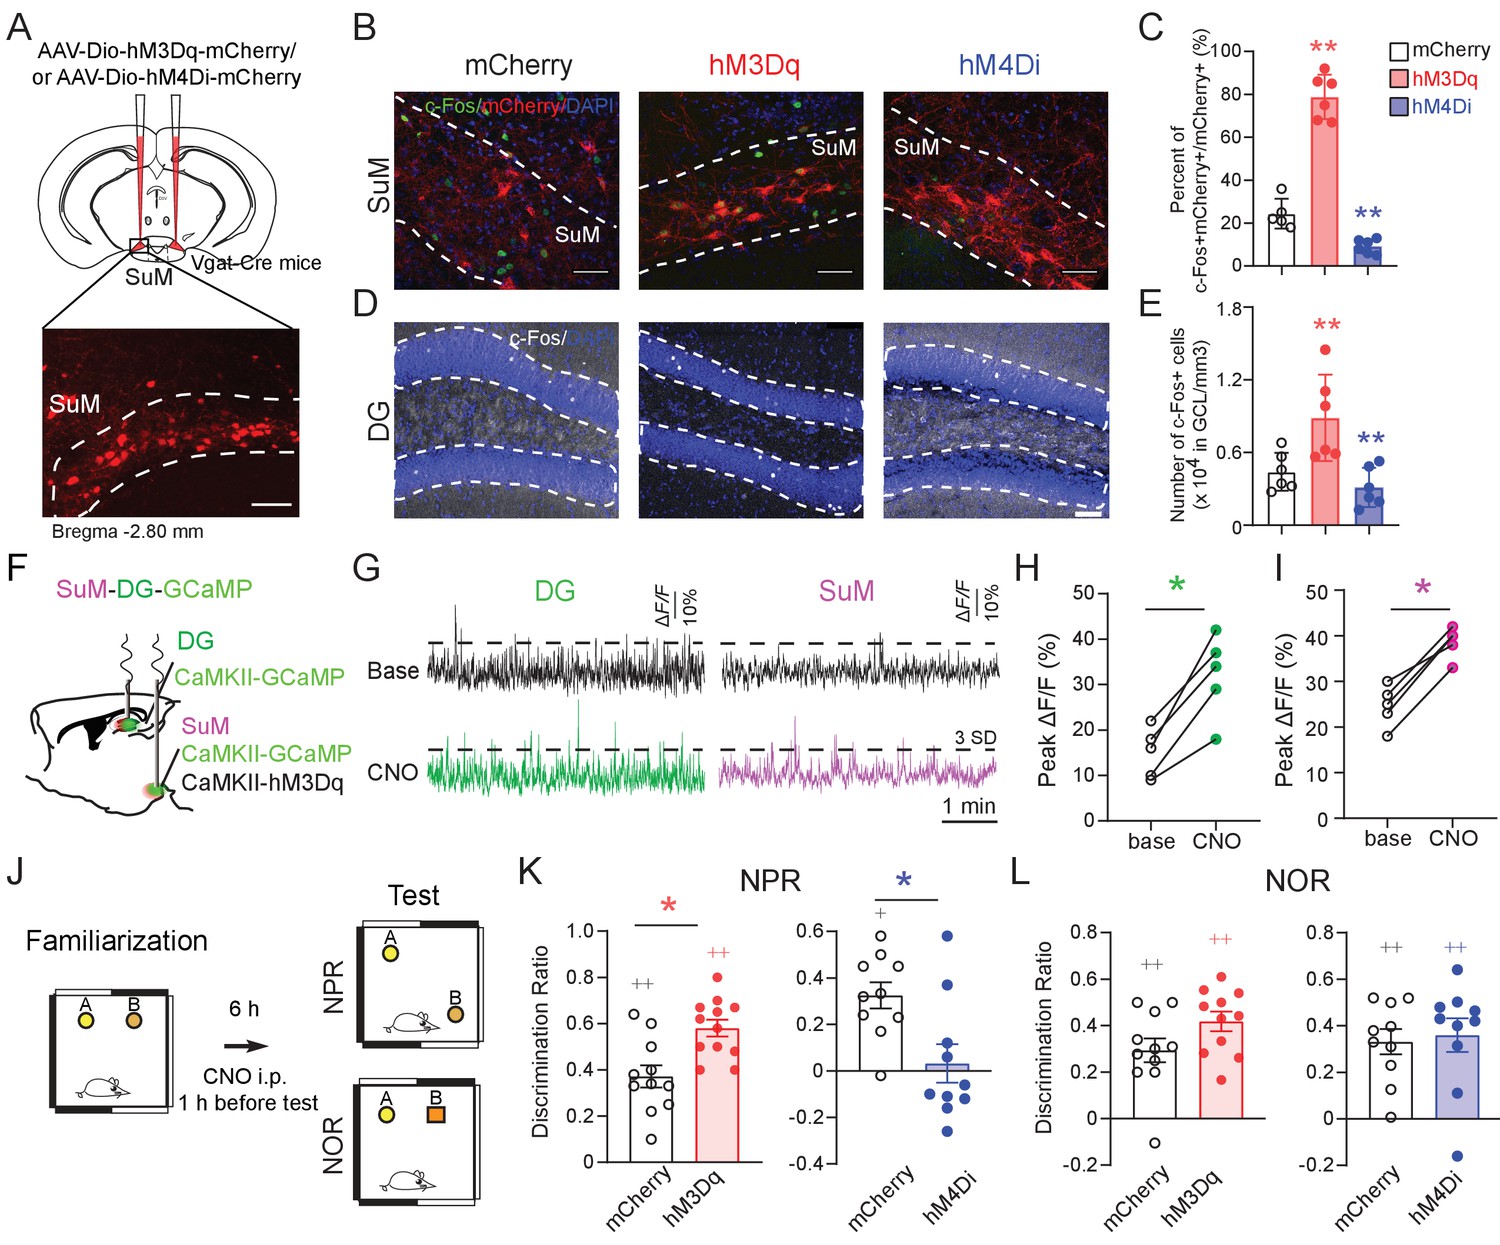
SuM activity is required for spatial memory retrieval.
(A) Experimental scheme. Coronal sections showing mCherry expression in SuMLVgat neurons in Vgat-Cre mice. Scale bar = 100 µm. (B) Sample images showing the c-Fos expression in SuMLVgat neurons 1 hr after CNO injection from AAV-DIO-hM3Dq- and AAV-DIO-hM4Di- injected mice. Scale bar = 100 µm. (C) Quantification of the density of c-Fos+/mCherry+ SuM neurons. CNO 1 mg/kg induced higher density of c-Fos+/hM3Dq-mCherry+ cells, but lower density of c-Fos+/hM4Di-mCherry+ cells. (n = 5–6 mice, one-way ANOVA followed by PLSD post hoc test, **p < 0.01). (D) Sample images showing c-Fos expression in the DG 1 hr after CNO injection from AAV-DIO-hM3Dq- and AAV-DIO-hM4Di- injected mice. Scale bar = 100 µm. (E) Quantification of c-Fos expression in DG GCs. C-Fos+ GCs were increased in hM3Dq-mice, but decreased in hM4Di-mice 1 hr after CNO injection. GCL: granule cell layer. (n = 5–6 mice, one-way ANOVA followed by PLSD post hoc test, **p < 0.01). (F) Diagram of in vivo photometry recording. AAV-CaMKII-GCaMP6f was injected in the left DG, and AAV-CaMKII-GCaMP6f mixed with CaMKII-hM3Dq was injected in the left SuM. Optic fibers were implanted above the DG and SuM, respectively. (G) Typical GCaMP6f traces (5 min) of baseline (upper) and 40 mins after 1 mg/kg CNO injection (below) from the DG and SuM. (H) The peak ∆F/F of the DG calcium signal increased after CNO injection. (n = 5 mice, paired t-test, t = 6.126, *p < 0.05). (I) The peak of ∆F/F of the SuM calcium signal increased after CNO injection. (n = 5 mice, paired t-test, t = 9.037, *p < 0.05). (J) Diagram of the NPR and NOR tests. CNO (1 mg/kg) was administrated 1 hr before these tests. (K) Activation or inhibition of SuMVgat neurons increased or decreased the discrimination ratio in the NPR test, respectively. (Unpaired t-test, t21 = 2.244, *p = 0.0358 in hM3Dq-mice, t18 = 2.238, *p = 0.0381 in hM4Di-mice). (L) Activation or inhibition of SuMVgat neurons did not change the discrimination ratio in the NOR test. (Unpaired t-test, t21 = 1.869, p > 0.05 in hM3Dq-mice, t18 = 0.9197, p > 0.05 in hM4Di-mice).
Figure 2—figure supplement 1
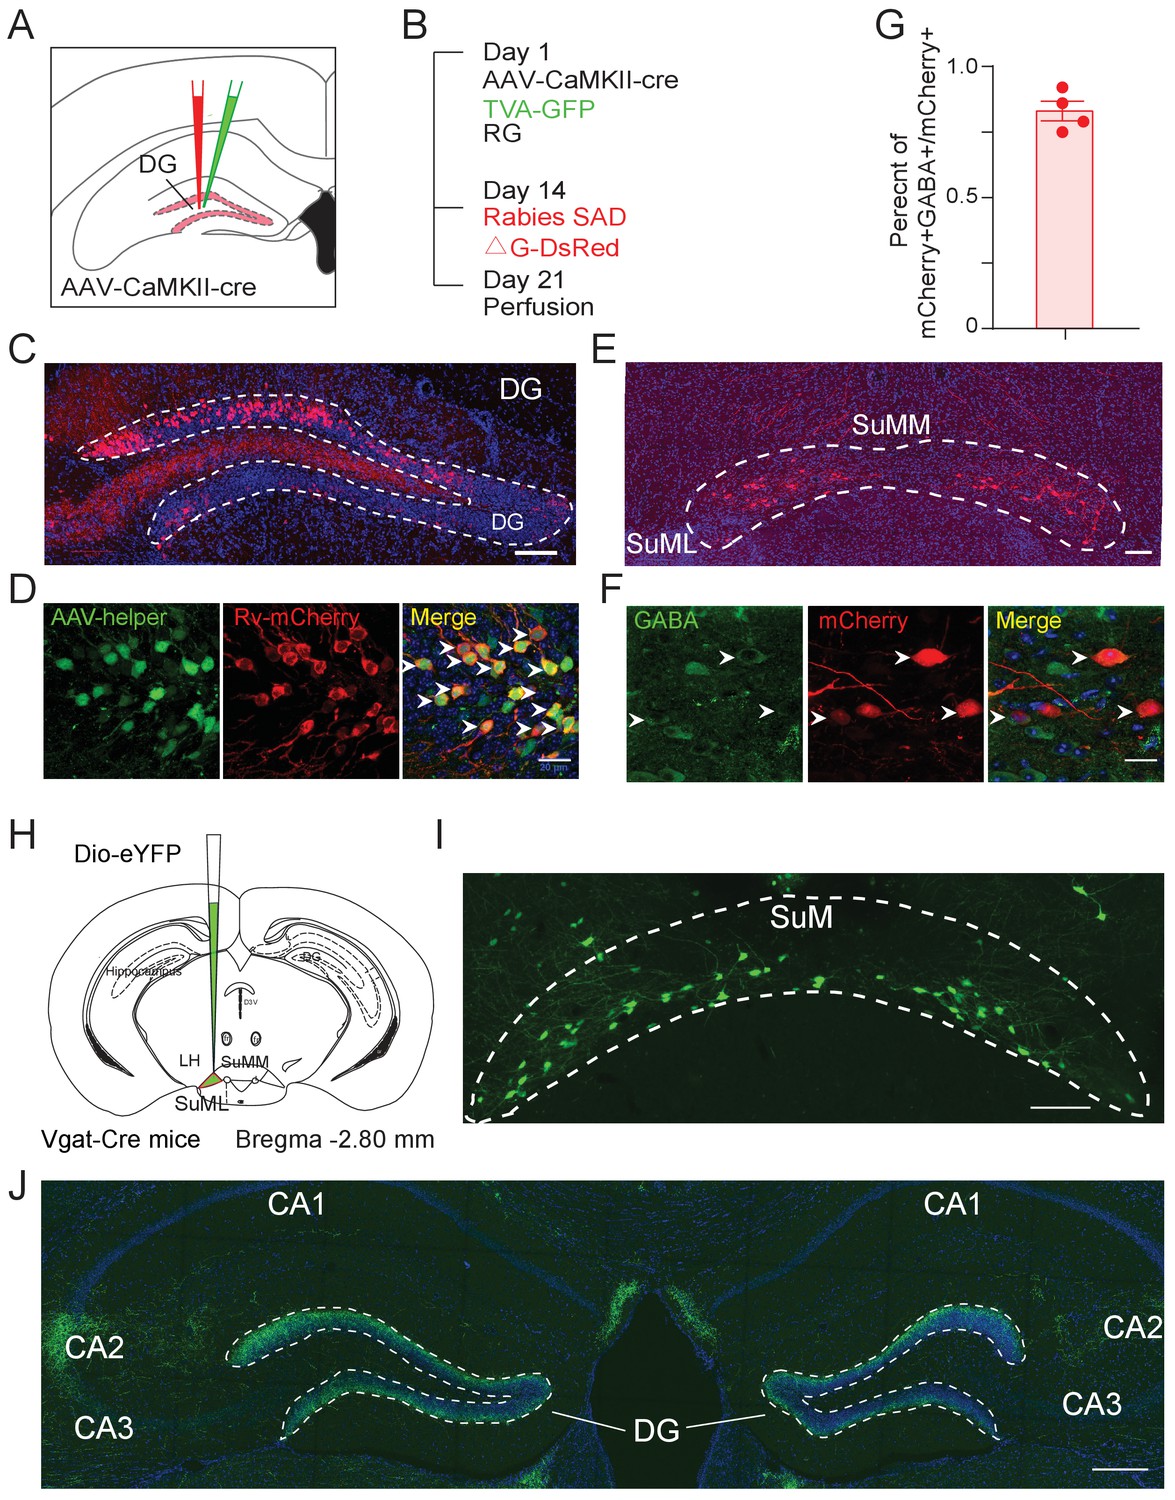
Cell-type-specific anterograde and retrograde tracing for SuMVgat-DG connections.
(A) Diagram of rabies-based monosynaptic synaptic tracing of DG GCs. (B) Experimental timeline of retrograde tracing. On day 1, AAV-CaMKII-Cre, Cre-dependent TVA-GFP and RG virus were injected to the left DG. On day 14, Rabies-mCherry was injected at the same site and mice were perfused on day 21. (C) Fluorescence images showing starter cells with mCherry expressions in the DG. Scale bar = 100 µm. (D) Amplified starter cells in the DG. Zoomed-in view of injection site showing that starter neurons (yellow, arrows indicated) were infected with AAV helper virus (green) and RV (red). Scale bar = 20 µm. (E) Representative coronal section showing retrogradely RV-labeled cell bodies (red) were in the SuM, with dense mCherry+ cells in the lateral SuM (SuML) and sparse mCherry+ cells in the medial SuM (SuMM). Scale bar = 100 µm. (F) RV-labeled SuML neurons were positive for GABA staining (white arrows indicated). Scale bar = 20 µm. (G) Percentage of retrograde labeling mCherry+ cells co-localized with GABA staining in the SuML. (H) Diagram of anterograde tracing. AAV5-DIO-eYFP was delivered to the SuML in Vgat-Cre mice. (I–J) Fluorescence images showed SuML projections located in the DG and CA2. Scale bar = 200 µm.
Figure 2—figure supplement 2
Locomotor activity after activity manipulation of SuMVgat neurons.
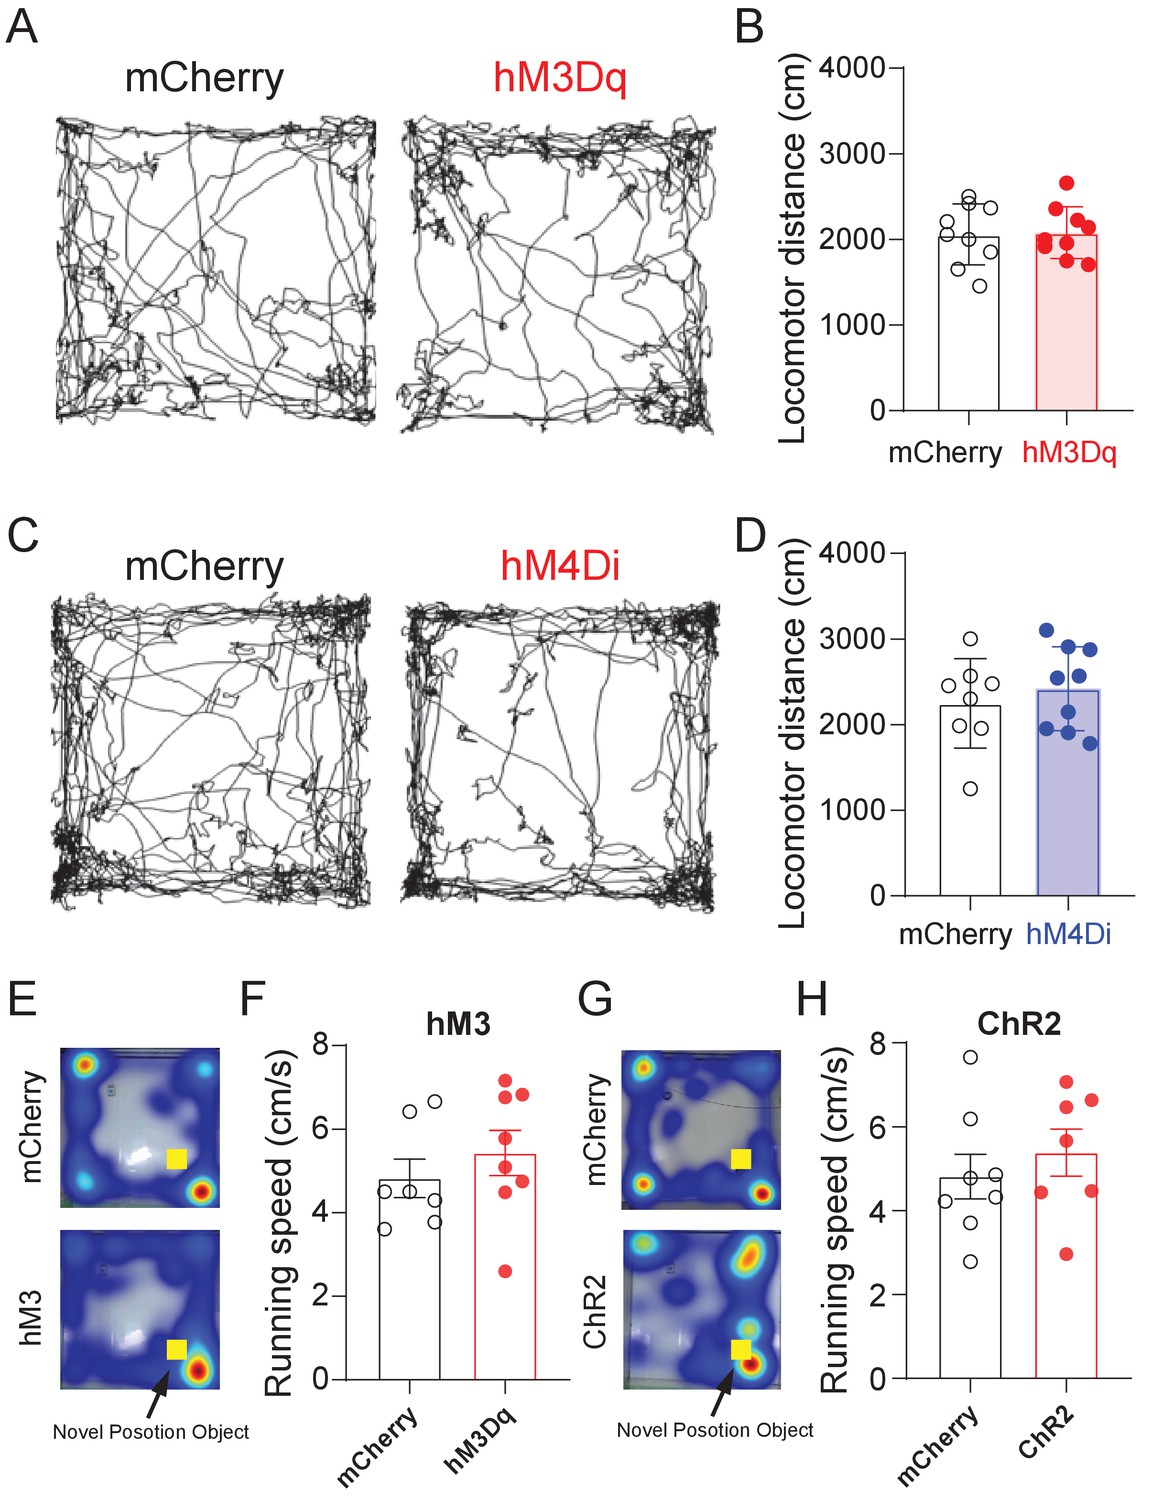
Locomotor activity in the open field (5 mins, same for both NPR and NOR tests) was recorded 1 hr after CNO administration in mice injected with AAVs expressing mCherry-, hM3Dq- or hM4Di. (A-B) Typical locomotor traces (A) of mCherry- or hM3Dq- mice after CNO injection, and locomotor activity was not changed (B), compared to mCherry control mice (unpaired t-test, t16 = 0.1325, p=0.8963). (C-D) Typical locomotor traces (C) of mCherry- or hM4Di- mice after CNO injection, showed locomotor activity was not changed (D), compared to mCherry control mice (unpaired t-test, t16 = 0.2374, p = 0.8177). (E, G) Heatmap of representative locomotor traces in the NPR test during chemogenetic activation of SuM neurons (E) or optogenetic activation of SuM-DG projections (G), respectively. (F, H) The average running speed during the NPR test during chemogenetic activation of SuM neurons (F) or optogenetic activation of SuM-DG projections (H), respectively. p > 0.05 by unpaired t-test.
Figure 2—figure supplement 3
Stimulation of SuMM neurons did not significantly increase spatial memory.
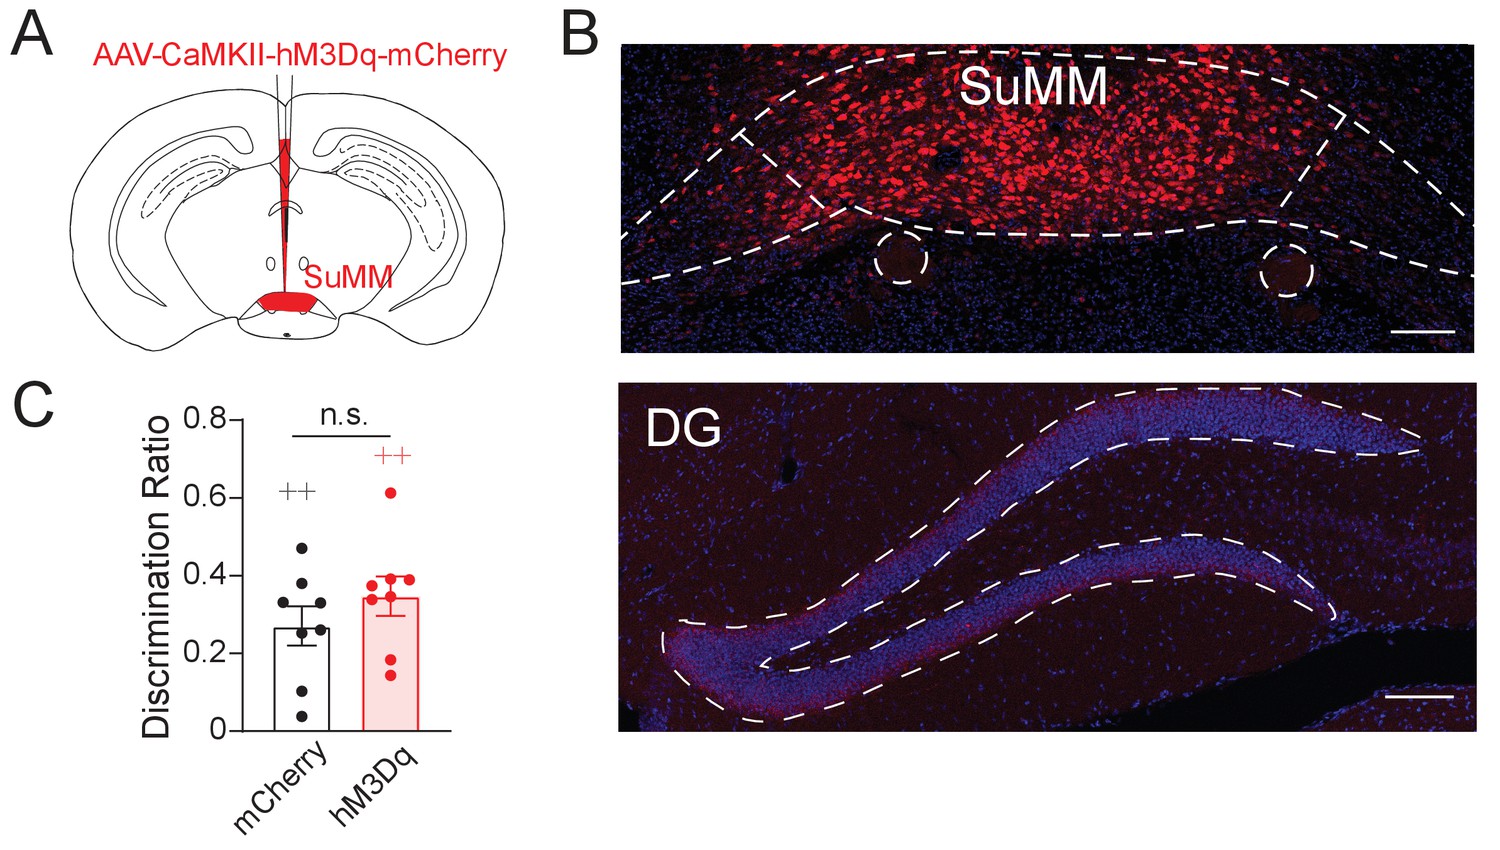
(A) Schematic diagram of the viral delivery. AAV5-CaMKII-mCherry (150 nL) was injected to the SuMM. (B) The representative image showing mCherry expression preferentially in the SuMM. (C) Chemogenetic activation of SuMM neurons did not significantly alter the discrimination ratio in the NPR test.
Figure 3 with 2 supplements
Activity of SuMVgat-DG projections is required for spatial memory retrieval.
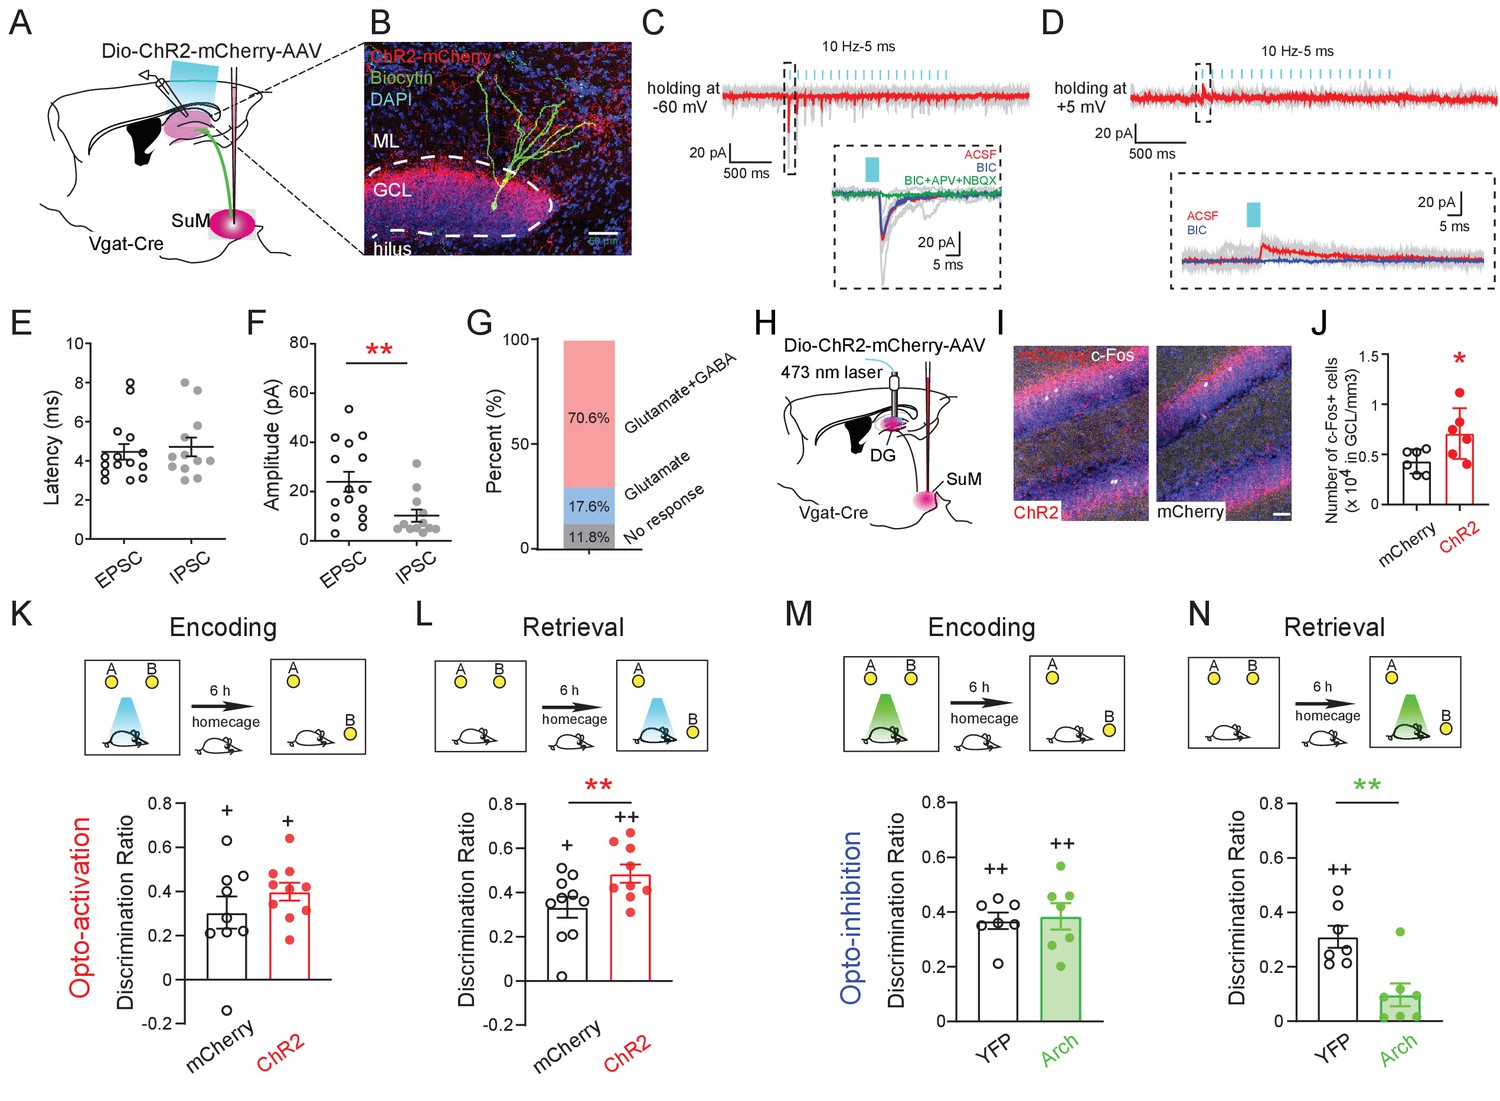
(A) Schematic diagram of the experimental design. Cre-dependent ChR2-mCherry was injected in the SuM of Vgat-Cre mice. Terminals of the infected SuM GABAergic neurons were photo-stimulated, and responses were recorded in DG GCs. (B) Representative image of a connected biocytin-filled DG GC (green) showing the typical morphology of GCs that was located in the dense ChR2-mCherry positive fibers (red). Scale bar: 50 μm. ML: molecular layer. GCL: granule cell layer. (C–D) Representative traces showing light-evoked EPSCs (C, Vh = −60 mV, near the reversal potential of IPSCs to isolate EPSCs) and light-evoked IPSCs (D, Vh = +5 mV, near the reversal potential of EPSCs to isolate IPSCs) from a DG GC. When clamping neurons at −60 mV, the inward current was predominantly glutamatergic (blocked by APV+NBQX). In contrast, when holding at +5 mV, the outward current was primarily GABAergic (blocked by BIC). (E–F) Quantification of the latency (E) and amplitude (F) of light-evoked EPSCs and IPSCs recorded from GCs. The mean latency was less than 5 ms in EPSCs and IPSCs indicating that SuM neurons directly connected to GCs. (G) Bar chart showing connectivity rate of GCs for optogenetic stimulation of the SuMVgat-DG projections. (H) Experimental scheme of in vivo optogenetics. (I) Sample images of c-Fos expression in the DG after1 h opto-activation of SuMVgat-DG projections in Vgat-Cre mice. (J) Quantification of c-Fos in DG granule cell layers. Photo-stimulation of the SuMVgat-DG projections increased c-Fos expression in GCs. (Unpaired t-test, t10 = 2.440, *p = 0.045). (K) Opto-activation (10 Hz/5 ms duration, 473 nm blue light for 5 min) of the SuMVgat-DG projection during the encoding phase did not affect the discrimination ratio in the NPR test. (Unpaired t-test, t17 = 0.2867, p = 0.7778). (L) Opto-activation of the SuMVgat-DG projections during retrieval phase increased the discrimination ratio in the NPR test (Unpaired t-test, t17 = 4.974, **p = 0.0001). (M) Opto-inhibition (561 nm green light was continuously given for 5 min) of the SuMVgat-DG projections during the encoding phase did not affect the discrimination ratio in the NPR test. (Unpaired t-test, t14 = 0.2829, p = 0.7851). (N) Opto-inhibition of the SuMVgat-DG projections during retrieval phase decreased the discrimination ratio in the NPR test (Unpaired t-test, t14 = 3.657, **p = 0.0033).
Figure 3—figure supplement 1

Functional expression of Arch in SuMVgat neurons.
(A) Left, schematic diagram of optogenetic inhibition of SuMVgat neurons in the acute brain slices; Right, Live differential interference contrast (DIC) and the fluorescence image from whole-cell electrophysiology recording showing an Arch positive cell with the microelectrode above the membrane surface in the SuM. Scale bar, 5 µm. (B) Representative images showing Arch-EYFP projections in the DG (left) and SuM (right) of a Vgat-Cre mouse. Note that dashed lines showed the fiber track above the DG used for in vivo optogenetic inhibition. (C) Sample trace under voltage-clamp mode showing that a 5 s green light application induced a robust outward current in a SuM EYFP+ cell. (D) Quantification of the magnitude of outward currents in Arch-expressing SuM Vgat+ neurons following optogenetic inhibition (n = 8 cells from two mice). (E) Sample trace under the current-clamp mode showing that a 5 s green light application induced a hyperpolarization in a SuM EYFP+ cell. (F) Quantification of the magnitude of hyperpolarization in Arch-expressing SuM Vgat+ neurons upon optogenetic inhibition (n = 6 cells from two mice). Data represent mean ± SEM.
Figure 3—figure supplement 2
Optogenetic activation of SuMVgat-CA2 projections did not change the discrimination ratio in the NPR test.
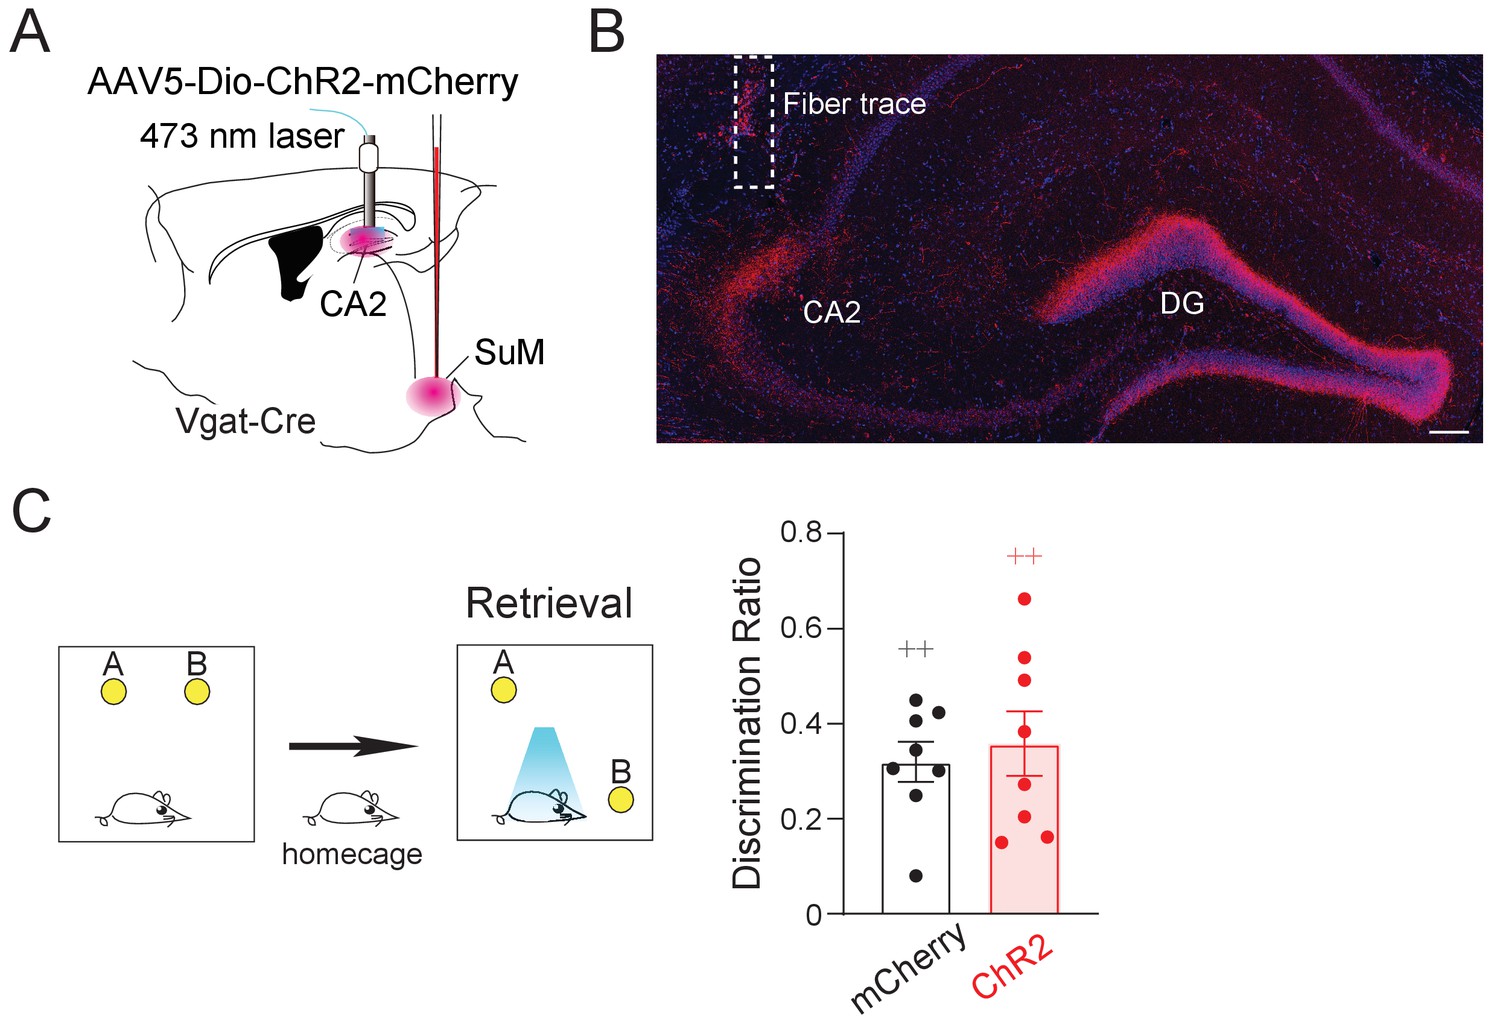
(A) Diagram of optogenetic activation of SuMVgat-CA2 projections. AAV5-DIO-ChR2-mCherry was injected into the SuML and bilateral fibers were implanted above the CA2 in Vgat-Cre mice. (B) Coronal sections showing the optic fiber track and mCherry terminals in the DG and CA2. Scale bar = 100 µm. (C) Optogenetic activation of SuMVgat-CA2 projections did not alter the discrimination ratio in the NPR test. (n = 8 mice in each group, p>0.05 by unpaired t-test).
Figure 4 with 1 supplement
SuM glutamate transmission modulates dentate granule cell activity.
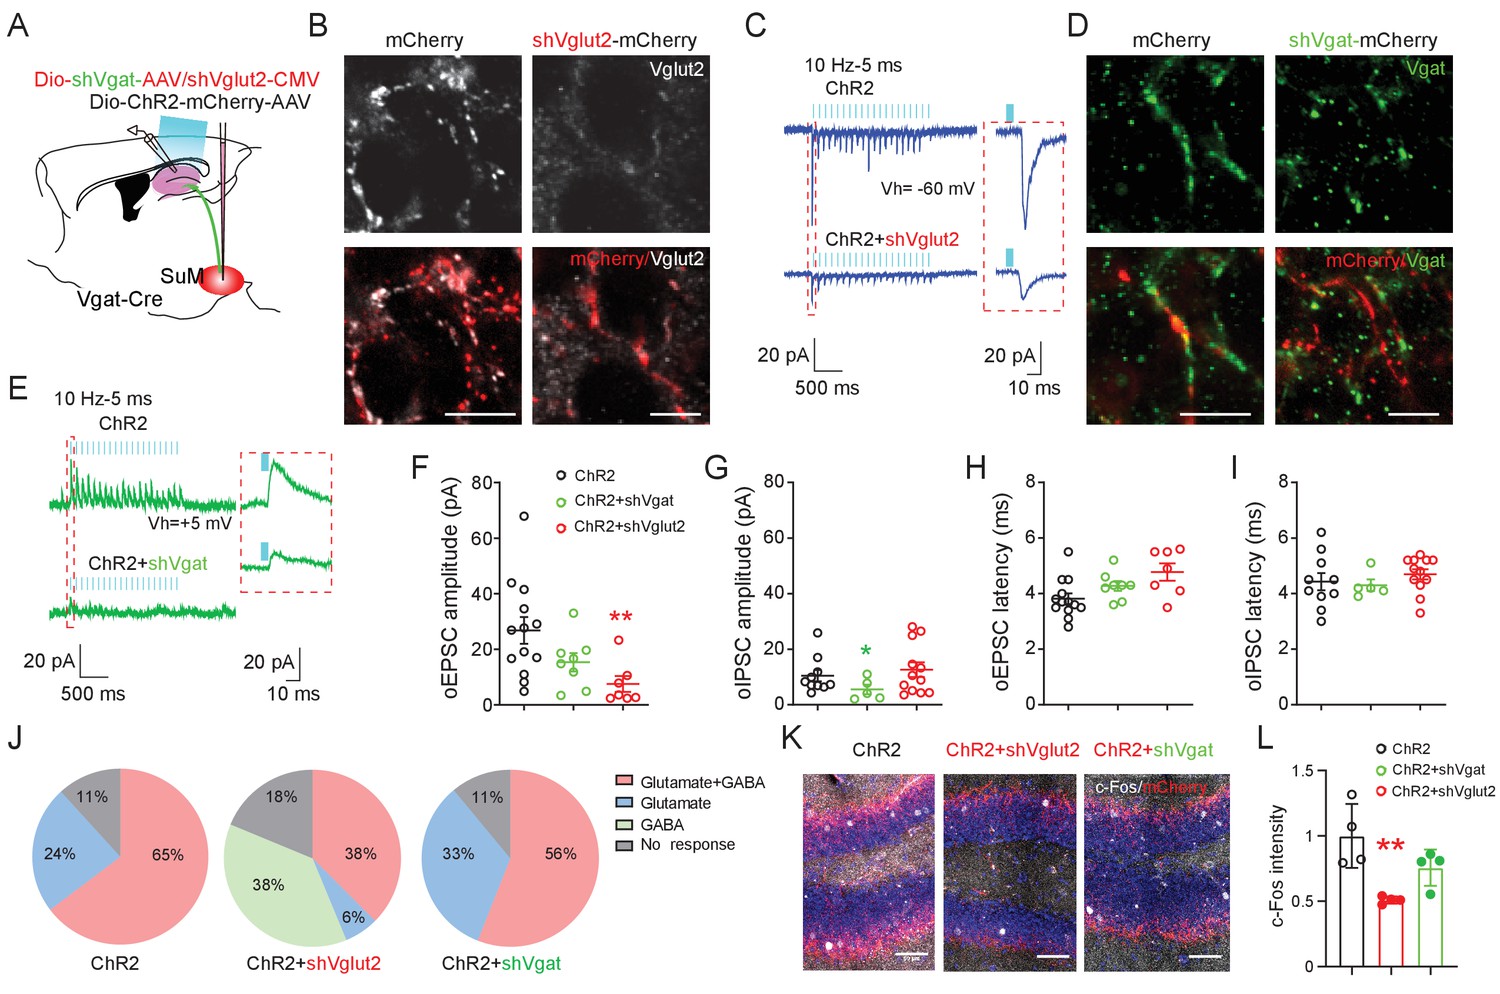
(A) Schematic diagram of the experimental design. Cre-dependent AAV-ChR2-mCherry mixed with AAV-shVgat or AAV-shVglut2 was injected in the SuM of Vgat-Cre mice. Terminals of the infected SuM GABAergic neurons were photo-stimulated, and responses were recorded in DG GCs. (B–E) Immunohistology and electrophysiology data showing the efficiency of genetic Vglut2 or Vgat knockdown. With DIO-ChR2-mCherry/CMV-shVglut2 (B) or DIO-ChR2-mCherry/DIO-shVgat (D) expressed in SuMVgat neurons, Vgat (B) or Vglut2 (D) expression was virtually absent in DG mCherry+ terminals emanating from SuMVgat neurons. Scale bars = 10 µm. Representative traces of optical-evoked EPSCs (oEPSC) at a holding potential of −60 mV (C, blue traces), and optical-evoked IPSCs (oIPSC) at a holding potential of +5 mV (E, green traces) recorded from a ChR2+shVglut2 and a ChR2+shVgat mouse, respectively. (F–G) Amplitude of oEPSC (F) and oIPSC (G) in GCs in control, shVgat, and shVglut2 mice. The mean amplitude of oEPSC and oIPSC was decreased in ChR2+shVglut2 and ChR2+shVgat mice, respectively. Data are presented as mean ± SEM. *p < 0.05, **p < 0.01. One-way ANOVA followed by PLSD post hoc test. (H–I) Latency of oEPSC (H) and oIPSC (I) in GCs in control, shVgat, and shVglut2 mice. Knocking down Vglut2 or Vgat did not affect latencies of oEPSC and oIPSC in GCs. (J) Pie charts showing the proportion of GCs exhibiting both oEPSC and oIPSC, oEPSC only, or oIPSC only in control, shVgat, and shVglut2 mice. (K–L) C-Fos expression in the DG following light stimulation from ChR2, ChR2+shVglut2 and ChR2+shVgat mice. **p < 0.01. One-way ANOVA followed by PLSD post hoc test.
Figure 4—figure supplement 1
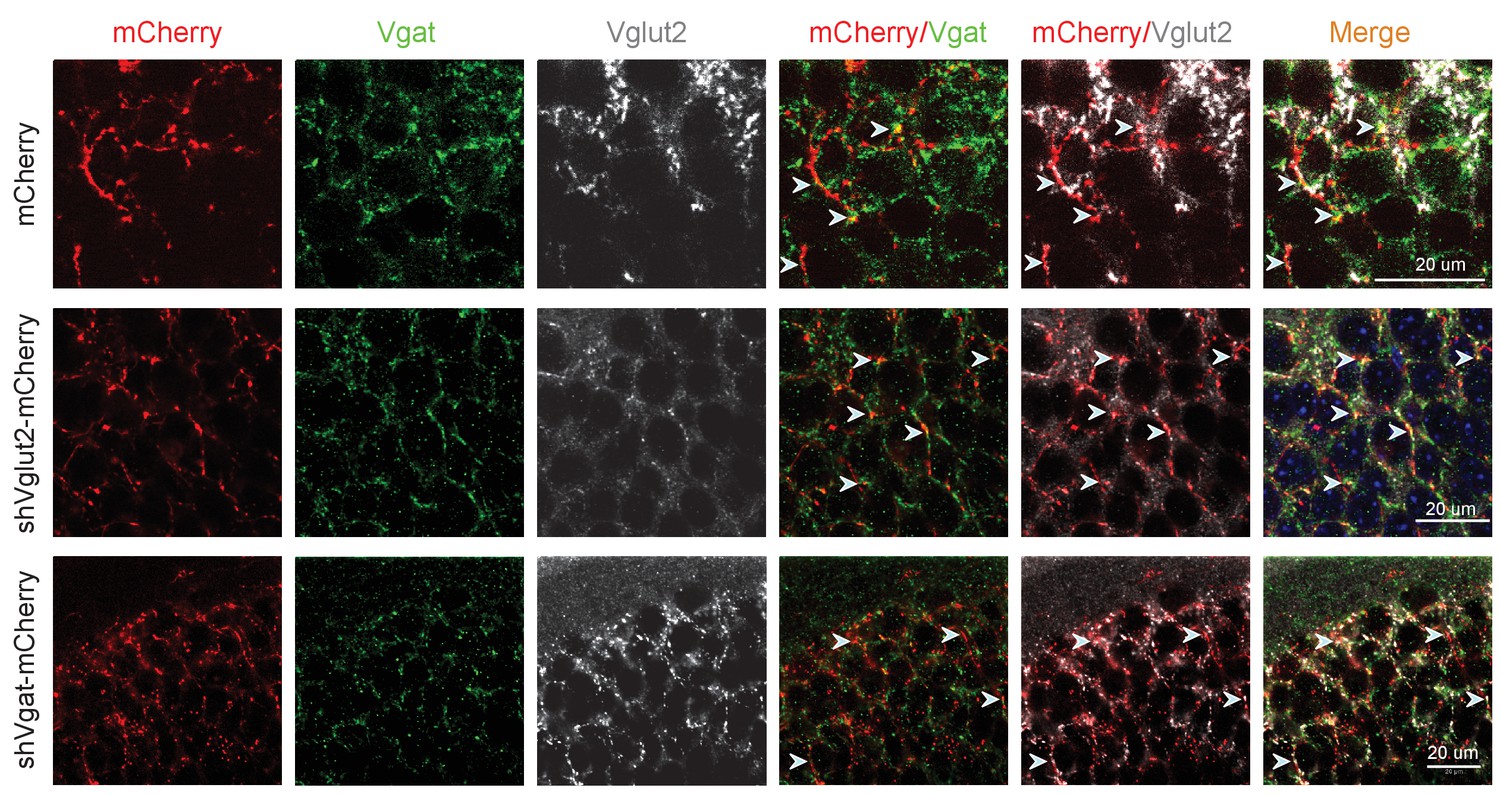
Genetic knockdown of Vgat and Vglut2 in SuMVgat neurons.
Immunohistochemical staining of Vgat or Vglut2 in DG synaptic terminals emanating from SuMVgat neurons. After shVgat and shVglut2 expression in the SuM, Vgat and Vglut2 expression from SuMVgat-DG projections was virtually absent in DG mCherry+ terminals (white arrow heads). Scale bar = 20 µm.
Figure 5
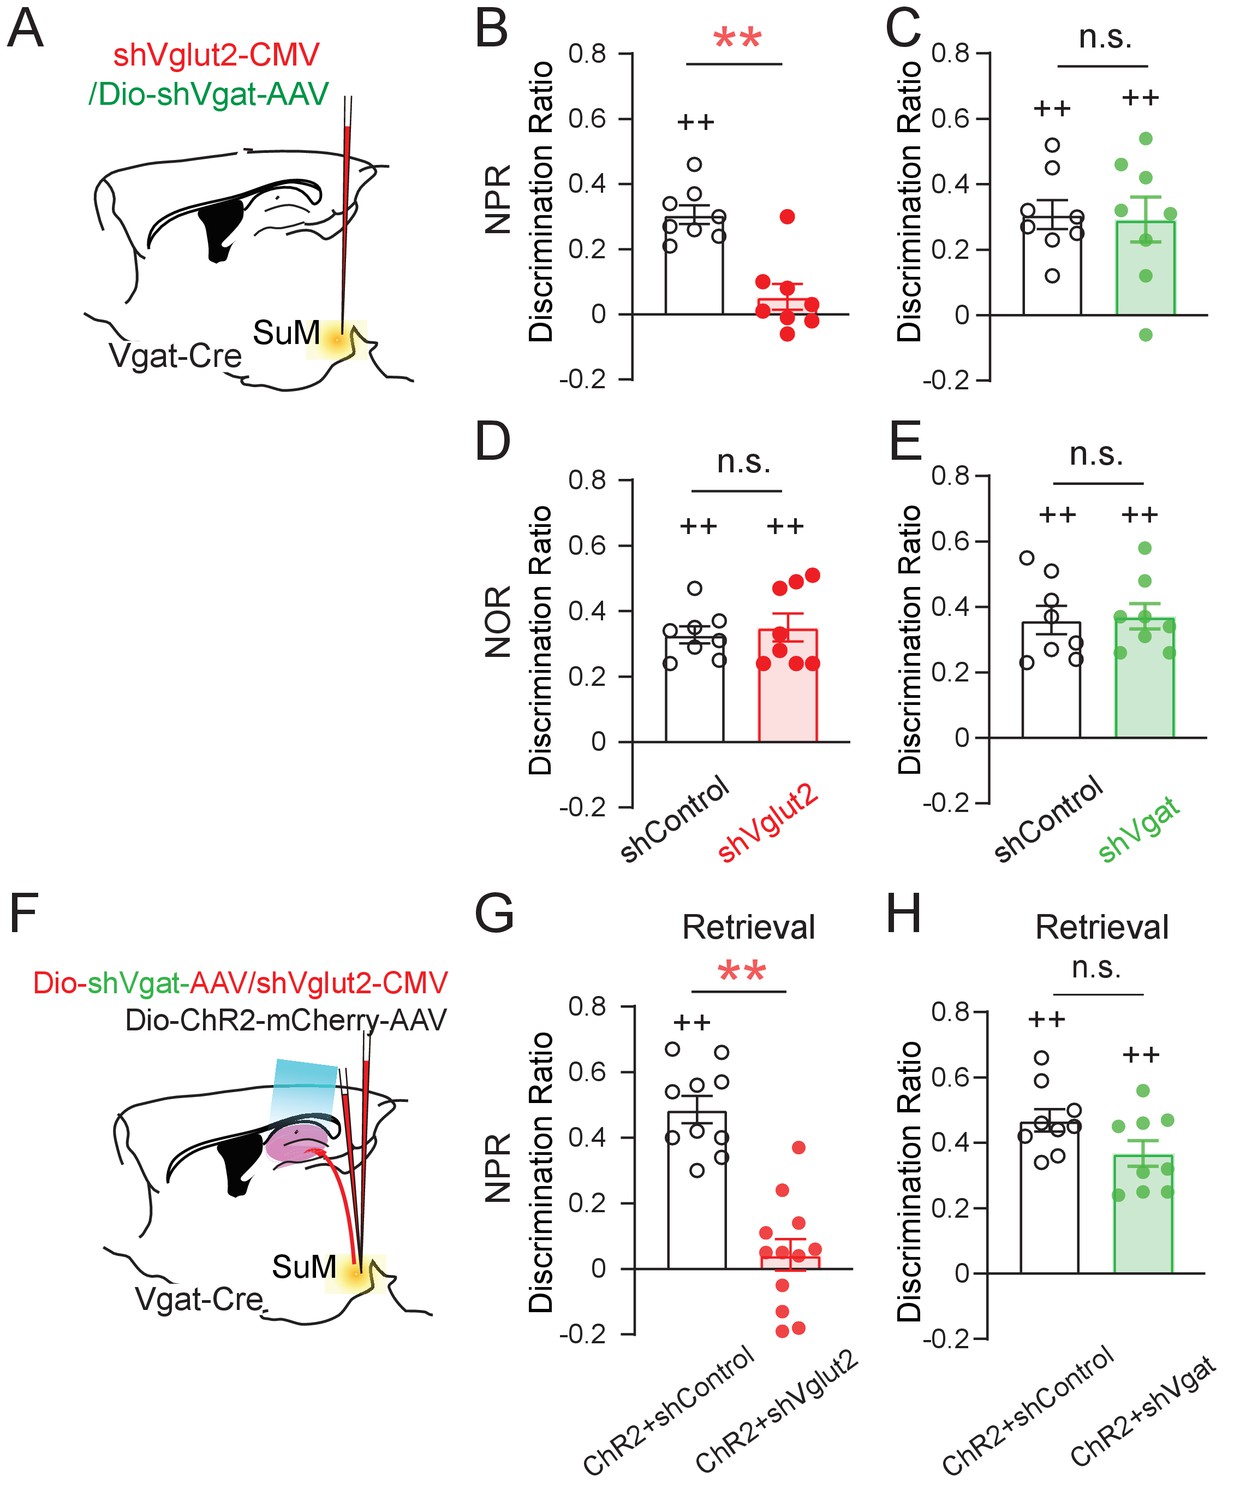
SuM glutamate transmission is necessary for spatial memory retrieval.
(A) Schematic diagram of genetic knockdown of Vgat or Vglut2 in SuM neurons. (B–C) Knocking down Vglut2 (B) but not Vgat (C) decreased discrimination ratio in the NPR test. (B, unpaired t-test, t14 = 3.662, **p = 0.0028; C, unpaired t-test, t14 = 0.000, p > 0.05). (D–E) Knocking down Vgat (D) or Vglut2 (E) did not alter the discrimination ratio in the NOR test, as compared to the control mice (D, n = 8 mice, unpaired t-test, t14 = 0.3378, p > 0.05; E, n = 8 mice, unpaired t-test, t14 = 0.066, p > 0.05). (F) Diagram of the experimental paradigm with the combination of in vivo optogenetic activation of SuM-DG projections and genetic knockdown of Vgat or Vglut2. (G–H) Knocking down Vglut2 (G), but not Vgat (H) impaired spatial memory retrieval upon optogenetic activation of SuM-DG projections (G, unpaired t-test, t20 = 3.888, **p = 0.0009; H, unpaired t-test, t16 = 1.935, p = 0.8327), as compared to the control mice injected with AAVs expressing shControl.
Figure 6
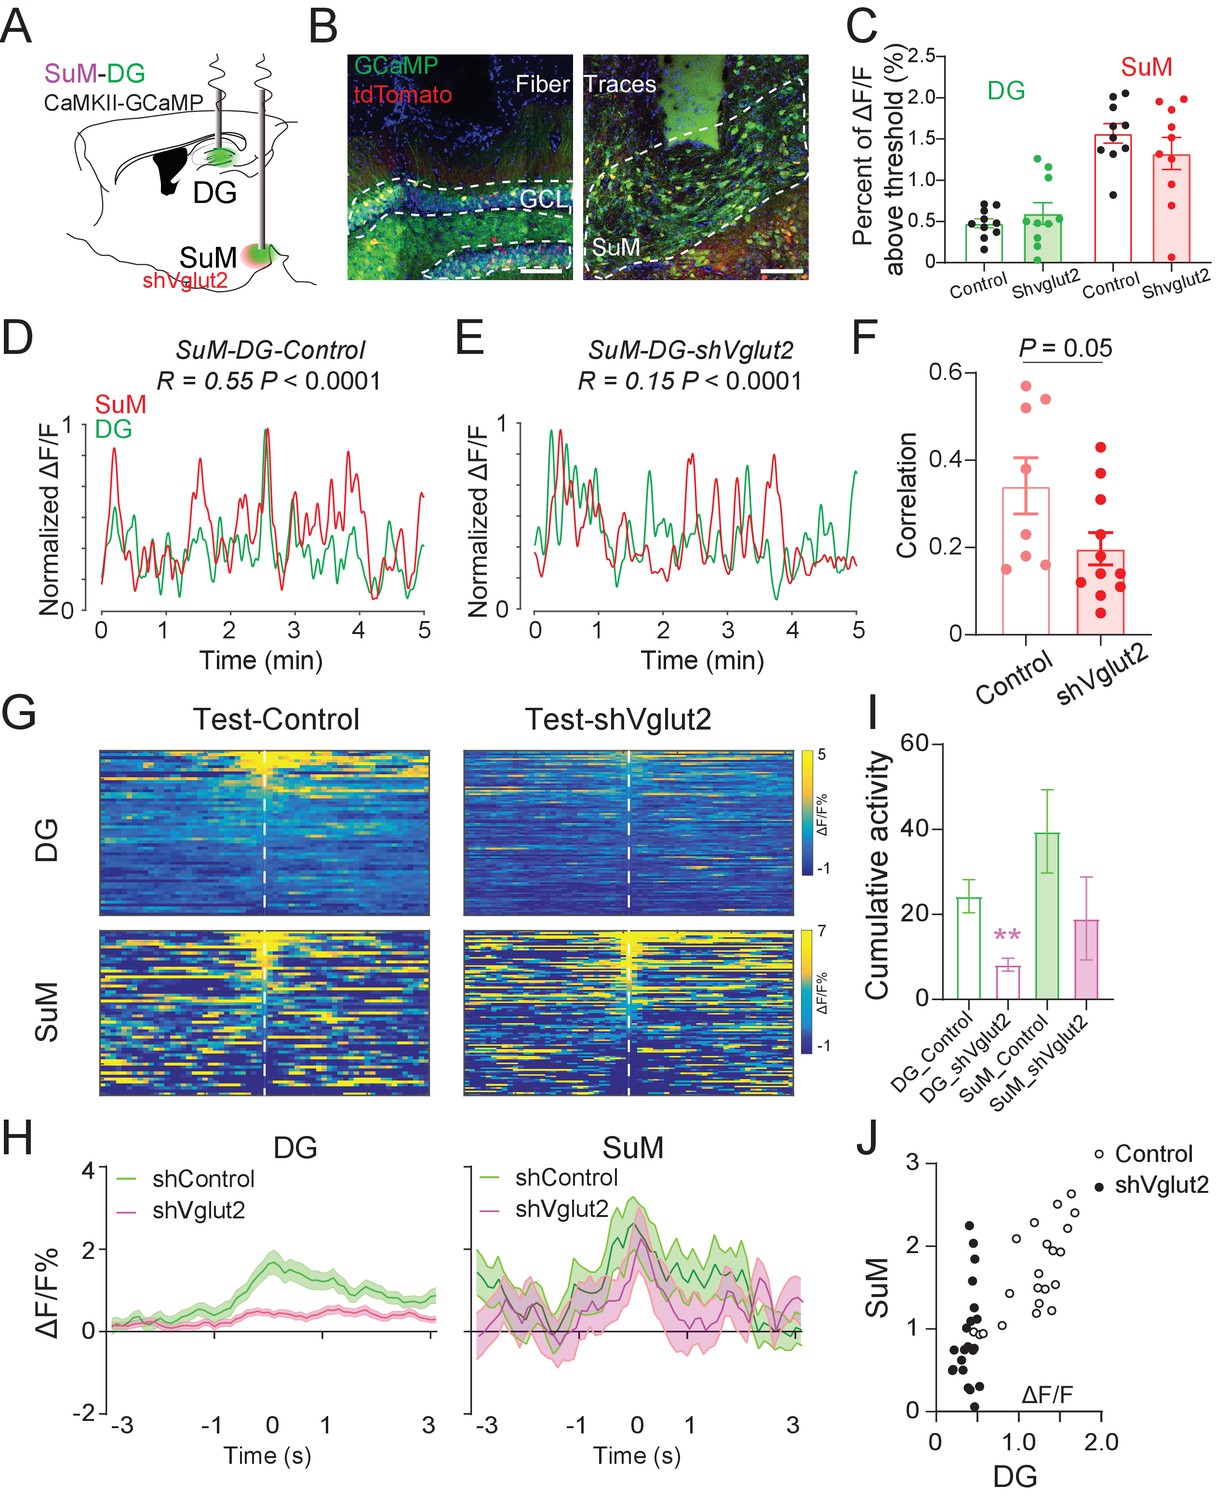
SuM glutamate transmission is necessary for regulating DG activity and establishing high SuM-DG synchrony during spatial memory retrieval.
(A) Experimental diagram of the DG and SuM Ca2+ recording under expressing shVglut2 in the SuM. (B) Coronal sections showing fiber photometry traces and CaMKII-GCaMP/tdTomato expressed neurons in the DG (left) and SuML (right). Scale bar = 100 µm. (C) Ca2+ activity of the DG and SuM at home cage was not changed in shVglut2 mice. (D–E) Sample of GCaMP6f traces of the DG and SuM at home cage in control (D) and shVglut2 mice (E). (F) Correlation of the SuM and DG Ca2+ activity at home cage. n = 8–11 mice, p = 0.05 by unpaired t-test after Fisher transform. (G) Scaled color plot of the DG and SuM Ca2+ activity from control and shVglut2 mice in the NPR test period, respectively. (H) Averaged DG and SuM Ca2+ activities in the NPR test period. Semi-transparent borders indicate ± SEM. During the exploring period, Ca2+ activities of both the DG and SuM were increased in control mice, but only the SuM Ca2+ activity was increased in shVglut2 mice. (I) Cumulative activities of the DG and SuM in the NPR test period. The Ca2+ activity in the DG, but not the SuM, was decreased in shVglut2 mice. Unpaired t-test, **p < 0.01. (J) Correlation of the SuM and DG Ca2+ activity in the NPR test period. R = 0.7391, p < 0.0001 in control mice; R = 0.2713, p = 0.2341 in shVglut2 mice.
Figure 7
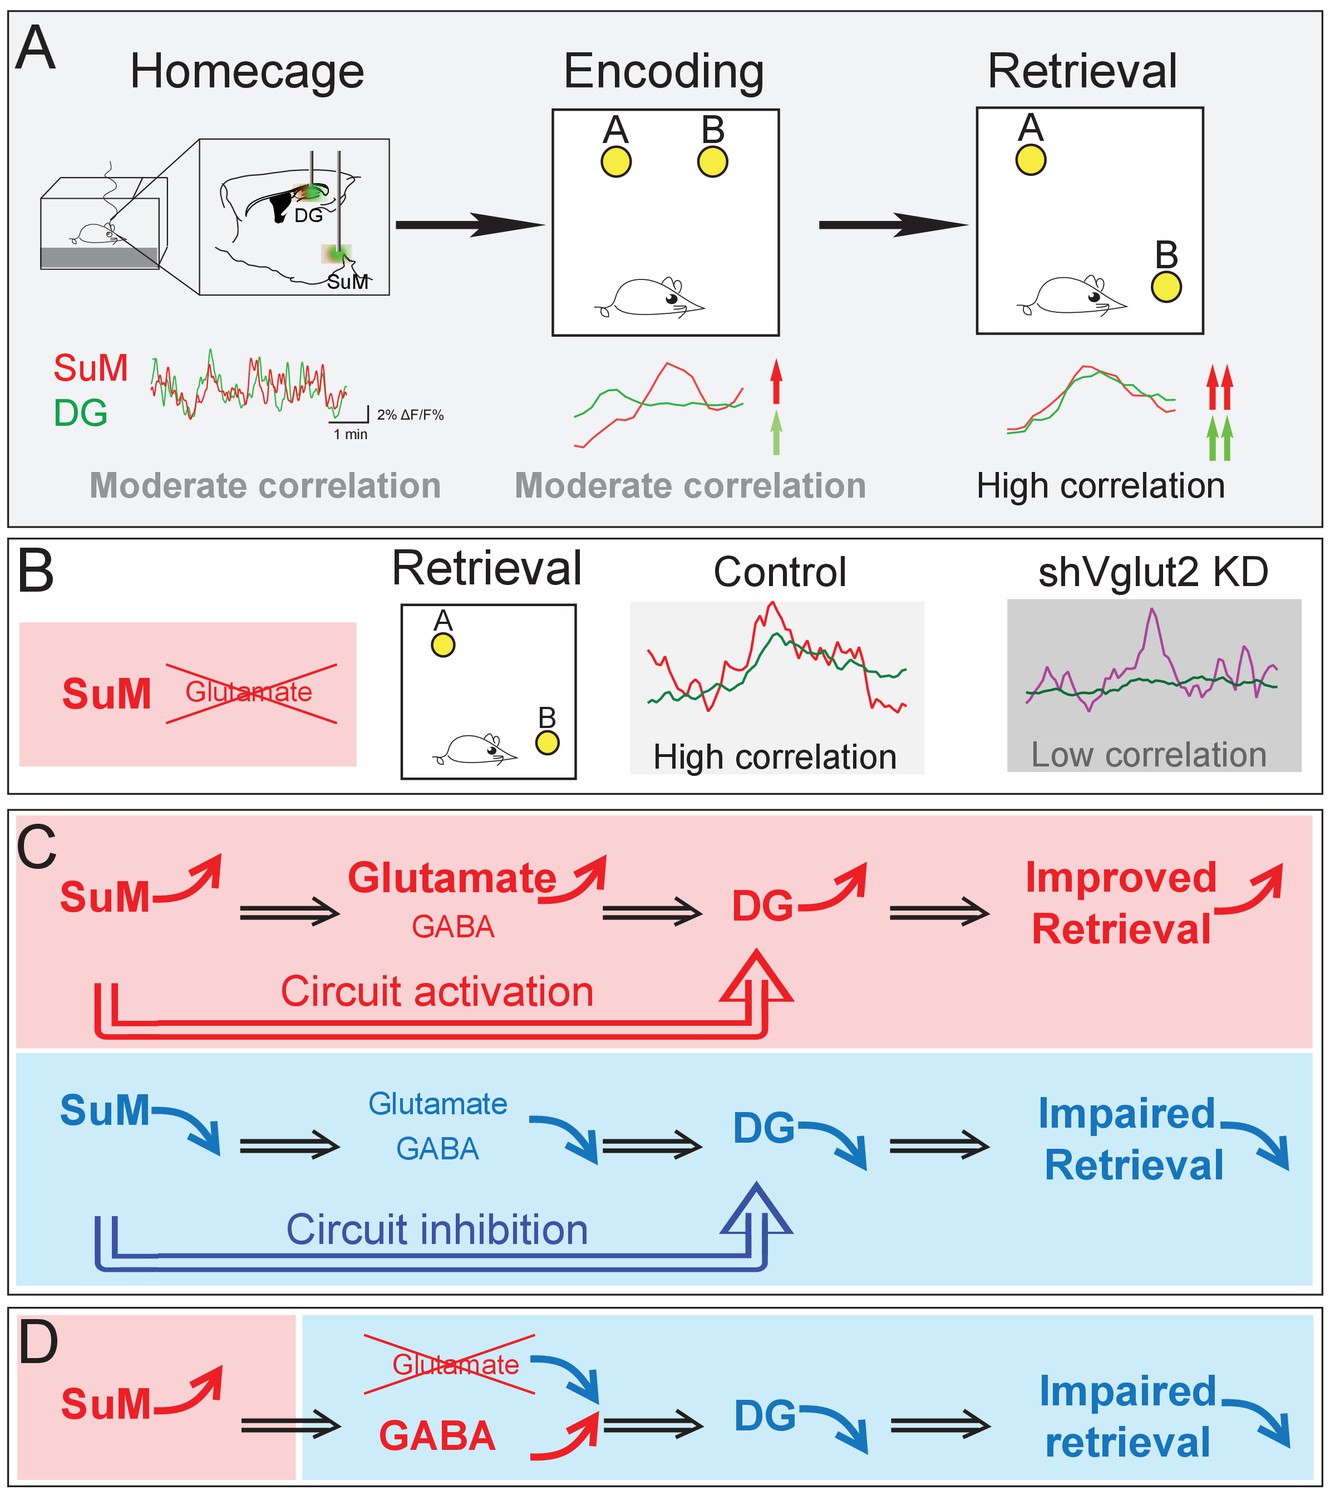
Summary model of a long-range SuM-DG circuit linking two highly correlated subcortical regions to regulate spatial memory retrieval through SuM glutamate tranmission.
(A) Correlation of the SuM and DG Ca2+ activity is increased during spatial memory retrieval. (B) SuM glutamate transmission is necessary for the high correlation of the SuM and DG activities. (C) The activity of SuM neurons or SuM-DG projections is required for regulating spatial memory retrieval. (D) SuM glutamate transmission is necessary for spatial memory retrieval.
Author response image 1
The time lag between the SuM and DG calcium activities.
(A) Scaled color plot of the SuM and DG calcium activity. (B) Averaged DG and SuM calcium activities. (C) Cross correlation of the DG and SuM calcium activities during the exploring phase (2 s). The highest correlation appeared at -0.5 and -0.6 s during familiarization, indicating that there is a 0.5-0.6 s time lag between the DG and SuM calcium activities in memory encoding. In contrast, during spatial memory retrieval, the highest correlation appeared at 0 s, indicating no time lag between the DG and SuM calcium activities in memory retrieval.
Tables
Key resources table
| Reagent type (species) or resource | Designation | Source or reference | Identifiers | Additional information |
|---|---|---|---|---|
| Strain, strain background (Mus musculus, C57BL6/J) | Slc32a1tm2(cre)Lowl/J, (Bl6) | Jackson laboratory | JAX: 016962 | All sexes used |
| Strain, strain background (Mus musculus, C57BL6/J) | Mouse: C57BL/6J | Jackson laboratory | RRID: IMSR_JAX:000664 | All sexes used |
| Strain, strain background (adeno-associated virus) | AAV5-EF1α-FLEX-TVA-mCherry | Massachusetts Institute of Technology | Dr. Ian R. Wickersham | |
| Strain, strain background (adeno-associated virus) | AAV-CA-FLEX-RG | Massachusetts Institute of Technology | Dr. Ian R. Wickersham | |
| Strain, strain background (rabies virus) | RABV-SAD∆G-mCherry | Massachusetts Institute of Technology | Dr. Ian R. Wickersham | |
| Strain, strain background (adeno-associated virus) | AAV5-EF1α-DIO-eYFP | UNC Vector Core | ||
| Strain, strain background (adeno-associated virus) | AAV5-EF1α-DIO-mCherry | UNC Vector Core | ||
| Strain, strain background (adeno-associated virus) | AAV5-EF1a-DIO-hChR2(H134R)-mCherry | UNC Vector Core | ||
| Strain, strain background (adeno-associated virus) | AAV5-EF1a-DIO-Arch 3.0-eYFP | UNC Vector Core | ||
| Strain, strain background (adeno-associated virus) | AAV5-hSyn-DIO-hM3Dq-mCherry | addgene | #50474-AAV5 | |
| Strain, strain background (adeno-associated virus) | AAV5-hSyn-DIO-hM4Di-mCherry | addgene | #50475-AAV5 | |
| Strain, strain background (adeno-associated virus) | AAV5-CaMKII-GCaMP6f | UNC Vector Core | ||
| Strain, strain background (adeno-associated virus) | AAV2-CaMKII-tdTomato | UNC Vector Core | ||
| Strain, strain background (adeno-associated virus) | AAV5-CaMKII-hM3Dq-mCherry | UNC Vector Core | ||
| Strain, strain background (adeno-associated virus) | AAV8-hsyn-DIO-shVgat-mCherry | University of Tsukuba | Dr. Michael Lazarus | |
| Strain, strain background (adeno-associated virus) | CMV-shVglut2-mCherry | University of Tsukuba | Dr. Michael Lazarus | |
| Antibody | Donkey polyclonal Anti- c-Fos | Millipore | Cat# 3168266; RRID: ABE457 | 1:1 k |
| Antibody | Rabbit polyclonal Anti- GABA | Sigma | Cat# A2052-100UL | 1:1 k |
| Antibody | Goat polyclonal Anti- GPF | Rockland | Cat# 600-101-215; RRID: AB_218182 | 1:1 k |
| Antibody | Rabbit polyclonal Anti-Vgat | Synaptic Systems | Cat#131002, RR:131003/32 | 1:1 k |
| Antibody | Guinea pig Polyclonal Anti-Vglut2 | Millipore | Cat# 3101508; RRID: AB2251-I | 1:1 k |
| Chemical compound, drug | Clozapine-N-oxide (CNO) | Sigma | Cat# C0832-5MG | |
| Software, algorithm | ImageJ (Fiji) | http://fiji.sc/ | ||
| Software, algorithm | FV3000 | Olympus | ||
| Software, algorithm | Ocean view | Ocean Optics | ||
| Software, algorithm | GraphPad Prism | GraphPad Software | Prism 8 | |
| Software, algorithm | Matlab | MathWorks | R2014b | |
| Software, algorithm | EthoVision XT | Noldus |
Additional files
Download links
A two-part list of links to download the article, or parts of the article, in various formats.
Downloads (link to download the article as PDF)
Open citations (links to open the citations from this article in various online reference manager services)
Cite this article (links to download the citations from this article in formats compatible with various reference manager tools)
Supramammillary nucleus synchronizes with dentate gyrus to regulate spatial memory retrieval through glutamate release
eLife 9:e53129.
https://doi.org/10.7554/eLife.53129


