Social structure learning in human anterior insula
- Royal Holloway, University of London, United Kingdom
- Harvard University, United States
Figures
Figure 1
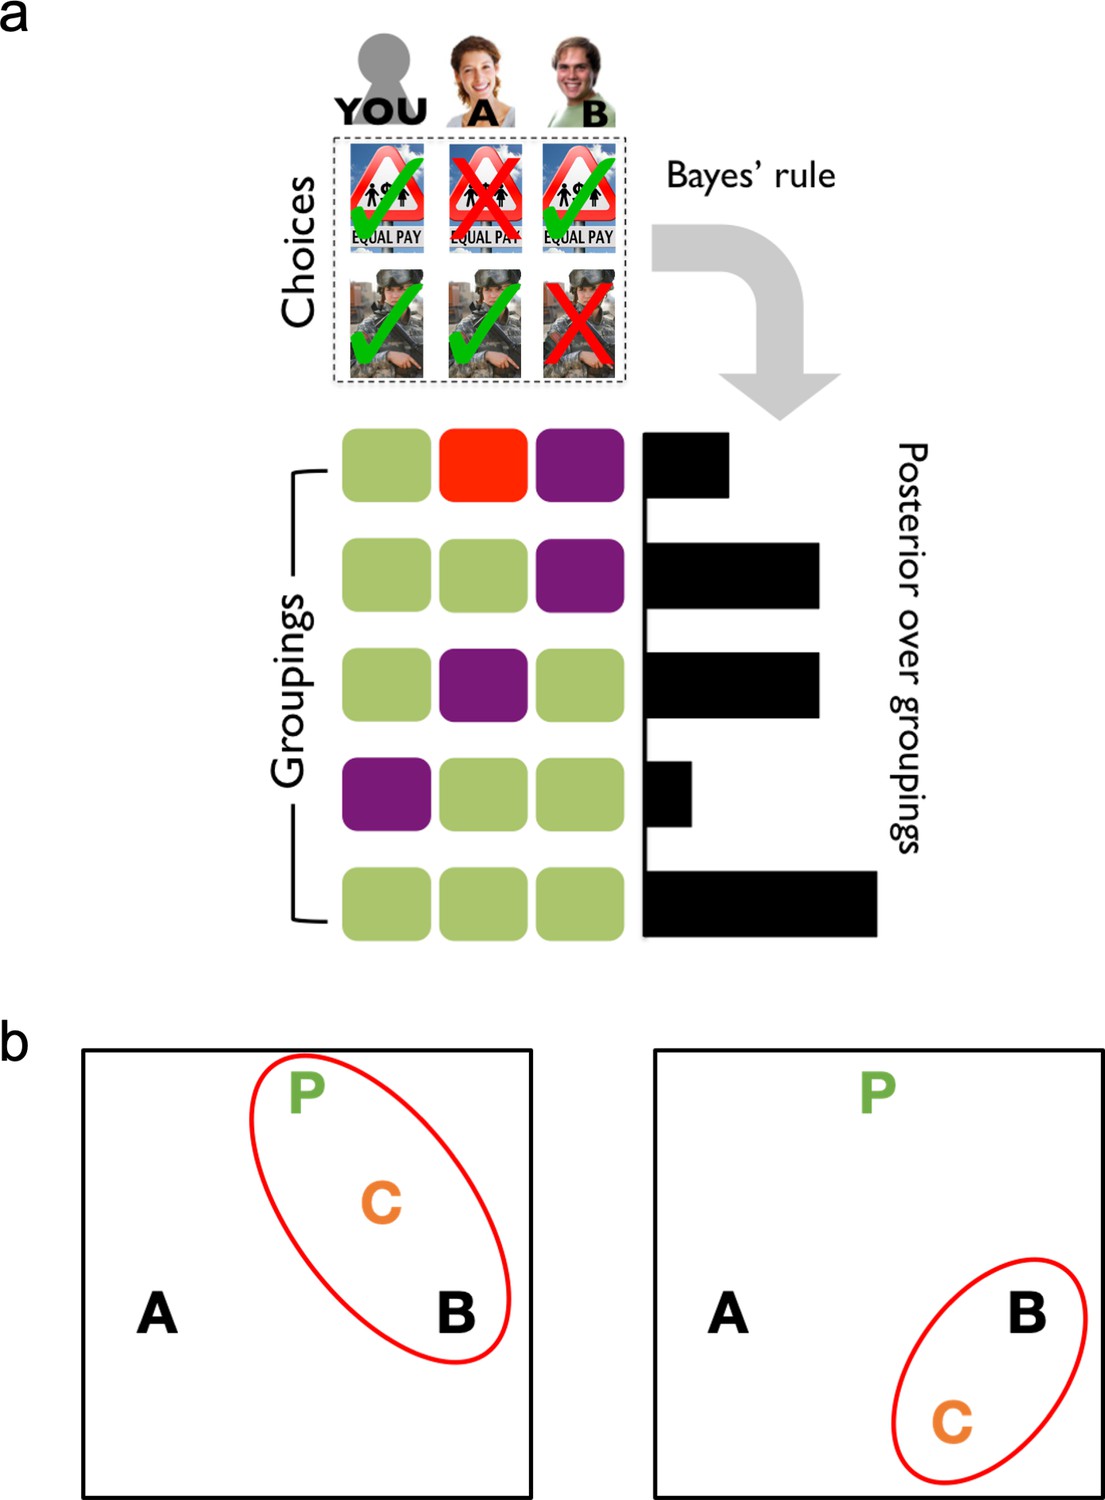
A formal account of social latent structure learning.
(A) Model schematic illustrating how choice patterns are transformed using Bayes’ rule to create a posterior over different possible latent groupings of agents. (B) Agents are represented as letters in an abstract space (P is the participant), where the distance between letters indicates the degree to which agents agree in their choices (i.e., choice overlap). Red ovals indicate the latent structures that have high posterior probability. Left: The placement of Agent C creates a cluster that includes both the participant and Agent B, which should increase estimates of Agent B as an ally. Right: The placement of Agent C excludes the participant from the cluster with Agents B and C, which should decrease estimates of Agent B as an ally.
Figure 2
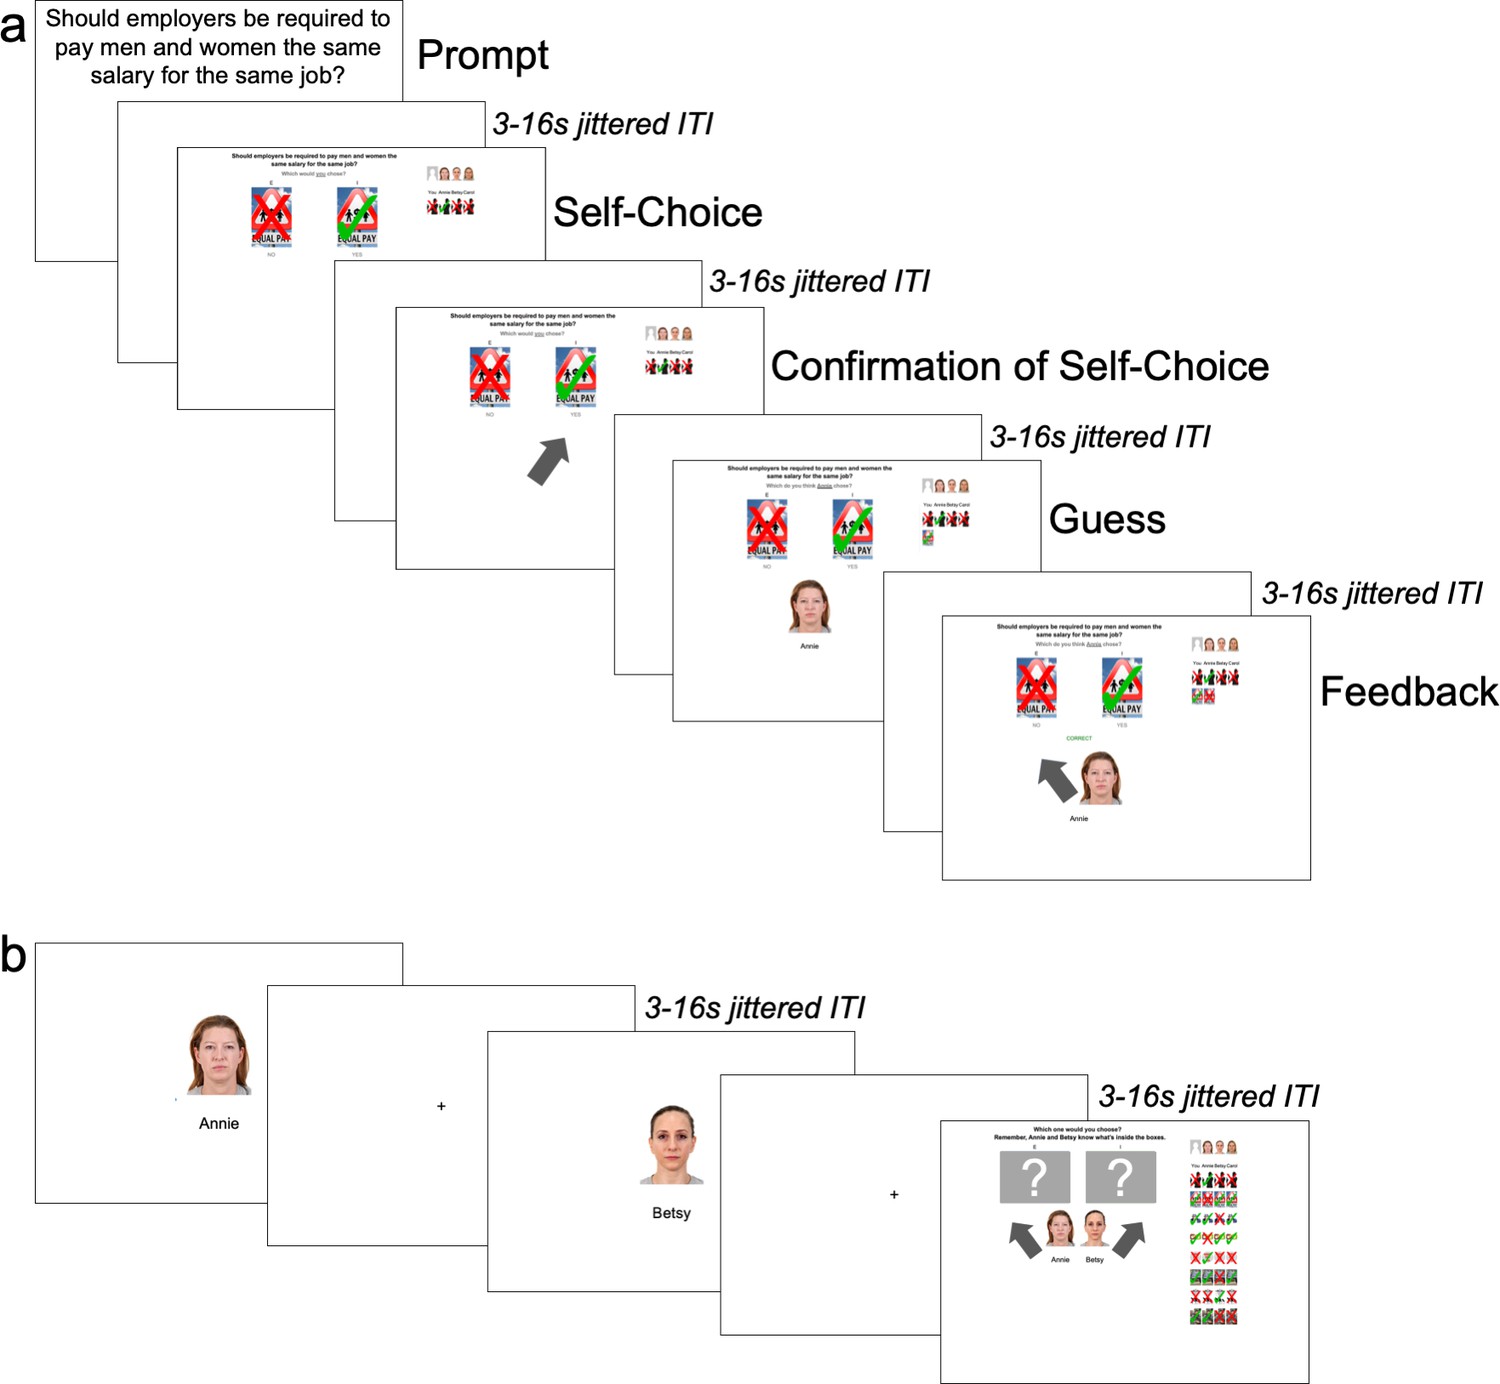
Order of events in task.
(A) Learning Trials: Participants began every trial by seeing a political issue and reporting their personal stance on it. After receiving confirmation of their choice, they then guessed and received feedback on how the first agent responded to the same political issue and repeated this for the other two agents before moving onto a new political issue. (B) Ally-choice Trial: After eight learning trials, participants saw photos of Agents A and B sequentially in a random order and chose to align with either Agent A or B on a ‘mystery’ (i.e., unknown) political issue.
Figure 3
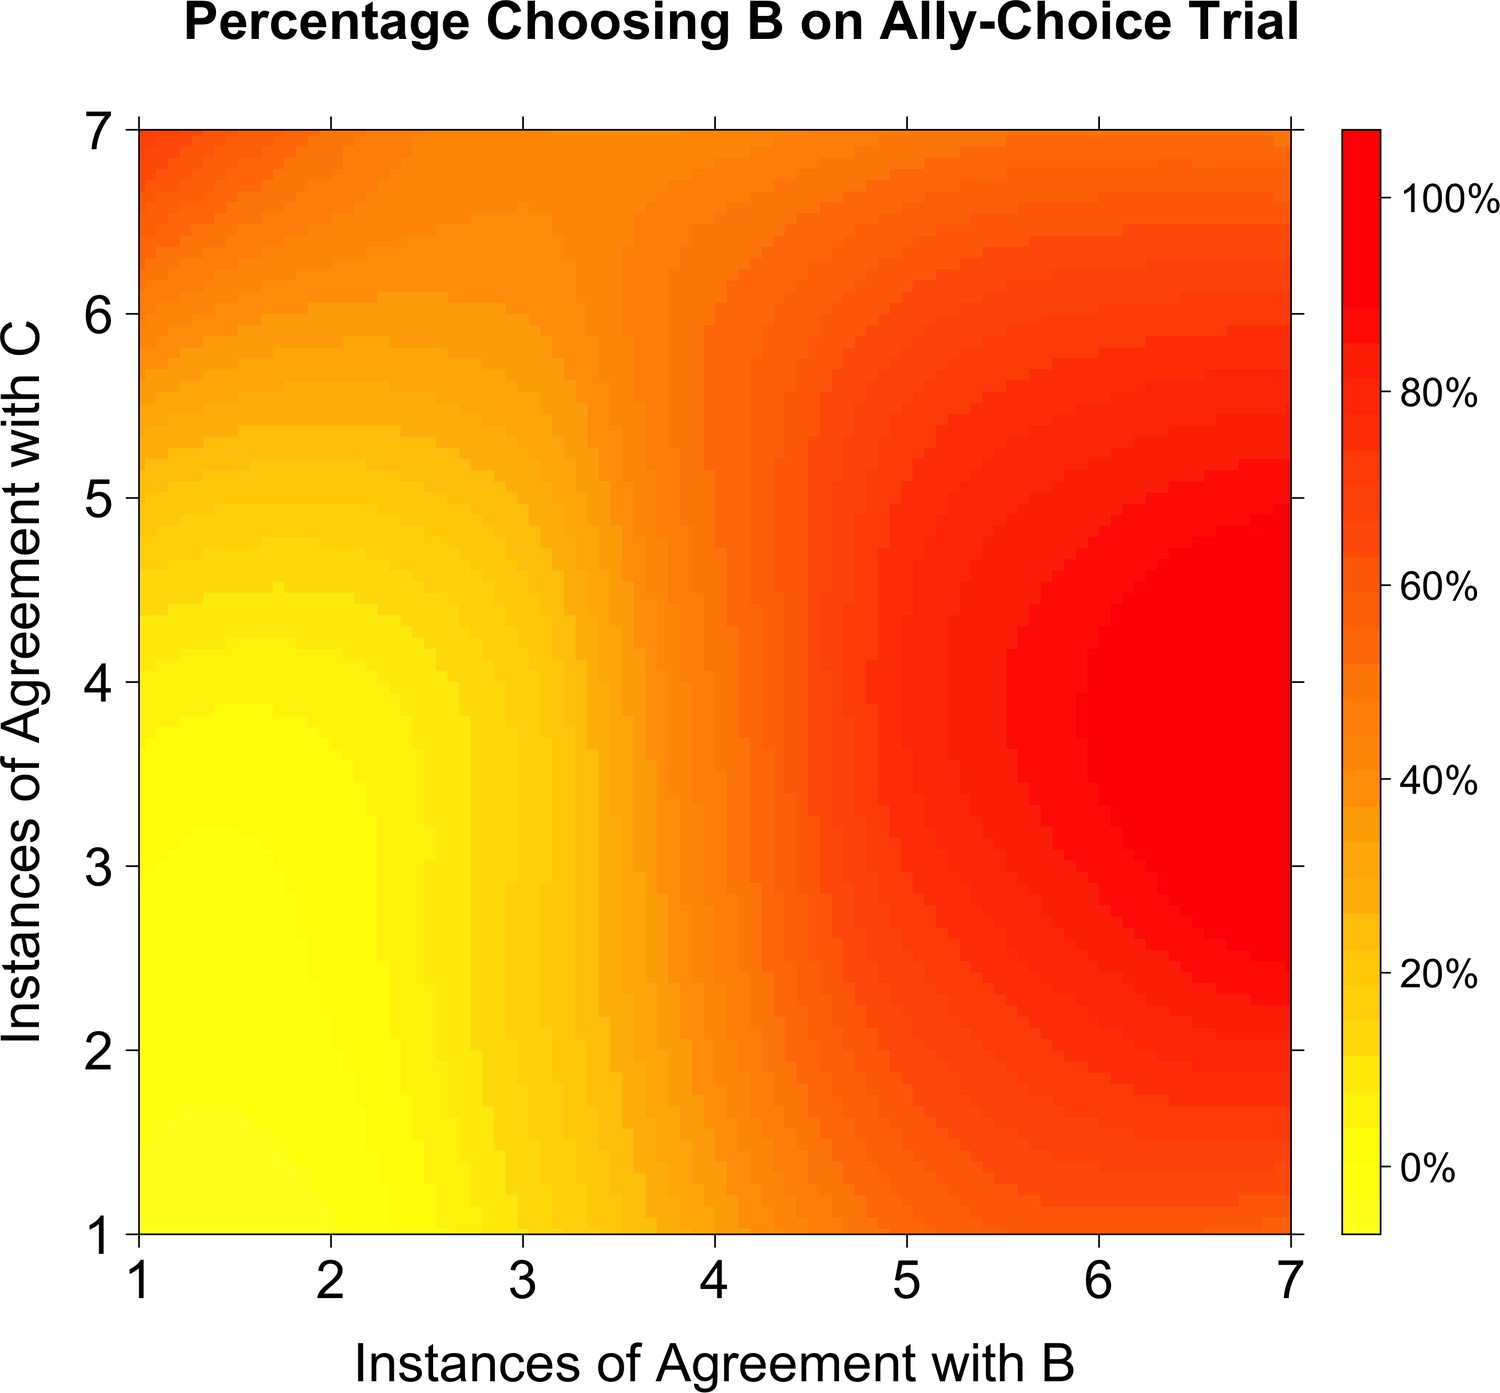
Percentage choosing Agent B as a function of agreement with Agents B and C.
A smoothed level plot illustrates that as agreement with both Agents B and C increases (towards the top-right corner), so does the probability of choosing Agent B on the ally-choice trial. If Agent B had been the only influence on whether or not participants chose Agent B on the ally-choice trial, then the transition from yellow to red should only occur in the horizontal direction (as agreement with Agent B increases). Instead, there is a radial transition from the bottom-left corner.
Figure 4 with 1 supplement
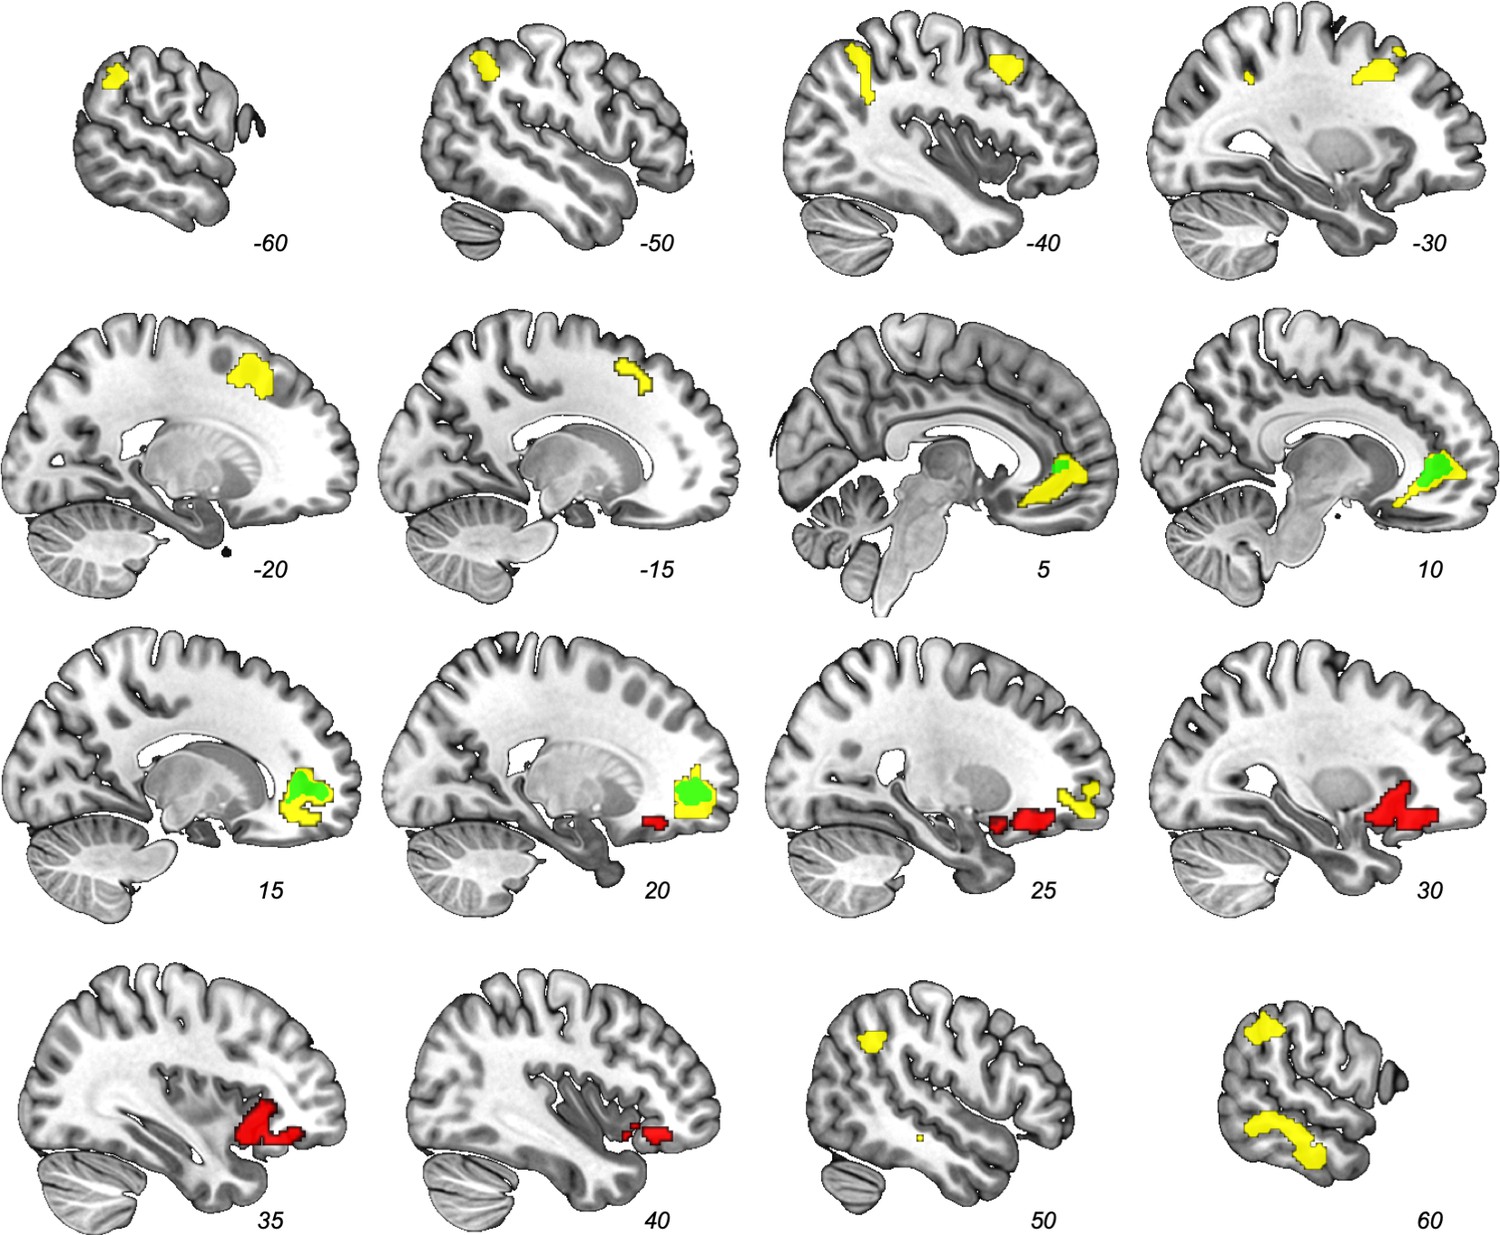
Results from whole-brain contrast (FWE-corrected p<0.05) of parametric modulators.
Dyadic similarity model (green), feature similarity model (yellow), and latent structure model (red). Note the overlap between the dyadic similarity and feature similarity models in the pgACC (e.g., at x = 10).
Figure 4—figure supplement 1
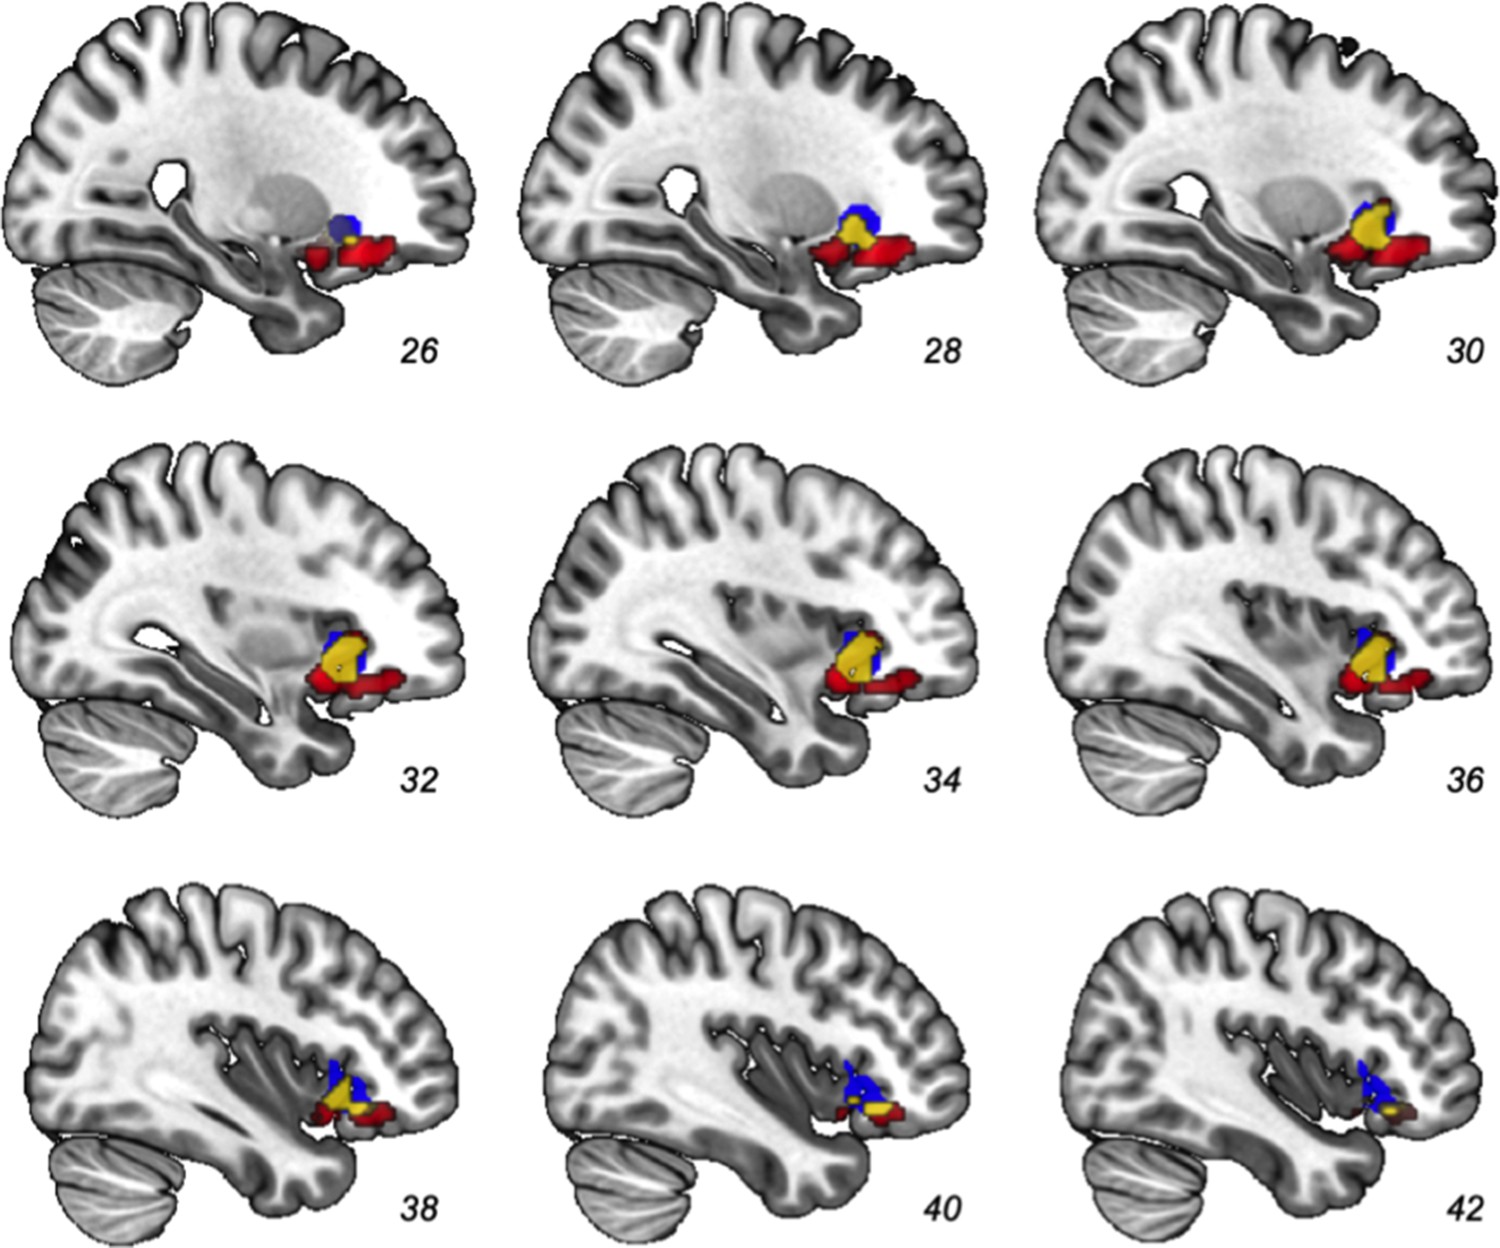
Overlap between latent structure model parametric modulator and a separately derived ROI.
Overlap (yellow) between our latent structure model result (red) and a separately derived ROI of cluster structure updating (blue; Tomov et al., 2018).
Tables
Table 1
Results from parametric modulator contrasts.
| Model | Region | Cluster size | X | Y | Z |
|---|---|---|---|---|---|
| Dyadic Similarity | Pregenual Anterior Cingulate | 327 | 18 | 48 | 0 |
| Feature Similarity | Pregenual Anterior Cingulate | 1079 | 16 | 44 | 2 |
| Left Supplementary Motor Area | 762 | −28 | 8 | 40 | |
| Right Superior Temporal Sulcus | 558 | 58 | −44 | −6 | |
| Left Temporoparietal Junction | 465 | −58 | −52 | 40 | |
| Right Temporoparietal Junction | 298 | 54 | −48 | 34 | |
| Latent Structure | Right Anterior Insula/Inferior Frontal Gyrus | 696 | 34 | 16 | −10 |
-
Cluster size reported in voxels (2 mm3). Coordinates refer to peak voxel in Montreal Neurological Institute space.
Additional files
Download links
A two-part list of links to download the article, or parts of the article, in various formats.
Downloads (link to download the article as PDF)
Open citations (links to open the citations from this article in various online reference manager services)
Cite this article (links to download the citations from this article in formats compatible with various reference manager tools)
Social structure learning in human anterior insula
eLife 9:e53162.
https://doi.org/10.7554/eLife.53162


