NHR-8 and P-glycoproteins uncouple xenobiotic resistance from longevity in chemosensory C. elegans mutants
- Max Planck Institute for Biology of Ageing, Germany
- Leonard Davis School of Gerontology, University of Southern California, Los Angeles, United States
- CECAD - Cluster of Excellence University of Cologne, Germany
- Center for Molecular Medicine Cologne (CMMC), University of Cologne, Germany
Figures
Figure 1 with 1 supplement

Tunicamycin resistance occurs in dye filling defective long-lived chemosensory C. elegans mutants.
(A) Fluorescence and differential interference contract confocal microscopy images of WT and osm-3(dh441)IV C. elegans after DiI treatment (scale bar 40 µm). (B) Depiction of the osm-3(dh441) locus. osm-3(dh441)IV has a C to T mutation at position 3796925 of exon 8. (C) Developmental tunicamycin (TM) resistance assay using the indicated concentrations with WT and osm-3(dh441)IV animals. Data are mean ± SD (n = 3 independent experiments with >15 scored animals each). (D) Demographic lifespan analysis of WT and osm-3(dh441)IV animals. WT mean lifespan = 24 days, osm-3(dh441)IV mean lifespan = 29 days, p<0.0001. See Supplementary file 1 for statistical analysis. (E) Table of dye filling phenotype and TM resistance. In the dye filling column,+ is positive for DiI filling as in (A) and − is Dyf. In the TM resistant column, + is resistant and − is not resistant to 10 µg/mL TM.
-
Figure 1—source data 1
Developmental TM resistance assay with WT and osm-3(dh441) animals (Figure 1C).
- https://cdn.elifesciences.org/articles/53174/elife-53174-fig1-data1-v2.xlsx
Figure 1—figure supplement 1
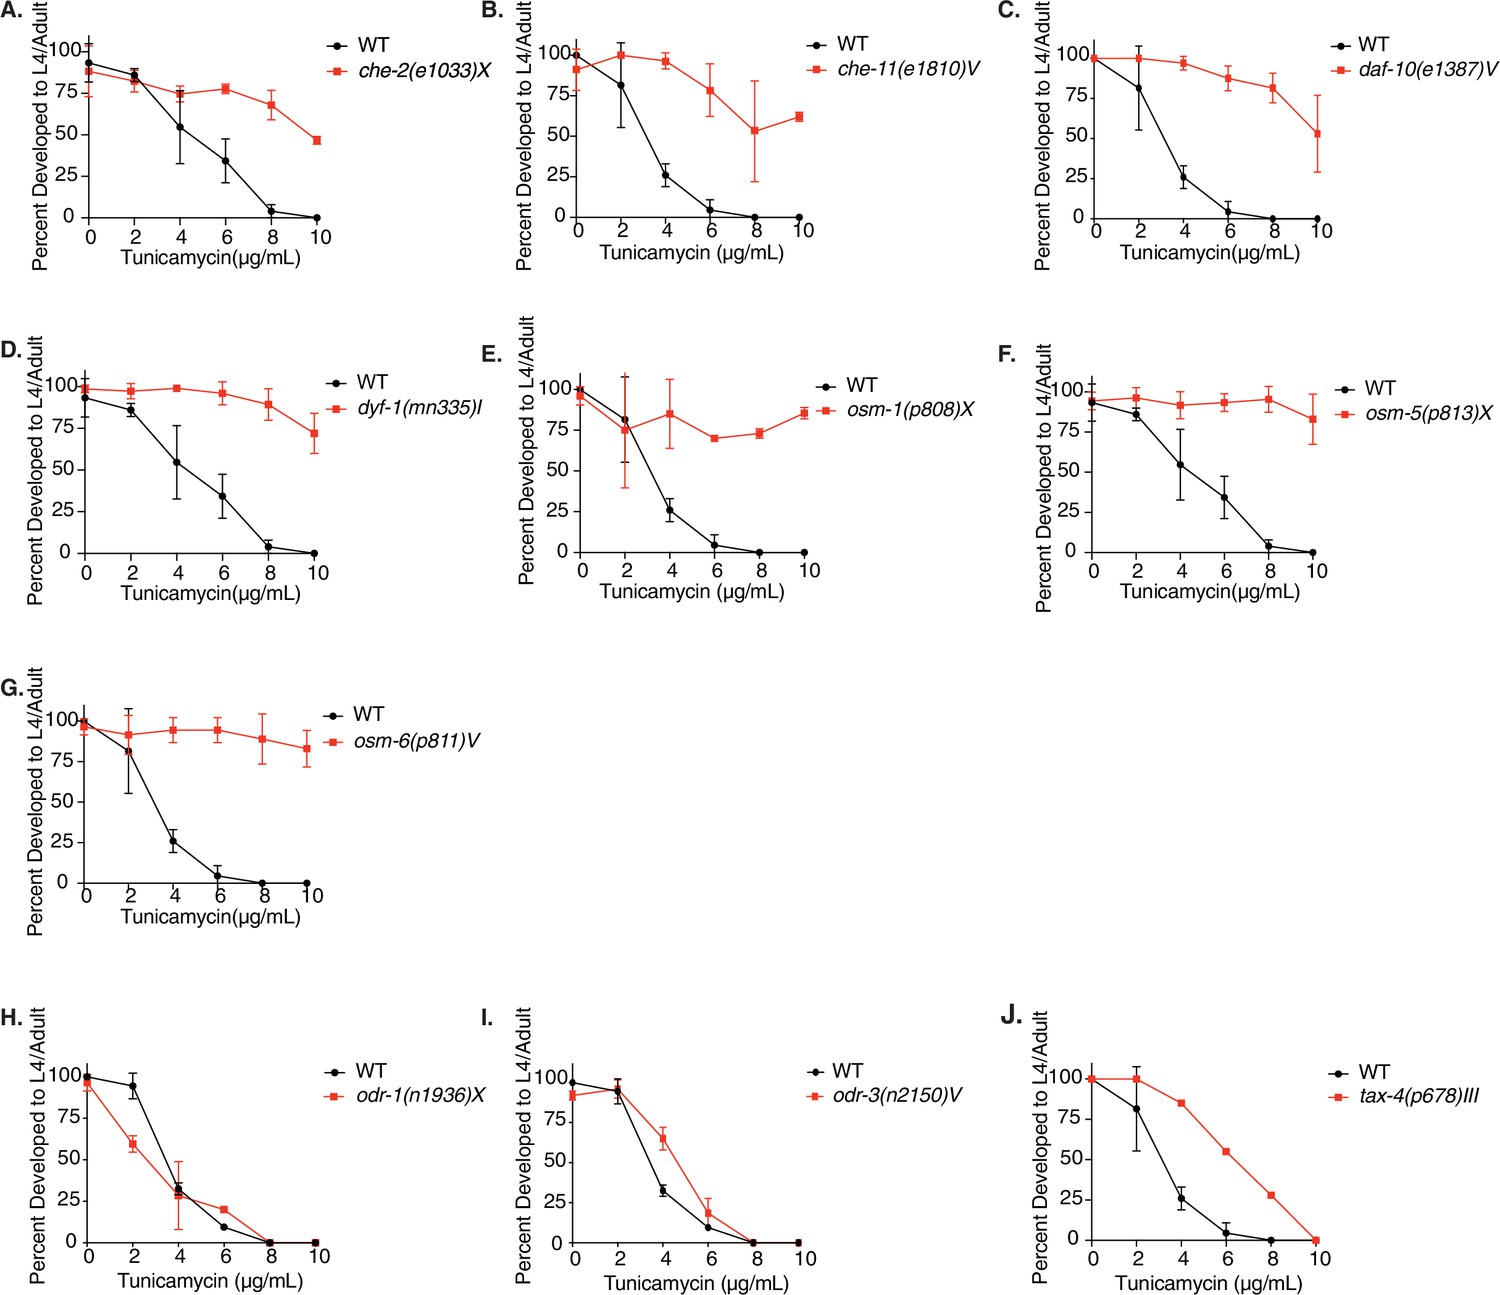
Tunicamycin resistance occurs in dye filling defective long-lived chemosensory C. elegans mutants.
(A–J) Developmental TM resistance assay with WT, che-2(e1033)X, che-11(e1810)V, daf-10(e1387)V, dyf-1(mn335)I, osm-1(p808)X, osm-5(p813)X, osm-6(p811)V, odr-1(n1936)X, odr-3(n2150)V, and tax-4(p678)III animals. Data are mean ± SD (n = 1 for J; n = 2 for B, C, E, G, H and I; n = 3 for A, D, and F independent experiments with >15 scored animals each).
-
Figure 1—figure supplement 1—source data 1
Developmental TM resistance assay with WT and che-2(e1033)X animals.
- https://cdn.elifesciences.org/articles/53174/elife-53174-fig1-figsupp1-data1-v2.xlsx
-
Figure 1—figure supplement 1—source data 2
Developmental TM resistance assay with WT and che-11(e1810)V animals.
- https://cdn.elifesciences.org/articles/53174/elife-53174-fig1-figsupp1-data2-v2.xlsx
-
Figure 1—figure supplement 1—source data 3
Developmental TM resistance assay with WT and daf-10(e1387)V animals.
- https://cdn.elifesciences.org/articles/53174/elife-53174-fig1-figsupp1-data3-v2.xlsx
-
Figure 1—figure supplement 1—source data 4
Developmental TM resistance assay with WT and dyf-1(mn335)I animals.
- https://cdn.elifesciences.org/articles/53174/elife-53174-fig1-figsupp1-data4-v2.xlsx
-
Figure 1—figure supplement 1—source data 5
Developmental TM resistance assay with WT and osm-1(p808)X animals.
- https://cdn.elifesciences.org/articles/53174/elife-53174-fig1-figsupp1-data5-v2.xlsx
-
Figure 1—figure supplement 1—source data 6
Developmental TM resistance assay with WT and osm-5(p813)X animals.
- https://cdn.elifesciences.org/articles/53174/elife-53174-fig1-figsupp1-data6-v2.xlsx
-
Figure 1—figure supplement 1—source data 7
Developmental TM resistance assay with WT and osm-6(p811)V animals.
- https://cdn.elifesciences.org/articles/53174/elife-53174-fig1-figsupp1-data7-v2.xlsx
-
Figure 1—figure supplement 1—source data 8
Developmental TM resistance assay with WT and odr-1(n1936)X animals.
- https://cdn.elifesciences.org/articles/53174/elife-53174-fig1-figsupp1-data8-v2.xlsx
-
Figure 1—figure supplement 1—source data 9
Developmental TM resistance assay with WT and odr-3(n2150)V animals.
- https://cdn.elifesciences.org/articles/53174/elife-53174-fig1-figsupp1-data9-v2.xlsx
-
Figure 1—figure supplement 1—source data 10
Developmental TM resistance assay with WT and tax-4(p7689)III animals.
- https://cdn.elifesciences.org/articles/53174/elife-53174-fig1-figsupp1-data10-v2.xlsx
Figure 2 with 1 supplement
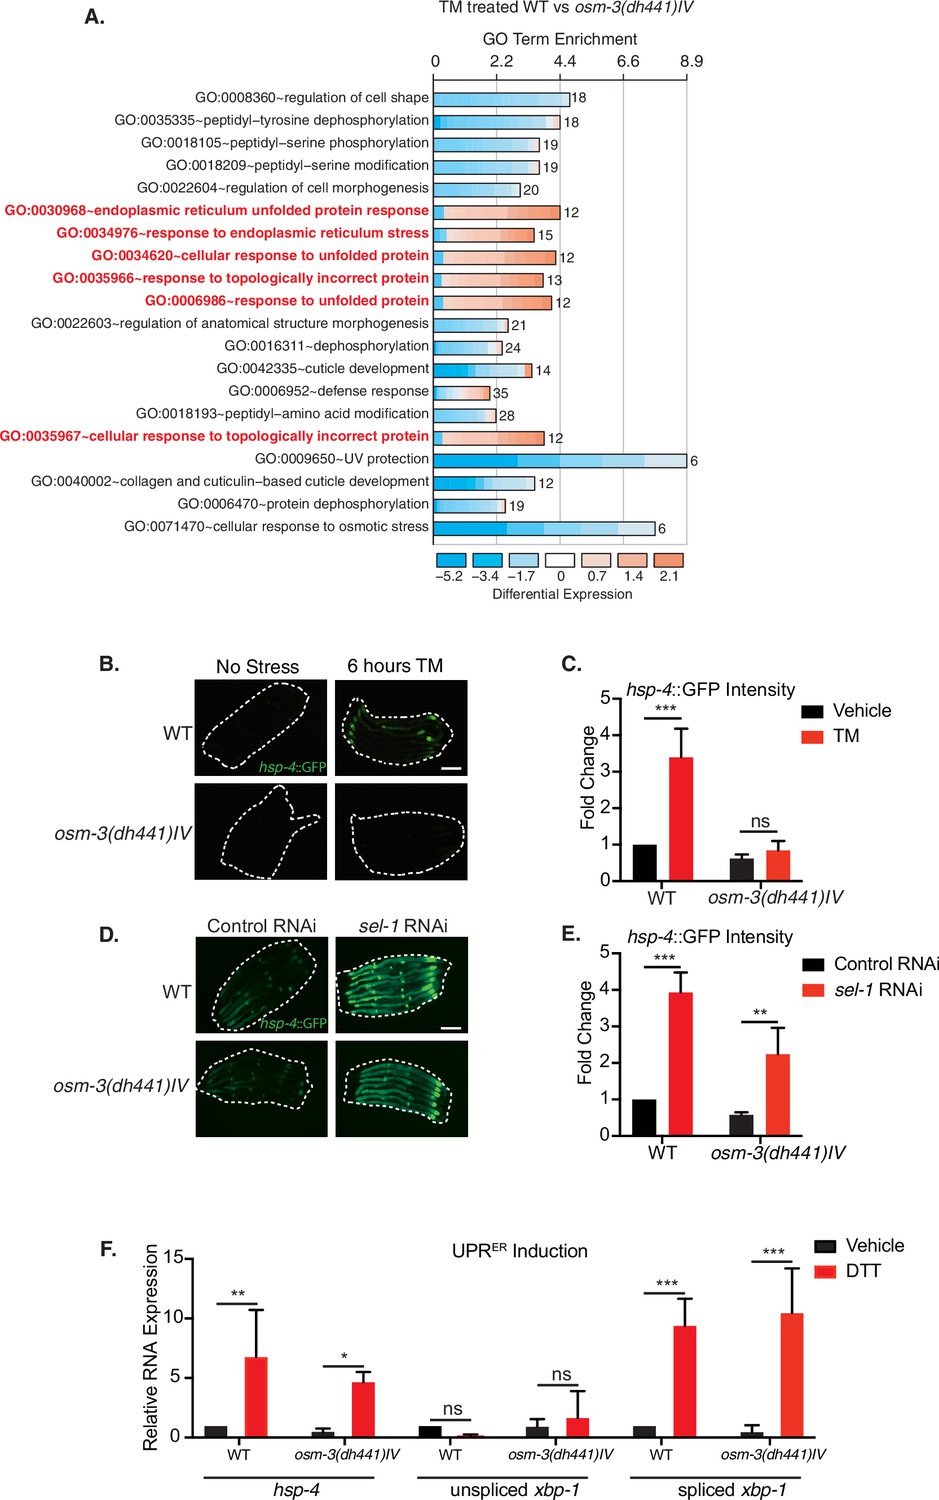
Reduced tunicamycin-induced ER stress signaling in osm-3 mutants despite functional ER-UPR pathway.
(A) DAVID gene ontology (GO) terms that are enriched in TM-treated WT compared to TM-treated osm-3(dh441)IV worms. Red = upregulated and blue = downregulated. The fold enrichment is plotted as x axis. The numbers of genes is indicated next to the bar for each term. (B) Green fluorescent images of WT and osm-3(dh441)IV animals in the hsp-4::GFP reporter background after 6 hr of 10 µg/mL TM treatment. Worms are outlined in the images (scale bar 100 µm). (C) Biosorter analysis of osm-3(dh441)IV vs. WT animals in the hsp-4::GFP background after 6 hr of control or TM treatment. Fold change represents GFP intensity normalized to WT treated with vehicle. Data are mean + SEM, n = 4, ***p<0.0001 by two-way ANOVA. (D) Green fluorescent images of WT and osm-3(dh441)IV animals in the hsp-4::GFP background after development on control or sel-1 RNAi. Worms are outlined in the images (scale bar 100 µm). (E) Biosorter analysis of osm-3(dh441)IV vs. WT animals in the hsp-4::GFP background raised on control or sel-1 RNAi. Fold change represents GFP intensity normalized to WT treated with vehicle. Data are mean + SEM, n = 3, **p<0.005 ***p<0.0001 by two-way ANOVA. (F) Quantitative PCR measuring relative hsp-4 and spliced and unspliced xbp-1 mRNA levels in WT and osm-3(dh441)IV animals after 2 hr of 10 mM DTT treatment. Relative mRNA expression is mRNA expression levels normalized to WT treated with vehicle. Data are mean + SEM, n = 3, *p<0.05, **p<0.001, ***p<0.0001 by two-way ANOVA.
-
Figure 2—source data 1
Biosorter analysis of osm-3(dh441)IV vs. WT animals in the hsp-4::GFP background after 6 hr of control or TM treatment (Figure 2C).
- https://cdn.elifesciences.org/articles/53174/elife-53174-fig2-data1-v2.xlsx
-
Figure 2—source data 2
Biosorter analysis of osm-3(dh441)IV vs. WT animals in the hsp-4::GFP background raised on control or sel-1 RNAi.
(Figure 2E).
- https://cdn.elifesciences.org/articles/53174/elife-53174-fig2-data2-v2.xlsx
-
Figure 2—source data 3
Quantitative PCR measuring relative hsp-4 and spliced and unspliced xbp-1 mRNA levels in WT and osm-3(dh441)IV animals after 2 hr of 10 mM DTT treatment (Figure 2F).
- https://cdn.elifesciences.org/articles/53174/elife-53174-fig2-data3-v2.xlsx
Figure 2—figure supplement 1

Quantitative PCR measuring relative mRNA expression of indicated genes in WT animals and osm-3(dh441)IV mutants after 6 hr of vehicle or TM treatment.
Fold change represents mRNA expression levels of the targeted genes normalized to WT treated with vehicle. Data are mean + SEM, n = 2.
-
Figure 2—figure supplement 1—source data 1
Quantitative PCR measuring relative mRNA expression of indicated genes in WT animals and osm-3(dh441)IV mutants after 6 hr of vehicle or TM treatment.
- https://cdn.elifesciences.org/articles/53174/elife-53174-fig2-figsupp1-data1-v2.xlsx
Figure 3 with 1 supplement

Tunicamycin resistance in osm-3 mutants is not daf-16 or pmk-1 dependent.
(A) Demographic lifespan analysis of WT, osm-3(dhh441)IV, daf-16(mu86)I and osm-3(dh441)IV; daf-16(mu86)I animals. WT mean lifespan = 22 days, osm-3(dh441)IV mean lifespan = 25 days p<0.005 compared to WT, daf-16(mu86)I mean lifespan = 16 days p<0.0001 compared to WT, osm-3(dh441)IV; daf-16(mu86)I mean lifespan = 16 days p<0.0001 compared to WT. See Supplementary file 1 for statistical analysis. (B) Developmental resistance assay using 10 µg/mL TM with WT, osm-3(dh441) IV, daf-16(mu86)I, and osm-3(dh441)IV; daf-16(mu86)I animals. No viable WT or daf-16(mu86) animals were observed in the TM condition. Data are mean ± SD (n = 3 independent experiments with >15 scored animals each). (C) Pseudomonas aeruginosa PA14 survival assay with WT, osm-3(dh441) IV, pmk-1(km25)IV, and osm-3(dh441)IV; pmk-1(km25)IV animals. WT mean survival = 44 hr, osm-3(dh441)IV mean survival = 58 hr p<0.001 compared to WT, pmk-1(km25)IV mean survival = 31 hr p<0.001 compared to WT, osm-3(dh441)IV; pmk-1(km25)IV mean survival = 34 hr p<0.001 compared to WT and p=0.06 compared to pmk-1(km25)IV. See Supplementary file 1 for statistical analysis. (D) Developmental resistance assay using 10 µg/mL TM with WT, osm-3(dh441)IV, pmk-1(km25)IV, and osm-3(dh441)IV; pmk-1(km25)IV animals. No viable WT or pmk-1(km-25) animals were observed in the TM condition. Data are mean ± SD (n = 3 independent experiments with >15 scored animals each).
-
Figure 3—source data 1
Developmental resistance assay using 10 µg/mL TM with WT, osm-3(dh441)IV, daf-16(mu86)I, and osm-3(dh441)IV; daf-16(mu86)I mutants.
(Figure 3B).
- https://cdn.elifesciences.org/articles/53174/elife-53174-fig3-data1-v2.xlsx
-
Figure 3—source data 2
Developmental resistance assay using 10 µg/mL TM with WT, osm-3(dh441)IV, pmk-1(km25)IV, and osm-3(dh441)IV; pmk-1(km25)IV mutants.
(Figure 3D).
- https://cdn.elifesciences.org/articles/53174/elife-53174-fig3-data2-v2.xlsx
Figure 3—figure supplement 1
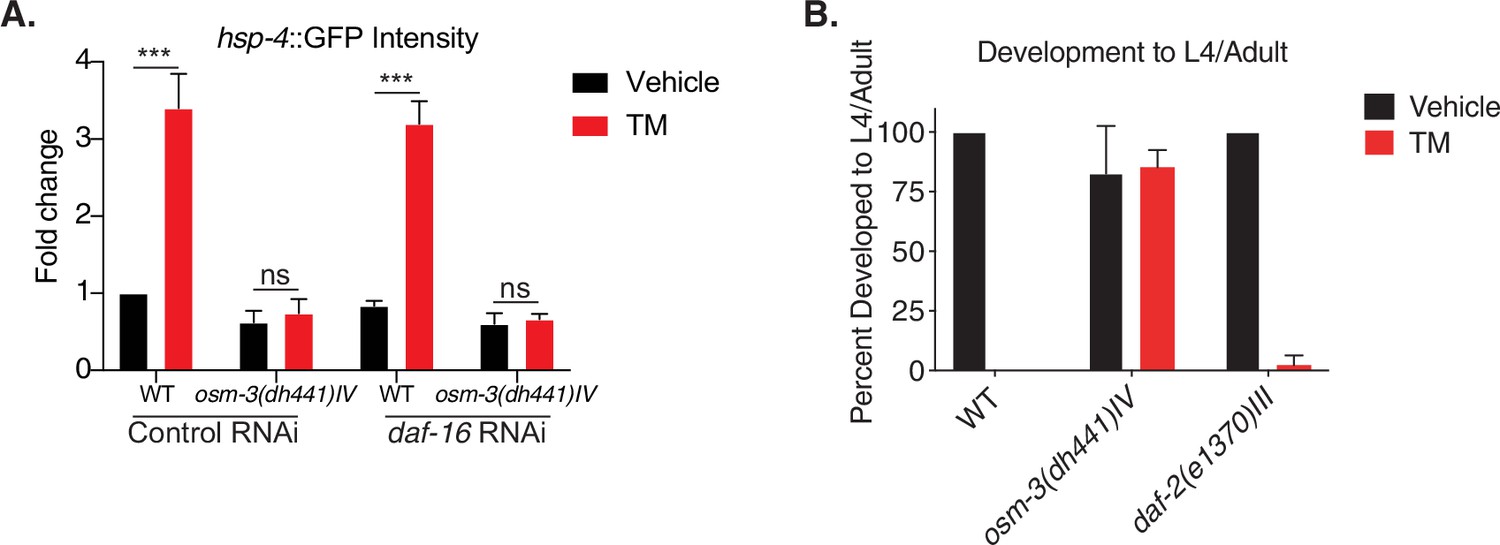
Tunicamycin resistance in osm-3 mutants is not daf-16 or pmk-1 dependent.
(A) Biosorter analysis of osm-3(dh441)IV vs. WT animals in the hsp-4::GFP background raised on control or daf-16 RNAi. Data are mean + SEM, n = 4, ***p<0.0001 by two-way ANOVA. (B) Developmental resistance assay using 10 µg/mL TM with WT, osm-3(dh441)IV and daf-2(e1370)III animals. No viable animals were observed in TM-treated WT. Data are mean + SEM, n = 3.
-
Figure 3—figure supplement 1—source data 1
Biosorter analysis of osm-3(dh441)IV vs. WT animals in the hsp-4::GFP background raised on control or daf-16 RNAi.
- https://cdn.elifesciences.org/articles/53174/elife-53174-fig3-figsupp1-data1-v2.xlsx
-
Figure 3—figure supplement 1—source data 2
Developmental resistance assay using 10 µg/mL TM with WT, osm-3(dh441) IV, and daf-2(e1370) III mutants.
- https://cdn.elifesciences.org/articles/53174/elife-53174-fig3-figsupp1-data2-v2.xlsx
Figure 4 with 1 supplement
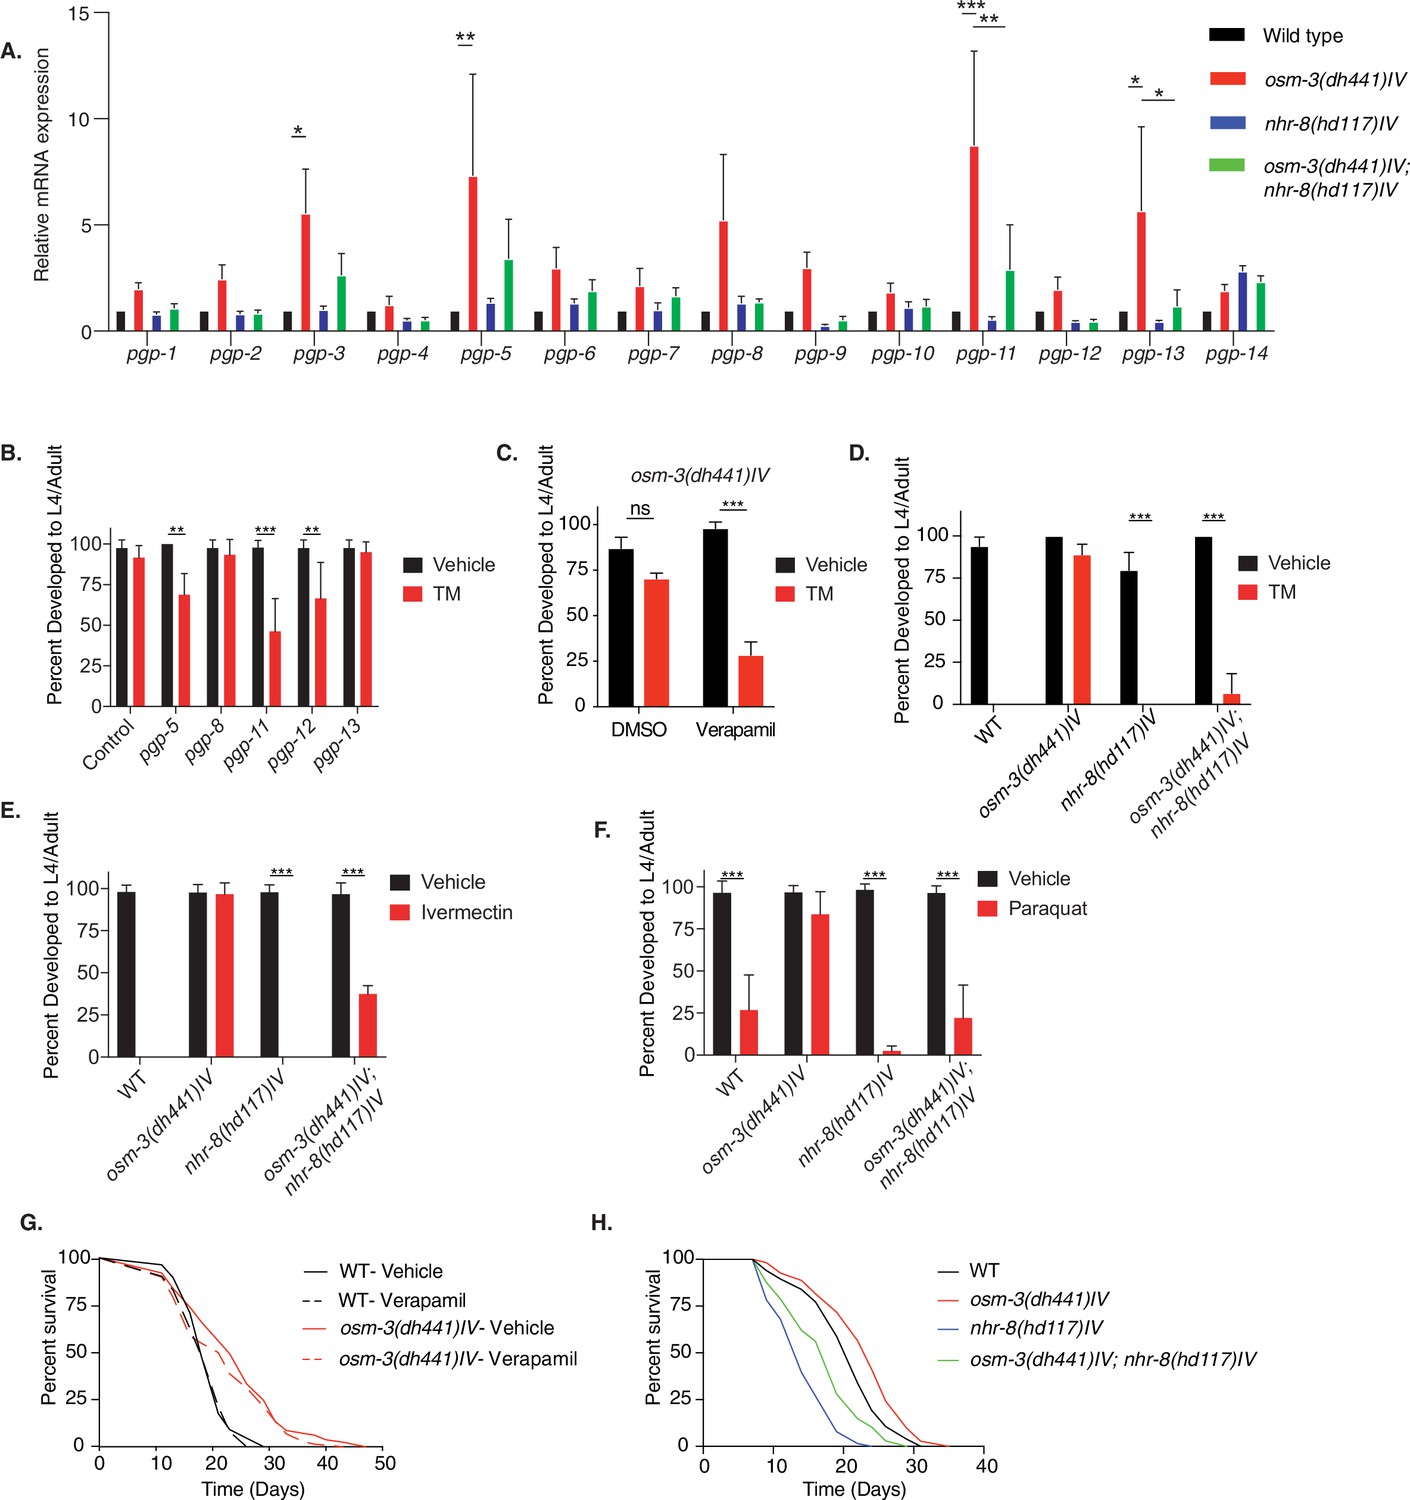
nhr-8 signaling regulates xenobiotic detoxification response through PGPs.
(A) Quantitative PCR measuring relative PGP mRNA expression in WT, osm-3(dh441)IV, nhr-8(hd117)IV, and osm-3(dh441)IV; nhr-8(hd117)IV animals. Relative mRNA expression is mRNA expression levels normalized to WT. There was no TM treatment. Data are mean + SEM, n = 3, *p<0.05, **p<0.001, ***p<0.0001 by two-way ANOVA. (B) Developmental TM resistance assay using 10 µg/mL TM and the indicated RNAi treatments with osm-3(dh441)IV mutants. Data are mean + SD, n = 3, **p<0.05, ***p<0.001 by two-way ANOVA. (C) Developmental TM resistance assay using the PGP inhibitor verapamil (VPL) using 10 µg/mL TM supplemented with vehicle or 1 nM VPL. Data are mean + SD, n = 3, ***p<0.001 by two-way ANOVA. (D) Developmental TM resistance assay on 10 µg/mL TM and control with WT, osm-3(dh441)IV, nhr-8(hd117)IV, and osm-3(dh441)IV; nhr-8(hd117)IV animals. Data are mean + SD, n = 3, *p<0.05, ***p<0.0001 by t-test. (E) Developmental ivermectin resistance assay of WT, osm-3(dh441)IV, nhr-8(hd117)IV, and osm-3(dh441)IV; nhr-8(hd117)IV animals using 6 ng/mL ivermectin and vehicle control. Data are mean + SD, n = 3, ***p<0.001 by two-way ANOVA. (F) Developmental paraquat resistance assay of WT, osm-3(dh441)IV, nhr-8(hd117)IV, and osm-3(dh441)IV; nhr-8(hd117)IV animals using 0.2 mM paraquat and vehicle control. Data are mean + SD, n = 3, ***p<0.001 by two-way ANOVA. (G) Demographic lifespan analysis on vehicle and verapamil-treated WT and osm-3(dh441)IV worms. Vehicle treated.WT mean lifespan = 19 days; osm-3(dh441)IV mean lifespan = 24 days p<0.0001 compared to WT vehicle. verapamil treated.WT mean lifespan = 19 days; osm-3(dh441)IV mean lifespan = 22 days, p<0.005 compared to WT Vehicle. (H) Demographic lifespan analysis of WT, osm-3(dh441)IV, nhr-8(hd117)IV, and osm-3(dh441)IV;nhr-8(hd117)IV animals. WT mean lifespan = 22 days, osm-3(dh441)IV mean lifespan = 24 days p<0.0001 compared to WT, nhr-8(hd117)IV mean lifespan = 14 p<0.0001 compared to WT, osm-3(dh441)IV; nhr-8(hd117)IV mean lifespan = 19 days p<0.0001 compared to WT.
-
Figure 4—source data 1
Quantitative PCR measuring relative PGP mRNA expression in WT, osm-3(dh441)IV, nhr-8(hd117)IV, and osm-3(dh441)IV; nhr-8(hd117)IV animals (Figure 4A).
- https://cdn.elifesciences.org/articles/53174/elife-53174-fig4-data1-v2.xlsx
-
Figure 4—source data 2
Developmental TM resistance assay using 10 µg/mL TM and the indicated PGPs RNAi treatment.
(Figure 4B).
- https://cdn.elifesciences.org/articles/53174/elife-53174-fig4-data2-v2.xlsx
-
Figure 4—source data 3
Developmental TM resistance assay using the PGP inhibitor verapamil (VPL) using 10 µg/mL TM supplemented with vehicle or 1 nM VPL.
(Figure 4C).
- https://cdn.elifesciences.org/articles/53174/elife-53174-fig4-data3-v2.xlsx
-
Figure 4—source data 4
Developmental TM resistance assay on 10 µg/mL TM and control with WT, osm-3(dh441)IV, nhr-8(hd117)IV and osm-3(dh441)IV; nhr-8(hd117)IV animals (Figure 4D).
- https://cdn.elifesciences.org/articles/53174/elife-53174-fig4-data4-v2.xlsx
-
Figure 4—source data 5
Developmental ivermectin resistance assay of WT, osm-3(dh441)IV, nhr-8(hd117)IV and osm-3(dh441)IV; nhr-8(hd117)IV animals using 6 ng/mL ivermectin and vehicle control (Figure 4E).
- https://cdn.elifesciences.org/articles/53174/elife-53174-fig4-data5-v2.xlsx
-
Figure 4—source data 6
Developmental paraquat resistance assay of WT, osm-3(dh441)IV, nhr-8(hd117)IV, and osm-3(dh441)IV; nhr-8(hd117)IV animals using 0.2 mM paraquat and vehicle control (Figure 4F).
- https://cdn.elifesciences.org/articles/53174/elife-53174-fig4-data6-v2.xlsx
Figure 4—figure supplement 1
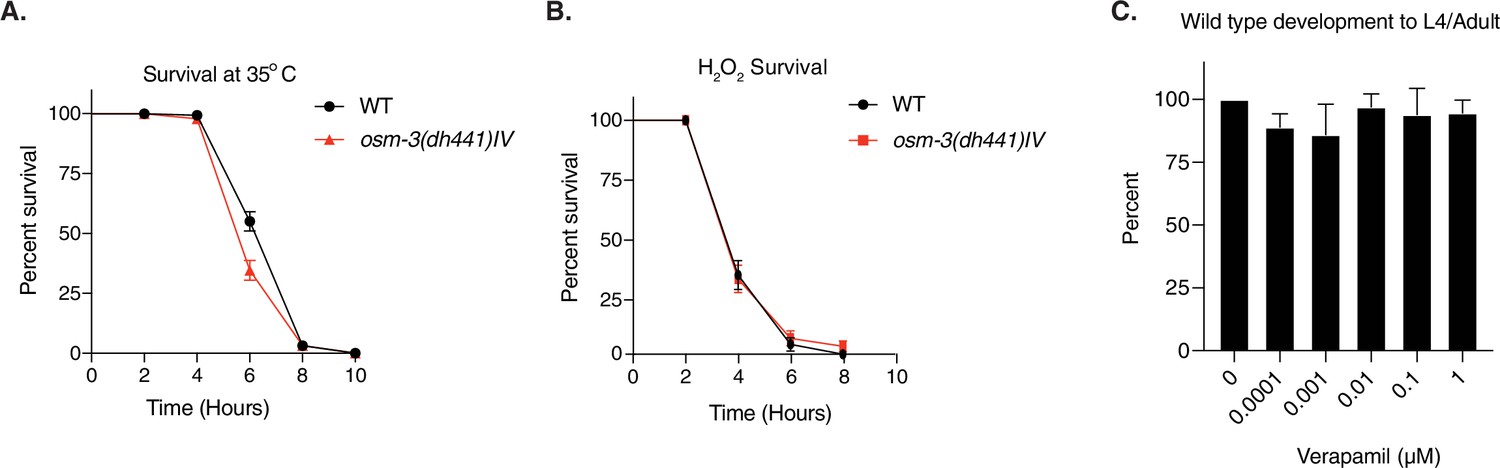
nhr-8 signaling regulates xenobiotic detoxification response through PGPs.
(A) Heat shock assay at 35°C in WT and osm-3(dh441)IV animals on day 1 of adulthood. See Supplementary file 1 for statistical analysis. (B) Hydrogen peroxide survival assay using 1 µM H2O2 on day 1 of adulthood in WT and osm-3(dh441)IV animals. See Supplementary file 1 for statistical analysis. (C) WT development on 0–1 µM Verapamil. No significant difference in development. Data are mean ± SD (n = 3 independent experiments with >9 scored animals each).
-
Figure 4—figure supplement 1—source data 1
Heat shock assay at 35 °C in WT and osm-3(dh441)IV animals on day 1 of adulthood.
- https://cdn.elifesciences.org/articles/53174/elife-53174-fig4-figsupp1-data1-v2.xlsx
-
Figure 4—figure supplement 1—source data 2
Hydrogen peroxide survival assay using 1 mM H2O2 on day 1 of adulthood in WT and osm-3(dh441)IV animals.
- https://cdn.elifesciences.org/articles/53174/elife-53174-fig4-figsupp1-data2-v2.xlsx
-
Figure 4—figure supplement 1—source data 3
WT development on 0–1 µM Verapamil.
- https://cdn.elifesciences.org/articles/53174/elife-53174-fig4-figsupp1-data3-v2.xlsx
Figure 5

Cholesterol modulates TM resistance through NHR-8.
(A) Developmental dose–response TM resistance assay using the indicated TM concentrations with WT animals and osm-3(dh441)IV mutants raised on 0 or 5 µg/mL cholesterol. Data are mean ± SD (n = 5 independent experiments with >15 scored animals each). (B) Biosorter analysis of WT animals with the hsp-4::GFP reporter raised on 0 or 50 µg/mL cholesterol after 6 hr of vehicle or 5 µg/mL TM treatment. Data are mean + SEM, n = 3, *p<0.05, ***p<0.0001 by two-way ANOVA. (C) Cholesterol dose–response developmental assay with WT, osm-3(dh441)IV, nhr-8(hd117)IV, and osm-3(dh441)IV; nhr-8(hd117)IV animals on vehicle or 5 µg/mL TM. Data are mean ± SD (n = 3 independent experiments with >15 scored animals each).
-
Figure 5—source data 1
Developmental dose–response TM resistance assay using the indicated TM concentrations with WT animals and osm-3(dh441)IV mutants raised on 0 or 5 µg/mL cholesterol.
(Figure 5A).
- https://cdn.elifesciences.org/articles/53174/elife-53174-fig5-data1-v2.xlsx
-
Figure 5—source data 2
Biosorter analysis of WT animals with the hsp-4::GFP reporter raised on 0 or 50 µg/mL cholesterol after 6 hr of vehicle or 5 µg/mL TM treatment.
(Figure 5B).
- https://cdn.elifesciences.org/articles/53174/elife-53174-fig5-data2-v2.xlsx
-
Figure 5—source data 3
Cholesterol dose–response developmental assay with WT, osm-3(dh441)IV, nhr-8(hd117)IV, and osm-3(dh441)IV; nhr-8(hd117)IV animals on vehicle or 5 µg/mL TM.
(Figure 5C).
- https://cdn.elifesciences.org/articles/53174/elife-53174-fig5-data3-v2.xlsx
Tables
Key resources table
| Reagent type (species) or resource | Designation | Source or reference | Identifiers | Additional information |
|---|---|---|---|---|
| Strain, strain background(E. coli) | HT115 [L4440::sel-1] | Source Bioscience | CELE_F45D3.5 | Ahringer RNAi library |
| Strain, strain background(E. coli) | HT115 [L4440::daf-16] | Source Bioscience | CELE_R13H8.1 | Ahringer RNAi library |
| Strain, strain background(E. coli) | HT115 [L4440::pgp-5] | Source Bioscience | CELE_C05A9.1 | Ahringer RNAi library |
| Strain, strain background(E. coli) | HT115 [L4440::pgp-8] | Source Bioscience | CELE_T21E8.3 | Ahringer RNAi library |
| Strain, strain background(E. coli) | HT115 [L4440::pgp11] | Source Bioscience | CELE_DH11.3 | Ahringer RNAi library |
| Strain, strain background(E. coli) | HT115 [L4440::pgp-12] | Source Bioscience | CELE_F22E10.1 | Ahringer RNAi library |
| Strain, strain background(E. coli) | HT115 [L4440::pgp-13] | Source Bioscience | CELE_F22E10.2 | Ahringer RNAi library |
| Genetic reagent(C. elegans) | osm-3(dh441)IV | Other | AA1962 | available from A. Antebi or M.S. Denzel |
| Genetic reagent(C. elegans) | daf-16(mu86)I | CGC | CF1038 | |
| Genetic reagent(C. elegans) | pmk-1(km25)IV | CGC | KU25 | |
| Genetic reagent(C. elegans) | osm-3(dh441)IV; nhr-8(hd117)IV | This paper | MSD420 | available from M.S. Denzel |
| Genetic reagent(C. elegans) | osm-3(dh441)IV; daf-16(mu86)I | This paper | MSD422 | available from M.S. Denzel |
| Genetic reagent(C. elegans) | osm-3(dh441)IV; pmk-1(km25)IV | This paper | MSD423 | available from M.S. Denzel |
| Genetic reagent(C. elegans) | odr-1(n1936)X | CGC | CX2065 | |
| Genetic reagent(C. elegans) | odr-3(n2150)V | CGC | CX2205 | |
| Genetic reagent(C. elegans) | osm-6(p811)V | CGC | PR811 | |
| Genetic reagent(C. elegans) | tax-4(p678)III | CGC | PR678 | |
| Genetic reagent(C. elegans) | nhr-8(hd117)IV | other | AA968 | available from A. Antebi or M.S. Denzel |
| Genetic reagent(C. elegans) | N2; dhEx451(nhr-8::gfp; coel::RFP) | CGC | AA1027 | |
| Genetic reagent(C. elegans) | osm-3(dh441)IV; zcIs4 [hsp-4::GFP]V | other | AA2774 | available from A. Antebi or M.S. Denzel |
| Genetic reagent(C. elegans) | zcIs4[hsp-4::GFP]V | CGC | SJ4005 | |
| Genetic reagent(C. elegans) | che-11(e1810)V | CGC | CB3330 | |
| Genetic reagent(C. elegans) | daf-10(e1387)IV | CGC | CB1387 | |
| Genetic reagent(C. elegans) | osm-1(p808)X | CGC | PR808 | |
| Genetic reagent(C. elegans) | dyf-1(mn335)I | CGC | SP1205 | |
| Genetic reagent(C. elegans) | che-2(e1033)X | CGC | CB1033 | |
| Genetic reagent(C. elegans) | osm-5(p813)X | CGC | PR813 | |
| Commercial assay or kit | Direct-zol RNA Microprep | Zymo Research | R2060 | |
| Commercial assay or kit | SMARTer Stranded RNA-Seq HT Kit | Takara | 634,838 | |
| Commercial assay or kit | Ribo-zero Gold kit | Illumina | MRZG12324 | |
| Chemical compound, drug | Tunicamycin | Calbiochem | CAS 11089-65-9 | |
| Chemical compound, drug | Dithiothreitol | Sigma-Aldrich | CAS 3483-12-3 | |
| Chemical compound, drug | Methyl viologen dichloride hydrate | Sigma-Aldrich | CAS 75365-73-0 | Paraquat |
| Chemical compound, drug | Ivermectin | Sigma-Aldrich | CAS 70288-86-7 | |
| Chemical compound, drug | Verapamil hydrochloride | Sigma-Aldrich | CAS 152-11-4 | |
| Chemical compound, drug | Cholesterol | Sigma-Aldrich | CAS 57-88-5 | |
| Chemical compound, drug | 1,1′-Dioctadecyl-3,3,3′,3′- tetramethylindocarbo cyanine perchlorate | Sigma-Aldrich | CAS 41085-99-8 | DiI |
| Software, algorithm | R statistical software | cran.r-project.org | DESeq2 1.16.1 | PMID.25516281 |
| Other | Reference Genome | ENSEMBL | WBCel235 |
Additional files
-
Supplementary file 1
Table containing the statistical analysis of the lifespan, PA14, heat shock and H2O2 resistance assays.
- https://cdn.elifesciences.org/articles/53174/elife-53174-supp1-v2.docx
-
Supplementary file 2
List of qPCR primers used in this study.
- https://cdn.elifesciences.org/articles/53174/elife-53174-supp2-v2.docx
-
Transparent reporting form
- https://cdn.elifesciences.org/articles/53174/elife-53174-transrepform1-v2.pdf
Download links
A two-part list of links to download the article, or parts of the article, in various formats.
Downloads (link to download the article as PDF)
Open citations (links to open the citations from this article in various online reference manager services)
Cite this article (links to download the citations from this article in formats compatible with various reference manager tools)
NHR-8 and P-glycoproteins uncouple xenobiotic resistance from longevity in chemosensory C. elegans mutants
eLife 10:e53174.
https://doi.org/10.7554/eLife.53174


