Cerebellar Purkinje cell activity modulates aggressive behavior
- Department of Neurobiology, Harvard Medical School, United States
- Vollum Institute, Oregon Health and Science University, United States
Figures
Figure 1 with 2 supplements
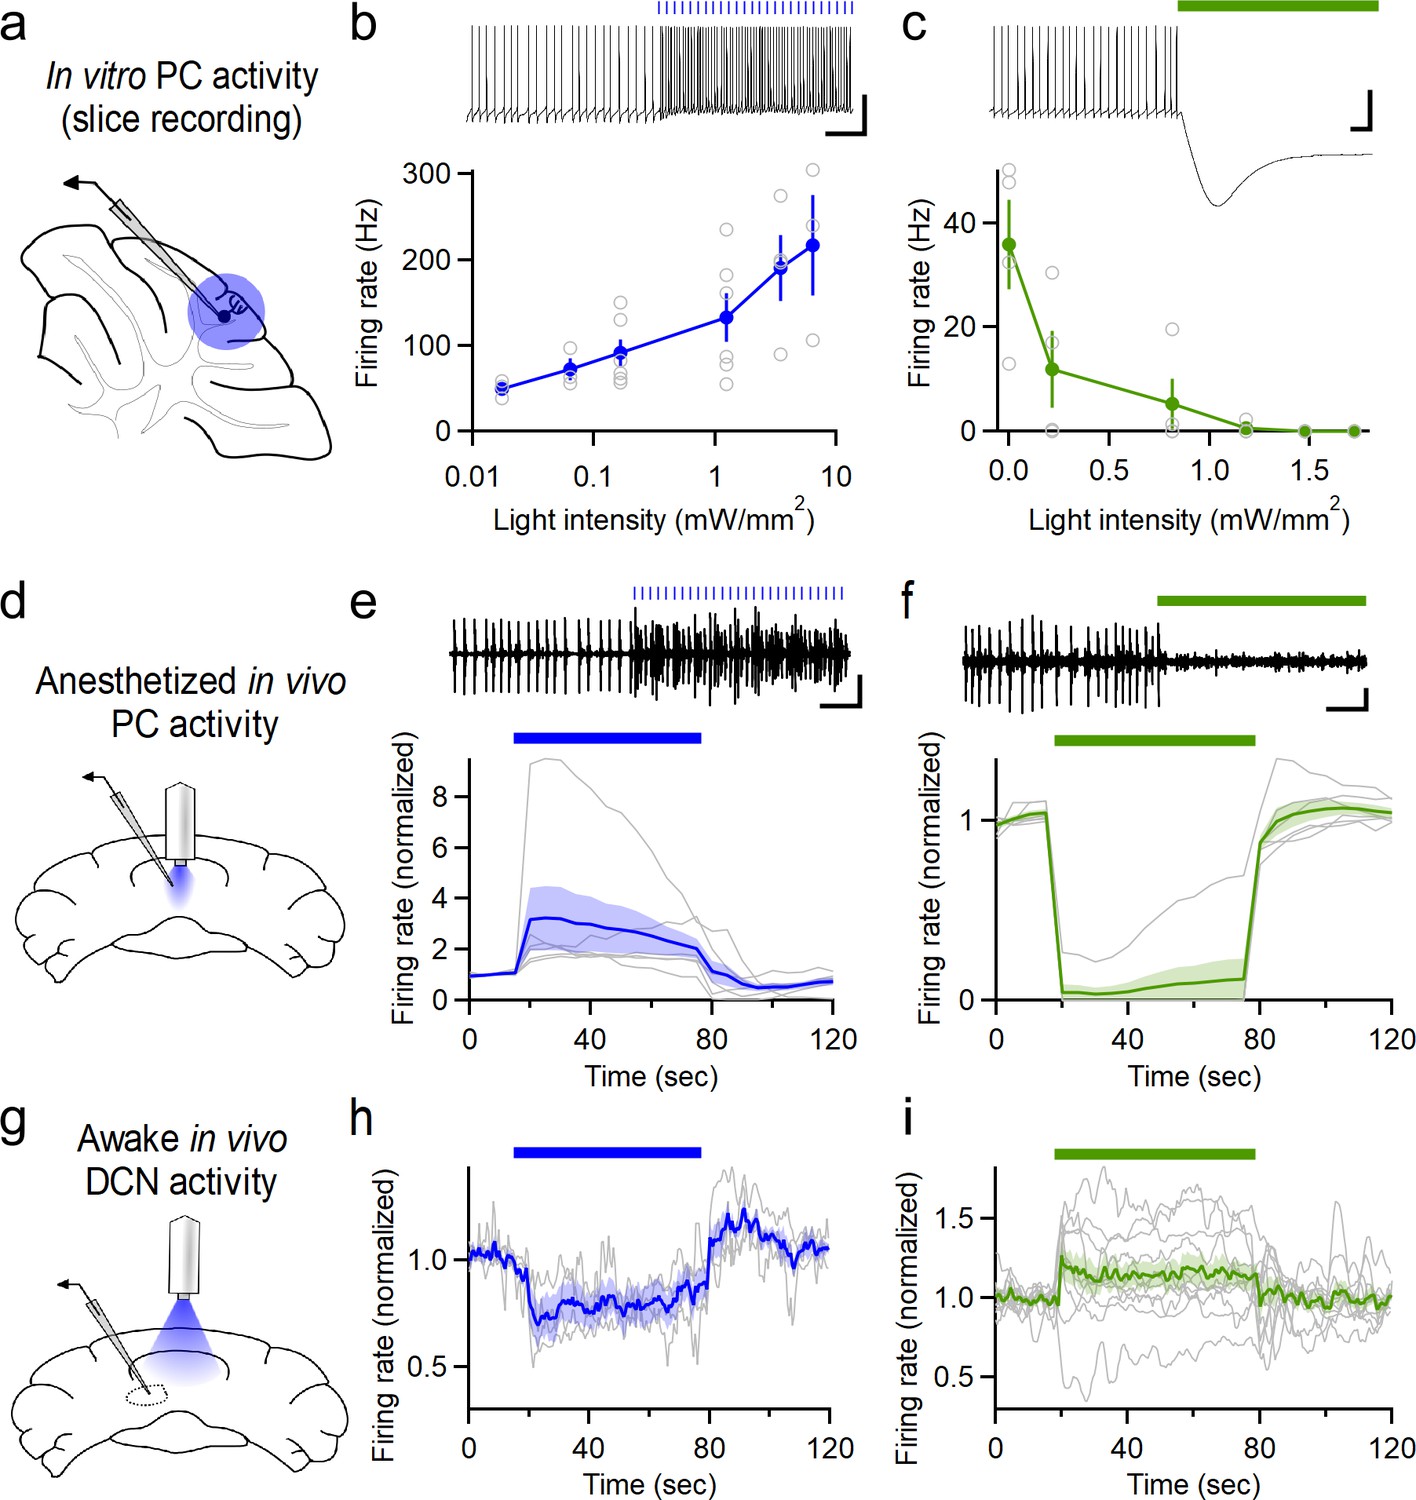
Optogenetic control of Purkinje cell activity.
(a) Recording schematic for in vitro recording and optogenetic stimulation. (b) Firing rates elicited by ChR2 stimulation at different intensities (0.5 ms flashes, 50 Hz, n = 6). (c) Inhibition of PCs at different light intensities (sustained illumination, n = 4). (d) Schematic for recording PC activity during in vivo stimulation through a chronic fiber optic implant. (e) Top: Representative single unit recording during ChR2 stimulation and (bottom) average firing rate (n = 6). (f) Single unit recordings during halorhodopsin stimulation (n = 6). Scale bars, 100 ms (horizontal), 20 mV (vertical, (b,c), 0.2 mV (vertical, (e,f). (g) Schematic for recording DCN activity during in vivo stimulation in awake animals. (h) Averaged normalized firing rate of DCN neurons during ChR2 stimulation of vermal PCs (n = 4). (i) Averaged firing of DCN neurons during halorhodopsin-mediated inhibition of vermal PCs (n = 11). Average data in all figures represents mean ± SEM.
-
Figure 1—source data 1
Optogenetic firing modulation data.
- https://cdn.elifesciences.org/articles/53229/elife-53229-fig1-data1-v2.xlsx
Figure 1—figure supplement 1
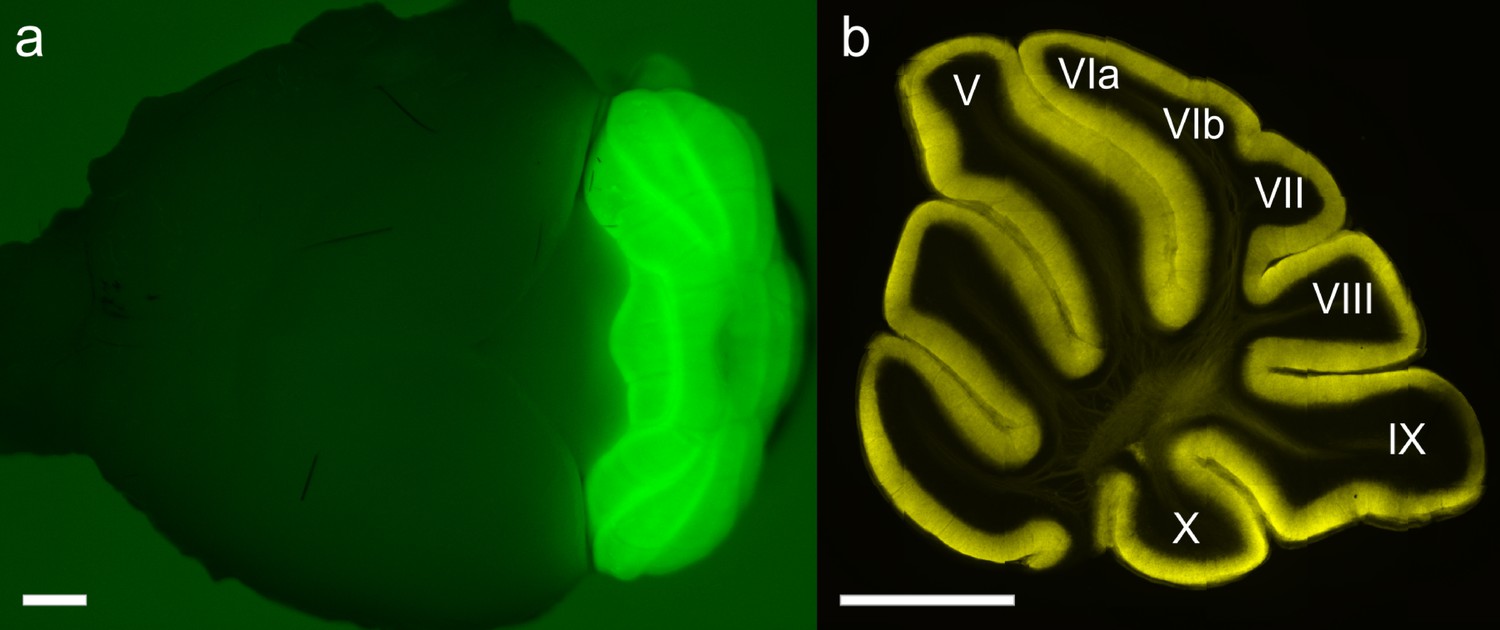
Fluorescent images of ChR2-YFP expression in (a) a whole brain and (b) a sagittal cerebellar section from a PCP2-cre::Ai32 mouse, with lobules V-X labeled.
Scale bar = 1 mm.
Figure 1—figure supplement 2
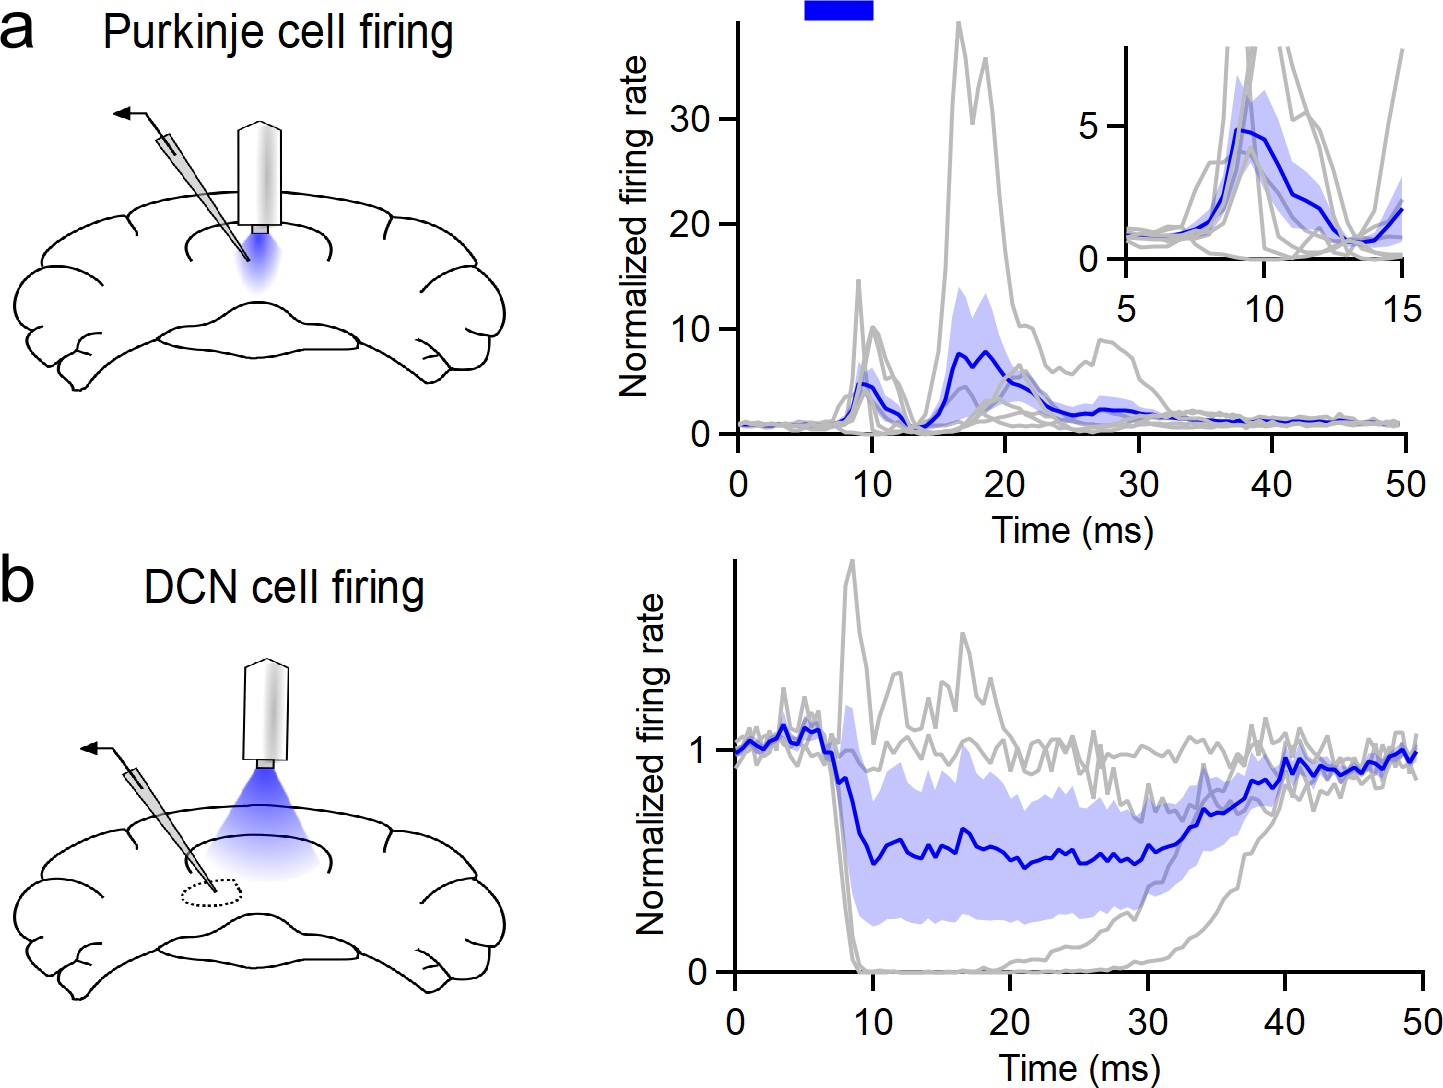
Millisecond-scale analysis of firing rates induced by in vivo stimulation in PCP2-cre::Ai32 animals.
(a) Peristimulus time histogram (0.5 ms bins) of Purkinje cell firing induced by optical stimulation (20 Hz, 5 ms flashes). Inset shows PC responses from the beginning of light onset. (b) As in (a), but for DCN recordings. These recordings represent the same data shown in Figure 1. Individual units are in gray, the mean ± SEM is displayed in blue.
Figure 2 with 1 supplement
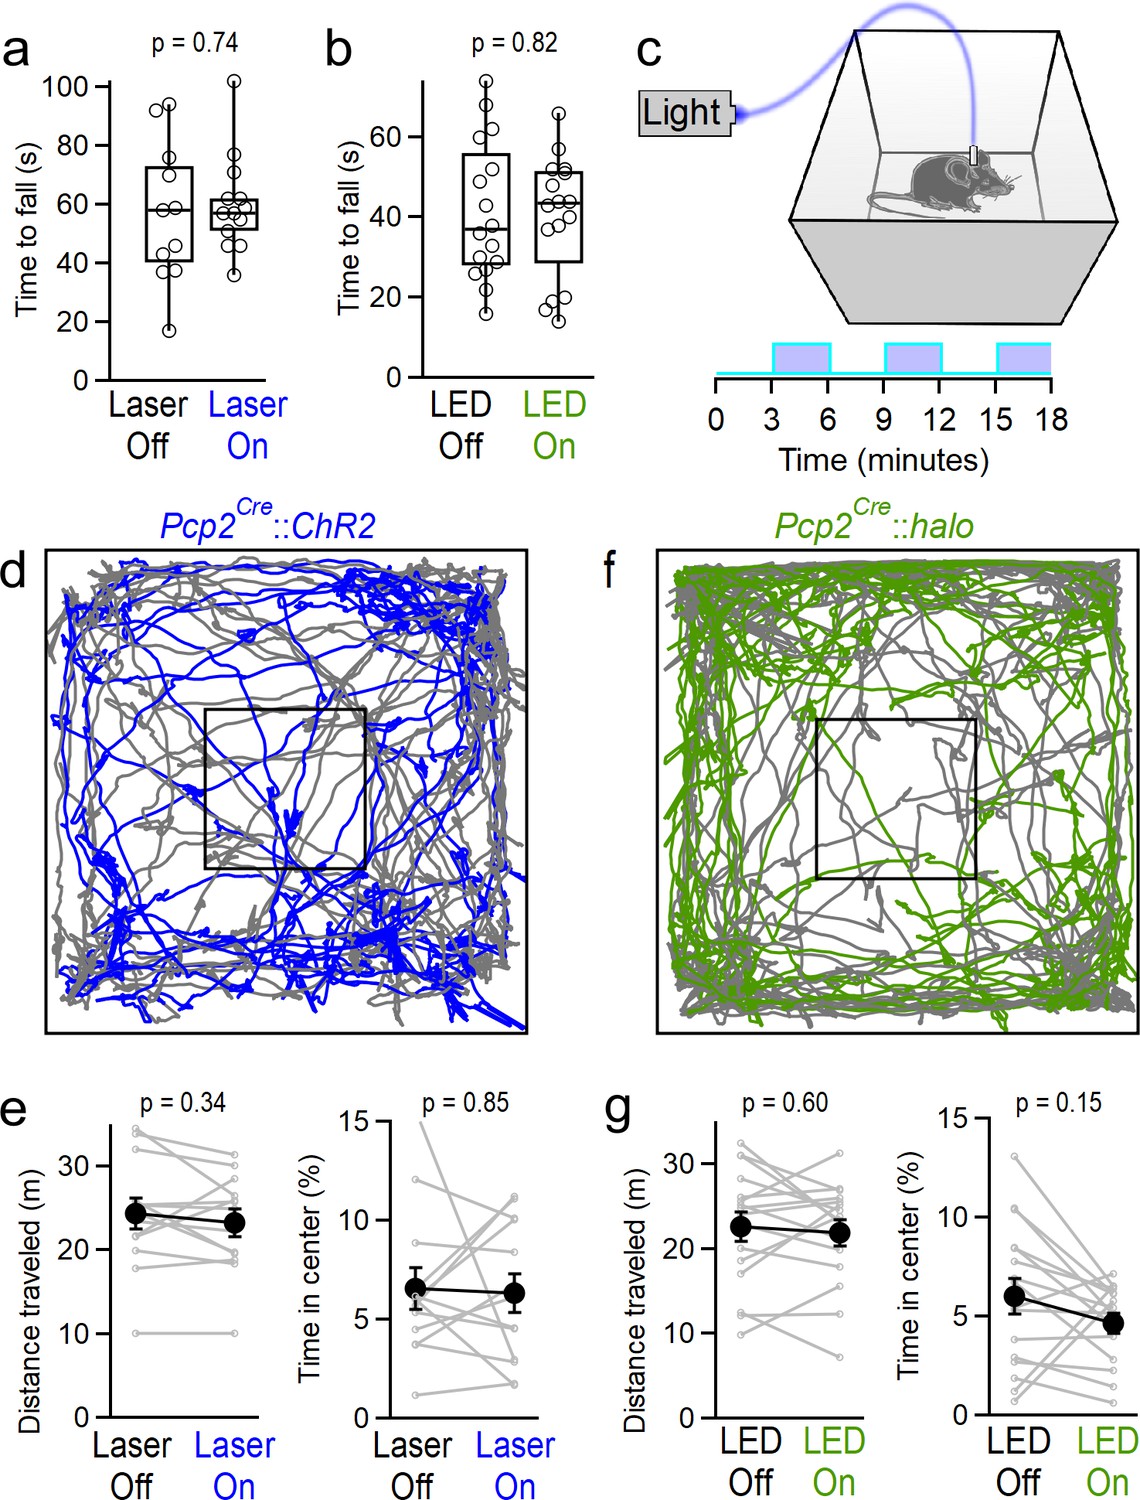
Manipulating vermal Purkinje cell activity does not affect coordination, locomotion or anxiety.
(a) Time to fall for rotarod assays during ChR2-mediated excitation. Mice were tested in two consecutive trials, and randomly assigned to receive stimulation during either the first or second trial. (n = 13) (b) Same as in (a), but for halorhodopsin-mediated inhibition of vermal PC firing. (n = 16) (c) Schematic for open field assay with optogenetic stimulation. (d) Representative tracking data throughout alternating periods with stimulation (blue) and without (gray). (e) Total distance traveled and time spent in the center of the arena for mice during epochs with and without stimulation of vermal PCs (n = 13). (f, g), Same as d), (e) but for halorhodopsin-mediated inhibition of vermal PCs (n = 17).
-
Figure 2—source data 1
Open field (ChR2) data.
- https://cdn.elifesciences.org/articles/53229/elife-53229-fig2-data1-v2.xlsx
-
Figure 2—source data 2
Open field (Halo) data.
- https://cdn.elifesciences.org/articles/53229/elife-53229-fig2-data2-v2.xlsx
-
Figure 2—source data 3
Rotarod data for Figure 2A.
- https://cdn.elifesciences.org/articles/53229/elife-53229-fig2-data3-v2.xlsx
Figure 2—figure supplement 1
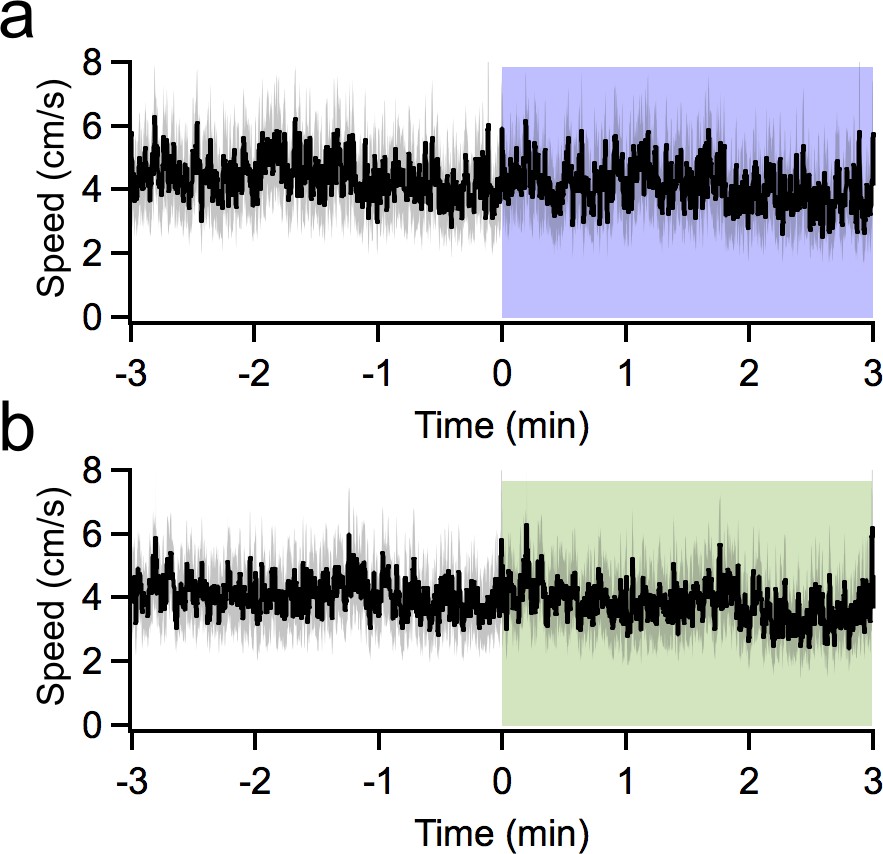
Manipulating vermal Purkinje cell firing does not affect locomotion.
Animal speed in an open field, averaged across three consecutive epochs of stimulation for (a) PCP2-cre:ChR2 (n = 13) and (b) PCP2-cre:Halorhodopsin (n = 17) animals.
Figure 3 with 3 supplements
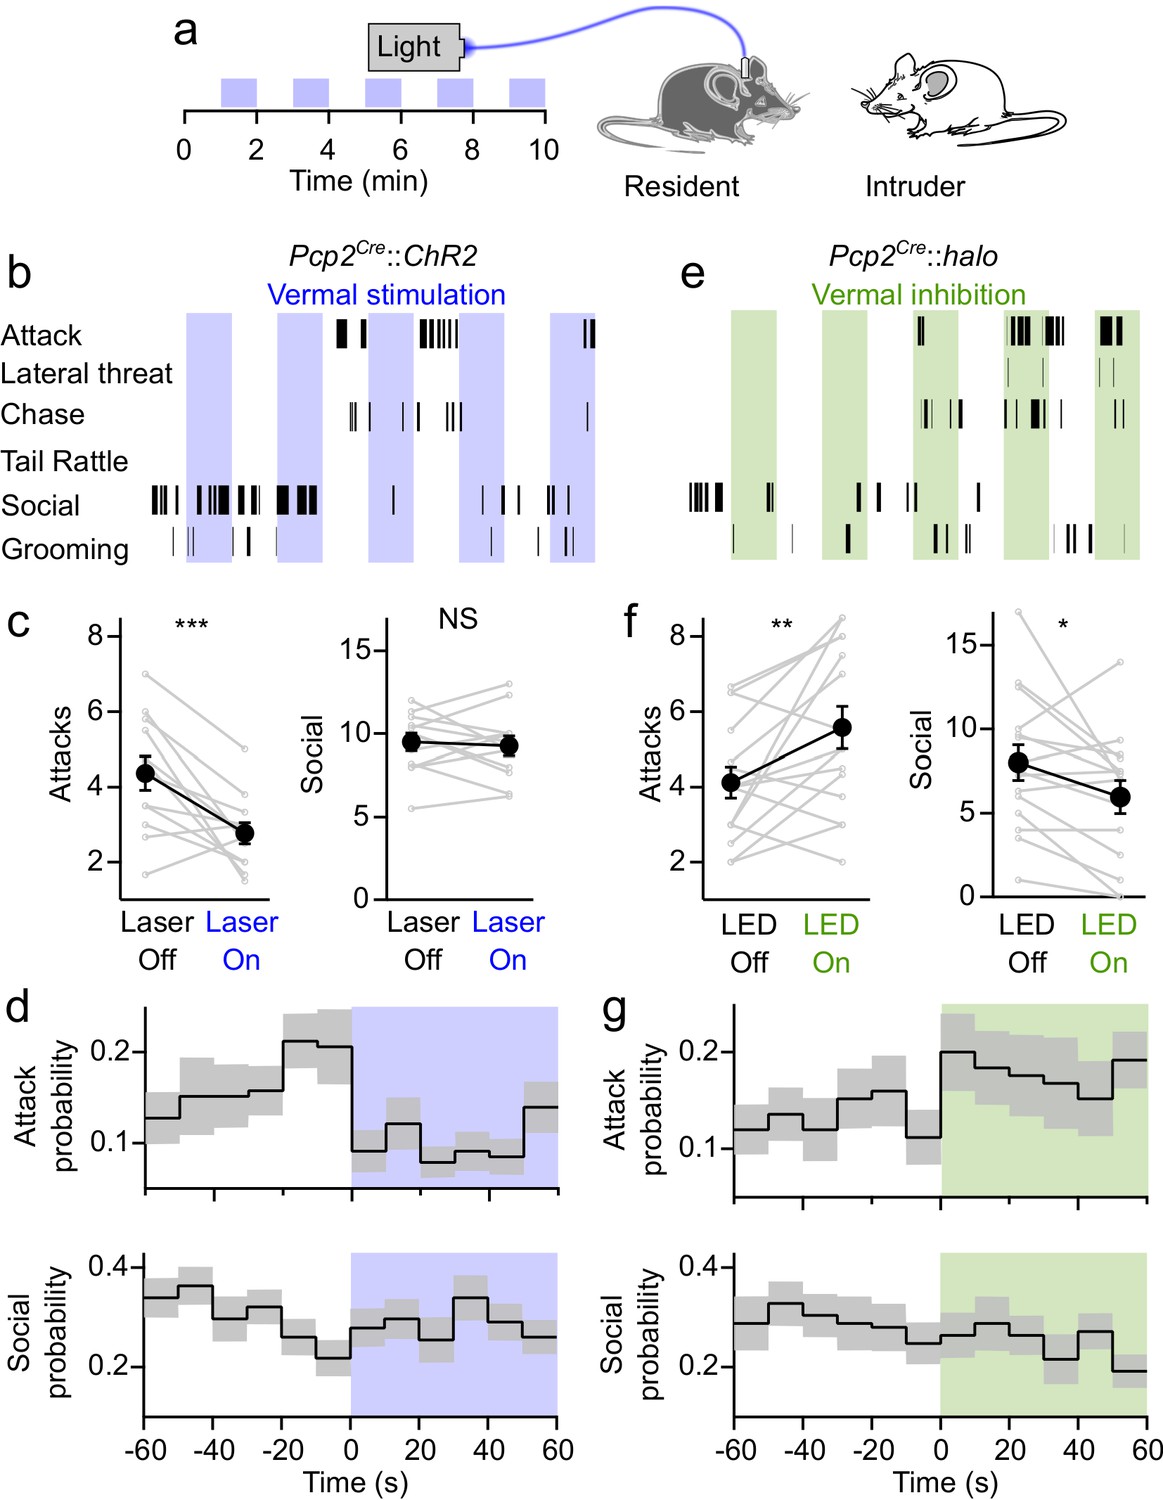
Bidirectional control of aggression by optogenetic modulation of vermal Purkinje cell activity.
(a) Schematic for resident-intruder assays with optogenetic stimulation. (b) Representative scoring of social and aggressive behaviors. (c) Average number of attacks and social encounters during ChR2 assays (31 assays from 12 residents). (d) Peristimulus time histogram of the probability of attacks (top) and social investigations (bottom) within 10 s bins during epochs with and without ChR2-mediated excitation of vermal PCs. (e–g), Same as in (b–d), but during Halorhodopsin-mediated inhibition of vermal PCs (34 assays from 15 residents).
-
Figure 3—source data 1
Resident Intruder Halo Vermis data.
- https://cdn.elifesciences.org/articles/53229/elife-53229-fig3-data1-v2.xlsx
-
Figure 3—source data 2
Resident Intruder No Opsin Vermis data.
- https://cdn.elifesciences.org/articles/53229/elife-53229-fig3-data2-v2.xlsx
Figure 3—figure supplement 1
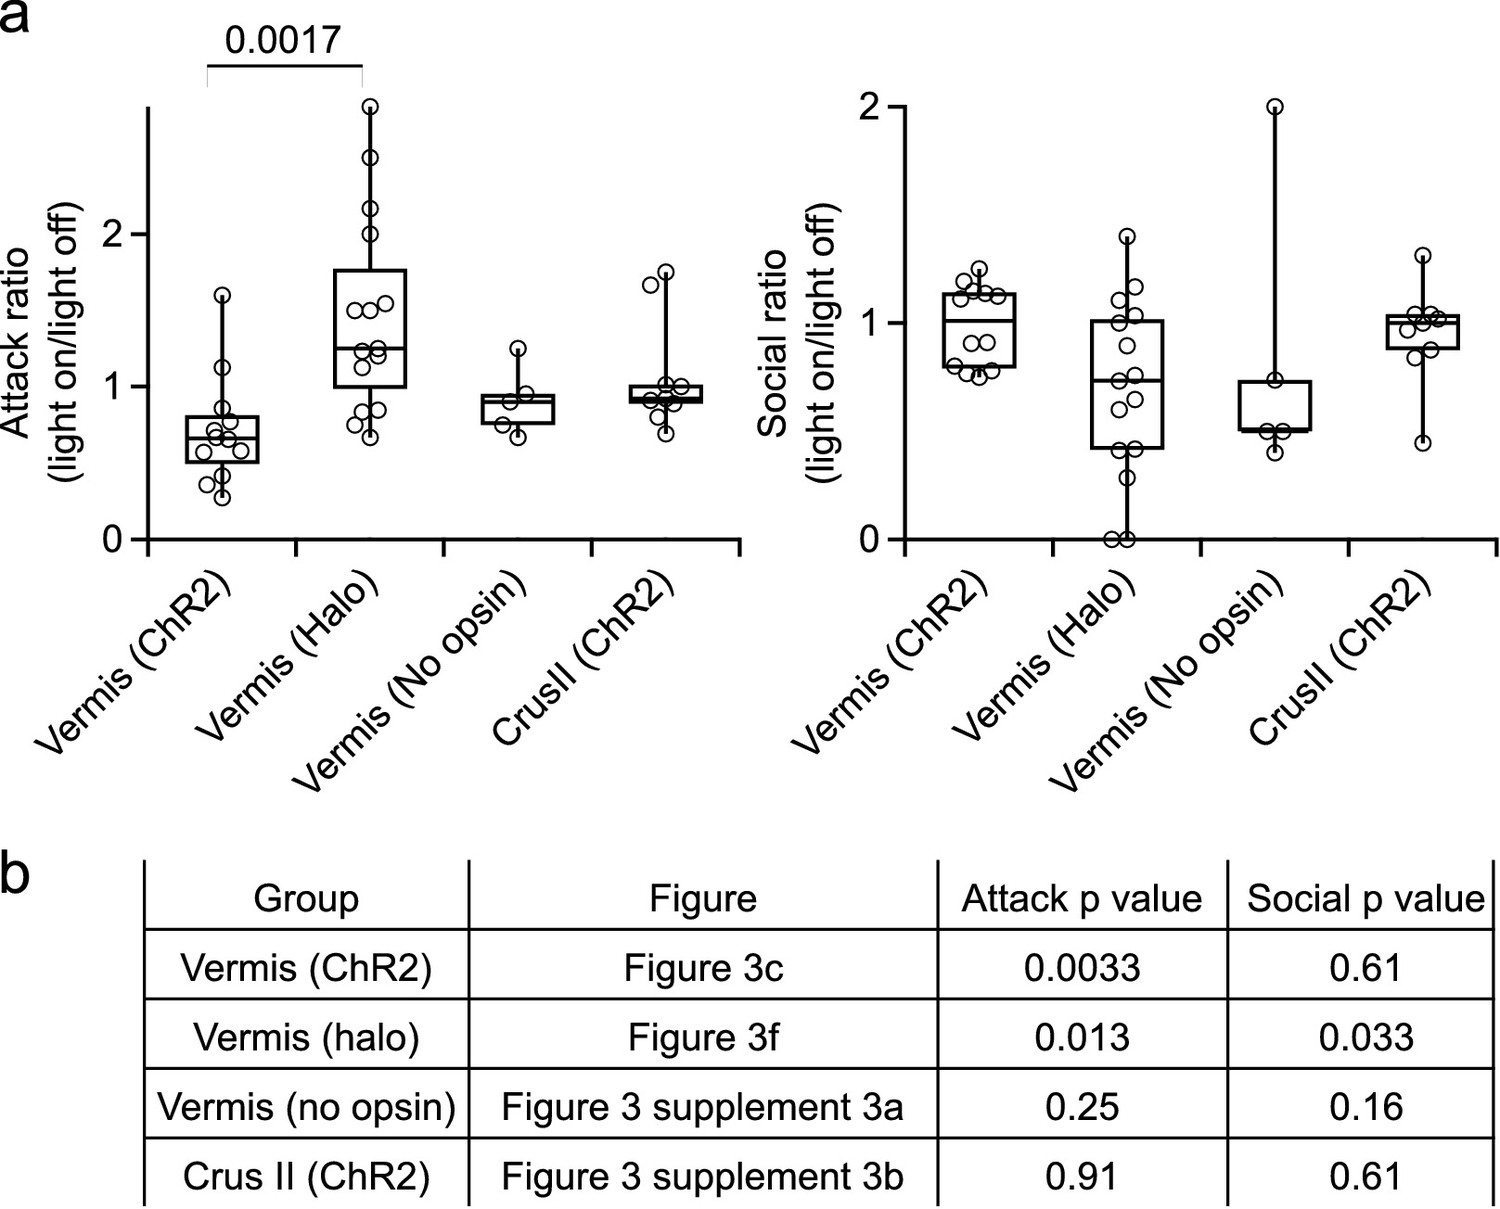
Statistical significance of behavioral effects.
(a) Comparison of light-induced behavioral changes between experimental groups, for attack rates (left) and social investigations (right). Pairwise comparisons that were not significant (p>0.05) have not been labeled. (b) P values for light on/light off differences within experimental groups for rates of attack and social interactions. Data was first assessed for normality (Shapiro-Wilk test). Significance was assessed using two-tailed Student’s t-tests for data that met the criteria of normality, or Wilcoxon-Mann-Whitney tests for data that did not (see Materials and methods for details).
Figure 3—figure supplement 2
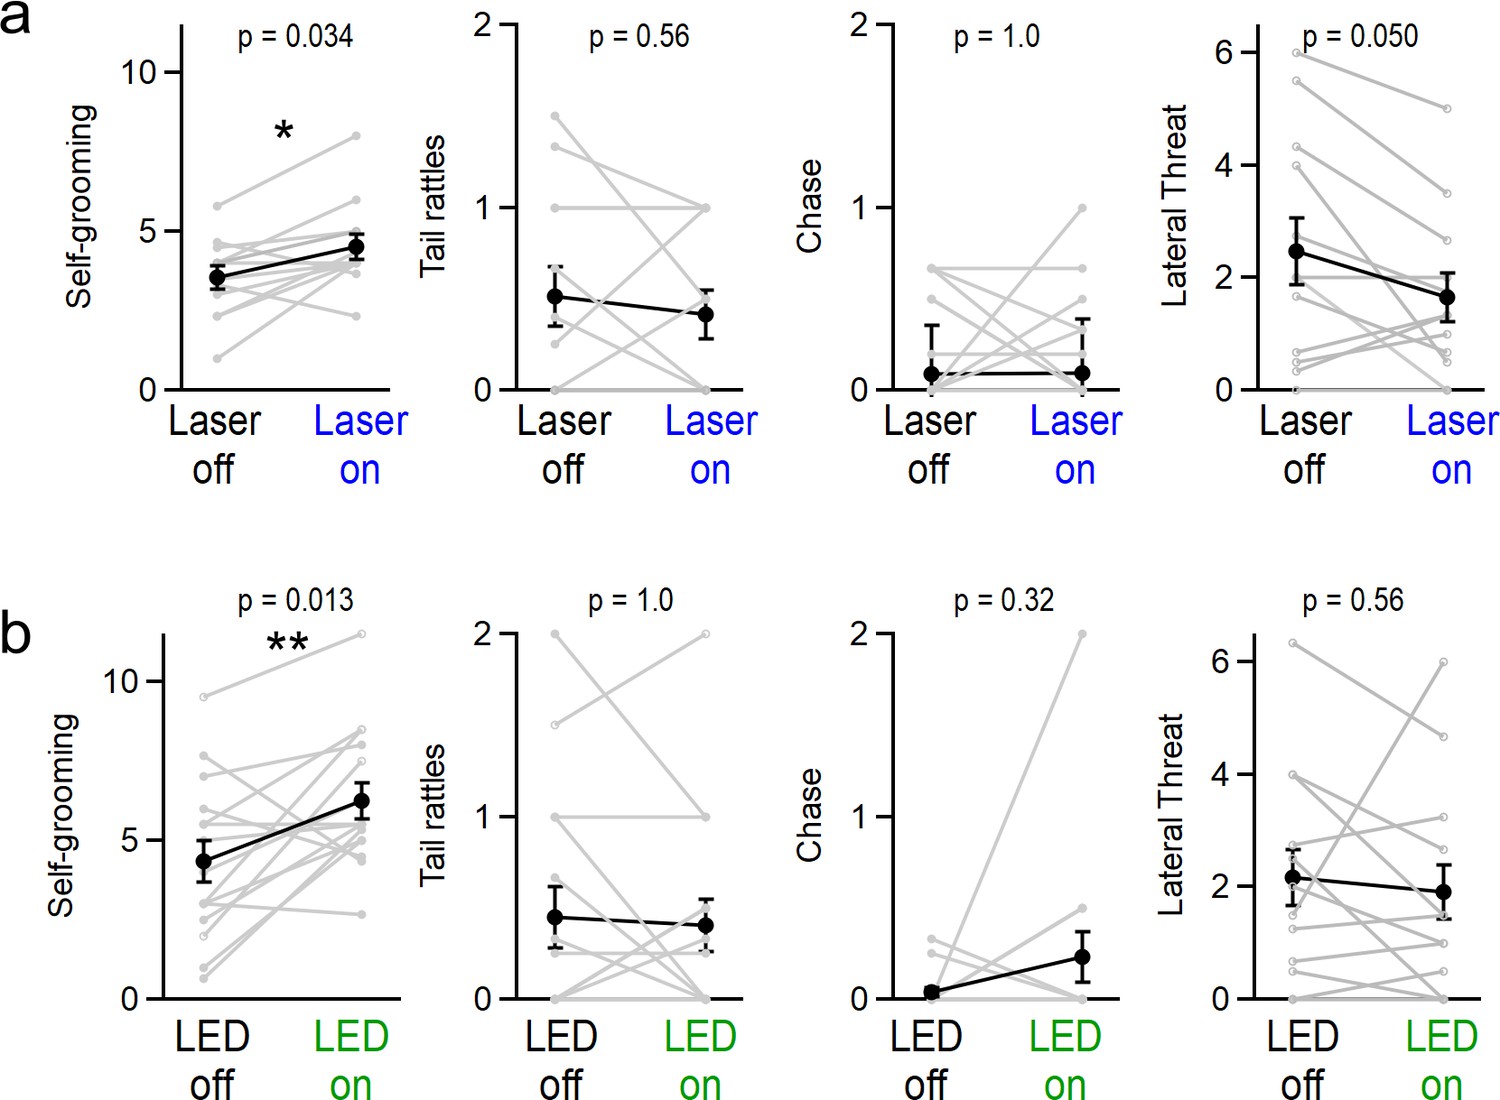
Effect of manipulating vermal Purkinje cell activity on grooming, tail-rattling, and aggressive lunging during resident-intruder assays.
(a) Optogenetic stimulation significantly increased grooming behaviors for both ChR2-expressing mice (31 assays in 12 mice, p=0.02, t-test) and (b) halorhodopsin-expressing mice (34 assays in 15 mice, p=0.01, t-test).
Figure 3—figure supplement 3
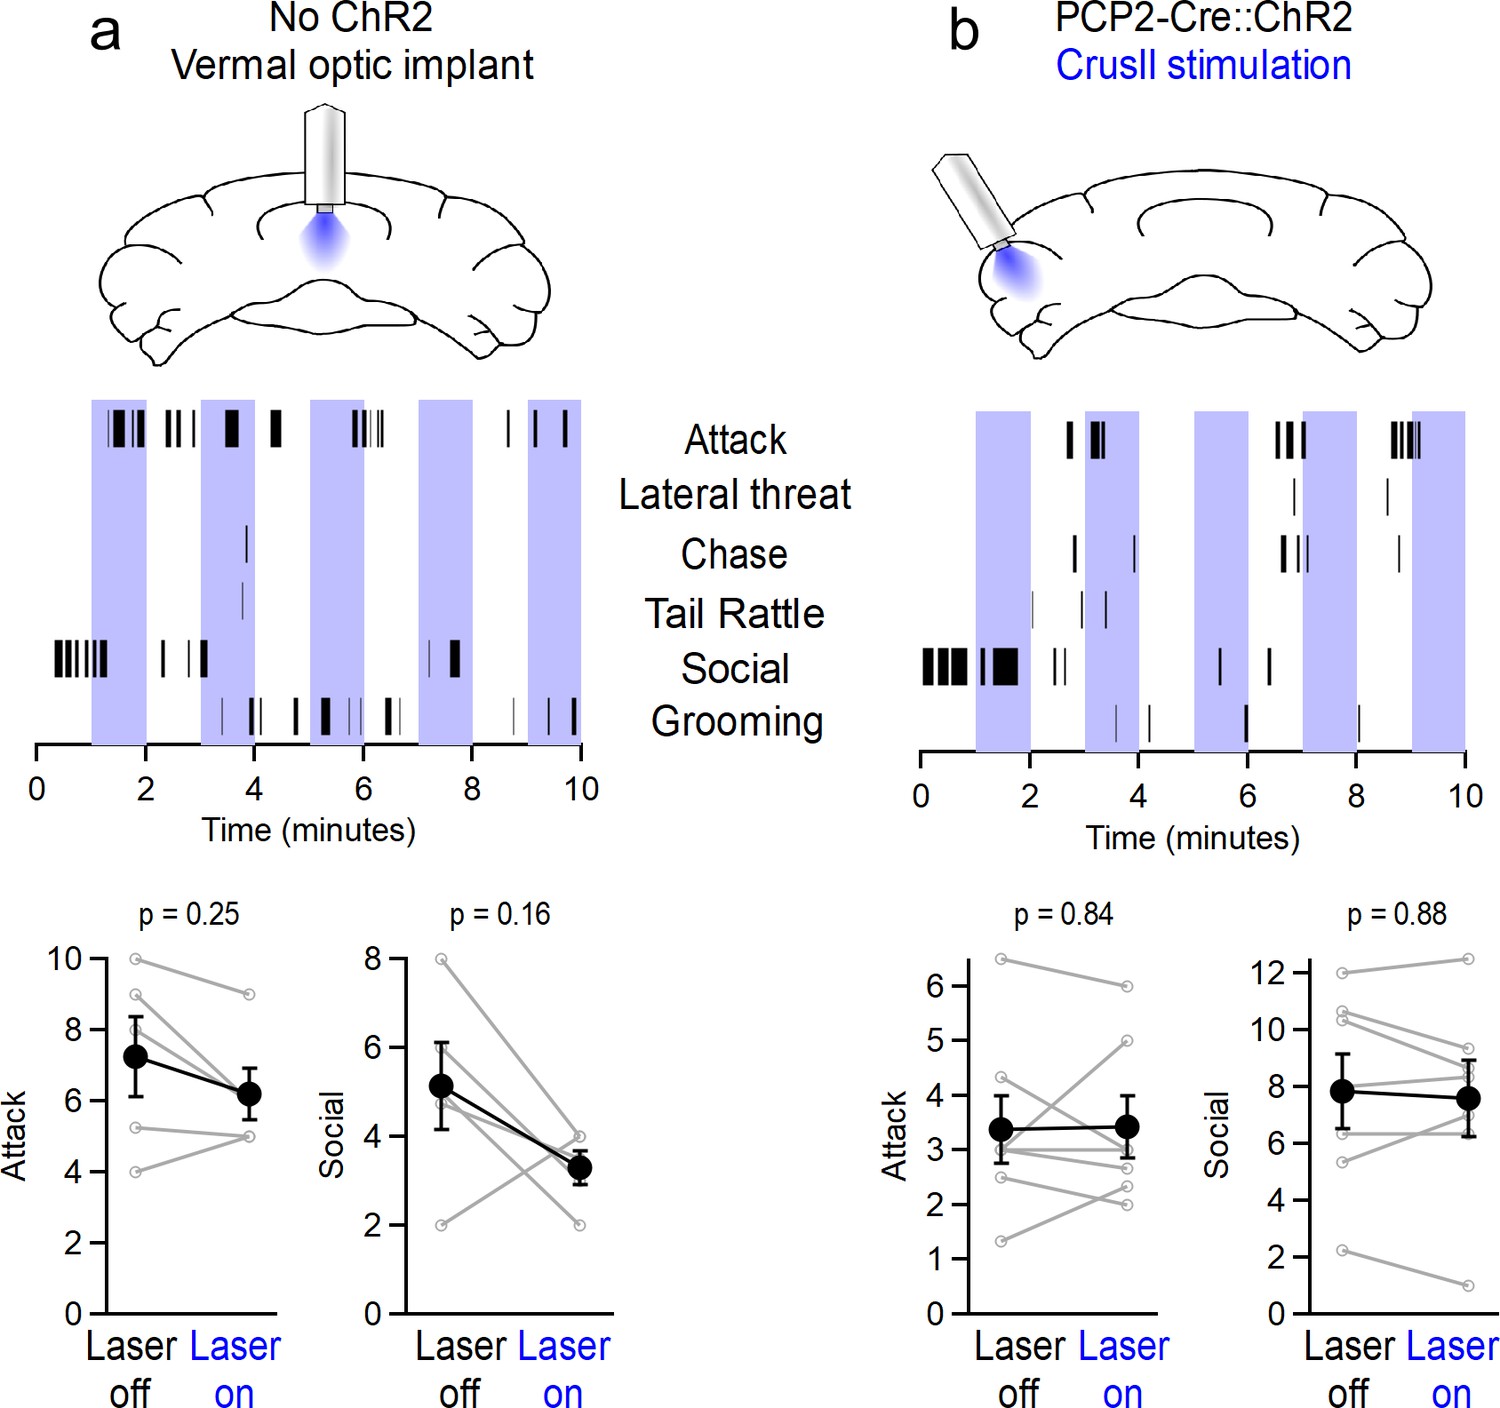
Aggression is not affected by light alone or by stimulating Crus II Purkinje cells.
(a) (Top) Schematic for optical stimulation over vermis in wildtype mice lacking channelrhodopsin. (Middle) Representative sequence of social and aggressive behaviors. (Bottom) Average number of attacks and social investigations during ON/OFF epochs of laser stimulation. (b) Same as in (a), but for PCP2-Cre::ChR2-YFP mice implanted with optical fibers over the lateral Crus II region of the cerebellum.
-
Figure 3—figure supplement 3—source data 1
Data for Figure 3—figure supplement 3A.
- https://cdn.elifesciences.org/articles/53229/elife-53229-fig3-figsupp3-data1-v2.xlsx
-
Figure 3—figure supplement 3—source data 2
Data for Figure 3—figure supplement 3B.
- https://cdn.elifesciences.org/articles/53229/elife-53229-fig3-figsupp3-data2-v2.xlsx
Author response image 1

Additional files
Download links
A two-part list of links to download the article, or parts of the article, in various formats.
Downloads (link to download the article as PDF)
Open citations (links to open the citations from this article in various online reference manager services)
Cite this article (links to download the citations from this article in formats compatible with various reference manager tools)
Cerebellar Purkinje cell activity modulates aggressive behavior
eLife 9:e53229.
https://doi.org/10.7554/eLife.53229


