Fatty acid β-oxidation is required for the differentiation of larval hematopoietic progenitors in Drosophila
- Developmental Genetics Laboratory, Department of Biological Sciences, Indian Institute of Science Education and Research (IISER) Mohali, India
- Molecular Cell and Developmental Biology Laboratory, Department of Biological Sciences, Indian Institute of Science Education and Research (IISER) Mohali, India
Figures
Figure 1 with 2 supplements
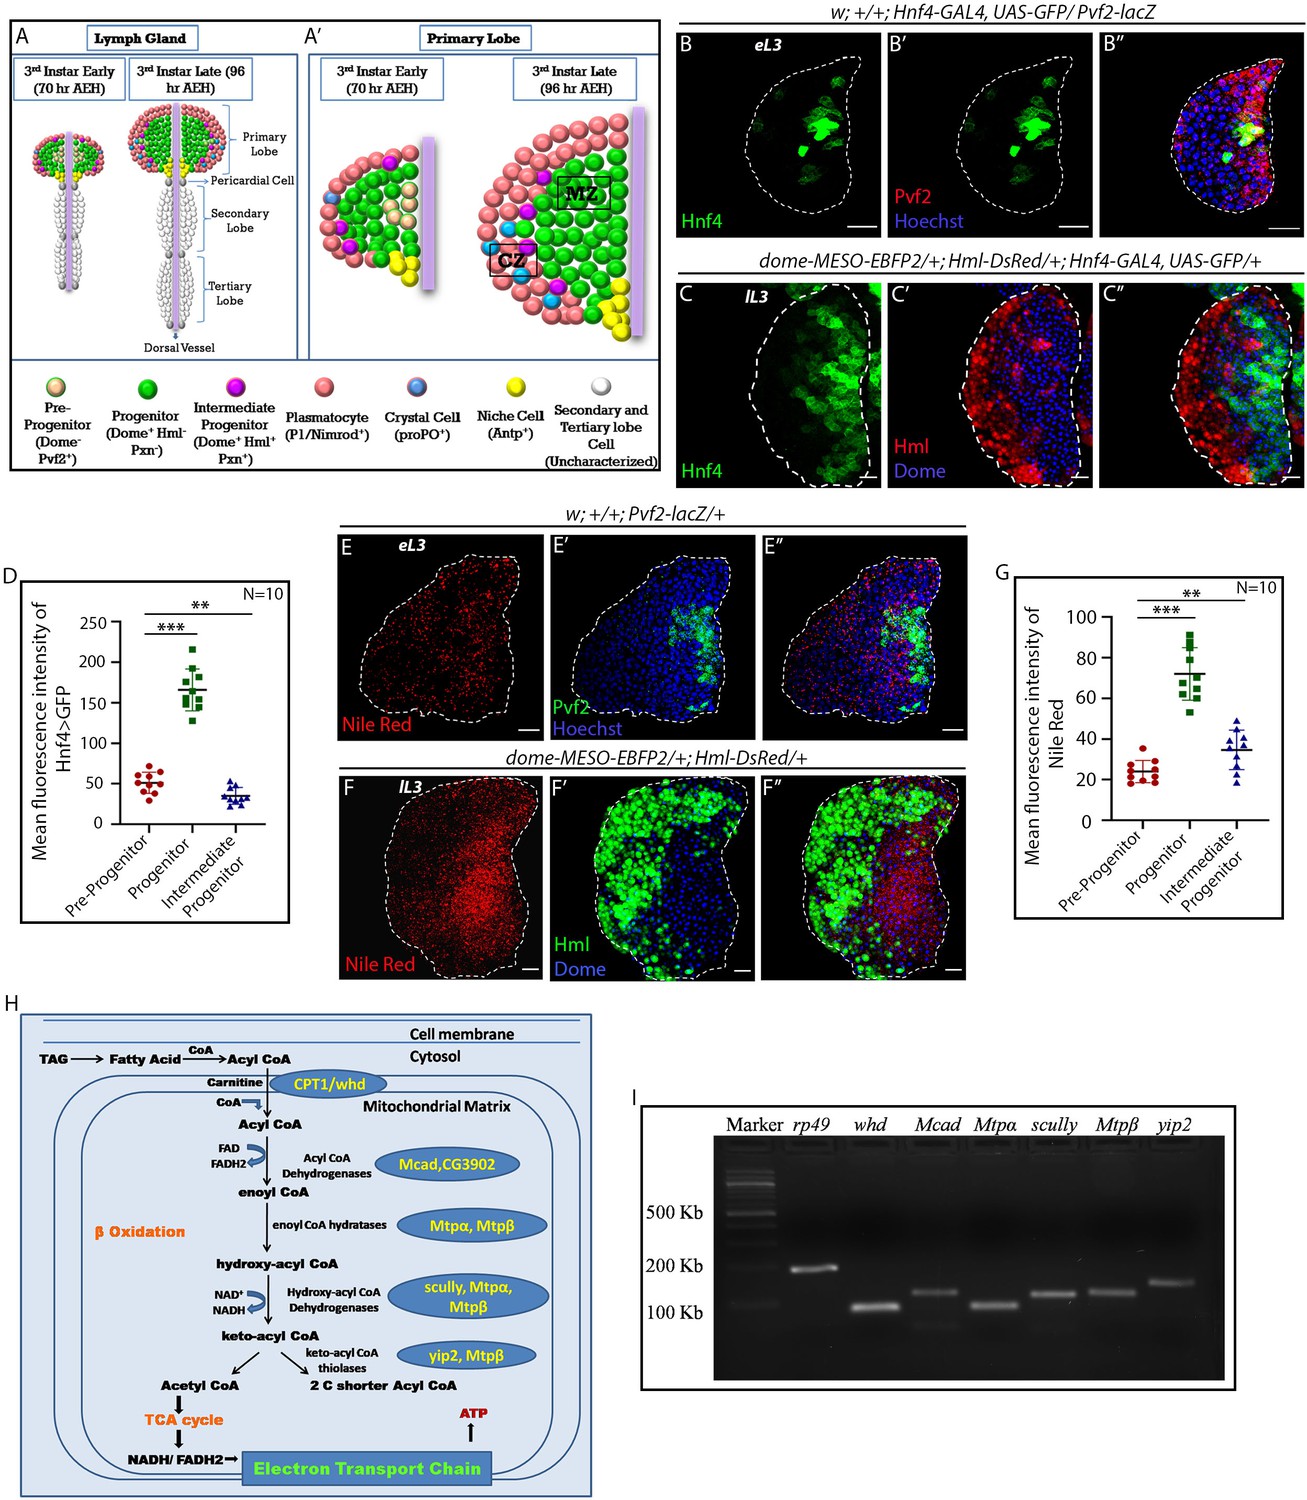
FAO genes are expressed in hemocyte progenitors of lymph gland.
Age and genotype of the larvae are mentioned in respective panels. (A–A') Model of lymph gland of third early and third late instar stages depicting anterior primary lobes and posterior lobes. (A’). Primary lobe showing different subpopulations: Pvf2+ Dome- pre-progenitor, Dome+ progenitors and Dome+ Pxn+ Hml+ Intermediate progenitors (IPs) in early third and late third instar larval stages. Progenitors are present in the core of the primary lobe called the medullary zone (MZ), and differentiated cells (Plasmatocytes and crystal cells) are present in the outer zone called cortical zone (CZ). (B–B'') Expression of Hnf4-GAL4 > UAS-GFP in Pvf2+ pre-progenitors of the early third instar lymph gland. (C–C'') Expression of Hnf4-GAL4 > UAS-GFP in Dome+ progenitors and Dome+ Hml+ Intermediate progenitors (IPs) shown in dome-MESO-EBFP2/+; Hml-DsRed/+ genotype. (D). Quantitative analysis of B–C''- reveals that the Dome+ progenitors have higher levels of Hnf4 expression. p-Value for Hnf4-GAL4 > UAS-GFP expression in Dome+ progenitors is 9.55 × 10⁻⁹ compared to control Pvf2+ pre-progenitors. p-Value for Hnf4-GAL4 > UAS-GFP expression for Dome+ Hml+ IPs is 7.34 × 10⁻³ compared to control Pvf2+ pre-progenitors. (E–E'') Nile red staining in Pvf2+ pre-progenitors of early third instar stage lymph gland. (F–F'') Expression of Nile red in Dome+ progenitors and Dome+ Hml+ Intermediate progenitors (IPs) shown in dome-MESO-EBFP2/+; Hml-DsRed/+ genotype (Dome+: blue, Hml+: green). (G). Quantitative analysis of E–F'' shows higher levels of neutral lipids in the Dome+ progenitors. Compared to control Pvf2+ pre-progenitors, p-Values for nile red expression in Dome+ progenitors is 1.39 × 10⁻⁷ and Dome+ Hml+ IPs pre-progenitors is 9.11 × 10⁻³. Five optical sections of 1 µm thickness from the middle of the Z-stack were merged into a single section. (H) Schematic representation of FAO and the constituent enzymes. (I) Transcripts of β-oxidation enzymes, whd, Mcad, Mtpα, scully, Mtpβ, and yip2 (Refer to H) can be detected in the third late instar lymph gland. eL3 and lL3 refer to the early and late instar lymph glands. Individual dots represent biological replicates. Values are mean ± SD, asterisks mark statistically significant differences (*p<0.05; **p<0.01; ***p<0.001, Student’s t-test). Scale bar: 20 µm.
-
Figure 1—source data 1
Contains numerical data plotted in Figure 1D and G.
- https://cdn.elifesciences.org/articles/53247/elife-53247-fig1-data1-v2.xlsx
Figure 1—figure supplement 1
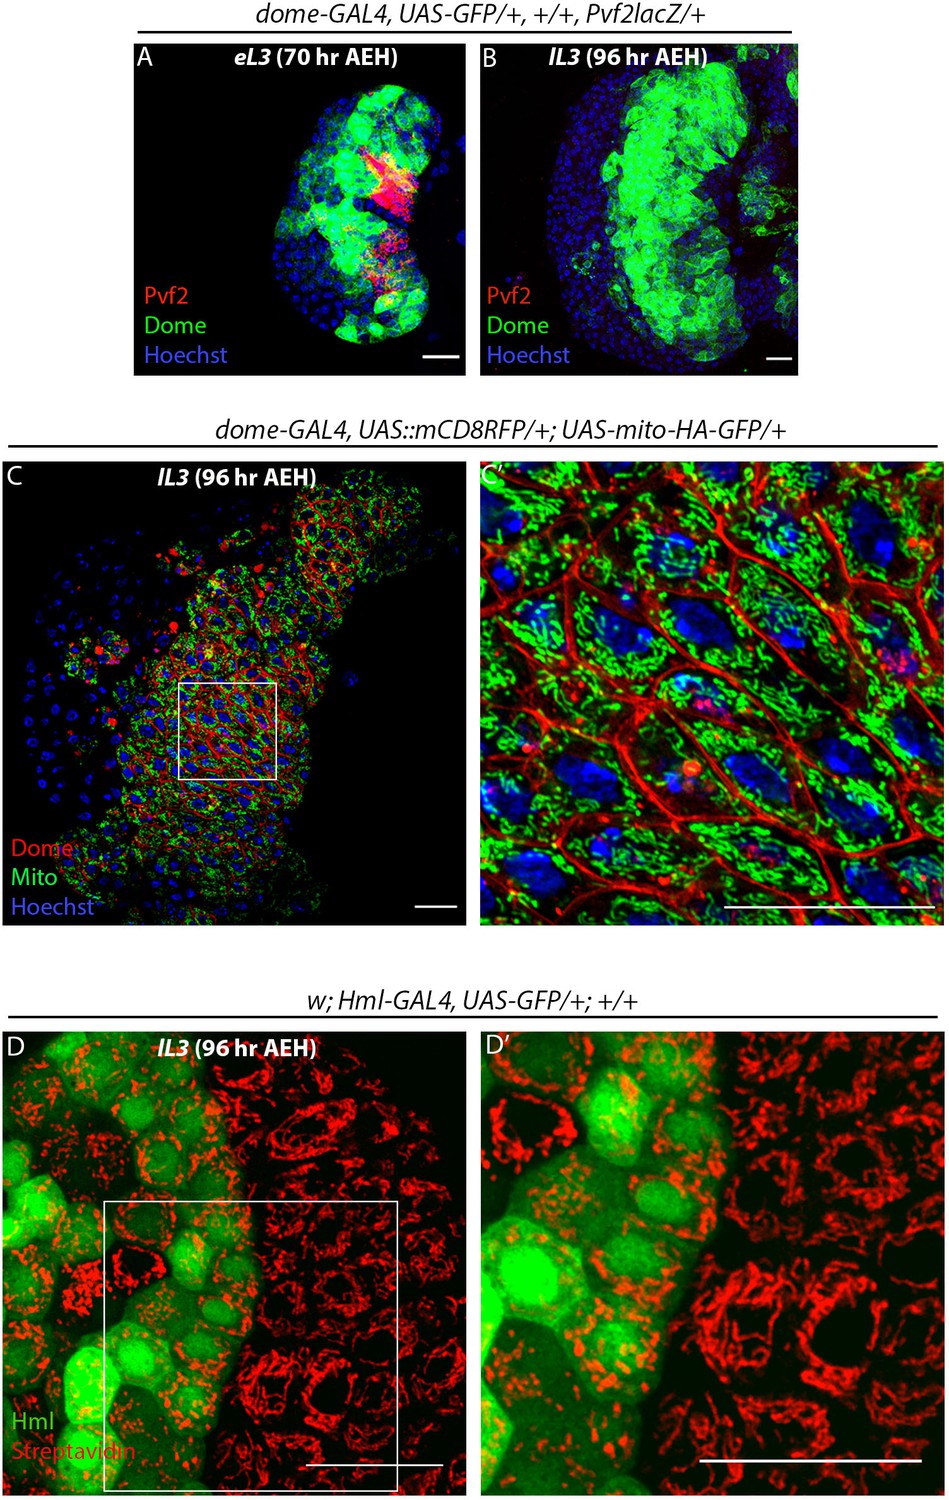
Temporal analysis of pre-progenitors in the lymph gland and mitochondrial analysis in Dome+ progenitors.
Age and genotype of the larvae are mentioned in respective panels. (A–B) Expression of Pvf2 in Dome- pre-progenitors in third early instar lymph gland (A) late third instar lymph glands lack Pvf2 expression as well as Dome- pre-progenitors (B). (C–C') Super-resolution image of mitochondria in Dome+ progenitors visualized by dome-GAL4, UAS::mCD8RFP/+; UAS-mito-HA-GFP. Five optical sections of 0.33 µm thickness from the middle of the Z -stack were merged into a single section. (C') is the higher magnification of region of interest (ROI) from C). (D–D') Image of mitochondria in Hml+ differentiated hemocytes and Hml- progenitors of the lymph gland visualized by Streptavidin-Cy3. (D') is the higher magnification of ROI from D. eL3 and lL3 refer to the early and late instar lymph glands. Scale bar: 20 µm.
Figure 1—figure supplement 2
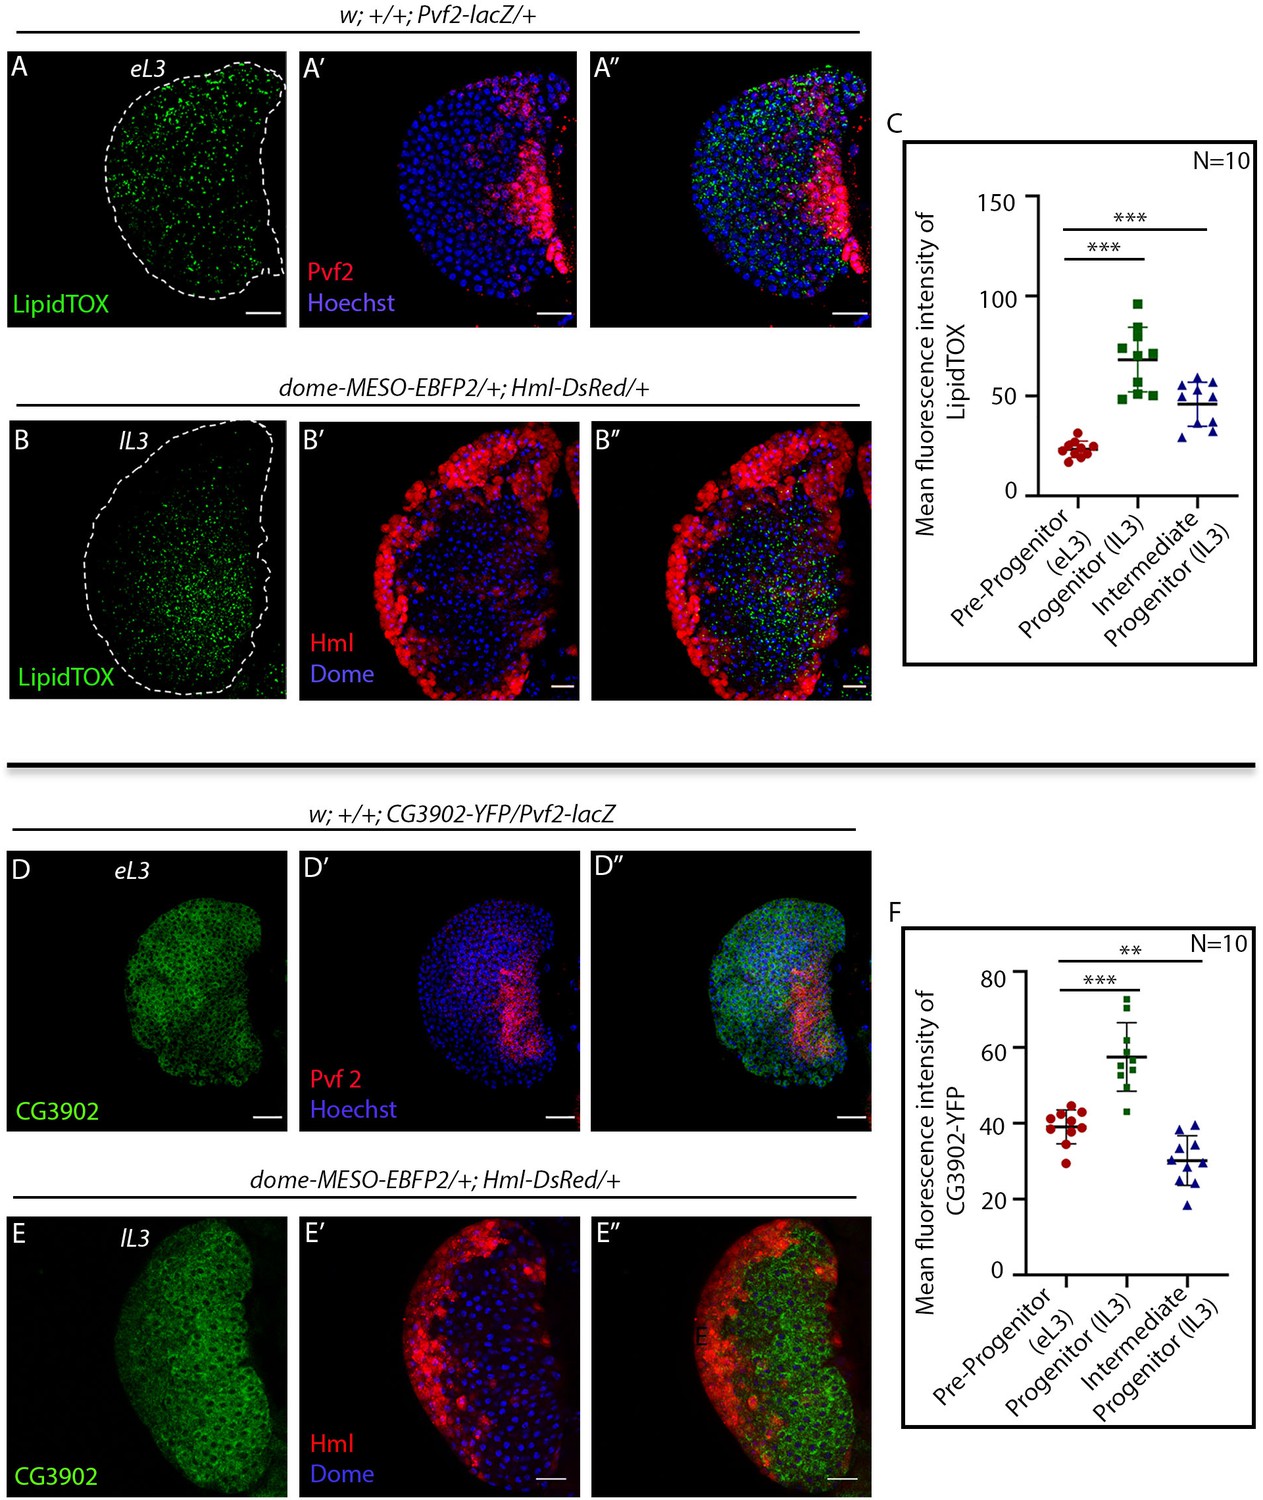
FAO components are expressed in hemocyte progenitor subpopulations in the lymph gland.
Age and genotype of the larvae are mentioned in respective panels. (A–A'') LipidTOX labeling neutral lipids in Pvf2+ pre-progenitors in the early third instar lymph gland. (B–B''). LipidTOX labeling in Dome+ progenitors and Dome+ Hml+ Intermediate progenitors (IPs) shown in dome-MESO-EBFP2/+; Hml-DsRed/+ genotype. (C). Quantitative analysis of results from A–B'' showing a higher level of neutral lipids in Dome+ progenitors. Compared to control Pvf2+ pre-progenitors, p-Values for lipidTOX labeling in Dome+ progenitors is 6.20 × 10⁻⁶ and Dome+ Hml+ IPs is 6.84 × 10⁻⁵. Five optical sections of 1 µm thickness from the middle of a the Z-stack were merged into a single section. (D–D'') Expression of acyl-CoA dehydrogenase, CG3902-YFP expression in Pvf2+ pre-progenitors in the early third instar lymph gland. (E–E''). CG3902-YFP expression in Dome+ progenitors and Dome+ Hml+ Intermediate progenitors (IPs) shown in dome-MESO-EBFP2/+; Hml-DsRed/+ genotype. (F). Quantitative analysis of results from D–E'' reveals high levels of CG3902-YFP expression in the Dome+ progenitors. p-value for CG3902-YFP labeling in Dome+ progenitors is 6.02 × 10⁻⁵ compared to control Pvf2+ pre-progenitors and for Dome+ Hml+ IPs is 2.70 × 10⁻³. Five optical sections of 1 µm thickness from the middle of the Z-stack were merged into a single section. Individual dots represent biological replicates. Values are mean ± SD, asterisks mark statistically significant differences (*p<0.05; **p<0.01; ***p<0.001, Student’s t-test). Scale bar: 20 µm.
-
Figure 1—figure supplement 2—source data 1
Contains numerical data plotted in Figure 1—figure supplement 2C and F.
- https://cdn.elifesciences.org/articles/53247/elife-53247-fig1-figsupp2-data1-v2.xlsx
Figure 2 with 2 supplements
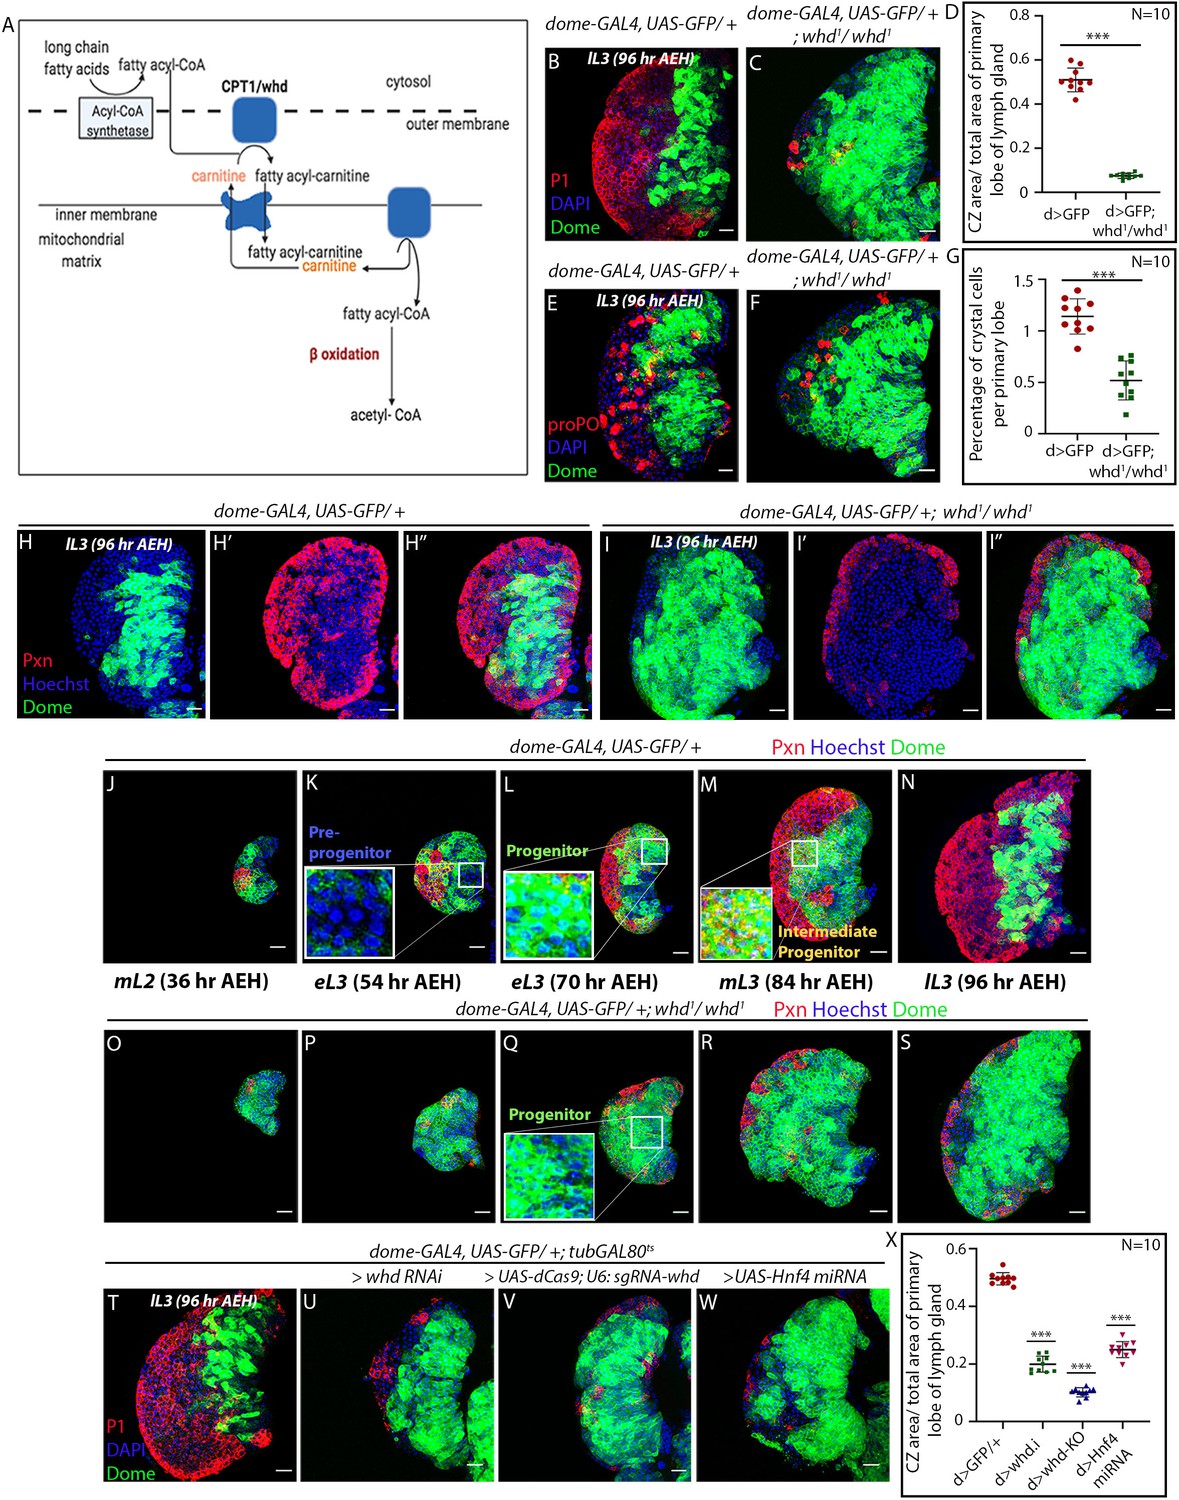
Loss of fatty acid β-oxidation affected differentiation of hemocyte progenitors of the lymph gland.
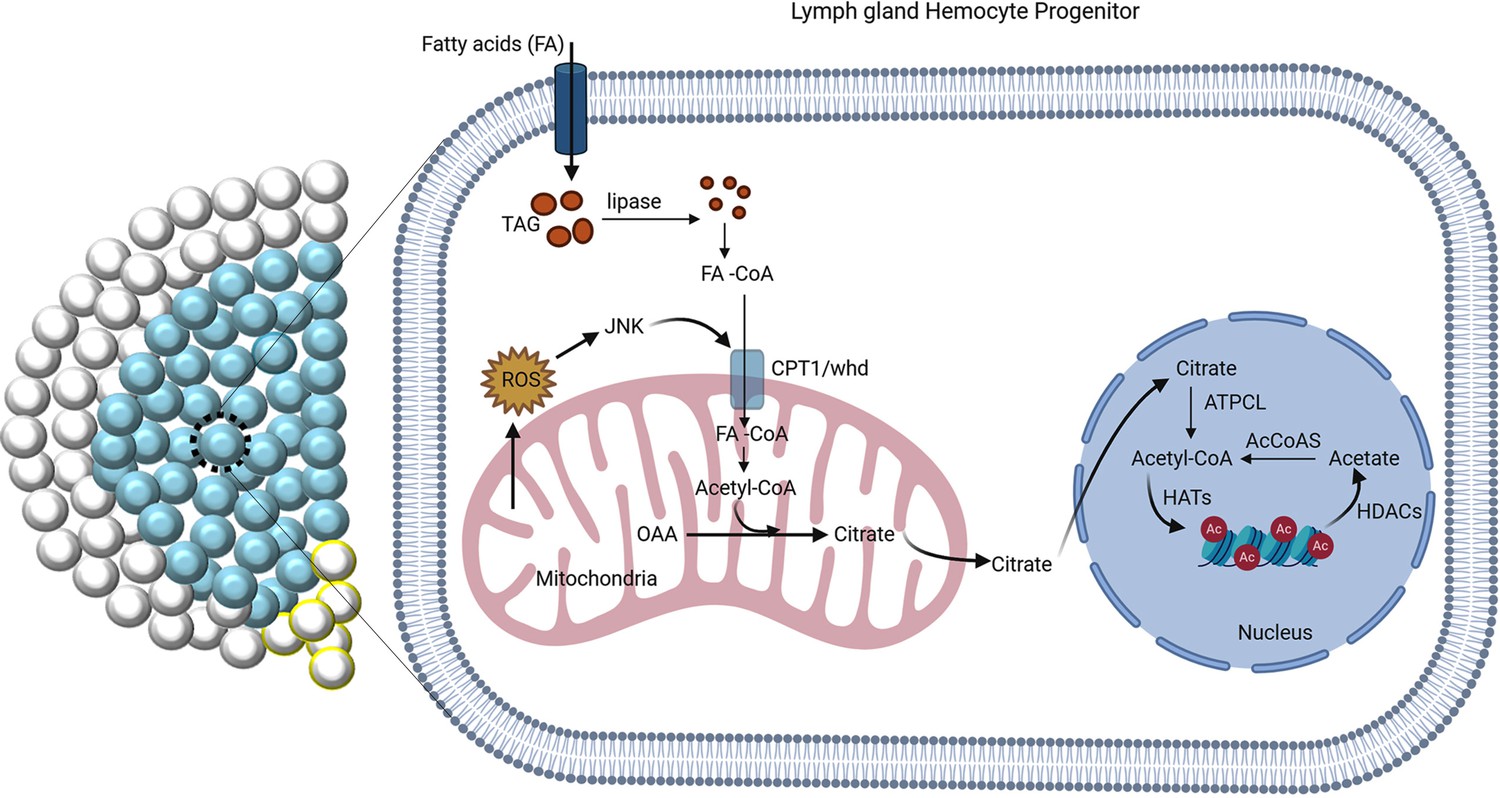
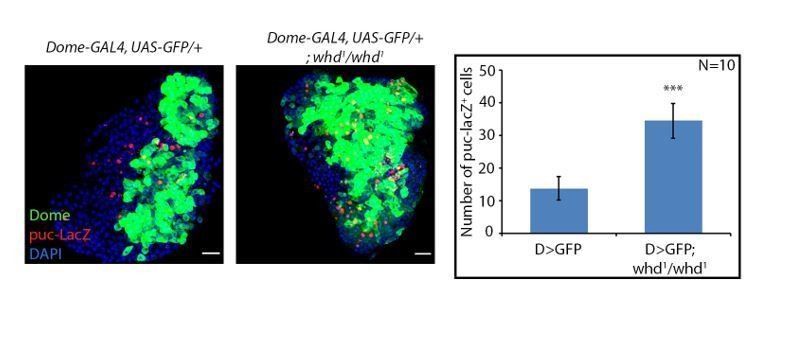
(A) Schematic representation of fatty acid β-oxidation within the mitochondria of a cell. (B–D) Compared to control (B) decrease in differentiation (red, reported by P1 immunostaining) and increment in progenitor number (dome > GFP) is observed in the lymph gland of a homozygous null allele of whd (C). (D) Quantitative analysis of B–C reveals a significant increment in the number of Dome+ progenitors. p-Value for dome-GAL4, UAS-GFP; whd1/whd1=2.67×10−10 compared to control. (E–G) Compared to control (E) decrease in crystal cell number (red, reported by proPO immunostaining) and increment in the progenitor cell population (dome > GFP) is observed in the lymph gland of the homozygous null allele of whd (F). (G). Quantitative analysis of results from E–F shows a significant drop in the number of crystal cells. p-Value for dome-GAL4, UAS-GFP; whd1/whd1=4.38×10−7 compared to control. (H–I'') The hemocyte progenitor subpopulation dynamics (red, reported by Pxn immunostaining and green marking dome > GFP) of Dome+ progenitors and Dome+ Pxn+ (IPs) in the late third instar lymph gland of control (H–H'') and homozygous null allele of whd (I–I''). (J–S) Spatio-temporal analysis of hemocyte progenitor subpopulations of Dome- pre-progenitors, Dome+ progenitors, and Dome+ Pxn+ (IPs) (red, reported by Pxn immunostaining and green marking dome > GFP) observed in the lymph gland of control (J–N) and homozygous null allele of whd (O–S). Insets in K, L, and M show pre-progenitors, progenitors and intermediate progenitors respectively in control and inset in Q shows abundant progenitors in the homozygous null allele of whd. (T–X) Compared to control (T) decrease in differentiation (red, reported by P1 immunostaining) and increase in progenitor number (dome > GFP) is observed in lymph gland upon progenitor specific RNAi based down-regulation of whd (U) CRISPR-Cas9 based knock-out of whd (V) and miRNA based knockdown of Hnf4 (W). (X) Quantitative analysis of the results from T–W, illustrating the significant increase in Dome+ progenitors upon targeted loss of FAO. p-Value for dome-GAL4, UAS-GFP; tubGAL80ts20 > UAS-whd RNAi = 2.84×10⁻¹⁵ compared to control. p-Value for dome-GAL4, UAS-GFP; tubGAL80ts20 > UAS-dCas9; U-6: sgRNA-whd = 3.84×10⁻¹⁹. p-Value for dome-GAL4, UAS-GFP; tubGAL80ts20 > UAS-Hnf4.miRNA =6.04×10⁻¹⁴. Individual dots represent biological replicates. Values are mean ± SD, asterisks mark statistically significant differences (*p<0.05; **p<0.01; ***p<0.001, Student’s t-test). Scale bar: 20 µm.
-
Figure 2—source data 1
Contains numerical data plotted in Figure 2D,G and X.
- https://cdn.elifesciences.org/articles/53247/elife-53247-fig2-data1-v2.xlsx
Figure 2—figure supplement 1
Fatty acid β-oxidation is essential for lymph gland progenitor differentiation.
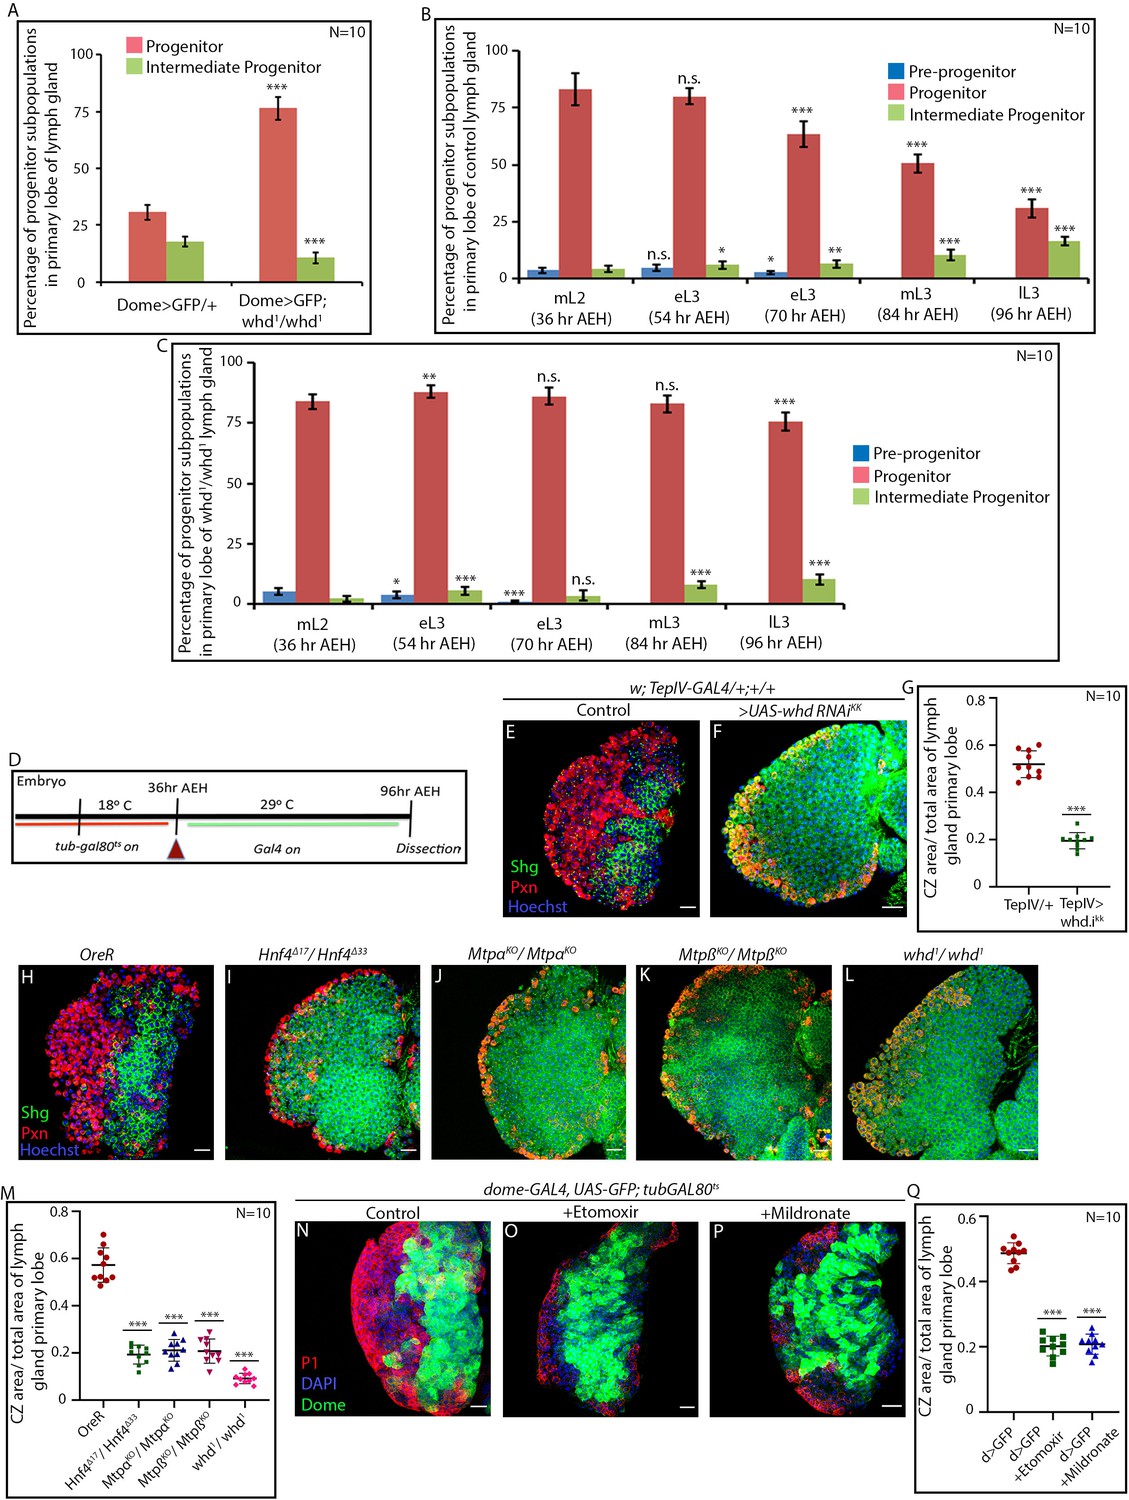
(A) Quantitative analysis of results from Figure 2H–I''. p-Value for progenitors of dome-GAL4, UAS-GFP; whd1/whd1 = 5.7×10⁻¹⁴ compared to control. p-Value for Intermediate progenitors of dome-GAL4, UAS-GFP; whd1/whd1 = 1.33×10⁻⁶ compared to control. (B) Quantitative analysis of results from Figure 2J–N. p-Value for pre-progenitors of eL3 (54 hr AEH) dome-GAL4, UAS-GFP = 5.95×10⁻² compared to pre-progenitors of mL2 (36 hr AEH) dome-GAL4, UAS-GFP. p-Value for progenitors of eL3 (54 hr AEH) dome-GAL4, UAS-GFP = 2.34×10⁻¹ compared to progenitors of mL2 (36 hr AEH) dome-GAL4, UAS-GFP. p-Value for IPs of eL3 (54 hr AEH) dome-GAL4, UAS-GFP = 1.7×10⁻² compared to IPs of mL2 (36 hr AEH) dome-GAL4, UAS-GFP. p-Value for pre-progenitors of eL3 (70 hr AEH) dome-GAL4, UAS-GFP = 3.2×10⁻² compared to pre-progenitors of mL2 (36 hr AEH) dome-GAL4, UAS-GFP. p-Value for progenitors of eL3 (70 hr AEH) dome-GAL4, UAS-GFP = 2.74×10⁻⁶ compared to progenitors of mL2 (36 hr AEH) dome-GAL4, UAS-GFP. p-Value for IPs of eL3 (70 hr AEH) dome-GAL4, UAS-GFP = 4.5×10⁻³ compared to IPs of mL2 (36 hr AEH) dome-GAL4, UAS-GFP. p-Value for progenitors of mL3 (84 hr AEH) dome-GAL4, UAS-GFP = 3.2×10⁻⁹ compared to progenitors of mL2 (36 hr AEH) dome-GAL4, UAS-GFP. p-Value for IPs of mL3 (84 hr AEH) dome-GAL4, UAS-GFP = 4.999×10⁻⁶ compared to IPs of mL2 (36 hr AEH) dome-GAL4, UAS-GFP. p-Value for progenitors of lL3 (96 hr AEH) dome-GAL4, UAS-GFP = 6.117×10⁻¹² compared to progenitors of mL2 (36 hr AEH) dome-GAL4, UAS-GFP. p-Value for IPs of lL3 (96 hr AEH) dome-GAL4, UAS-GFP = 2.8×10⁻¹¹ compared to IPs of mL2 (36 hr AEH) dome-GAL4, UAS-GFP. (C) Quantitative analysis of results from Figure 2O–S. p-Value for pre-progenitors of eL3 (54 hr AEH) dome-GAL4, UAS-GFP; whd1/whd1 = 3.3×10⁻² compared to pre-progenitors of mL2 (36 hr AEH) dome-GAL4, UAS-GFP; whd1/whd1. p-Value for progenitors of eL3 (54 hr AEH) dome-GAL4, UAS-GFP; whd1/whd1 = 6.3×10⁻³ compared to progenitors of mL2 (36 hr AEH) dome-GAL4, UAS-GFP; whd1/whd1. p-Value for IPs of eL3 (54 hr AEH) dome-GAL4, UAS-GFP; whd1/whd1 = 2.46×10⁻⁴ compared to IPs of mL2 (36 hr AEH) dome-GAL4, UAS-GFP; whd1/whd1. p-Value for pre-progenitors of eL3 (70 hr AEH) dome-GAL4, UAS-GFP; whd1/whd1 = 7.85×10⁻⁷ compared to pre-progenitors of mL2 (36 hr AEH) dome-GAL4, UAS-GFP; whd1/whd1. p-Value for progenitors of eL3 (70 hr AEH) dome-GAL4, UAS-GFP; whd1/whd1 = 1.78×10⁻¹ compared to progenitors of mL2 (36 hr AEH) dome-GAL4, UAS-GFP; whd1/whd1. p-Value for IPs of eL3 (70 hr AEH) dome-GAL4, UAS-GFP; whd1/whd1 = 1.8×10⁻¹ compared to IPs of mL2 (36 hr AEH) dome-GAL4, UAS-GFP; whd1/whd1. p-Value for progenitors of mL3 (84 hr AEH) dome-GAL4, UAS-GFP; whd1/whd1 = 4.78×10⁻¹ compared to progenitors of mL2 (36 hr AEH) dome-GAL4, UAS-GFP; whd1/whd1. p-Value for IPs of eL3 (84 hr AEH) dome-GAL4, UAS-GFP; whd1/whd1 = 1.75×10⁻⁸ compared to IPs of mL2 (36 hr AEH) dome-GAL4, UAS-GFP; whd1/whd1. p-Value for progenitors of lL3 (96 hr AEH) dome-GAL4, UAS-GFP; whd1/whd1 = 4.47×10⁻⁵ compared to progenitors of mL2 (36 hr AEH) dome-GAL4, UAS-GFP; whd1/whd1. p-Value for IPs of lL3 (96 hr AEH) dome-GAL4, UAS-GFP; whd1/whd1 = 5.25×10⁻⁸ compared to IPs of mL2 (36 hr AEH) dome-GAL4, UAS-GFP; whd1/whd1. (D) Schematic representation of the timeline of experiments involving dome-GAL4, UAS-GFP; tubGAL80ts20 mediated targeted knockdown of specific gene expression for this study. (E–G) Compared to control (E), the status of differentiation {red, CZ indicated by Pxn and progenitors of MZ marked by shg/DE-cadherin (green)} of hemocyte progenitor are compromised upon down-regulation of whd function. Independent progenitor specific driver TepIV-GAL4, along with a UAS-whd RNAiKK obtained from VDRC endorses our previous findings (F). (G). Quantitative analysis of the results from E–G. p-Value for TepIV-GAL4 >UAS whd RNAi = 1.43×10⁻¹⁰ compared to control. (H–M) Compared to control (H), the status of differentiation {red, CZ indicated by Pxn and progenitors of MZ marked by shg/DE-cadherin (green)} of hemocyte progenitor are compromised in heteroallelic null loss of function of Hnf4 (I), homozygous null loss of function alleles of Mtpα (J), Mtpβ (K), and whd (L). (M) Quantitative analysis of results from H–L depicting less differentiation in FAO null. p-Value for Hnf4Δ33/Hnf4Δ17 = 9.55×10⁻¹⁰ and p-Value for MtpαKO/MtpαKO =1.01×10−09 and p-value for MtpβKO/MtpβKO =6.37×10⁻¹⁰ and p-Value for whd1/whd1 = 9.33×10⁻¹⁰ compared to control. (N–Q) Blocking Fatty Acid β-oxidation by feeding Etomoxir (O) and Mildronate (P) decreases progenitor differentiation compared to control dome > GFP (N). (Q). Quantitative analysis of the results from N–P) shows a drop in differentiation upon pharmaceutical inhibition of FAO. p-Value for dome-GAL4, UAS-GFP; tubGAL80ts20 treated with Etomoxir = 6.803×10⁻¹⁴ compared to control and dome-GAL4, UAS-GFP; tubGAL80ts20 treated with Mildronate = 1.17×10⁻¹³. Individual dots represent biological replicates. Values are mean ± SD, asterisks mark statistically significant differences (*p<0.05; **p<0.01; ***p<0.001, Student’s t-test). Scale bar: 20 µm.
-
Figure 2—figure supplement 1—source data 1
Contains numerical data plotted in Figure 2—figure supplement 1A,B,C,G,M and Q.
- https://cdn.elifesciences.org/articles/53247/elife-53247-fig2-figsupp1-data1-v2.xlsx
Figure 2—figure supplement 2
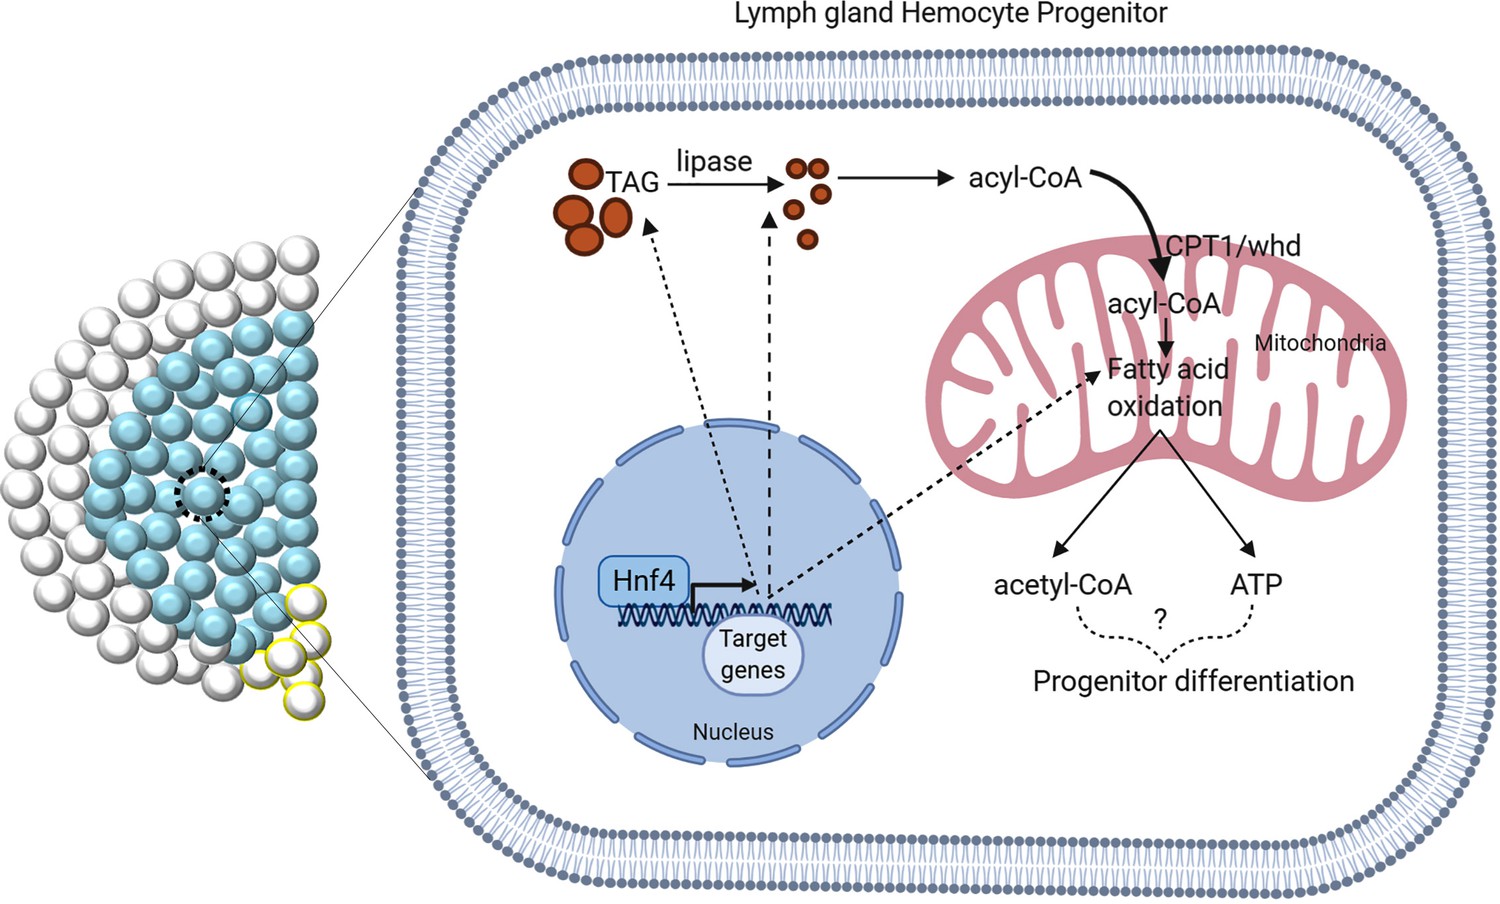
Model depicting the posible role of Hnf4 and FAO in hemocyte progenitor differentiation.
Hnf4 is a transcription factor implicated in mobilization of fatty acids and its oxidation in Drosophila. Hnf4 as well as members of FAO expresses in the hemocyte progenitors, loss of either one of them affects differentiation.
Figure 3 with 1 supplement
Loss of fatty acid β-oxidation causes an increase in proliferation of hemocyte progenitors of the lymph gland primary lobe.
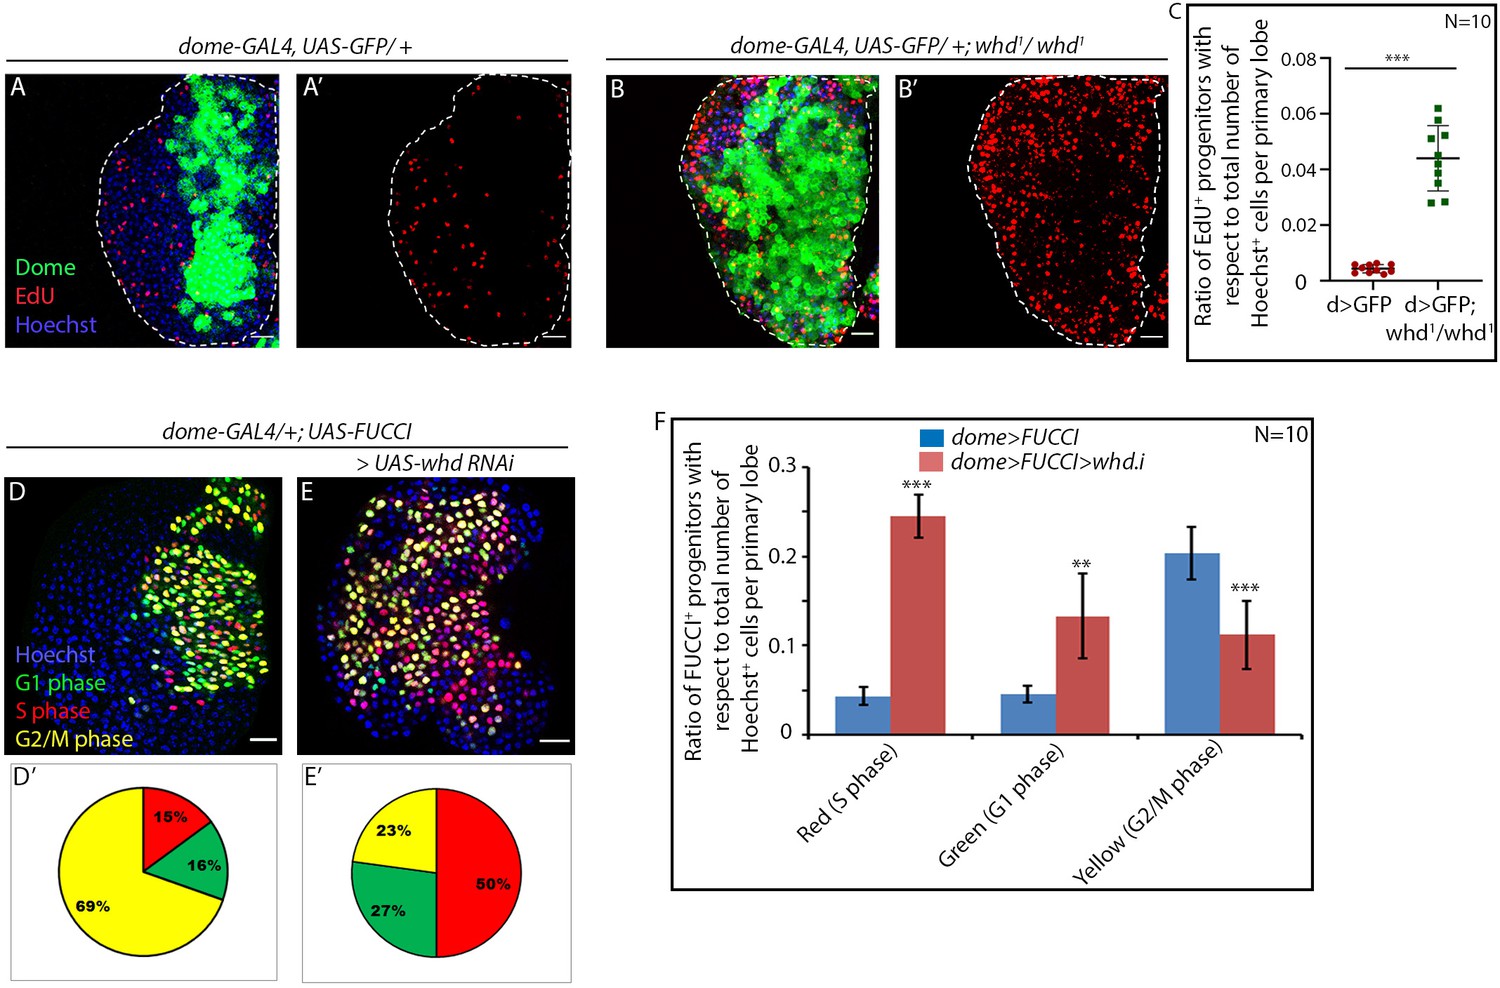
Genotype of the larvae are mentioned in respective panels. (A–C) The difference in proliferation status (reported by EdU incorporation) in the lymph gland of third late instar control larvae (A–A') compared to whd null mutant (B–B'). (C). Quantitative analysis of the results from A–B' illustrates a significant increase in proliferation in whd1 Dome+ progenitors. p-Value for dome-GAL4, UAS-GFP; whd1/whd1=1.71×10−6 compared to control. (D–F) Difference in cell cycle status (reported by Fly-FUCCI) in the lymph gland of third late instar control larvae (D) compared to the progenitor-specific RNAi-based down-regulation of whd (E). (D'–E'): Pie chart depicting the fraction of G1 (green), S(red), and G2/M (yellow) progenitors in J–K. (F) Quantitative analysis of the results from D–E. p-Value for red cells in dome-GAL4, UAS-Fly-FUCCI; UAS-whd RNAi = 1.41×10⁻¹¹, p-Value for green cells in dome-GAL4, UAS-Fly-FUCCI; UAS-whd RNAi = 2×10⁻⁴, p-Value for yellow cells in dome-GAL4, UAS-Fly-FUCCI; UAS-whd RNAi = 1.5×10⁻⁵ compared to control. ns.=not significant, Individual dots represent biological replicates. Values are mean ± SD, asterisks mark statistically significant differences (*p<0.05; **p<0.01; ***p<0.001, Student’s t-test). Scale bar: 20 µm.
-
Figure 3—source data 1
Contains numerical data plotted in Figure 3C,Dʹ, Eʹ and F.
- https://cdn.elifesciences.org/articles/53247/elife-53247-fig3-data1-v2.xlsx
Figure 3—figure supplement 1
Loss of fatty acid β-oxidation caused higher redox levels and an increase in maintenance factor of hemocyte progenitors of the lymph gland.
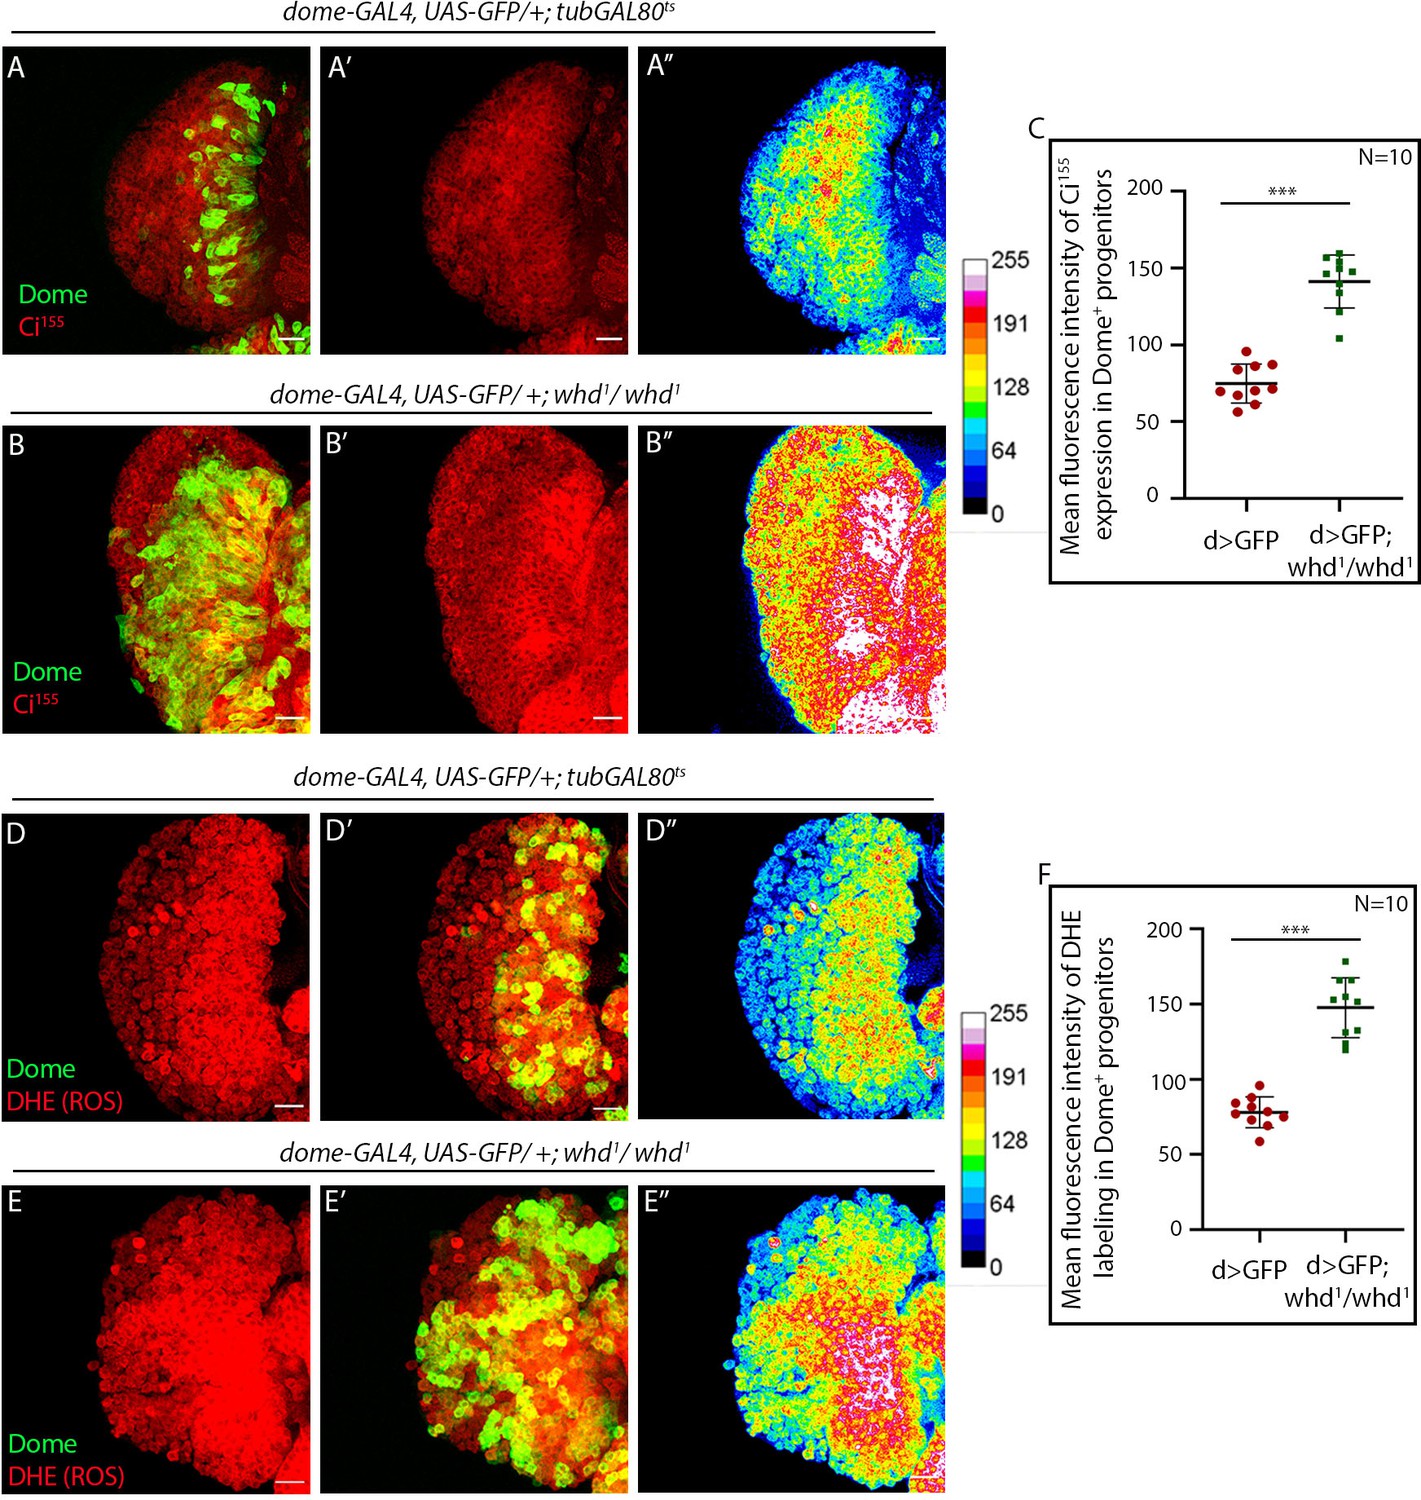
Genotype of the larvae are mentioned in respective panels. (A–C) Elevated levels of Ci155 in the lymph gland of whd1 homozygous mutants (B) compared to control (A). (A'' and B''): Heat map is representing the intensity of Ci155 in the lymph gland of whd1 homozygous mutants (Bʹ) compared to control (Aʹ). (C). Quantitative analysis of the results from A–B reveals that FAO loss results in high Ci155 expression.p-Value for dome-GAL4, UAS-GFP; whd1/whd1=2.78×10−8 compared to control. (D–F) DHE (ROS) level is elevated in lymph gland in whd1 homozygous mutants (E) compared to control (D). (D'' and E''): Heat map is representing the intensity of DHE in the lymph gland of whd1 homozygous mutants (Eʹ) compared to control (Dʹ). (F). Quantitative analysis of the results from D–E. p-Value for dome-GAL4, UAS-GFP; whd1/whd1=1.64×10−7 compared to control. Individual dots represent biological replicates. Values are mean ± SD, asterisks mark statistically significant differences (*p<0.05; **p<0.01; ***p<0.001, Student’s t-test). Scale bar: 20 µm.
-
Figure 3—figure supplement 1—source data 1
Contains numerical data plotted in Figure 3—figure supplement 1C and F.
- https://cdn.elifesciences.org/articles/53247/elife-53247-fig3-figsupp1-data1-v2.xlsx
Figure 4 with 1 supplement
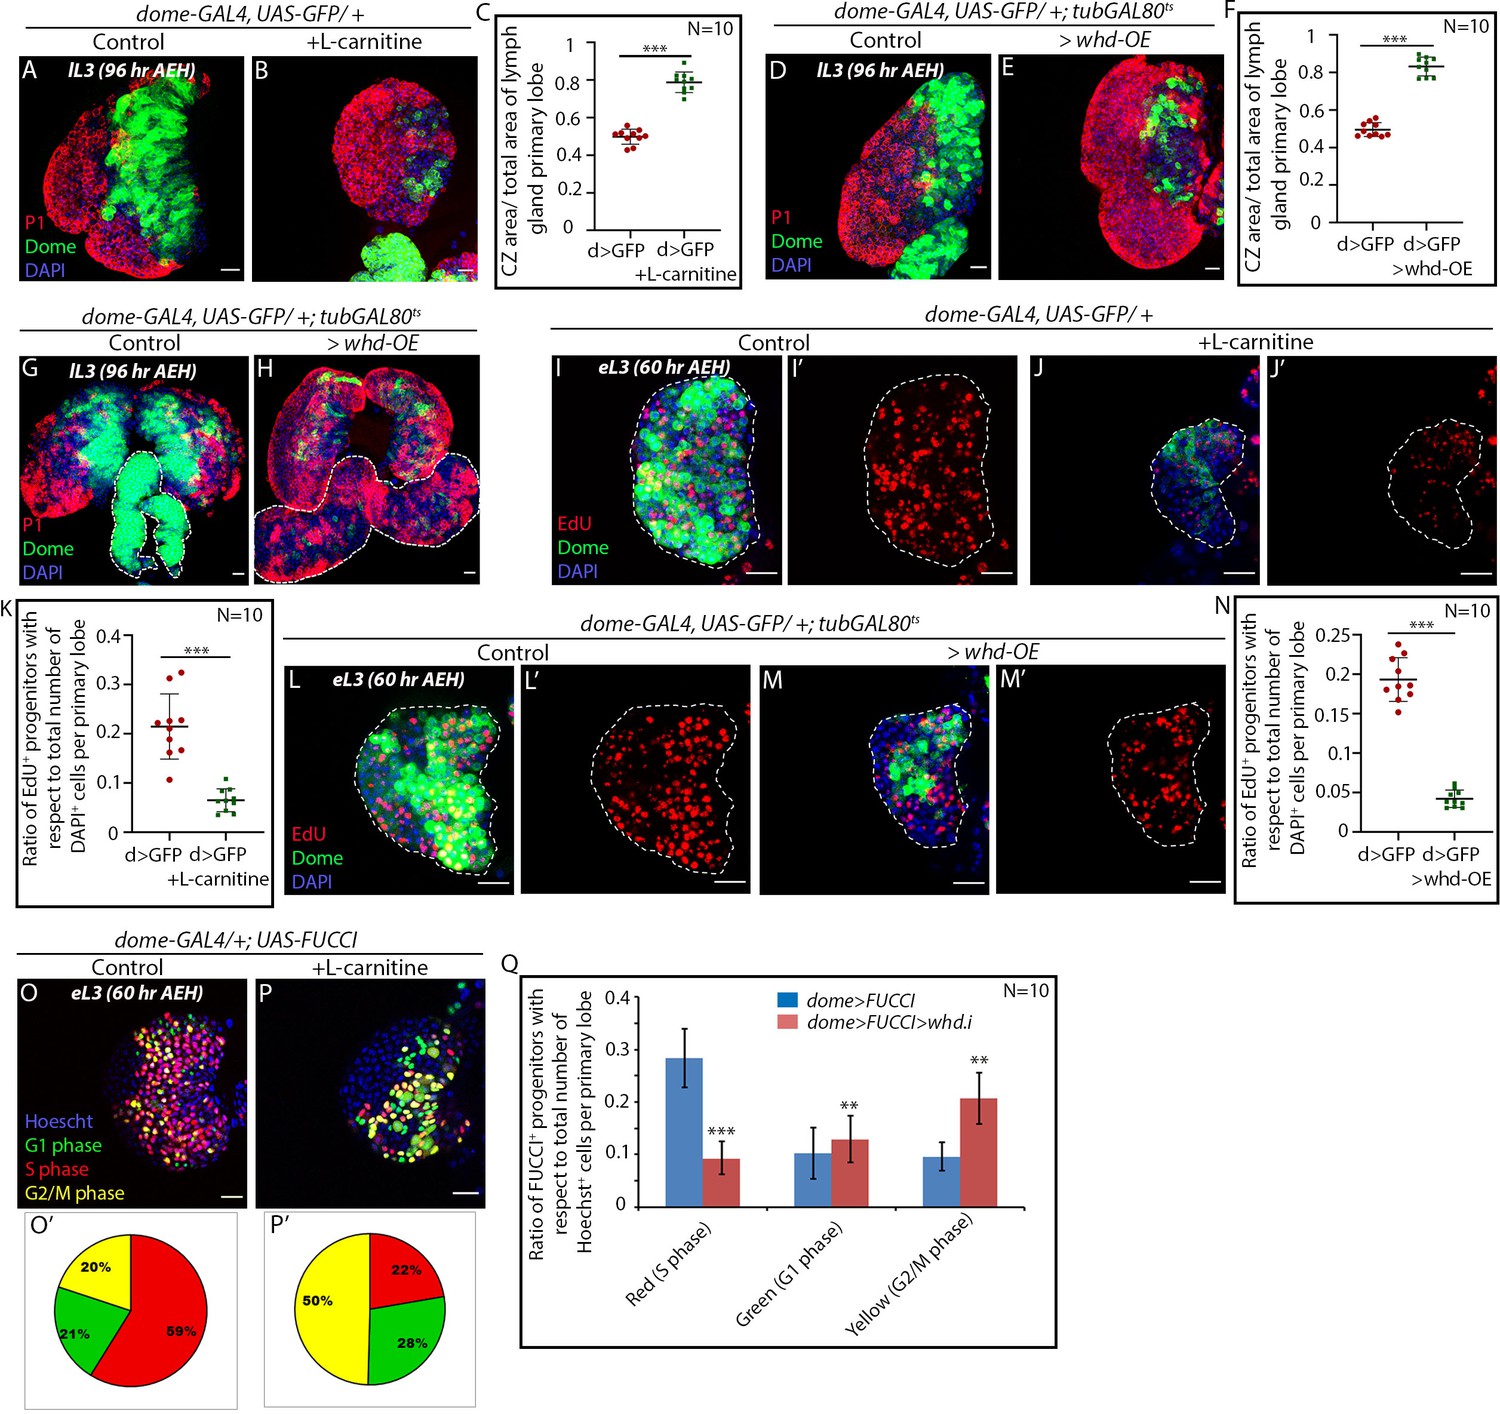
FAO upregulation results in precocious differentiation and G2 arrest in hemocyte progenitors.
Age and genotype of the larvae are mentioned in respective panels. (A–C) Comparison of differentiation (marked by P1) levels in dome > GFP lymph gland of control (A) and L-carnitine supplemented (B) larvae. (C) Quantitative analysis of results from A–B showing increased differentiation upon L-carnitine supplementation. p-Value for dome-GAL4, UAS-GFP = 2.37×10⁻¹⁰ supplemented with L-carnitine compared to control. (D–F) Comparison of differentiation (marked by P1) levels in dome > GFP lymph gland of control (D) and CRISPR-Cas9 mediated whd overexpression (E) in larval hemocyte progenitors. (F) Quantitative analysis of result from D–E depicting a significant increase in differentiation upon overexpression of whd. p-Value for dome-GAL4, UAS-GFP; tubGAL80ts20 > UAS-whd-OE = 5.82×10⁻¹² compared to control. (G–H) Comparison of differentiation (marked by P1) levels in dome > GFP lymph gland secondary lobes (marked by the white dotted boundary) of control (G) and CRISPR-Cas mediated whd overexpression (H) in larval hemocyte progenitors. (I–K) Proliferation status (marked by EdU) in third early instar hemocyte progenitors (dome > GFP) of control (I–I') and L-carnitine supplemented (J–J') larvae. (K) Quantitative analysis of results from I–J' reveals a decline in the number of proliferating Dome+ progenitors upon FAO overexpression. p-Value for dome-GAL4, UAS-GFP fed with L-carnitine = 2.87×10⁻⁵ compared to control. (L–N) The decline in proliferation status (marked by EdU) in third early instar hemocyte progenitors of CRISPR-Cas9 mediated whd overexpression (M–M') compared to (dome > GFP) of control (L–L'). (N) Quantitative analysis of result from L–M'. p-Value for dome-GAL4, UAS-GFP; tubGAL80ts20 > whd-OE=2.28×10⁻⁹ compared to control. (O–P) Alteration in cell cycle status (reported by Fly-FUCCI) in the lymph gland of third late instar larvae grown in L-carnitine supplemented food (P) compared to control (dome > UAS-FUCCI) (O). (O'–P'): Pie chart depicting the fraction of G1 (green), S (red), and G2/M (yellow) progenitors in (O-P). (Q) Quantitative analysis of the results from O–P, illustrating the increase in G2-M upon FAO overexpression. p-Value for red cells in L-carnitine supplemented dome-GAL4, UAS-FUCCI = 1.78×10⁻⁷, p-Value for green cells in L-carnitine supplemented dome-GAL4, UAS-FUCCI; UAS-whd RNAi = 2.16×10⁻¹. p-Value for yellow cells in L-carnitine supplemented dome-GAL4, UAS- FUCCI; UAS-whd RNAi = 1.71×10⁻⁵ compared to control. Individual dots represent biological replicates. Values are mean ± SD, asterisks mark statistically significant differences (*p<0.05; **p<0.01; ***p<0.001, Student’s t-test). Scale bar: 20 µm.
-
Figure 4—source data 1
Contains numerical data plotted in Figure 4C,F,K,N,Oʹ, Pʹ, and Q.
- https://cdn.elifesciences.org/articles/53247/elife-53247-fig4-data1-v2.xlsx
Figure 4—figure supplement 1
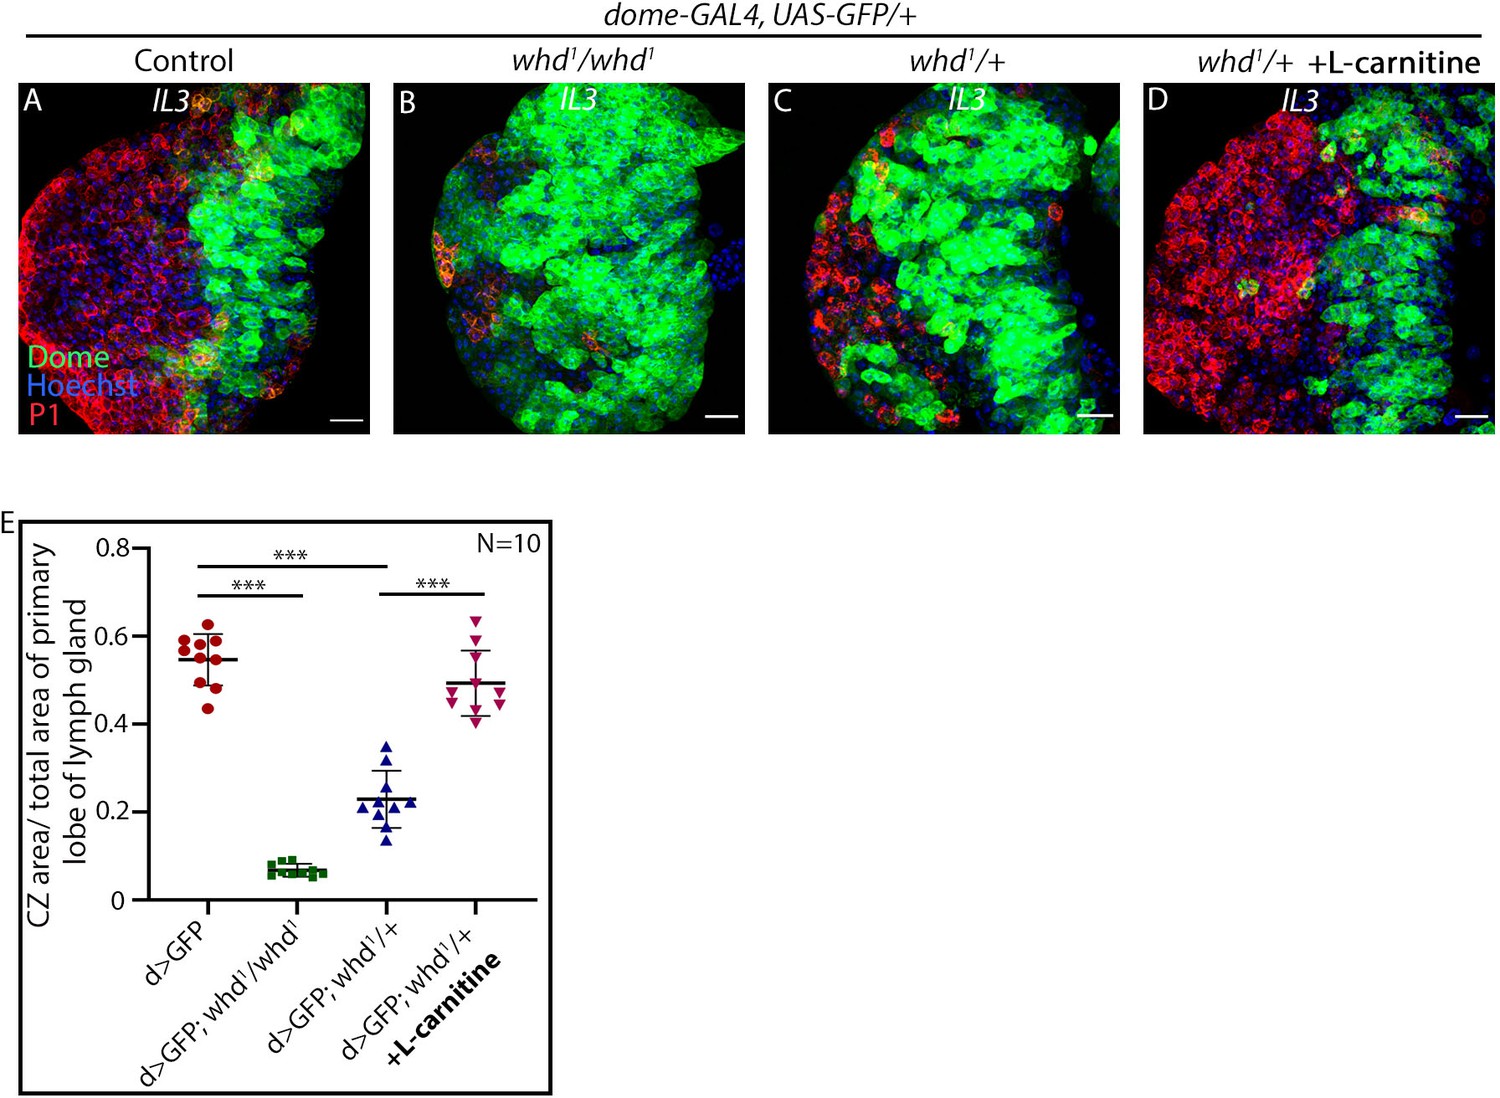
L-carnitine supplementation rescues differentiation defect.
Age and genotype of the larvae are mentioned in respective panels. (A–E) Status of progenitors (dome > GFP) and differentiated hemocytes P1 in control (A), whd1 homozygous (B), whd1 heterozygous (C) and whd1 hererozygous fed on L- carnitine (D). (E). Quantitative analysis of the results from A–D. p-Value for dome-GAL4, UAS-GFP; whd1/whd1 = 2.08×10⁻¹⁰ compared to control dome-GAL4, UAS-GFP. p-Value for dome-GAL4, UAS-GFP; whd1/+ = 1.18×10⁻⁹ compared to control dome-GAL4, UAS-GFP. p-Value for dome-GAL4, UAS-GFP; whd1/+ = 1.27×10⁻⁷ fed with L-carnitine compared to non-fed dome-GAL4, UAS-GFP; whd1/+. Individual dots represent biological replicates. Values are mean ± SD, asterisks mark statistically significant differences (*p<0.05; **p<0.01; ***p<0.001, Student’s t-test). Scale bar: 20 µm.
-
Figure 4—figure supplement 1—source data 1
Contains numerical data plotted in Figure 4—figure supplement 1E.
- https://cdn.elifesciences.org/articles/53247/elife-53247-fig4-figsupp1-data1-v2.xlsx
Figure 5 with 1 supplement

FAO loss in hemocyte progenitors led to sustained glycolysis.
(A) ATP levels in control and whd1/whd1 whole larvae. p-Value of whd1/whd1compared to control = 5.327×10⁻². (B–D) Glucose incorporation (marked by 2-NBDG uptake) levels in control dome-MESO-EBFP2/+ (B–B'') and dome-MESO-EBFP2/+; whd1/whd1 (C–C'') lymph glands. (D). Quantitative analysis of results from B–C demonstrating a significant increase in glucose uptake in the whd1/whd1 progenitors. p-Value for dome-MESO-EBFP2/+; whd1/whd1 = 6.09×10⁻⁷ compared to control. (E–F) Increased lactate dehydrogenase in-vivo enzymatic staining assay of whd1/whd1 lymph gland (F) compared to control (E). (G) Fold change in the level of Hex-A mRNA expression in control w1118 and whd1/whd1 lymph glands. p-Value of whd1/whd1 = 6.379×10⁻³ compared to control. (H) Fold change in the level of Pfk mRNA expression in control w1118 and whd1/whd1 lymph glands. p-Value of whd1/whd1 = 3.739×10⁻³ compared to control. (I–M) Proliferation status (marked by EdU) in control dome > GFP (I–I'), dome > GFP; whd1/whd1 (J–J'), 2-DG fed dome > GFP; whd1/whd1 (K–K') and dome > GFP; whd1/whd1; UAS-Glut1 RNAi (L–L') lymph glands. (M). Quantitative analysis of results from I–L'. p-Value for dome > GFP; whd1/whd1 = 4.37×10⁻⁷ compared to control and p-value for dome > GFP; whd1/whd1 = 3.25×10⁻⁷ fed with 2-DG compared to non-fed dome > GFP; whd1/whd1. p-Value for dome > GFP; whd1/whd1; UAS-Glut1 RNAi = 4.53×10⁻⁷ compared to non-fed dome > GFP; whd1/whd1. (M–P) Comparison of differentiation (marked by P1) levels in control dome > GFP (M), dome > GFP; whd1/whd1 (N) and 2-DG fed dome > GFP; whd1/whd1 (O) lymph glands. (P). Quantitative analysis of results from M–O show decline in proliferation upon 2-DG feeding. p-Value for dome > GFP; whd1/whd1 = 4.43×10⁻¹¹ compared to control and p-Value for dome > GFP; whd1/whd1 = 8.6×10⁻² fed with 2-DG compared to non-fed dome > GFP; whd1/whd1. p-Value for dome > GFP; whd1/whd1; UAS-Glut1 RNAi = 5.9×10⁻² compared to non-fed dome > GFP; whd1/whd1. n.s. = not significant. Individual dots represent biological replicates. Values are mean ± SD, asterisks mark statistically significant differences (*p<0.05; **p<0.01; ***p<0.001, Student’s t-test). Scale bar: 20 µm.
-
Figure 5—source data 1
Contains numerical data plotted in Figure 5A,D,G,H,M and R.
- https://cdn.elifesciences.org/articles/53247/elife-53247-fig5-data1-v2.xlsx
Figure 5—figure supplement 1
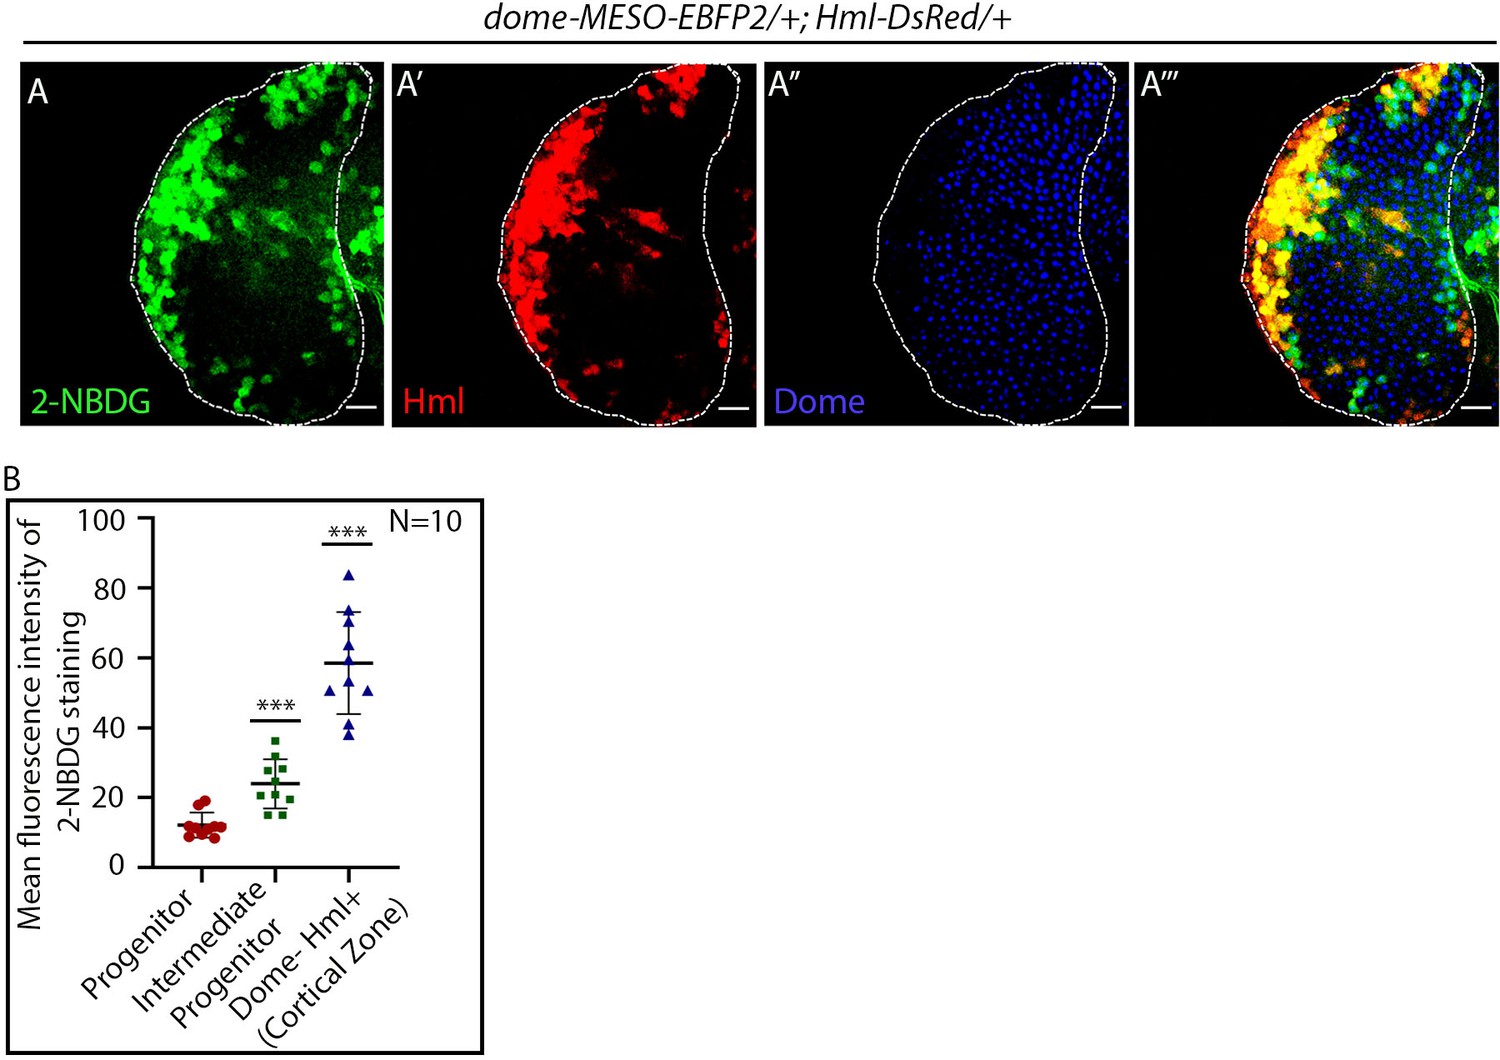
2-NBDG assay in the lymph gland primary lobe.
(A–B) Glucose incorporation (marked by 2-NBDG uptake) levels in control dome-MESO-EBFP2/+; Hml-DsRed lymph glands (A–A'''). (B) Quantitative analysis of results from A–A'''. p-Value for IPs = 3.64×10⁻⁴ compared to progenitors. p-Value for Cortical Zone Hml+=1.83×10⁻⁶ compared to progenitors. Individual dots represent biological replicates. Values are mean ± SD, asterisks mark statistically significant differences (*p<0.05; **p<0.01; ***p<0.001, Student’s t-test). Scale bar: 20 µm.
-
Figure 5—figure supplement 1—source data 1
Contains numerical data plotted in Figure 5—figure supplement 1B.
- https://cdn.elifesciences.org/articles/53247/elife-53247-fig5-figsupp1-data1-v2.xlsx
Figure 6 with 1 supplement
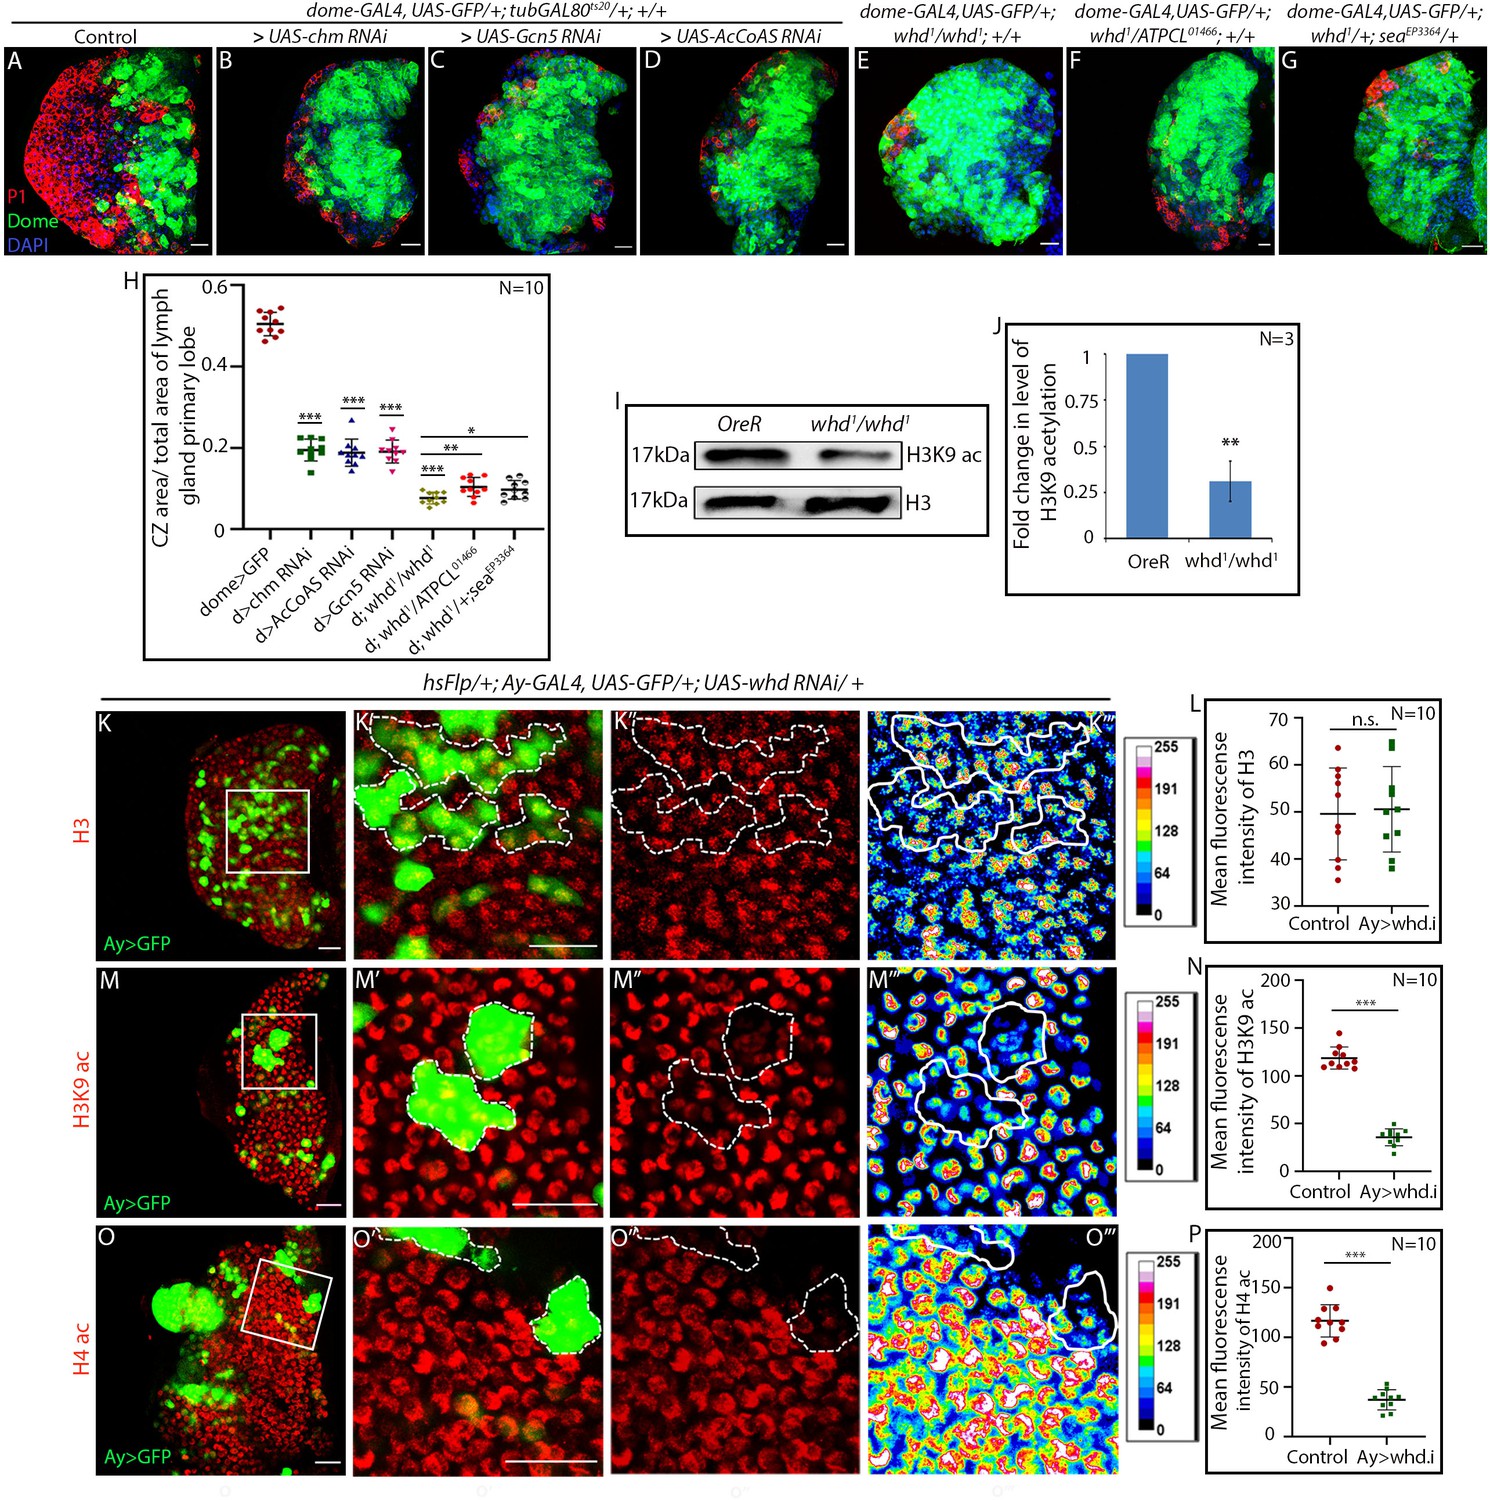
Hemocyte progenitors of HAT and FAO loss of function exhibits altered histone acetylation.
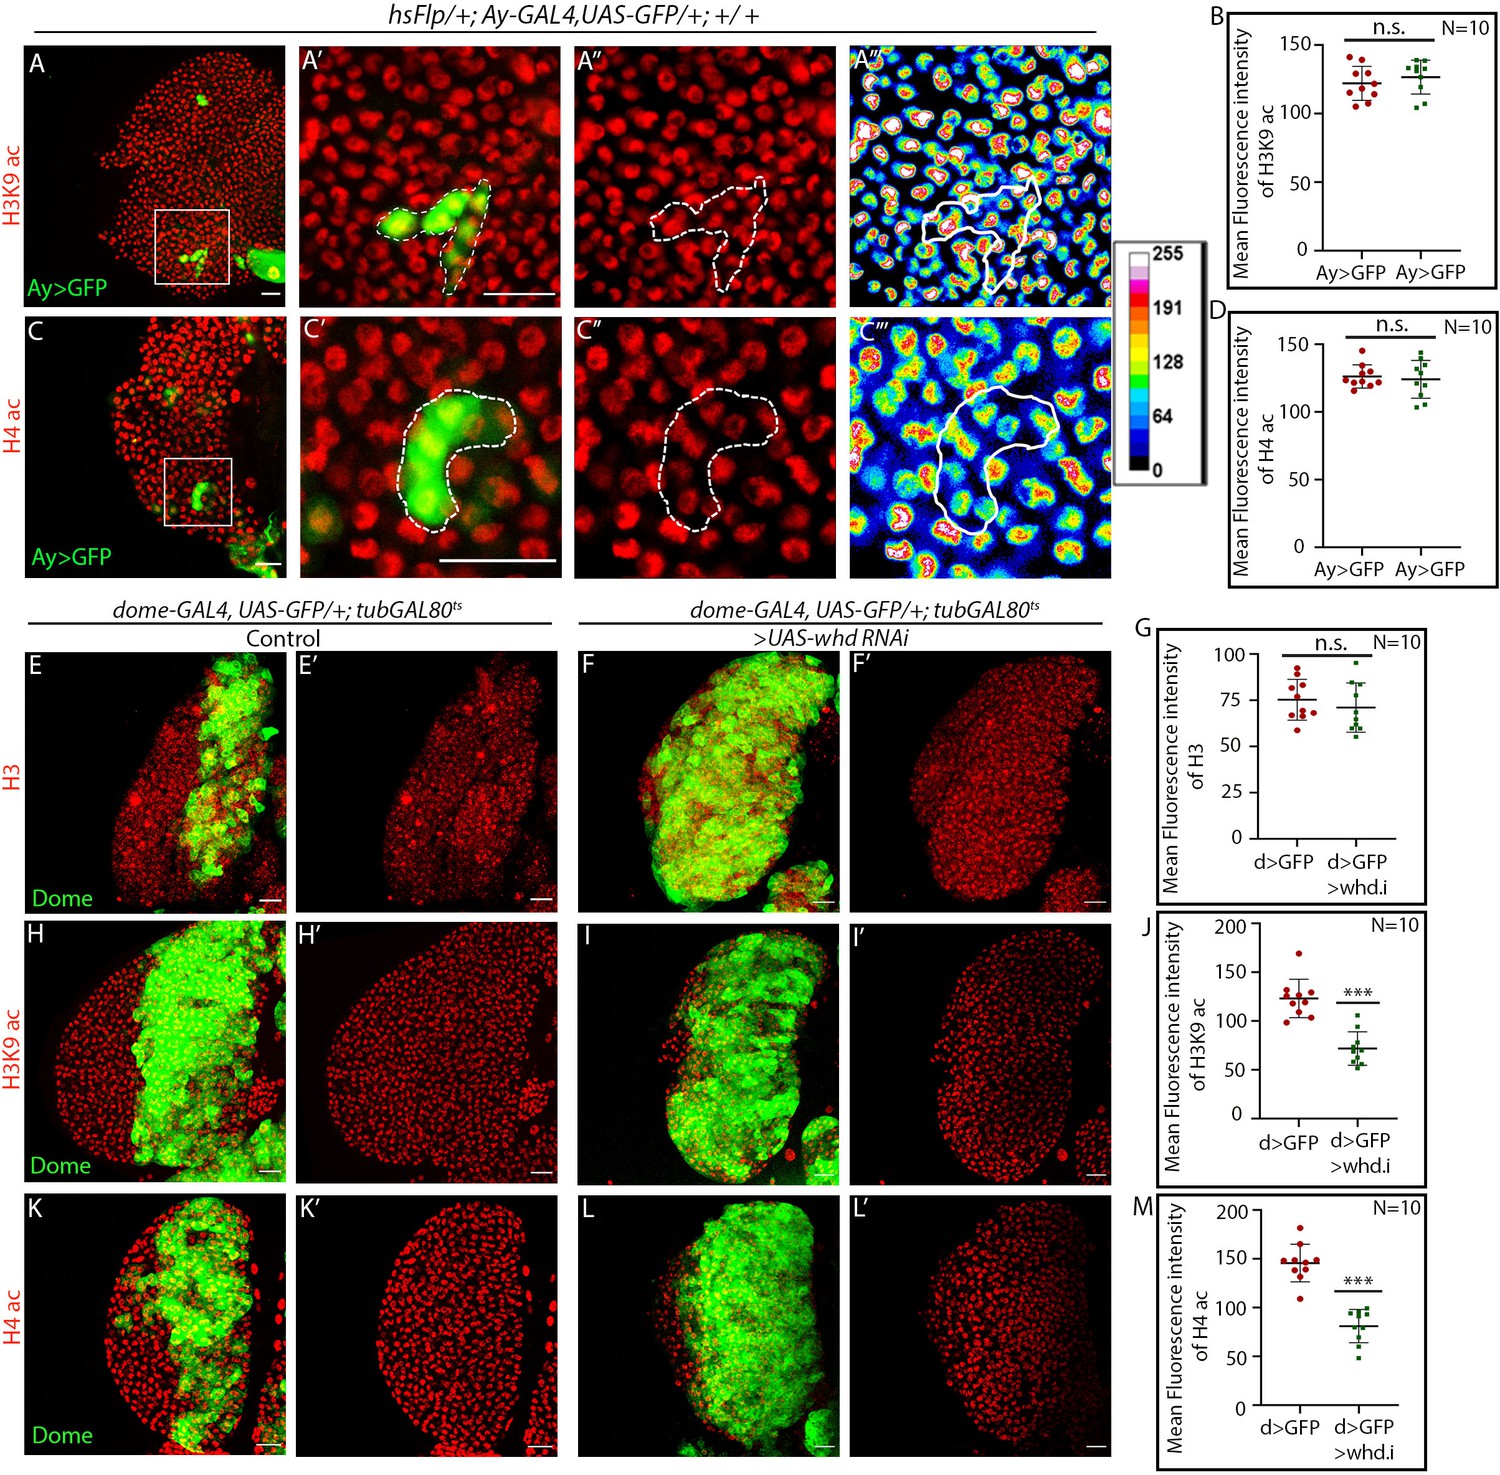
(A–H) Comparison of differentiation (marked by P1) levels in dome > GFP lymph gland of control (A) with progenitor-specific downregulation of (B) chm, (C) Gcn5, (D) AcCoAS and (E) whd1/whd1, (F) transheterozygote of whd and ATPCL (whd1/ATPCL01466) and transheterozygote of whd and sea (whd1/seaEPEP3364) (G). (H) Quantitative analyses of the results from A–G. p-Value for dome-GAL4, UAS-GFP; tubGAL80ts20 > UAS-chm RNAi = 2.267×10⁻¹⁵ compared to control. p-Value for dome-GAL4, UAS-GFP; tubGAL80ts20 > UAS-Gcn5 RNAi = 1.990×10⁻¹⁴ compared to control. p-Value for dome-GAL4, UAS-GFP; tubGAL80ts20 > UAS-AcCoAS RNAi = 2.601×10⁻¹⁵ compared to control. p-Value for dome-GAL4, UAS-GFP; whd1/whd1 = 1.400×10⁻¹⁵ compared to control. p-Value for dome-GAL4, UAS-GFP; whd1/ATPCL01466 = 6.835×10⁻³ compared to control dome-GAL4, UAS-GFP; whd1/whd1. p-Value for dome-GAL4, UAS-GFP; whd1/seaEP3364 = 2.974×10⁻² compared to control dome-GAL4, UAS-GFP; whd1/whd1. (I–J) Western blot analysis of H3K9 acetylation level in control OreR and whd1/whd1 larvae with H3 as a loading control (I). (J). Quantitative analysis of H3K9 acetylation level in I. p-Value for whd1/whd1 = 8.056×10⁻³ compared to control OreR. (K–P) Clonal analysis of histone acetylation in the GFP-positive hs-Flp/Ay-GAL4 based clonal patches (GFP indicates cells where the whd function is knocked down). Immunostaining with H3 (K–L), H3K9 acetylation (M–N), and H4 pan acetylation (O–P) antibodies. (L). Quantitative analyses of H3 acetylation level in K–K'''. p-Value for hs-Flp/Ay-GAL4. UAS-GFP; UAS-whd RNAi = 8.188×10⁻¹ compared to control. (N). Quantitative analysis of H3K9 acetylation level in (M–M'''). p-Value for hsFlp/+; Ay-GAL4. UAS-GFP; UAS-whd RNAi = 2.238×10⁻¹² compared to control. (P). Quantitative analysis of H4 acetylation level in O–O'''. p-Value for hsFlp/Ay-GAL4. UAS-GFP, UAS-whd RNAi = 1.083×10⁻⁹ compared to control. Individual dots represent biological replicates. Values are mean ± SD, asterisks mark statistically significant differences (*p<0.05; **p<0.01; ***p<0.001, Student’s t-test). Scale bar: 20 µm n.s. = not significant.
-
Figure 6—source data 1
Contains numerical data plotted in Figure 6H,J,L,N and P.
- https://cdn.elifesciences.org/articles/53247/elife-53247-fig6-data1-v2.xlsx
Figure 6—figure supplement 1
Hemocyte progenitors of whd1 loss of function exhibit altered histone acetylation.
(A–D) Clonal analysis of histone acetylation in GFP-positive hsFlp/Ay-GAL4 based mock clonal patches and immunostaining with H3K9 acetylation (A–A''') and H4 pan acetylation (B–B''') antibodies. (B). Quantitative analysis of H3K9 acetylation level in A–A'''. p-Value for hsFlp/Ay-GAL4, UAS-GFP = 4.26×10⁻¹ compared to control. (D). Quantitative analysis of H3K9 acetylation level in C–C'''. p-Value for hs-Flp/Ay-GAL4, UAS-GFP = 6.9×10⁻¹ compared to control. (E–M) Progenitor-specific expression of UAS-whd RNAi and immunostaining with H3 (E–F'), H3K9 acetylation (H–I'), and H4 pan acetylation (K–L') antibodies. (G). Quantitative analysis of H3 acetylation level in E–F'. p-Value for dome-GAL4, UAS-GFP; tubGAL80ts20 > UAS-whd RNAi = 4.54×10⁻¹ compared to control. (J). Quantitative analysis of H3K9 acetylation level in H–I'. p-Value for dome-GAL4, UAS-GFP; tubGAL80ts20 > UAS-whd RNAi = 7.87×10- 6 compared to control. (M). Quantitative analysis of H4 acetylation level in (K-Lʹ). p-Value for dome-GAL4, UAS-GFP; tubGAL80ts20 > UAS-whd RNAi = 2.96×10⁻⁷ compared to control. Individual dots represent biological replicates. Values are mean ± SD, asterisks mark statistically significant differences (*p<0.05; **p<0.01; ***p<0.001, Student’s t-test). Scale bar: 20 µm. ns.=not significant.
-
Figure 6—figure supplement 1—source data 1
Contains numerical data plotted in Figure 6—figure supplement 1B,D,G,J and M.
- https://cdn.elifesciences.org/articles/53247/elife-53247-fig6-figsupp1-data1-v2.xlsx
Figure 7
Acetate supplementation rescues differentiation defects of FAO mutant hemocyte progenitors.
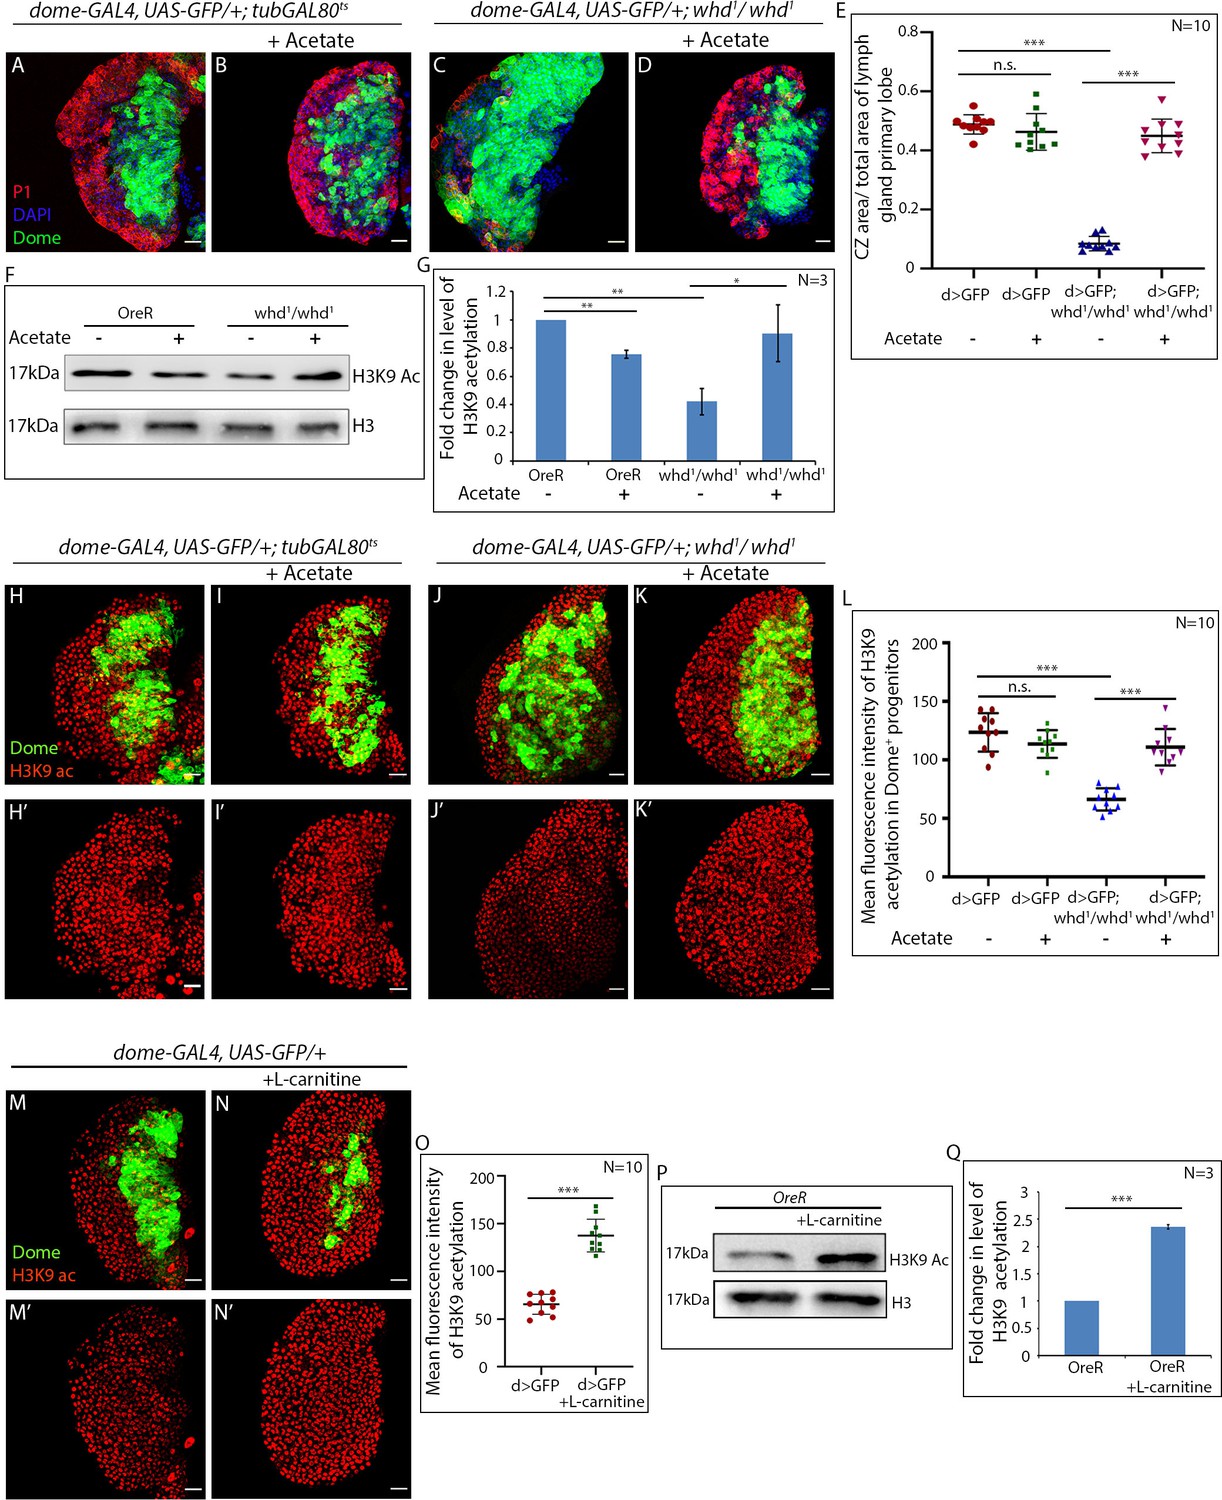
(A–E) Comparison of differentiation (marked by P1) levels in dome > GFP lymph gland of control (A) dome > GFP supplemented with acetate (B) dome > GFP; whd1/whd1 (C) and dome > GFP; whd1/whd1 supplemented with acetate (D). (E). Quantitative analysis of results from A–D. p-Value for dome-GAL4, UAS-GFP; tubGAL80ts20 = 2.718×10⁻¹ fed with acetate compared to control dome-GAL4, UAS-GFP; tubGAL80ts20. p-Value for dome-GAL4, UAS-GFP; whd1/whd1 = 3.18×10⁻¹⁶ compared to control dome-GAL4, UAS-GFP; tubgal80ts20. p-Value for dome-GAL4, UAS-GFP; whd1/whd1 = 2.576×10⁻¹⁰ fed with acetate compared to control dome-GAL4, UAS-GFP; tubGAL80ts20. (F–G) Western blot analysis of H3K9 acetylation levels in control OreR and whd1/whd1 larvae supplemented with acetate and non-fed controls with H3 as a loading control. (G) Quantitative analysis of H3K9 acetylation levels in F. p-Value for OreR = 4.589×10⁻³ supplemented with acetate compared to non-fed control OreR. p-Value for non-fed whd1/whd1 = 8.001×10⁻³ compared to non-fed control OreR. p-Value for acetate supplemented whd1/whd1 = 3.582×10⁻² compared to non-fed control whd1/whd1. (H–L) Acetate supplementation restores H3K9 acetylation status in the whd1/whd1 lymph gland (H-Iʹ). (L) Quantitative analysis of acetylation level in control, whd mutant, and whd mutant fed on acetate. p-Value for acetate supplemented dome-GAL4, UAS-GFP = 1.38×10⁻¹ compared to non-fed control. p-Value for dome-GAL4, UAS-GFP; whd1/whd1 = 1.276×10⁻⁷ compared to dome-GAL4, UAS-GFP. p-Value for acetate supplemented dome-GAL4, UAS-GFP; whd1/whd1 = 1.31×10⁻⁶ compared to non-fed control dome-GAL4; UAS-GFP; whd1/whd1. (M–O) Comparison of H3K9 acetylation level in Dome+ progenitors of L-carnitine fed larvae (N–N') with non-fed control (M–M'). (O) Quantitative analysis of H3K9 acetylation levels in M–N'. p-Value for dome-GAL4, UAS-GFP = 1.079×10⁻⁸ supplemented with L-carnitine compared to non-fed control dome-GAL4, UAS-GFP. (P–Q) Western blot analysis of H3K9 acetylation levels in OreR larvae supplemented with L-carnitine and non-fed controls with H3 as a loading control. Quantitative analysis of H3K9 acetylation levels in N. p-Value for OreR = 3.17×10⁻⁴ supplemented with L-carnitine compared to non-fed control OreR. Individual dots represent biological replicates. Values are mean ± SD, asterisks mark statistically significant differences (*p<0.05; **p<0.01; ***p<0.001, Student’s t-test). Scale bar: 20 µm n.s. = not significant.
-
Figure 7—source data 1
Contains numerical data plotted in Figure 7E,G,L,O and Q.
- https://cdn.elifesciences.org/articles/53247/elife-53247-fig7-data1-v2.xlsx
Figure 8 with 1 supplement
JNK regulates FAO in hemocyte progenitors of larval lymph gland.
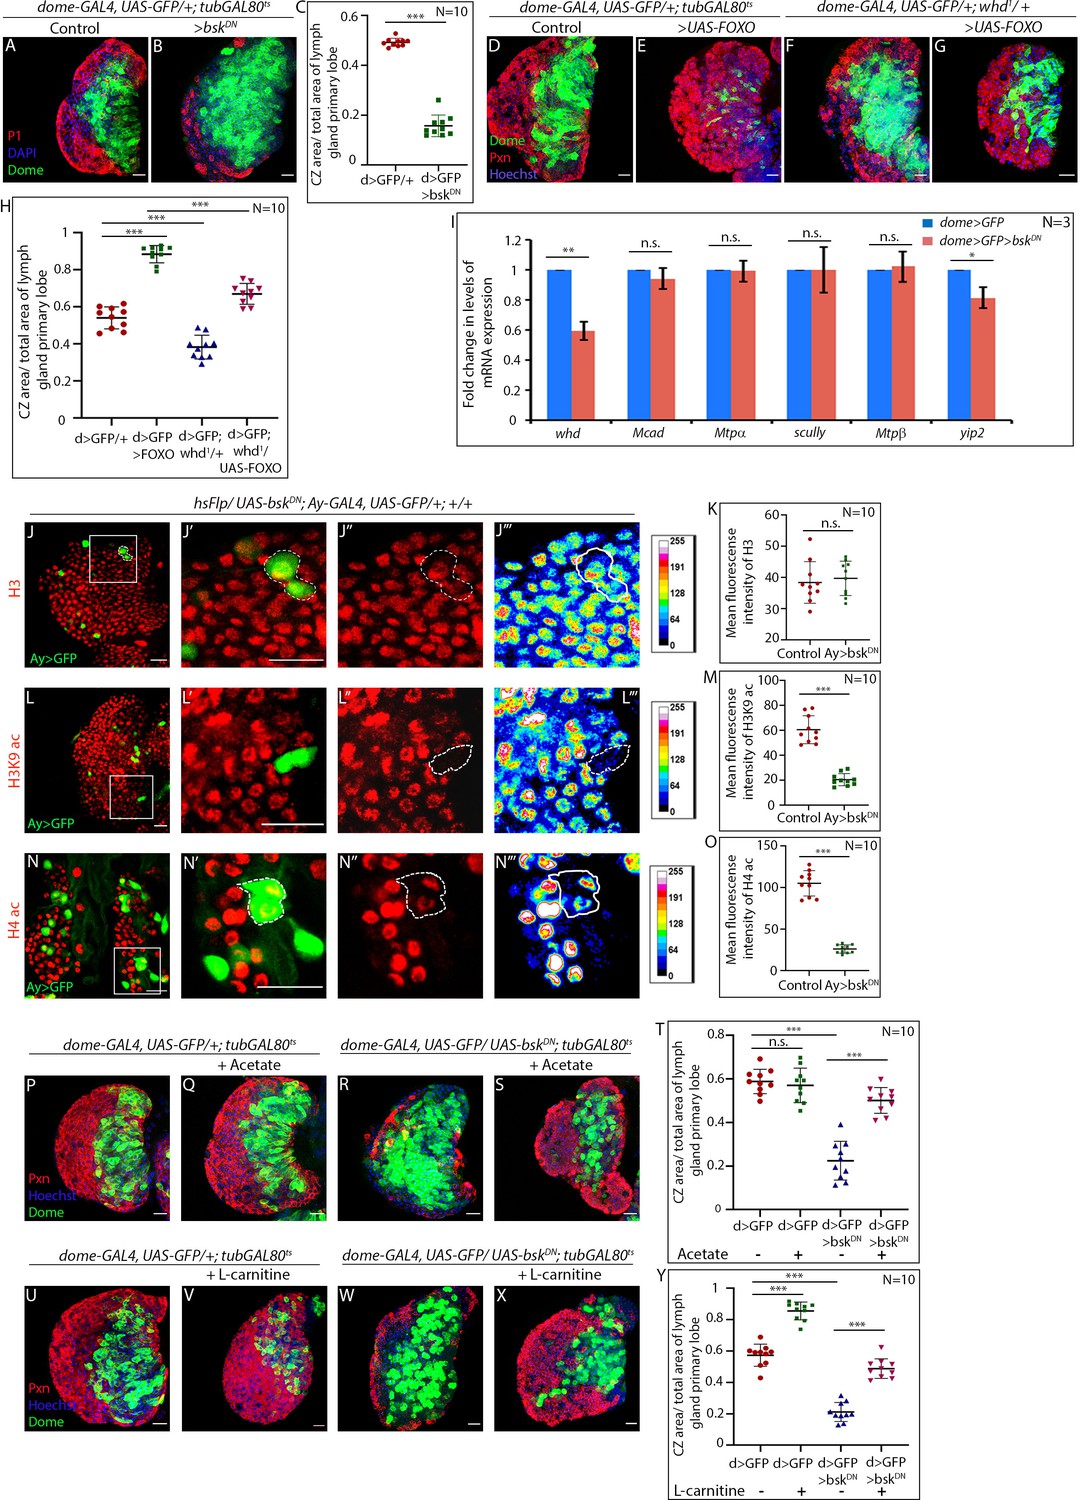
(A–C) Comparison of differentiation (marked by P1) levels in dome > GFP lymph gland of control (A), and bsk/JNK knockdown in hemocyte progenitors by dome-GAL4, UAS-GFP; tubGAL80ts20 > UAS-bskDN (B). (C). Quantitative analysis of the differentiation level from A–B reveals a significant increase in the Dome+ progenitor zone and a decrease in differentiation. p-Value for dome-GAL4, UAS-GFP; tubGAL80ts20 > UAS-bskDN=5.84×10⁻¹¹ compared to control. (D–H) Differentiation levels (red, marked by Pxn) in overexpression of FOXO by dome-GAL4, UAS-GFP; tubGAL80ts20 > UAS-FOXO (E) is significantly increased compared to control (D). The increased differentiation in FOXO overexpression background is significantly rescued by one copy of the null allele of whd (G). (F). The differentiation level in one copy null allele of whd. (H). Quantitative analysis of the differentiation level from D–G reveals a significant increment in Pxn+ differentiated cell area in FOXO overexpression from Dome+ progenitors, which is significantly rescued by one copy null allele of whd. p-Value for dome-GAL4, UAS-GFP; tubGAL80ts20 > UAS-FOXO =5.77×10⁻¹¹ compared to control. p-Value for dome-GAL4, UAS-GFP; whd1/+ = 2.11×10⁻⁵ compared to control. p-Value for dome-GAL4, UAS-GFP; tubGAL80ts20 > UAS-FOXO/whd1 = 3.84×10⁻⁹ compared to dome-GAL4, UAS-GFP; tubGAL80ts20 > UAS-FOXO. (I) Real-time expression analysis of fatty acid oxidation enzymes, whd, Mcad, Mtpα, scully, Mtpβ, and yip2 from dome > GFP and dome > GFP > UAS-bskDN lymph glands. The expression of whd shows a significant drop ~41% in dome > GFP > UAS-bskDN compared to control dome > GFP. p-Value for whd expression in dome-GAL4, UAS-GFP; tubGAL80ts20 > UAS-bskDN=7.06×10⁻³ compared to control. p-Value for Mcad expression in dome-GAL4, UAS-GFP; tubGAL80ts20 > UAS-bskDN=6.71×10⁻¹ compared to control. p-Value for Mtpα expression in dome-GAL4, UAS-GFP; tubGAL80ts20 > UAS-bskDN=8.95×10⁻¹ compared to control. p-Value for scully expression in dome-GAL4, UAS-GFP; tubGAL80ts20 > UAS-bskDN=9.73×10⁻¹ compared to control. p-Value for Mtpβ expression in dome-GAL4, UAS-GFP; tubGAL80ts20 > UAS-bskDN=7.7×10⁻¹ compared to control. p-Value for yip2 expression in dome-GAL4, UAS-GFP; tubGAL80ts20 > UAS-bskDN=2.42×10⁻² compared to control. (J–O) Clonal analysis of histone acetylation in GFP-positive hsFlp/Ay-GAL4 based clonal patches expressing a dominant-negative form of bsk and immunostaining with H3 (J–J'''), H3K9 acetylation (L–L''') and H4 pan acetylation (N–N''') antibodies. (K). Quantitative analysis of H3 acetylation level in J–J'''. p-Value for hsFlp/Ay-GAL4. UAS-GFP, UAS-bskDN = 6.32×10⁻¹ compared to control. (M). Quantitative analysis of H3K9 acetylation level in L–L'''. p-Value for hsFlp/Ay-GAL4. UAS-GFP; UAS-bskDN = 1.911×10⁻⁷ compared to control. (O). Quantitative analysis of H4 acetylation level in N–N'''. p-Value for hs-Flp/Ay-GAL4. UAS-GFP, UAS-bskDN = 8.22×10⁻⁹ compared to control. (P–T) Stalled differentiation levels (red, marked by Pxn) in dome-GAL4, UAS-GFP; tubGAL80ts20 > UAS-bskDN (R) is significantly rescued in larvae reared in fly food supplemented with acetate (S). The differentiation level in control (P) dome-GAL4, UAS-GFP; tubGAL80ts20 remain unaltered upon acetate feeding (Q). (T). Quantitative analysis of the differentiation level from P–S reveals a significant rescue of differentiated cells upon acetate supplementation in dome-GAL4, UAS-GFP; tubGAL80ts20 > UAS-bskDN lymph glands. p-Value for acetate supplemented dome-GAL4, UAS-GFP; tubGAL80ts20 = 5.655×10⁻¹ compared to non-fed control. p-Value for dome-GAL4, UAS-GFP; tubGAL80ts20 > UAS-bskDN=1.32×10⁻⁸ compared to control dome-GAL4, UAS-GFP; tubGAL80ts20. p-Value for acetate fed dome-GAL4, UAS-GFP; tubGAL80ts20 > UAS-bskDN=4.73×10⁻⁷ compared to non-fed dome-GAL4, UAS-GFP; tubGAL80ts20 > UAS bskDN. (U–Y) The differentiation level (red, marked by Pxn) in control (U) dome-GAL4, UAS-GFP; tubGAL80ts20 increases upon L-carnitine feeding (V). Defect in differentiation levels (red, marked by Pxn) in dome-GAL4, UAS-GFP; tubGAL80ts20 > UAS bskDN (W) is significantly rescued in larvae reared in fly food supplemented with L-carnitine (X). (Y). Quantitative analysis of the differentiation level from U–X, reveals a significant rescue of differentiated cells upon L-carnitine supplementation in dome-GAL4, UAS-GFP; tubGAL80ts20 > UAS-bskDN lymph glands. p-Value for L-carnitine supplemented dome-GAL4, UAS-GFP; tubGAL80ts20 = 1.69×10⁻⁸ compared to non-fed control. p-Value for dome-GAL4, UAS-GFP; tubGAL80ts20 > UAS-bskDN =4.5×10⁻¹⁰ compared to control dome-GAL4, UAS-GFP; tubGAL80ts20. p-Value for L-carnitine fed dome-GAL4, UAS-GFP; tubGAL80ts20 > UAS-bskDN =8.307×10⁻⁹ compared to non-fed dome-GAL4, UAS-GFP; tubGAL80ts20 > UAS -bskDN. Individual dots represent biological replicates. Values are mean ± SD, asterisks mark statistically significant differences (*p<0.05; **p<0.01; ***p<0.001, Student’s t-test). Scale bar: 20 µm.
-
Figure 8—source data 1
Contains numerical data plotted in Figure 8C,H,I,K,M,O,T and Y.
- https://cdn.elifesciences.org/articles/53247/elife-53247-fig8-data1-v2.xlsx
Figure 8—figure supplement 1
JNK regulates FAO in hemocyte progenitors of the larval lymph gland.
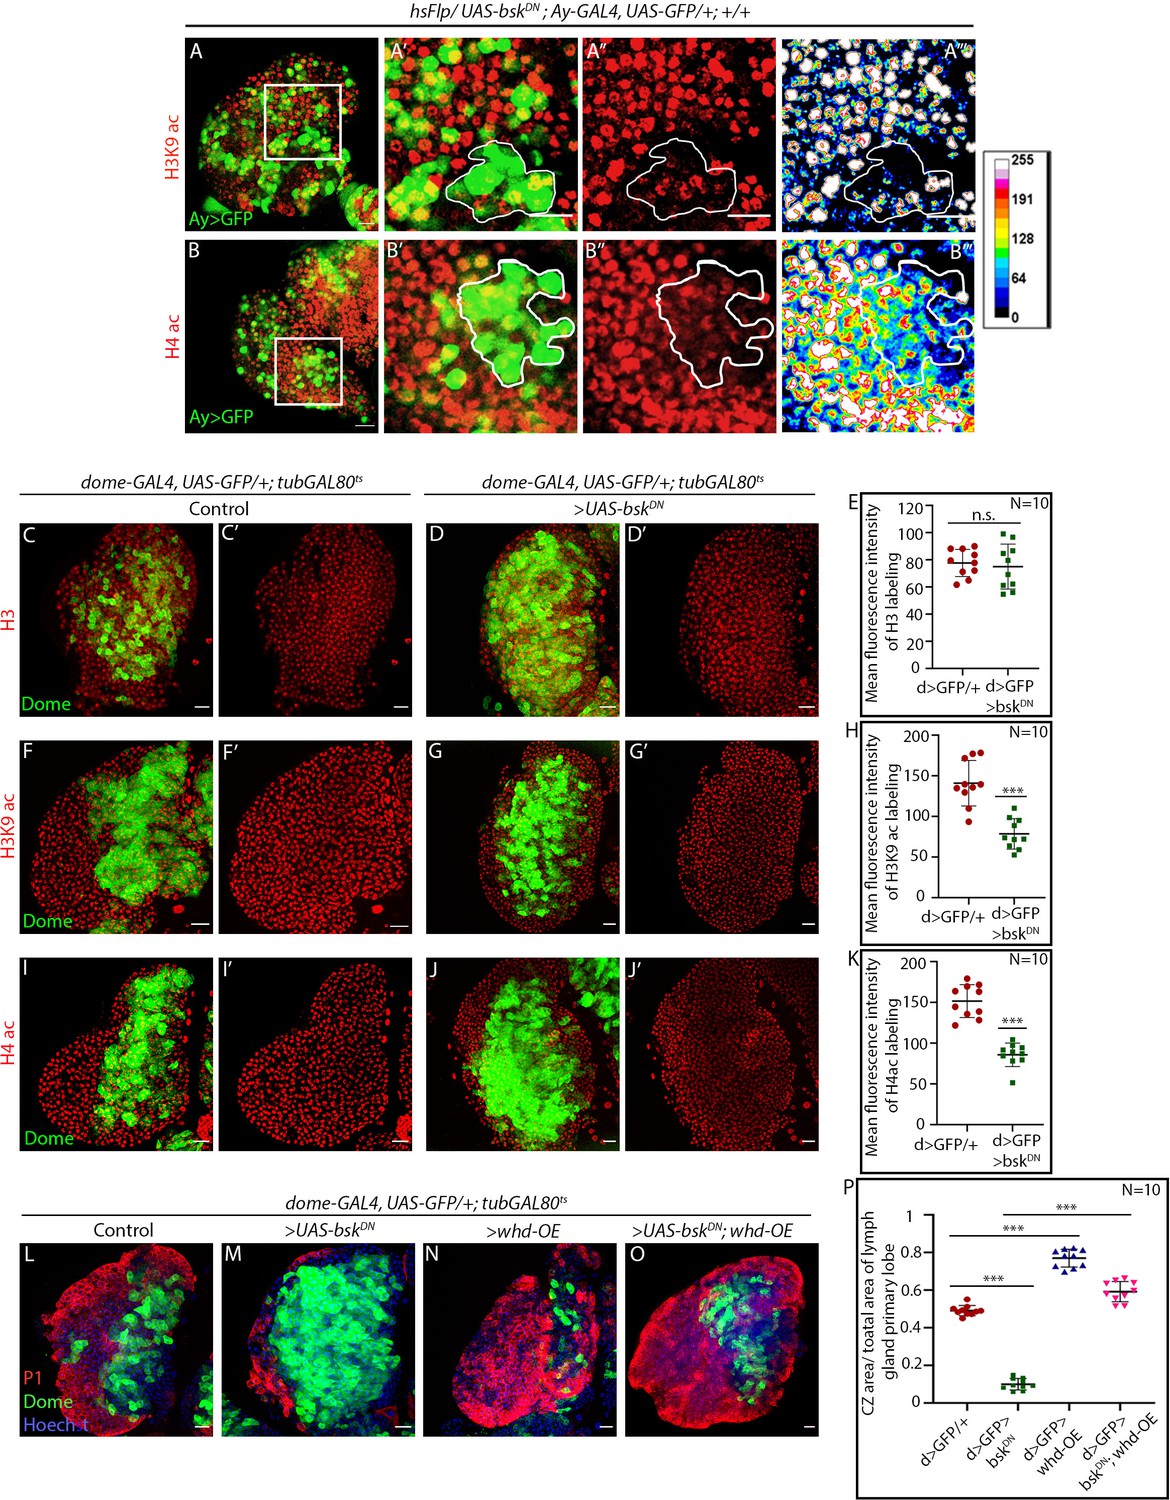
(A–B''') Clonal analysis of histone acetylation in GFP-positive hsFlp/Ay-GAL4-based clonal patches expressing the dominant-negative form of bsk and immunostaining with H3K9 acetylation (A–A''') and H4 pan acetylation (B–B''') antibodies. A''' and B''' are heat map of A'' and B''. (C–K) Progenitor-specific expression of a dominant negative form of bsk and immunostaining with H3 (C-Dʹ), H3K9 acetylation (F-Gʹ), and H4 pan acetylation (I-Jʹ) antibodies. (E). Quantitative analysis of the H3 acetylation level in (C-Dʹ). p-Value for dome-GAL4, UAS-GFP; tubGAL80ts20 > UAS-bskDN =6.6×10⁻¹ compared to control. (H). Quantitative analysis of H3K9 acetylation level in (F-Gʹ). p-Value for dome-GAL4, UAS-GFP; tubGAL80ts20 > UAS-bskDN =2.62×10⁻⁵ compared to control. (K). Quantitative analysis of H4 acetylation level in (I-J'). p-Value for dome-GAL4, UAS-GFP; tubGAL80ts20 > UAS-bskDN =2.56×10⁻⁷ compared to control. (L–P) Stalled differentiation levels (red, marked by P1) in dome-GAL4, UAS-GFP; tubGAL80ts20 > UAS-bskDN (M) is significantly rescued in dome-GAL4, UAS-GFP; tubGAL80ts20 > UAS-bskDN, whd-OE (O). The differentiation level in control (L) dome-GAL4, UAS-GFP; tubGAL80ts20 and dome-GAL4, UAS-GFP; tubGAL80ts20 > whd-OE (N). (P). Quantitative analysis of the differentiation level from L–O reveals a significant rescue of differentiated cells upon whd overexpression in dome-GAL4, UAS-GFP; tubGAL80ts20 > UAS-bskDN,whd-OE lymph glands. p-Value for dome-GAL4, UAS-GFP; tubGAL80ts20 > UAS-bskDN =1.02×10⁻¹⁶ compared to control dome-GAL4, UAS-GFP; tubGAL80ts20. p-Value for dome-GAL4, UAS-GFP; tubGAL80ts20 > whd-OE =1.6×10⁻¹⁰ compared to control dome-GAL4, UAS-GFP; tubGAL80ts20. p-Value for dome-GAL4, UAS-GFP; tubGAL80ts20 > UAS-bskDN, whd-OE = 3.466×10⁻¹³ compared to dome-GAL4, UAS-GFP; tubGAL80ts20 > UAS-bskDN. Individual dots represent biological replicates. Values are mean ± SD, asterisks mark statistically significant differences (*p<0.05; **p<0.01; ***p<0.001, Student’s t-test). Scale bar: 20 µm.
-
Figure 8—figure supplement 1—source data 1
Contains numerical data plotted in Figure 8—figure supplement 1E,H,K and P.
- https://cdn.elifesciences.org/articles/53247/elife-53247-fig8-figsupp1-data1-v2.xlsx
Figure 9
The regulation of FAO by JNK is critical for differentiation.
ROS-JNK link has been previously shown to be essential for differentiation (Owusu-Ansah and Banerjee, 2009). The G2-M arrested hemocyte progenitors employ β-oxidation for their differentiation. ROS–JNK circuit impinges on FAO to facilitate progenitor differentiation. JNK signaling transcriptionally regulates whd, the rate-limiting enzyme of FAO leading to the production of acetyl-CoA. Acetyl-CoA leads to acetylation of histones in the hemocyte progenitors, which is critical for their differentiation.
Author response image 1
Author response image 2
CG3902 YFP.
Five optical sections of 1µm thickness from the middle of the Z stack (No. 9-13) were merged into a single section for this panel.
Author response image 3
LipidTOX.
Five optical sections of 1µm thickness from the middle of the Z stack (No. 7-11) were merged into a single section for this panel.
Author response image 4
Nile Red.
Five optical sections of 1µm thickness from the middle of the Z stack (No. 10-14) were merged into a single section for this panel.
Author response image 5
Author response image 6
Author response image 7
Videos
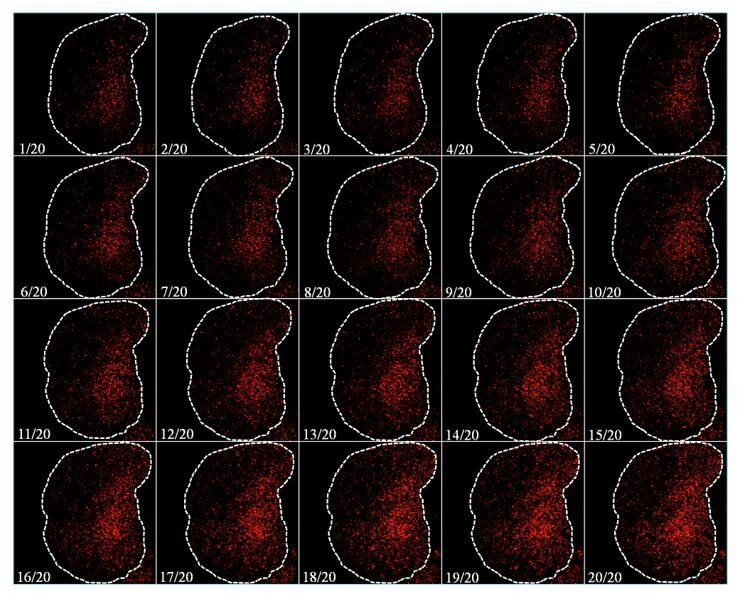
Video 1
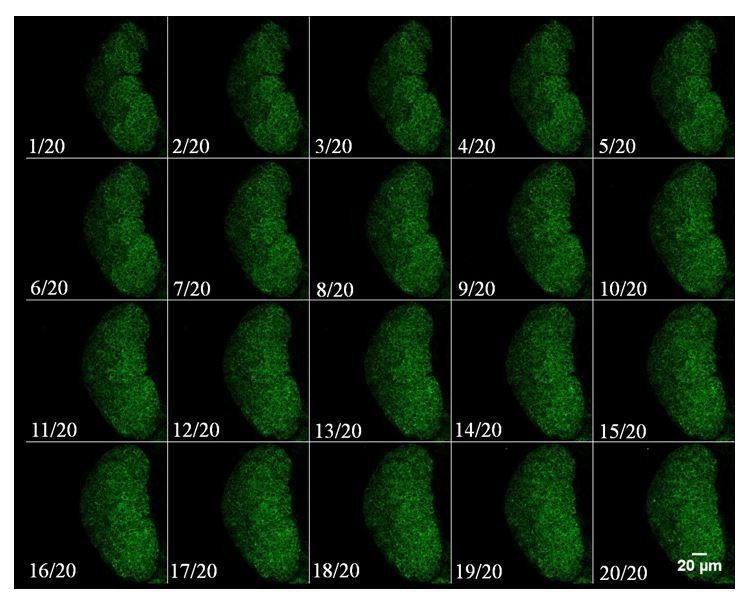
Mitochondrial distribution in the progenitors (red, Dome+) visualized by UAS-mito-HA-GFP.
Tables
Key resources table
| Reagent type (species) or resource | Designation | Source or reference | Identifiers | Additional information |
|---|---|---|---|---|
| Gene (Drosophila melanogaster) | dome | Flybase:FB2020_01 | FLYB:FBgn 0043903 | |
| Gene (Drosophila melanogaster) | Hml | Flybase:FB2020_01 | FLYB:FBgn 0029167 | |
| Gene (Drosophila melanogaster) | Tep4 | Flybase:FB2020_01 | FLYB:FBgn 0031888 | |
| Gene (Drosophila melanogaster) | CG3902 | Flybase:FB2020_01 | FLYB:FBgn 0036824 | |
| Gene (Drosophila melanogaster) | Mtpα | Flybase:FB2020_01 | FLYB:FBgn 0041180 | |
| Gene (Drosophila melanogaster) | Mtpβ | Flybase:FB2020_01 | FLYB:FBgn 0025352 | |
| Gene (Drosophila melanogaster) | whd | Flybase:FB2020_01 | FLYB:FBgn 0261862 | |
| Gene (Drosophila melanogaster) | Hnf4 | Flybase:FB2020_01 | FLYB:FBgn 0041180 | |
| Gene (Drosophila melanogaster) | chm | Flybase:FB2020_01 | FLYB:FBgn 0028387 | |
| Gene (Drosophila melanogaster) | Gcn5 | Flybase:FB2020_01 | FLYB:FBgn 0020388 | |
| Gene (Drosophila melanogaster) | AcCoAS | Flybase:FB2020_01 | FLYB:FBgn 0012034 | |
| Gene (Drosophila melanogaster) | Glut1 | Flybase:FB2020_01 | FLYB:FBgn 0264574 | |
| Gene (Drosophila melanogaster) | ATPCL | Flybase:FB2020_01 | FLYB:FBgn 0020236 | |
| Gene (Drosophila melanogaster) | sea | Flybase:FB2020_01 | FLYB:FBgn 0037912 | |
| Gene (Drosophila melanogaster) | bsk | Flybase:FB2020_01 | FLYB:FBgn 0000229 | |
| Genetic reagent(Drosophila melanogaster) | dome-GAL4 | BloomingtonDrosophilaStock Center | BDSC:81010; FLYB:FBti0022298; RRID:BDSC_81010 | FlyBase symbol: P{GawB}domePG14 |
| Genetic reagent (Drosophila melanogaster) | Hml-dsRed.Δ | Makhijani et al., 2011 | FLYB:FBgn 0041180 | FlyBase symbol: P{Hml-dsRed.Δ} |
| Genetic reagent (Drosophila melanogaster) | HmlΔ-GAL4 | Sinenko and Mathey-Prevot, 2004 | FLYB: FBgn 0040877 | FlyBase symbol: P{Hml-GAL4.Δ} |
| Genetic reagent (Drosophila melanogaster) | Pvf2-lacZ | Choi et al., 2008 | FLYB:FBtp0052107 | FlyBase symbol: P{Pvf2-lacZ.C} |
| Genetic reagent (Drosophila melanogaster) | TepIV-GAL4 | Kyoto Stock Center | DGGR:105442; FLYB:FBti0037434; RRID:DGGR_105442 | FlyBase symbol: P{GawB}NP7379 |
| Genetic reagent (Drosophila melanogaster) | CG3902-YFP | Kyoto Stock Center | DGGR:115356; FLYB:FBti0143519; RRID:DGGR_115356 | FlyBase symbol: PBac{566 .P.SVS-1}CG3902CPTI100004 |
| Genetic reagent (Drosophila melanogaster) | Mtpα[KO] | Kyoto Stock Center | DGGR:116261; FLYB:FBal0267653; RRID:DGGR_116261 | FlyBase symbol: MtpαKO |
| Genetic reagent (Drosophila melanogaster) | Mtpβ[KO] | Kyoto Stock Center | DGGR:116262; FLYB:FBal0267654; RRID:DGGR_116262 | FlyBase symbol: MtpβKO |
| Genetic reagent (Drosophila melanogaster) | UAS-whd RNAi [KK] | ViennaDrosophila RNAi Center | VDRC:v105400; FLYB:FBti0116709; RRID:FlyBase_FBst0477227 | FlyBase symbol: P{KK100935}VIE-260B |
| Genetic reagent (Drosophila melanogaster) | OreR | BloomingtonDrosophilaStock Center | BDSC:5; FLYB:FBsn0000277; RRID:BDSC_5 | FlyBase symbol: Oregon-R-C |
| Genetic reagent (Drosophila melanogaster) | w[1118] | BloomingtonDrosophilaStock Center | BDSC:3605; FLYB:FBal0018186;RRID:BDSC_3605 | FlyBase symbol: w1118 |
| Genetic reagent (Drosophila melanogaster) | UAS-Hnf4.miRNA | BloomingtonDrosophilaStock Center | BDSC:44398; FLYB:FBti0152533;RRID:BDSC_44398 | FlyBase symbol: P{UAS-Hnf4.miRNA}attP16 |
| Genetic reagent (Drosophila melanogaster) | UAS-whd RNAi | BloomingtonDrosophilaStock Center | BDSC:34066; FLYB:FBal0263076; RRID:BDSC_34066 | FlyBase symbol: whdHMS00040 |
| Genetic reagent (Drosophila melanogaster) | UAS-FOXO.P | BloomingtonDrosophilaStock Center | BDSC:9575; FLYB:FBtp0017636; RRID:BDSC_9575 | FlyBase symbol: P{UAS-foxo.P} |
| Genetic reagent (Drosophila melanogaster) | Hnf4-GAL4 | BloomingtonDrosophilaStock Center | BDSC:47618; FLYB:FBti0136396; RRID:BDSC_47618 | FlyBase symbol: P{GMR50A12-GAL4}attP2 |
| Genetic reagent (Drosophila melanogaster) | UAS-FUCCI | BloomingtonDrosophilaStock Center | BDSC:55121; RRID:BDSC_55121 | FlyBase symbol: P{UAS-GFP.E2f1.1–230}32; P{UAS-mRFP1.NLS.CycB.1–266}19 |
| Genetic reagent (Drosophila melanogaster) | UAS-mito-HA-GFP | BloomingtonDrosophilaStock Center | BDSC:8442; FLYB:FBti0040803; RRID:BDSC_8442 | FlyBase symbol: P{UAS-mito-HA-GFP.AP}2 |
| Genetic reagent (Drosophila melanogaster) | UAS-chm RNAi | BloomingtonDrosophilaStock Center | BDSC:27027; FLYB:FBal0220716; RRID:BDSC_27027 | FlyBase symbol: chmJF02348 |
| Genetic reagent (Drosophila melanogaster) | UAS-Gcn5 RNAi | BloomingtonDrosophilaStock Center | BDSC:33981; FLYB:FBal0257611; RRID:BDSC_33981 | FlyBase symbol: Gcn5HMS00941 |
| Genetic reagent (Drosophila melanogaster) | UAS-AcCoAS RNAi | BloomingtonDrosophilaStock Center | BDSC:41917; FLYB:FBal0279313; RRID:BDSC_41917 | FlyBase symbol: AcCoASHMS02314 |
| Genetic reagent (Drosophila melanogaster) | UAS-Glut1RNAi | BloomingtonDrosophilaStock Center | BDSC:28645; FLYB:FBal0239561; RRID:BDSC_28645 | FlyBase symbol: Glut1JF03060 |
| Genetic reagent (Drosophila melanogaster) | ATPCL[01466] | BloomingtonDrosophilaStock Center | BDSC:11055; FLYB:FBal0007976; RRID:BDSC_11055 | FlyBase symbol: ATPCL01466 |
| Genetic reagent (Drosophila melanogaster) | sea[EP3364] | BloomingtonDrosophilaStock Center | BDSC:17118; FLYB:FBal0131420; RRID:BDSC_17118 | FlyBase symbol: seaEP3364 |
| Genetic reagent (Drosophila melanogaster) | UAS-bsk[DN] | BloomingtonDrosophilaStock Center | BDSC:6409; FLYB:FBti0021048; RRID:BDSC_6409 | FlyBase symbol: P{UAS-bsk.DN}2 |
| Genetic reagent (Drosophila melanogaster) | UAS-mCD8::GFP | BloomingtonDrosophilaStock Center | BDSC:5137; FLYB:FBti0180511; RRID:BDSC_5137 | FlyBase symbol: P{UAS-mCD8::GFP.L}2 |
| Genetic reagent (Drosophila melanogaster) | UAS-mCD8::RFP | BloomingtonDrosophilaStock Center | BDSC:27400; FLYB:FBti0115747; RRID:BDSC_27400 | FlyBase symbol: P{UAS-mCD8.mRFP.LG}28a |
| Genetic reagent (Drosophila melanogaster) | U-6;sgRNA-whd-KO | BloomingtonDrosophilaStock Center | BDSC:77066; FLYB:FBal0335953; RRID:BDSC_77066 | FlyBase symbol: whdTKO.GS00854 |
| Genetic reagent (Drosophila melanogaster) | U-6;sgRNA-whd-OE | BloomingtonDrosophilaStock Center | BDSC:68139; FLYB:FBal0337690; RRID:BDSC_68139 | FlyBase symbol: whdTOE.GS00536 |
| Genetic reagent (Drosophila melanogaster) | whd[1] | BloomingtonDrosophilaStock Center | BDSC:441; FLYB:FBal0018515; RRID:BDSC_441 | FlyBase symbol: whd1 |
| Genetic reagent (Drosophila melanogaster) | Hnf4[Δ33] | BloomingtonDrosophilaStock Center | BDSC:43634; FLYB:FBal0240651; RRID:BDSC_43634 | FlyBase symbol: Hnf4Δ33 |
| Genetic reagent (Drosophila melanogaster) | Hnf4[Δ17] | BloomingtonDrosophilaStock Center | BDSC:44218; FLYB:FBal0240650; RRID:BDSC_44218 | FlyBase symbol: Hnf4Δ17 |
| Genetic reagent (Drosophila melanogaster) | tubGAL80[ts20] | BloomingtonDrosophilaStock Center | BDSC:7109; FLYB:FBti0027796; RRID:BDSC_7109 | FlyBase symbol: P{tubP-GAL80ts}20 |
| Genetic reagent (Drosophila melanogaster) | hsFlp | BloomingtonDrosophilaStock Center | BDSC:1929; FLYB:FBti0000784; RRID:BDSC_1929 | FlyBase symbol: P{hsFLP}12 |
| Genetic reagent (Drosophila melanogaster) | Ay-GAL4, UAS-GFP | BloomingtonDrosophilaStock Center | BDSC:4411; FLYB:FBti0012290;FBti0003040RRID:BDSC_4411 | FlyBase symbol: P{AyGAL4}25; P{UAS-GFP.S65T}Myo31DFT2 |
| Antibody | anti-P1 (Mouse monoclonal) | Kurucz et al., 2007 | Cat# NimC1, RRID:AB_2568423 | IF(1:50) |
| Antibody | anti-Pxn (Mouse) | Nelson et al., 1994 | IF(1:400) | |
| Antibody | anti-proPO (Rabbit polyclonal) | Jiang et al., 1997 | IF(1:1000) | |
| Antibody | anti-DE-cadherin (Rat polyclonal) | Developmental Studies Hybridoma Bank | Cat# DE-cad, RRID:AB_2314298 | IF(1:50) |
| Antibody | anti-Ci155(Rat polyclonal) | Developmental Studies Hybridoma Bank | Cat# 2A1, RRID:AB_2109711 | IF(1:2) |
| Antibody | anti-GFP (Rabbit polyclonal) | Invitrogen | Cat# A-11122, RRID:AB_221569 | IF(1:100) |
| Antibody | anti-H3 (Rabbit polyclonal) | Cell Signaling Technologies | Cat# 9927, RRID:AB_330200 | IF(1:400), WB(1:1000) |
| Antibody | anti-H3K9 acetylation (Rabbit polyclonal) | Cell Signaling Technologies | Cat# 9927, RRID:AB_330200 | IF(1:300), WB(1:1000) |
| Antibody | anti-H4 pan acetylation (Rabbit polyclonal) | Cell Signaling Technologies | Cat# 06–598, RRID:AB_2295074 | IF(1:500) |
| Chemical compound, drug | Sodium butyrate | EMD Millipore | 19–137 | |
| Chemical compound, drug | Nicotinamide | Sigma-Aldrich | 72345 | |
| Chemical compound, drug | Etomoxir | Cayman Chemicals | Cay11969 | 5 µM |
| Chemical compound, drug | Mildronate | Cayman Chemicals | Cay15997 | 100 µM |
| Chemical compound, drug | L-carnitine hydrochloride | Sigma-Aldrich | C0283 | 100 mM |
| Chemical compound, drug | 2-DG | Sigma-Aldrich | D8375 | 100 mM |
| Chemical compound, drug | Sodium acetate | Sigma-Aldrich | 71196 | 50 mM |
| Chemical compound, drug | 2-NBDG | Invitrogen | N13195 | 0.25 mM |
| Chemical compound, drug | LipidTOX | Molecular Probes | H34477 | 1:1000 |
| Chemical compound, drug | Streptavidin-Cy3 | Molecular Probes | SA1010 | 1:200 |
| Chemical compound, drug | Nile red | Molecular Probes | N1142 | 0.5 ug/mL |
| Chemical compound, drug | DHE (Dihydroxy Ethidium) | Molecular Probes | D11347 | 0.3 µM |
| Sequence-based reagent | Pfk_F | This paper | PCR primers | ATCGTATTTTGGCTTGCCGC |
| Sequence-based reagent | Pfk_R | This paper | PCR primers | CCAGAGAGATGACCACTGGC |
| Sequence-based reagent | Hex_F | This paper | PCR primers | CTGCTTCTAACGGACGAACAG |
| Sequence-based reagent | Hex_R | This paper | PCR primers | GCCTTGGGATGTGTATCCTTGG |
| Sequence-based reagent | whd_F | This paper | PCR primers | GGCCAATGTGATTTCCCTGC |
| Sequence-based reagent | whd_R | This paper | PCR primers | TGCCCTGAACCATGATAGGC |
| Sequence-based reagent | Act5C_F | This paper | PCR primers | ACACATTTTGTAAGATTTGGTGTGT |
| Sequence-based reagent | Act5C_R | This paper | PCR primers | CCGTTTGAGTTGTGCTGT |
| Sequence-based reagent | Mcad_F | This paper | PCR primers | GGCCTGGATCTCGATGTGTT |
| Sequence-based reagent | Mcad_R | This paper | PCR primers | GATCACAGGAGTTTGGCCCAG |
| Sequence-based reagent | Mtpα_F | This paper | PCR primers | ATCACTGTTGGTGACGGACC |
| Sequence-based reagent | Mtpα_R | This paper | PCR primers | CTGCAGCAGTCTGATGGCTT |
| Sequence-based reagent | scully_F | This paper | PCR primers | GATCAAGAACGCCGTTTCCC |
| Sequence-based reagent | scully_R | This paper | PCR primers | CAGATCGGCCAGGATCACG |
| Sequence-based reagent | Mtpβ_F | This paper | PCR primers | CAGGCACTCGCTTTTGTCAT |
| Sequence-based reagent | Mtpβ_R | This paper | PCR primers | CCTGGCAATGTTGGAGGTCT |
| Sequence-based reagent | yip2_F | This paper | PCR primers | TCTGCCGCAACCAAAGGTAT |
| Sequence-based reagent | yip2_R | This paper | PCR primers | TTAAGACCGGCAGCATCCAG |
| Software, algorithm | Fiji | Fiji | RRID:SCR_002285 | |
| Software, algorithm | Photoshop CC | Adobe | RRID:SCR_014199 | |
| Software, algorithm | Imaris | Bitplane | RRID:SCR_007370 | |
| Commercial assay or kit | Click-iT EdU plus (DNA replication kit) | Invitrogen | C10639 | |
| Commercial assay or kit | ATP bioluminescence kit HSII | Sigma | 11699709001 | |
| Commercial assay or kit | Histone extraction kit | Abcam | ab113476 | |
| Commercial assay or kit | RNAeasy Mini Kit | Qiagen | 74104 |
Additional files
Download links
A two-part list of links to download the article, or parts of the article, in various formats.
Downloads (link to download the article as PDF)
Open citations (links to open the citations from this article in various online reference manager services)
Cite this article (links to download the citations from this article in formats compatible with various reference manager tools)
Fatty acid β-oxidation is required for the differentiation of larval hematopoietic progenitors in Drosophila
eLife 9:e53247.
https://doi.org/10.7554/eLife.53247


