Structure and activation mechanism of the BBSome membrane protein trafficking complex
- Blavatnik Institute, Harvard Medical School, United States
Figures
Figure 1 with 2 supplements
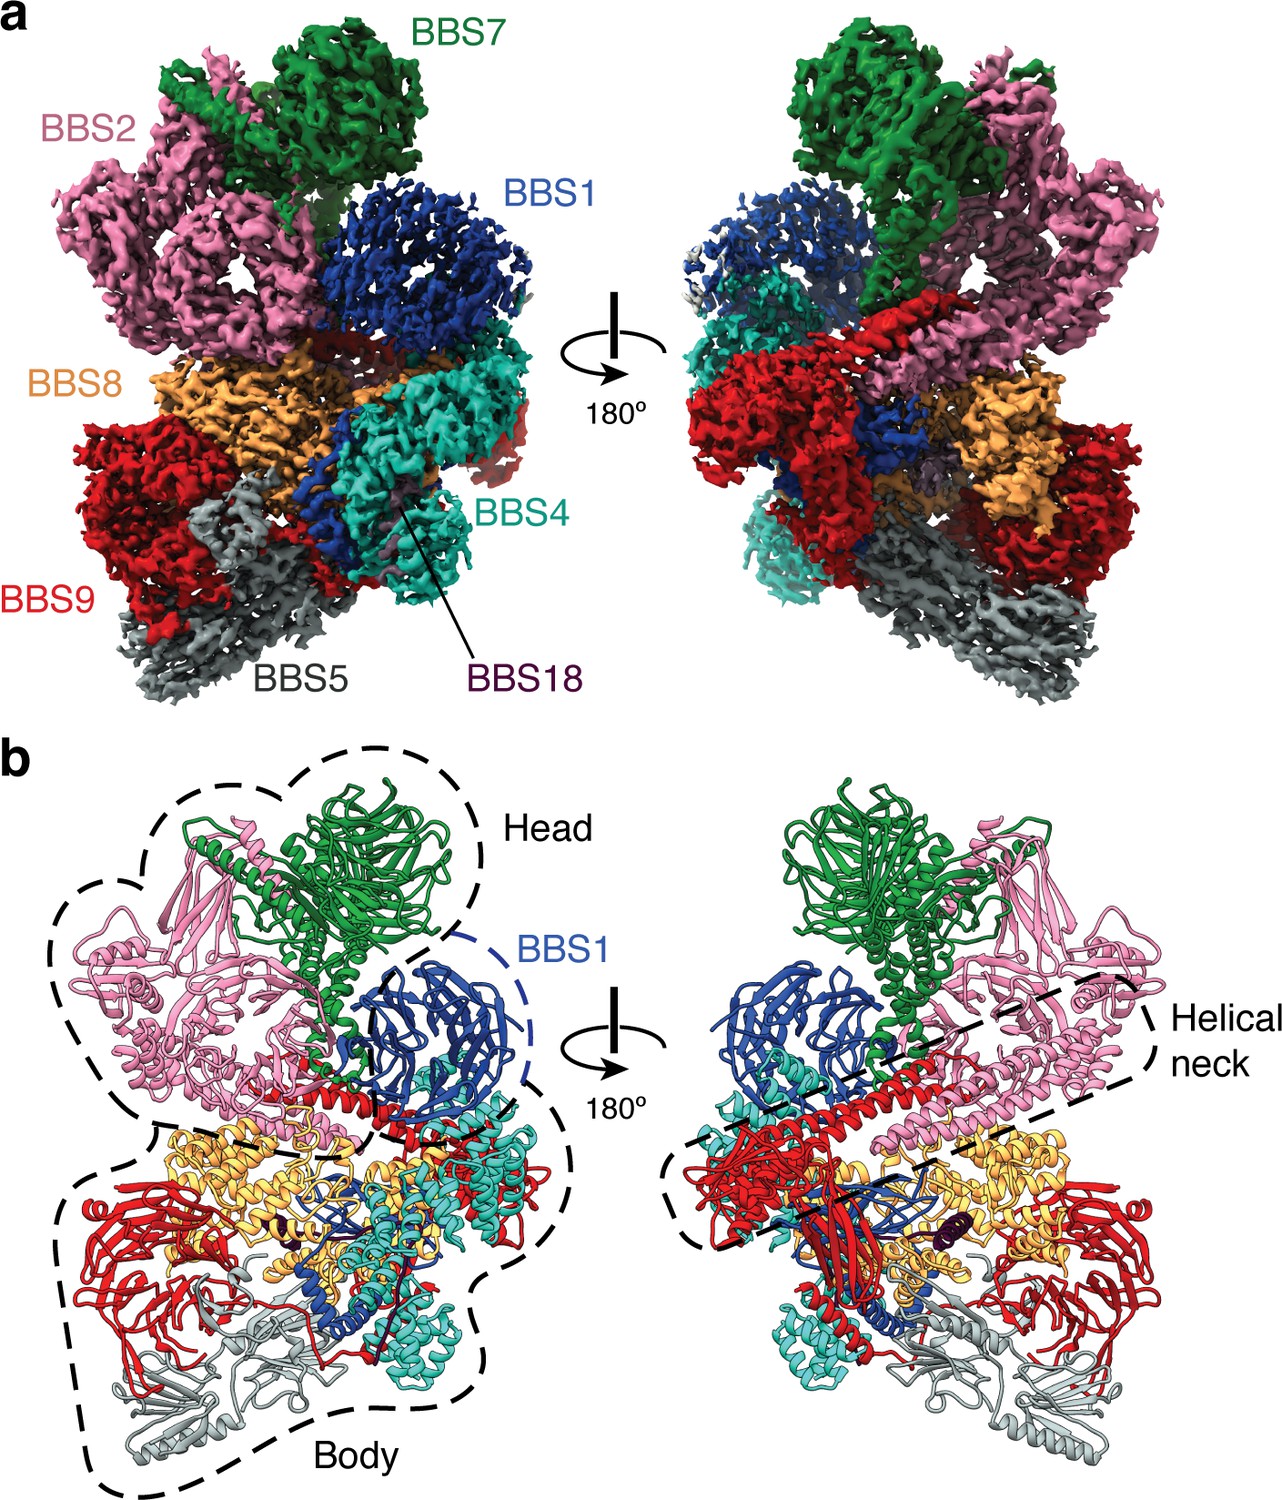
Structure of the mammalian BBSome.
(a) Two views of the cryo-EM structure of the bovine BBSome (postprocessed map contoured at a threshold of 0.015 and colored by subunit). (b) Atomic models of the eight subunits of the BBSome in the same orientations as the map in panel a. The BBSome can be conceptually divided into head and body lobes (indicated with dashed lines) with the β-propeller domain of BBS1 sandwiched between. A helical neck formed from abutting coiled coils from BBS2 and BBS9 connects the head and body of the BBSome.
Figure 1—figure supplement 1
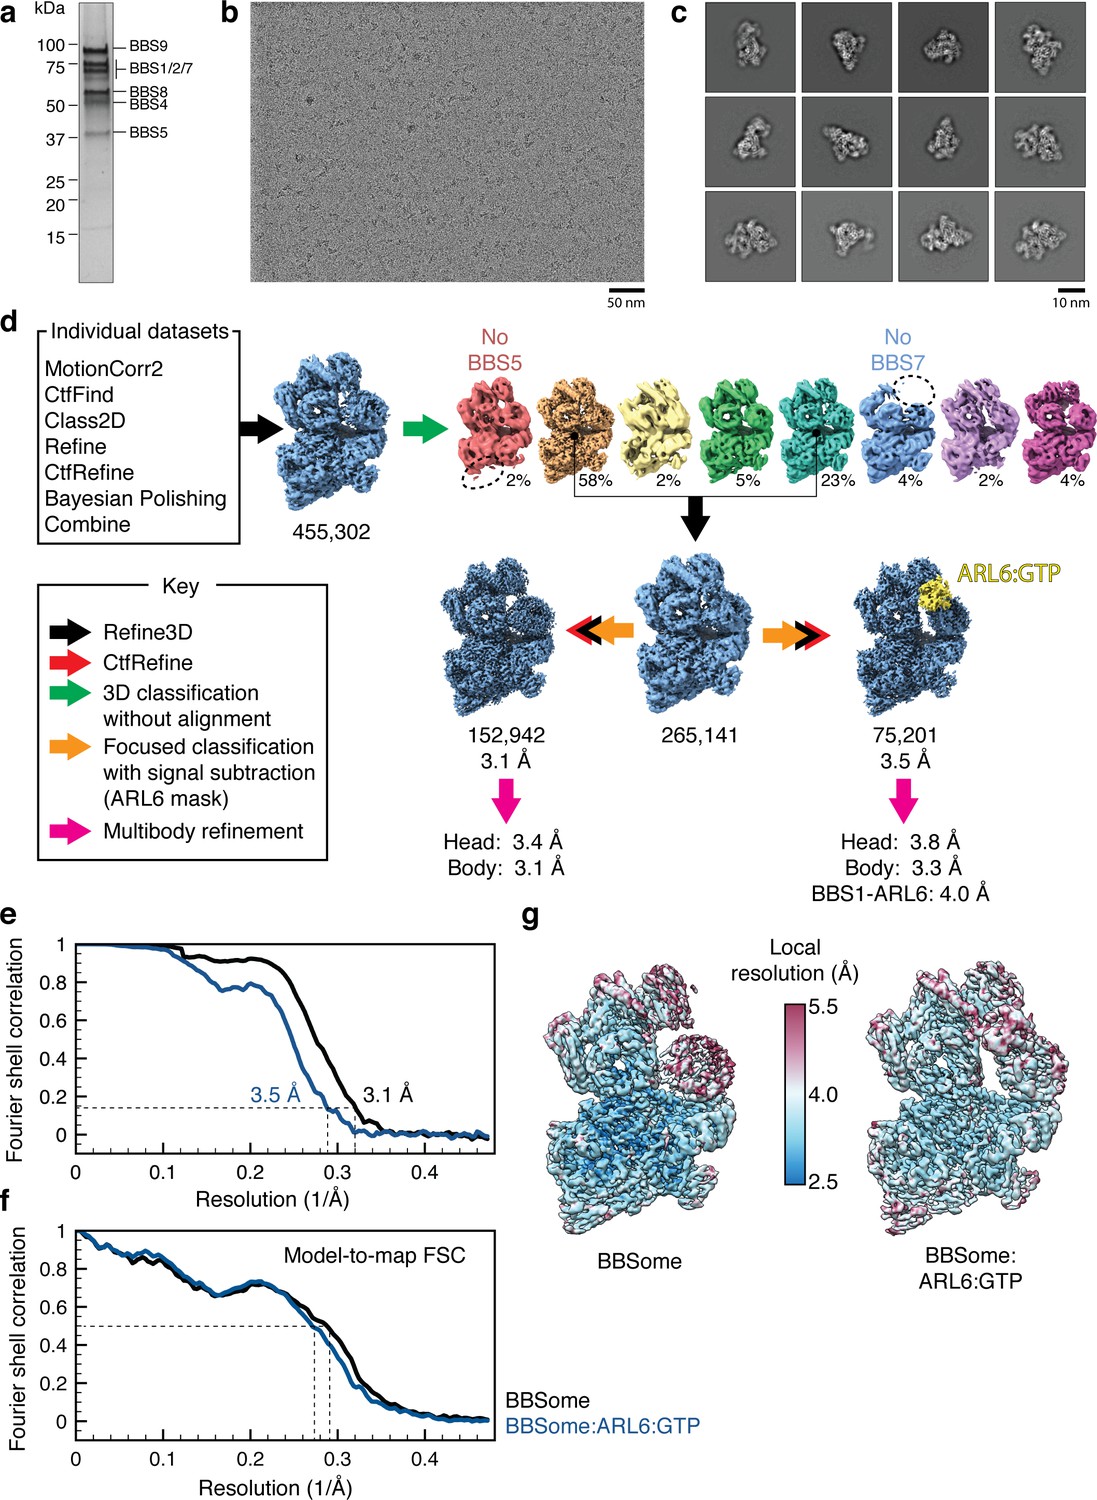
Cryo-EM data processing.
(a) Silver-stained SDS-PAGE gel showing the purity of the bovine BBSome after purification but before addition of excess ARL6 for cryo-EM analysis. The subunits are labeled by their predicted molecular masses (given in Table 2). (b) Representative micrograph. (c) Selected 2D classes showing that the BBSome adopts a variety of orientations on the cryo-EM grid. (d) Processing strategy used to computationally separate BBSome and BBSome:ARL6:GTP complexes. (e) Fourier shell correlation (FSC) curves for the BBSome (black) and BBSome:ARL6:GTP (blue) complexes. The resolution at FSC = 0.143 is given. (f) Model-to-map FSC curves for the BBSome (black) and BBSome:ARL6:GTP (blue) complexes. The FSC curves were calculated using the unsharpened maps prior to multibody refinement. The resolution at FSC = 0.5 is shown with a dashed line. (g) Unsharpened maps colored by local resolution (before multibody refinement).
Figure 1—figure supplement 2

Data quality.
(a) Representative examples of the density for each of the eight BBSome subunits. (b) Model and density map for a region of ARL6. (c) Density for the GTP in the BBSome:ARL6:GTP complex. All maps are postprocessed following multibody refinement and contoured at a threshold between 0.015–0.02. Landmark residues are labeled.
Figure 2
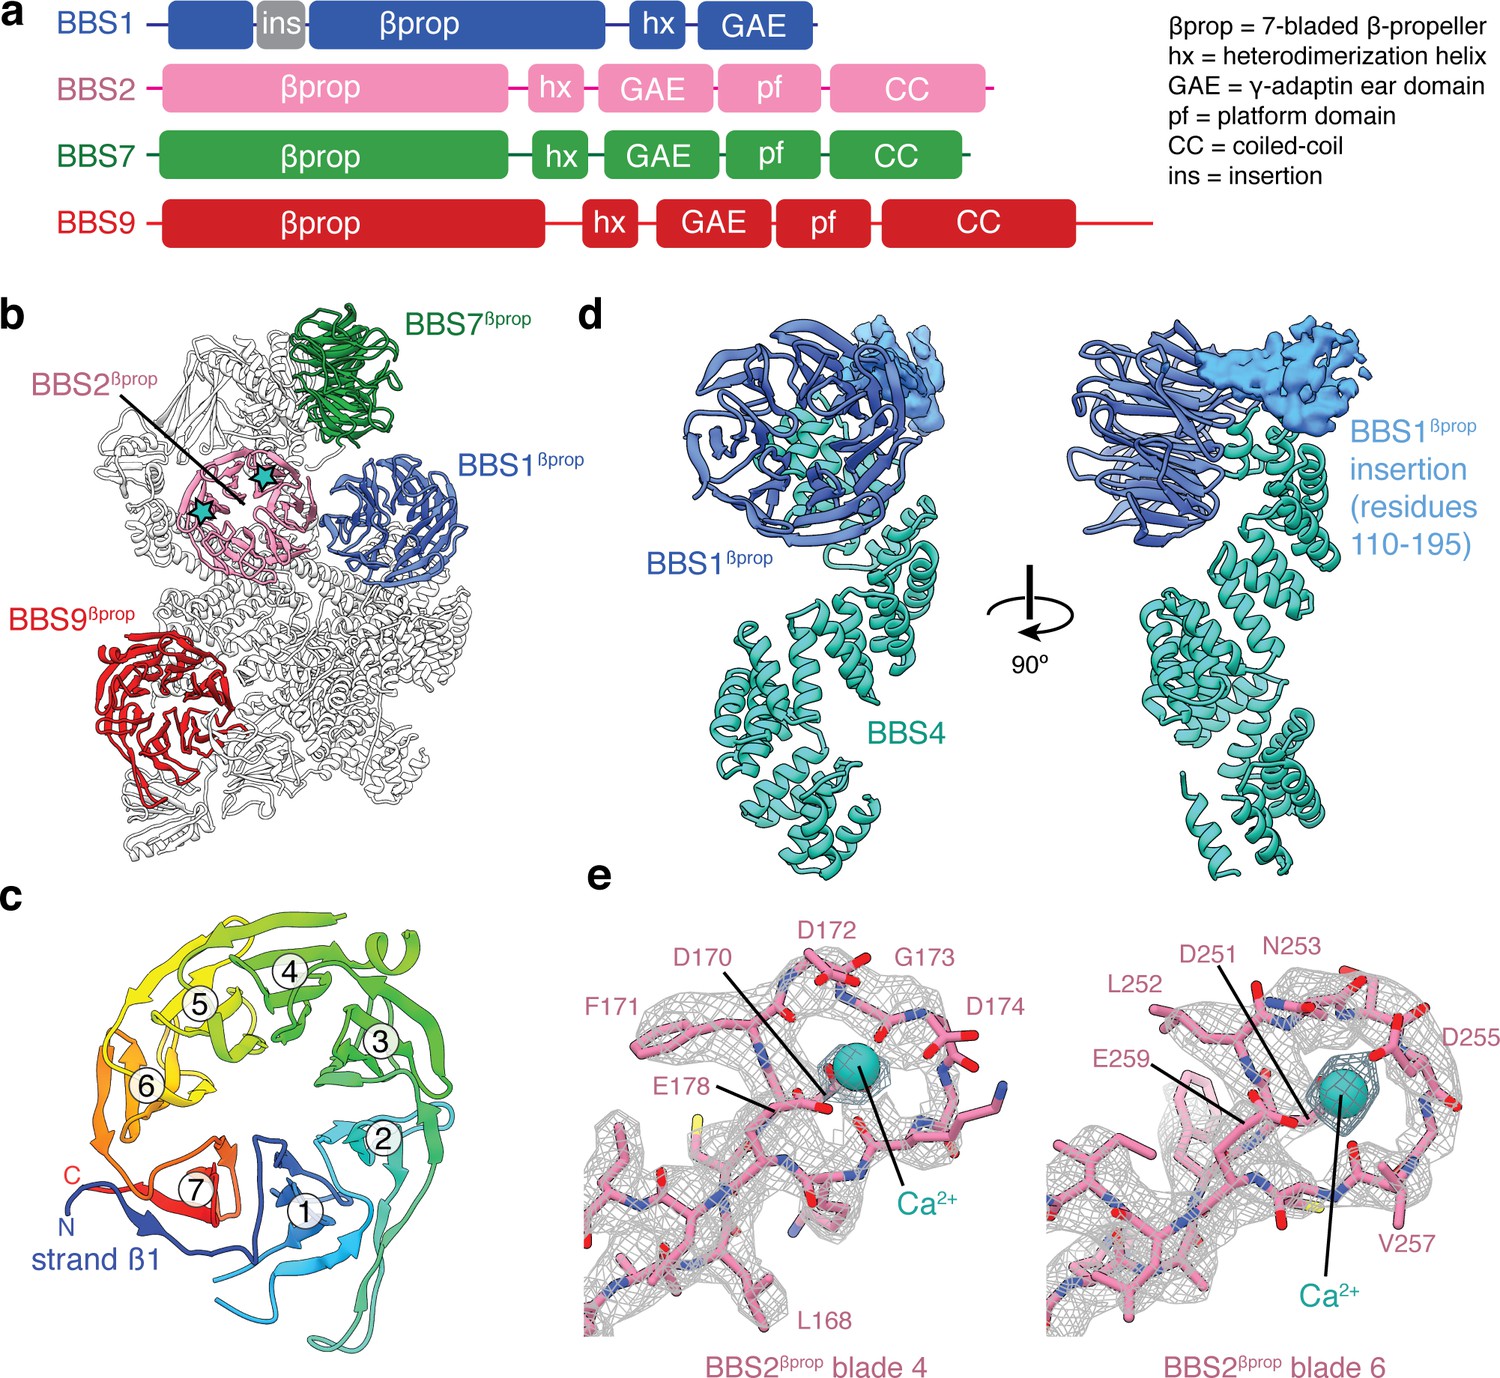
β-propeller domains of the BBSome.
(a) Domain organization of BBS1, BBS2, BBS7, and BBS9. (b) The bovine BBSome contains four homologous β-propeller domains. The positions of the calcium cations that bind BBS2βprop are marked with a star. (c) BBS9βprop rainbow colored from N to C-terminus. The N-terminal β1-strand serves as a ‘velcro’ closure for blade 7. The individual blades are numbered. (d) BBS1βprop contains a helical insertion that likely interacts with the N-terminus of BBS4. (e) Calcium-binding loops of BBS2βprop. Residue D170 is mutated in Bardet-Biedl syndrome (Patel et al., 2016).
Figure 3 with 1 supplement
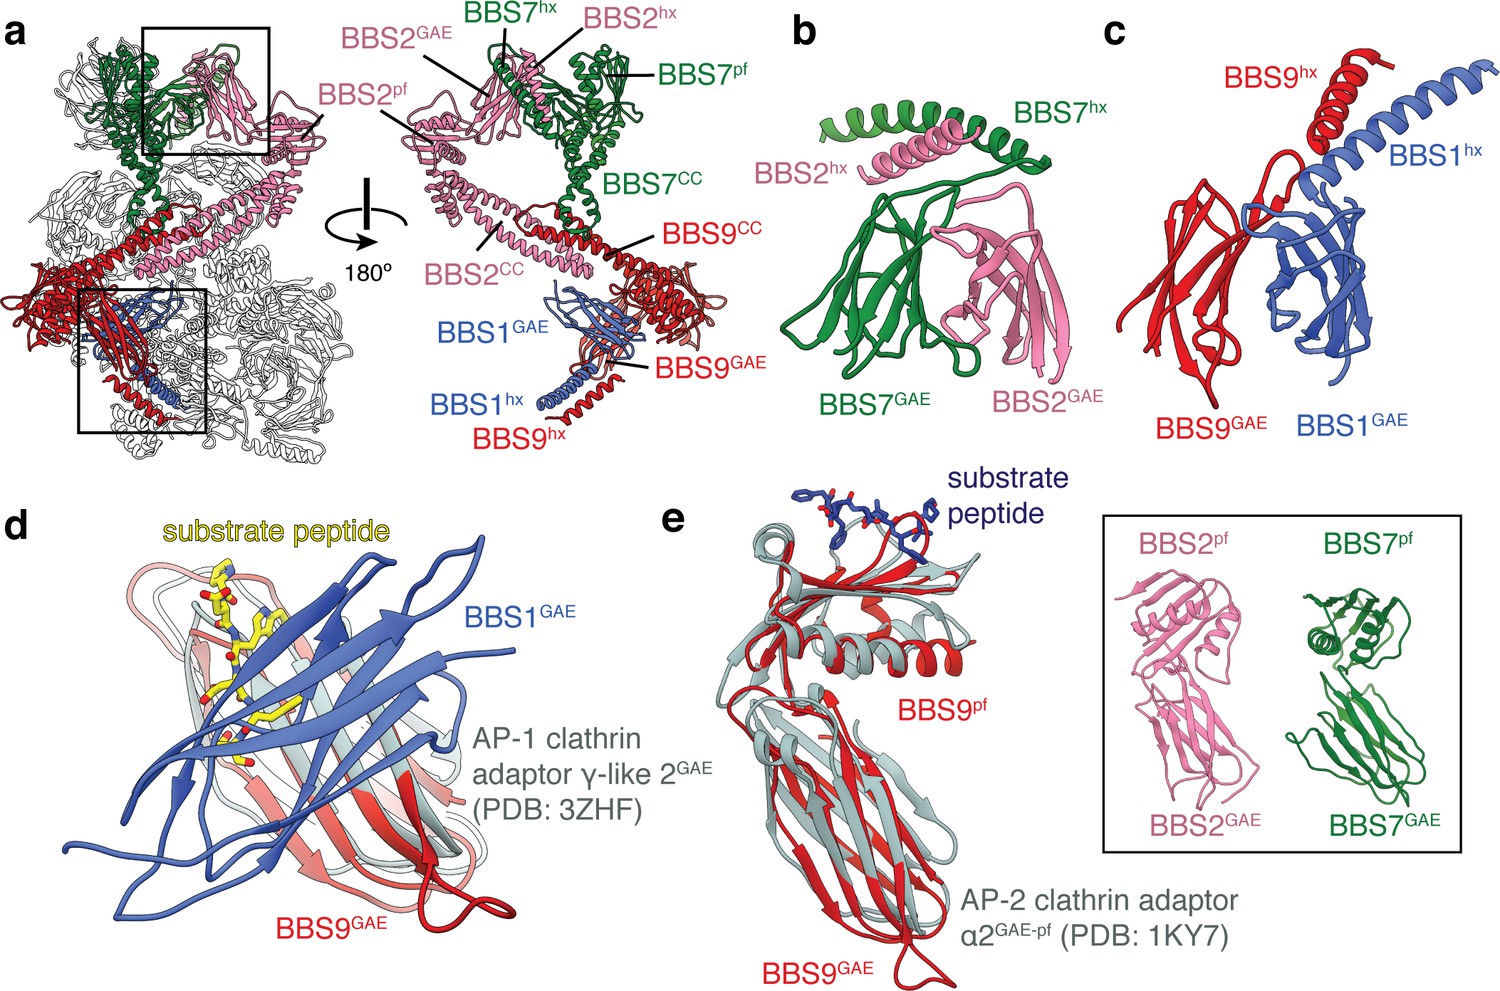
BBS1, BBS2, BBS7 and BBS9 are homologous proteins with similarities to the clathrin adaptor proteins.
(a) Location of BBS1, BBS2, BBS7, and BBS9 in the BBSome, colored except for their β-propeller domains. GAE heterodimers shown in panels c and d are boxed. In the rotated view all non-colored subunits are removed for clarity. (b) Heterodimerization of BBS2 and BBS7 involves the hx-GAE module. (c) Heterodimerization of BBS1 and BBS9. (d) Superposition of BBS9GAE with the GAE domain of AP-1 clathrin adaptor subunit γ-like 2 reveals that the heterodimerization interface with BBS1GAE would occlude the substrate binding pocket. (e) The GAE-pf module of BBS2, BBS7 and BBS9 resembles the equivalent module of the AP-2 clathrin adaptor α2-adaptin. While BBS9GAE-pf superposes closely with α2-adaptin, the GAE and pf domains of BBS2 and BBS7 (inset) adopt different orientations relative to one another.
Figure 3—figure supplement 1
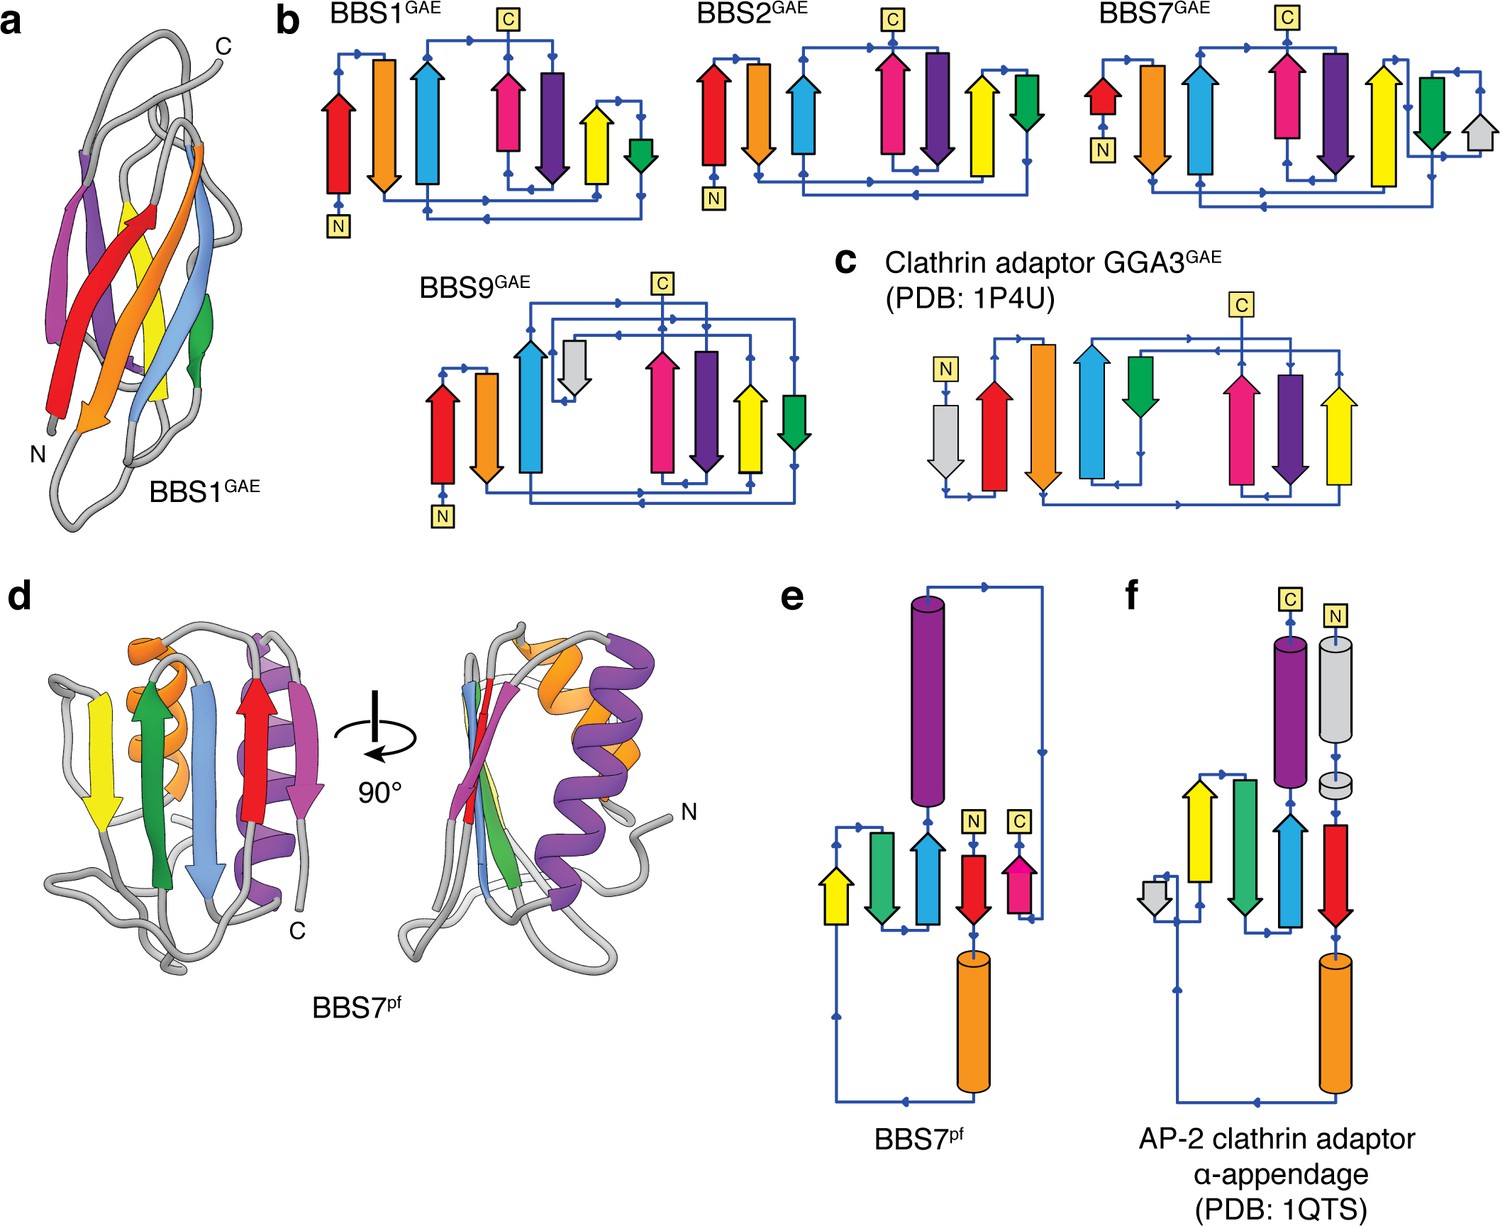
Topology of the BBSome GAE and platform (pf) domains.
(a) Three-dimensional model of the BBS1GAE domain with β-strands colored. (b) Topology diagrams for the GAE domains of BBS1, BBS2, BBS7, and BBS9 following the color scheme in panel a. BBS7GAE and BBS9GAE have strand insertions (shown in gray) between the β3 and β4 strands that contribute to different β-sheets in the two subunits. (c) The topology of a GAE domain from the clathrin adaptor protein GGA3 (PDB: 1P4U). Compared to the clathrin adaptor GAE domain, the β4 strand (green) of the GAE domains of the BBSome contributes to the other β-sheet. (d) Three-dimensional model of the BBS7pf domain with secondary structure elements colored. (e) Topology diagram of BBS7pf following the color scheme in panel d. BBS2pf and BBS9pf share the same topology as BBS7pf. (f) The platform domain of the AP-2 clathrin adaptor α-appendage has an additional N-terminal α-helix and but lacks the C-terminal β-strand found in the BBSome pf domains.
Figure 4
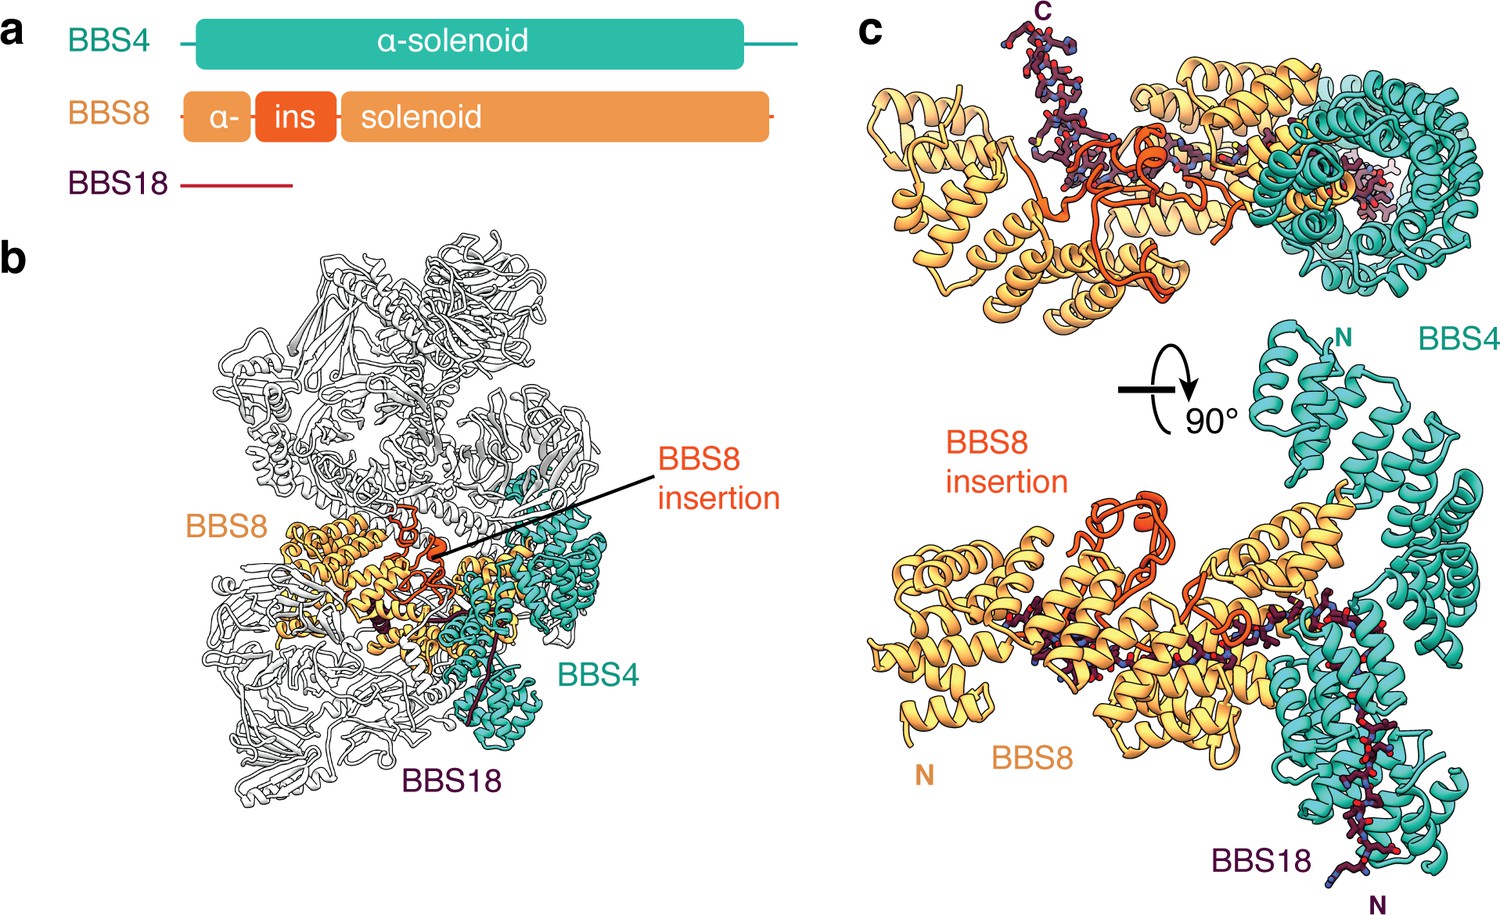
BBS18 spans the α-solenoids of BBS4 and BBS8.
(a) Domain organization of BBS4, BBS8 and BBS18. BBS18 is 69 residues long and does not form a globular domain. BBS8 has an insertion (ins.) between tetratricopeptide repeats 2 and 3. (b) Location of BBS4, BBS8 and BBS18 in the BBSome. (c) Two views of the BBS4-BBS8-BBS18 subcomplex. BBS8 binds perpendicular to BBS4. The insertion in BBS8 forms a globular domain made from long loops and short α-helices. BBS18 binds the concave surfaces of the BBS8 and the N-terminal half of BBS4.
Figure 5

BBS5.
(a) Position of BBS5 at the periphery of the BBSome body. BBS5 has tandem pleckstrin homology domains (BBS5N-PH and BBS5C-PH) and an extended C-terminus (BBS5C-term). (b) BBS5N-PH and BBS5C-PH superpose with a root-mean-square deviation (r.m.s.d.) of 0.97 Å. (c) Potential phosphoinositide binding sites were determined from crystal structures of pleckstrin homology domains in complex with inositol-(1,3,4,5)-tetrakisphosphate (PDB: 1FAO) (Ferguson et al., 2000) or sulfate ions (PDB: 2CAY) (Teo et al., 2006). Three of the four potential binding sites in BBS5 are occluded by other BBSome subunits (blue arrows). The fourth (green arrow) is accessible but not conserved. (d) Superposition of BBS5C-PH with the GLUE domain of Vps36, a component of the ESCRT-II complex (Teo et al., 2006). Vps36GLUE has a non-canonical phosphoinositide binding site (identified based on the binding site of a sulfate ion).
Figure 6 with 2 supplements
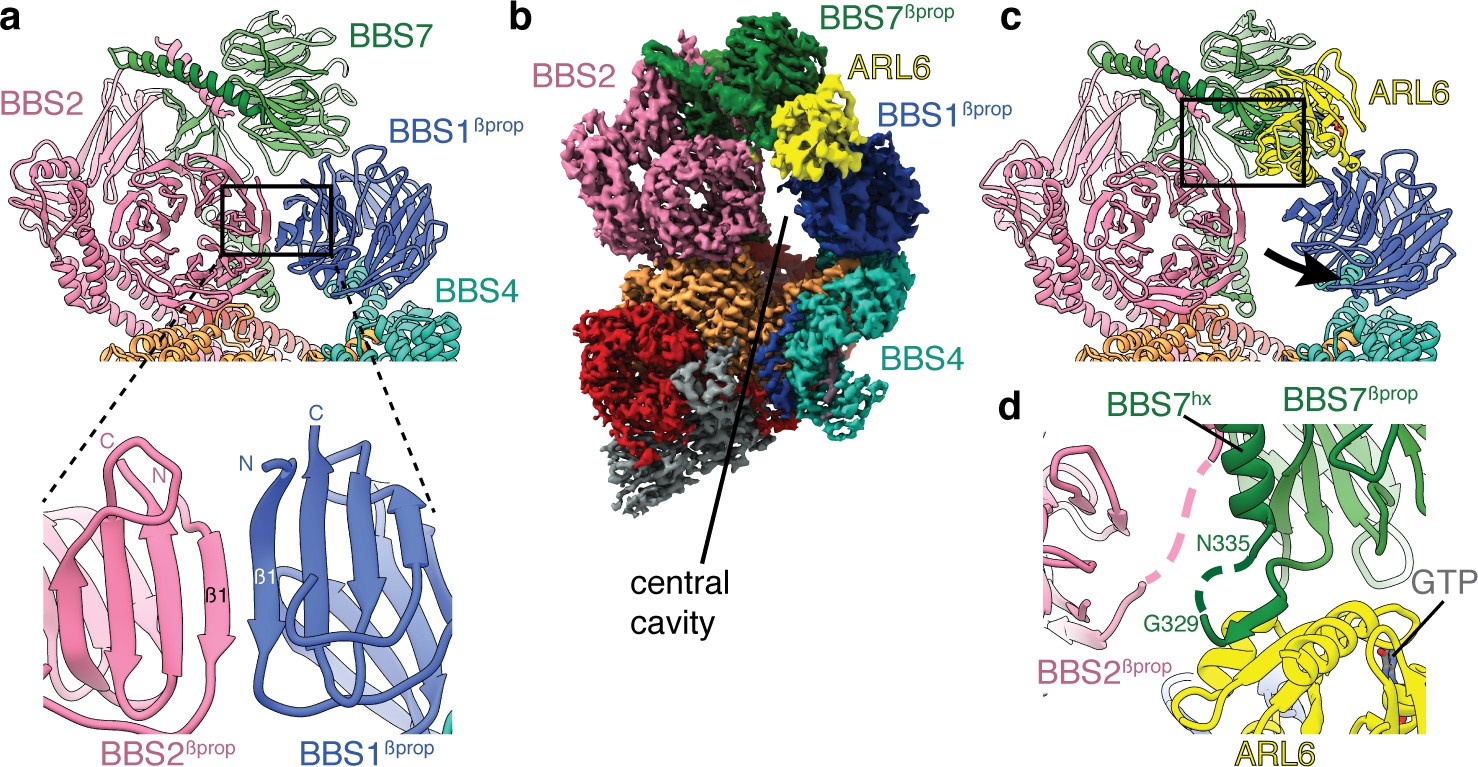
Mechanism of BBSome activation by ARL6.
(a) In the BBSome-only state, BBS1βprop and BBS2βprop bind edge-to-edge with hydrogen bonding between their β1 strands generating a continuous eight-stranded β-sheet. (b) Cryo-EM structure of the BBSome:ARL6:GTP complex (postprocessed map contoured at a threshold of 0.015 and colored by subunit). ARL6 interacts with BBS7βprop and BBS1βprop, which is in a rotated state compared to in the BBSome-only structure (Figure 1). (c) Rotation of BBS1βprop in the ARL6-bound state breaks the interaction with BBS2βprop and opens a central cavity in the BBSome. The region highlighted in panel d is boxed. (d) Details of the interaction between ARL6:GTP, BBS2, and BBS7. A loop of BBS7 that is disordered in the BBSome-only state forms a β-addition with the central β-sheet of ARL6. Regions of BBS2 and BBS7 that are not fully resolved in the cryo-EM density are shown as dashed lines.
Figure 6—figure supplement 1
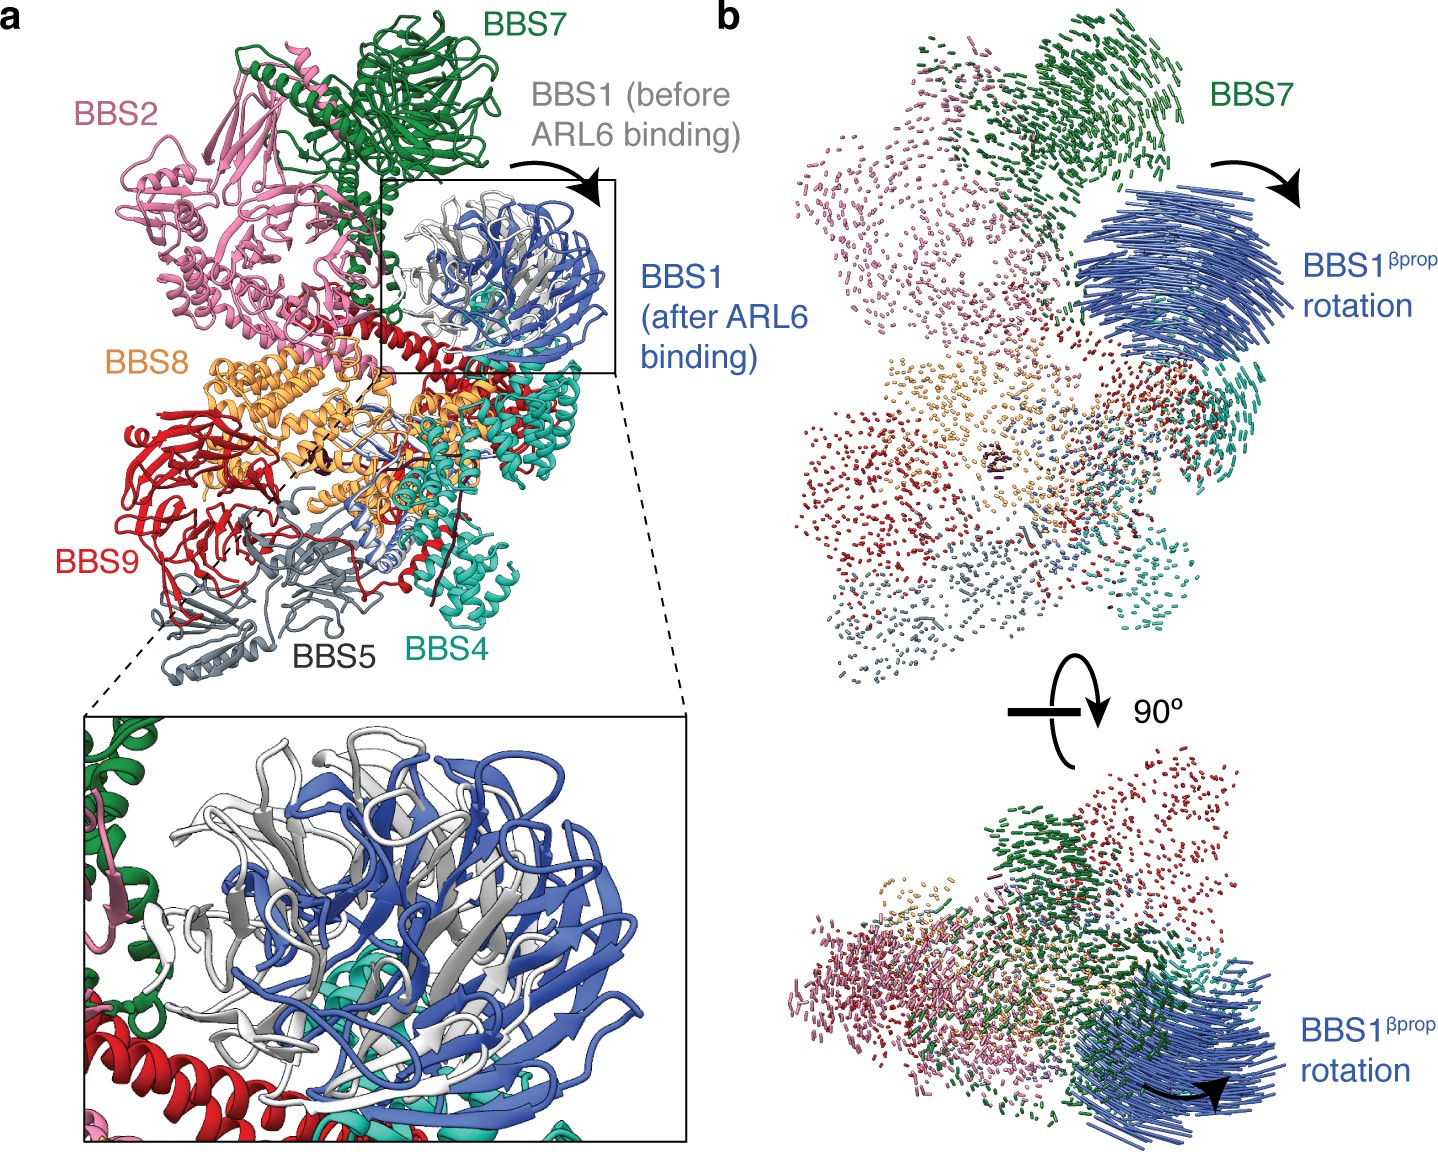
Rotation of BBS1βprop upon ARL6 binding.
(a) Atomic model of the BBSome showing the positions of BBS1 in the unbound (gray) and ARL6-bound states (blue). (b) Two orthogonal views showing interatomic vectors calculated between Cα atoms of the BBSome. Each vector is colored by subunit. Only BBS1βprop shows substantial movement in the ARL6 bound state. The direction of movement is indicated by an arrow.
Figure 6—figure supplement 2
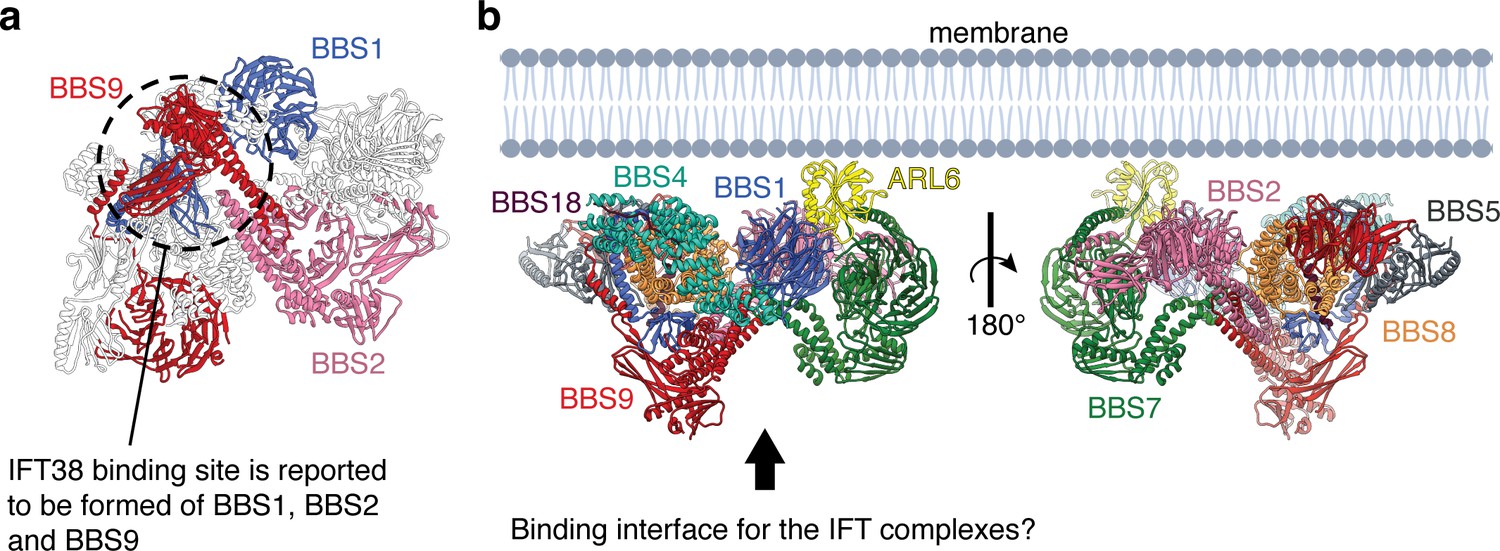
Model for the assembly of the BBSome at ciliary membranes.
(a) ARL6 determines the orientation of the BBSome at membrane. The relatively flat surface of the BBSome suggests that it runs parallel to the membrane with the opposite side interacting with the IFT complexes. (b) The BBSome as viewed from the arrow in panel a. The three subunits (BBS1, BBS2, and BBS9) that interact experimentally with IFT38 (Nozaki et al., 2019) are colored. The three domains come together at the base of the neck where the coiled-coils of BBS2 and BBS9 meet the GAE dimerization domains of BBS1 and BBS9 (circled).
Figure 7
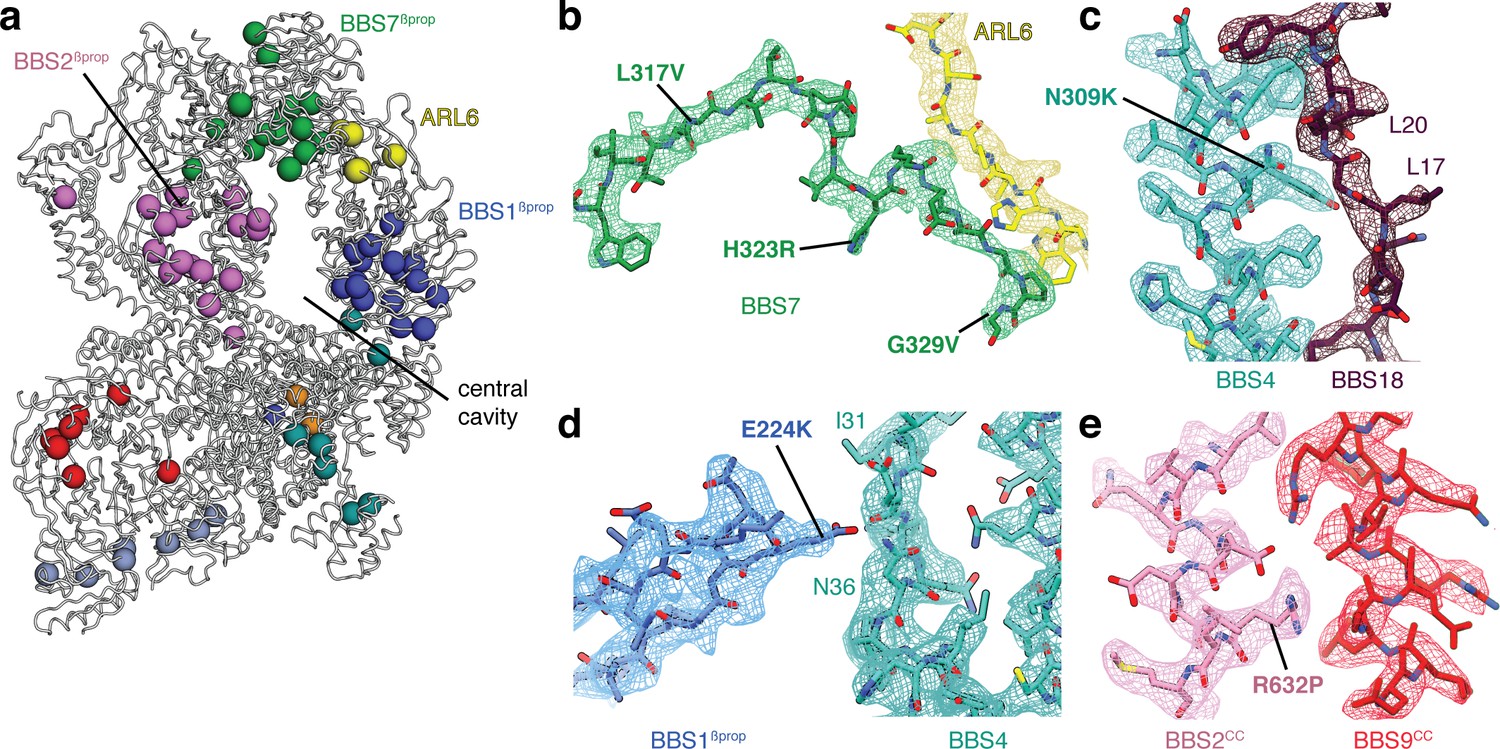
Structural insights into Bardet-Biedl syndrome.
(a) Known disease-causing mutations mapped onto the model of the BBSome:ARL6:GTP complex. Each sphere, colored by subunit, represents a missense mutation associated with either BBS or retinitis pigmentosa. (b) Mutations in BBS7 close to the binding site with ARL6. (c–e), BBS mutations that could disrupt subunit association and therefore proper BBSome assembly. Panels b-e show the postprocessed map contoured at a threshold between 0.015–0.02 and colored by subunit.
Videos
Video 1
Dynamics of the BBSome:ARL6:GTP complex represented by the first three principal motions from multibody refinement.
Two orthogonal views are shown for each motion.
Tables
Table 1
Cryo-EM data collection, refinement and validation statistics.
| BBSome (EMD-21144) (PDB 6VBU) | BBSome:ARL6:GTP (EMD-21145) (PDB 6VBV) | |
|---|---|---|
| Data collection and processing | ||
| Magnification | 81,000 | 81,000 |
| Voltage (kV) | 300 | 300 |
| Electron exposure (e–/Å2) | 56 | 56 |
| Defocus range (μm) | −1.1 to −2.4 | −1.1 to −2.4 |
| Pixel size (Å) | 1.06 | 1.06 |
| Symmetry imposed | C1 | C1 |
| Final particle images (no.) | 152,942 | 75,201 |
| Map resolution (Å) FSC threshold | 3.1 0.143 | 3.5 0.143 |
| Refinement | ||
| Resolution limit set in refinement (Å) | 3.1 | 3.5 |
| Map sharpening B factor (Å2) | −45.9 | −43.6 |
| Model composition Non-hydrogen atoms Protein residues Ligands | 30,209 3820 2 Ca2+ | 31,676 4000 2 Ca2+; 1 GTP |
| B factors (Å2) Protein Ligand | 60.8 74.0 | 53.9 82.3 |
| R.m.s. deviations Bond lengths (Å) Bond angles (°) | 0.005 0.68 | 0.004 0.71 |
| Validation MolProbity score Clashscore Poor rotamers (%) | 2.02 12.0 0.2 | 2.07 12.7 0.7 |
| Ramachandran plot Favored (%) Allowed (%) Disallowed (%) | 93.5 6.5 0.0 | 92.7 7.2 0.1 |
Table 2
Proteins present in the BBSome or BBSome:ARL6:GTP complexes.
| Protein | NCBI accession | Protein length (residues) | Molecular mass (kDa) | Total built residues (BBSome) | Total built residues (BBSome: ARL6:GTP) |
|---|---|---|---|---|---|
| BBS1 | XP_010819476.1 | 668 | 72.9 | 486 | 486 |
| BBS2 | NP_001033249.1 | 721 | 79.8 | 659 | 659 |
| BBS4 | NP_001069424.1 | 519 | 58.2 | 386 | 391 |
| BBS5 | NP_001094602 | 341 | 38.8 | 300 | 300 |
| BBS7 | NP_001178275.2 | 715 | 80.4 | 698 | 706 |
| BBS8 | XP_024853996 | 501 | 56.6 | 475 | 475 |
| BBS9 | NP_001179782 | 887 | 99.1 | 764 | 764 |
| BBS18 | XP_003587939.1 | 69 | 8.1 | 52 | 52 |
| ARL6 | NP_001069250.1 | 186 | 21.1 | - | 167 |
Table 3
Mutations in ARL6 associated with BBS or retinitis pigmentosa (RP) that are mapped onto the structure in Figure 7a.
The mapped disease-associated mutations in core BBSome subunits are provided as a supplemental table in Chou et al. (2019).
| Gene | Protein mutation | Phenotype | Reference |
|---|---|---|---|
| ARL6 | T31M | BBS | (Fan et al., 2004) |
| ARL6 | T31R | BBS | (Fan et al., 2004) |
| ARL6 | A89V | RP | (Aldahmesh et al., 2009) |
| ARL6 | I91T | BBS | (Chandrasekar et al., 2018) |
| ARL6 | I94T | RP | (Khan et al., 2013) |
| ARL6 | G169A | BBS | (Young et al., 1998) |
| ARL6 | L170W | BBS | (Fan et al., 2004) |
Key resources table
| Reagent type (species) or resource | Designation | Source or reference | Identifiers | Additional information |
|---|---|---|---|---|
| Gene (Bos taurus) | ARL6. NCBI Gene ID: 519014 | IDT | - | Codon optimized |
| Biological Sample | Bovine dark-adapted retinas | W L Lawson company (NE, USA) | - | |
| Strain, strain background Escherichia coli cells | BL21(DE3) | Novagen | 69450–4 | Chemically Competent cells |
| Affinity resin | Anti-Flag M2 | Sigma | A2220 | |
| Chemical compound | GTP | Sigma | G8877 | |
| Cryo grids | QUANTIFOIL R 1.2/1.3 | Electron Microscopy Sciences | Q4100AR1.3 | |
| Commercial assay or kit | Gibsons Assembly | Invitrogen | A14606 | |
| Sequence based reagents | Arl6_dN16 Fwd | This paper | PCR primers | GAAGTTCATGTGCTGTGTTTGG |
| Sequence based reagents | Arl6_dN16 Rev | This paper | PCR primers | ACTCCCACCCCCTTTATCATC |
| Sequence based reagents | Arl6_addHis_Fwd | This paper | PCR primers | TG GAA GTT CTG TTC CAG GGG CCC GATTACAAGGACGATGATGATAAAG |
| Sequence based reagents | Arl6_addHis_Rev | This paper | PCR primers | GAATTCTCGAGCGGCCGCCCTTATGTCTTCACCGACTGAATC |
| Software, algorithm | serialEM | doi:10.1038/s41592-019-0396-9 | RRID:SCR_017293 | https://bio3d.colorado.edu/SerialEM |
| Software, algorithm | MotionCor2 v.1.2.1 | doi:10.1038/nmeth.4193 | RRID:SCR_016499 | |
| Software, algorithm | CTFFIND v.4.1.13 | doi:10.1016/j.jsb.2015.08.008 | RRID:SCR_016732 | https://cistem.org/ctffind4 |
| Software, algorithm | RELION v.3.0.4 | doi:10.7554/eLife.42166 | RRID:SCR_016274 | https://www3.mrc-lmb.cam.ac.uk/relion/index.php/Download_%26_install |
| Software, algorithm | Coot v. 0.9-pre | doi:10.1107/S0907444904019158 | RRID:SCR_014222 | https://www2.mrc-lmb.cam.ac.uk/personal/pemsley/coot/ |
| Software, algorithm | Phenix.real_space_refine | doi:10.1107/S2059798318006551 | RRID:SCR_014224 | https://www.phenix-online.org/ |
| Software, algorithm | UCSF Chimera v1.13.1 | doi:10.1002/jcc.20084 | RRID:SCR_004097 | http://plato.cgl.ucsf.edu/chimera/ |
| Software, algorithm | UCSF ChimeraX v.0.9 | doi:10.1002/pro.3235 | RRID:SCR_015872 | https://www.cgl.ucsf.edu/chimerax/ |
| Software, algorithm | PyMOL v2.3.2 | PyMOL Molecular Graphics System, Schrödinger, LLC | RRID:SCR_000305 | http://www.pymol.org/ |
| Software, algorithm | crYOLO | doi:10.1038/s42003-019-0437-z | - | http://sphire.mpg.de/wiki/doku.php?id=pipeline:window:cryolo |
| Software, algorithm | ResMap | doi:10.1038/nmeth.2727 | - | http://resmap.sourceforge.net/ |
| Software, algorithm | I-TASSER | doi:10.1186/1471-2105-9-40 | RRID:SCR_014627 | https://zhanglab.ccmb.med.umich.edu/I-TASSER |
| Software, algorithm | MolProbity v.4.3.1 | doi:10.1107/S0907444909042073 | RRID:SCR_014226 | http://molprobity.biochem.duke.edu |
| Software, algorithm | SBGrid | doi: 10.7554/eLife.01456 | RRID:SCR_003511 | https://sbgrid.org/ |
Additional files
Download links
A two-part list of links to download the article, or parts of the article, in various formats.
Downloads (link to download the article as PDF)
Open citations (links to open the citations from this article in various online reference manager services)
Cite this article (links to download the citations from this article in formats compatible with various reference manager tools)
Structure and activation mechanism of the BBSome membrane protein trafficking complex
eLife 9:e53322.
https://doi.org/10.7554/eLife.53322


