Analysis of pulsed cisplatin signalling dynamics identifies effectors of resistance in lung adenocarcinoma
- The Kinghorn Cancer Centre, Garvan Institute of Medical Research, Australia
- St Vincent's Hospital Clinical School, University of New South Wales, Australia
- Crown Princess Mary Cancer Centre, Westmead and Blacktown Hospitals, Australia
- St Vincent’s Hospital Sydney, Australia
- Hudson Institute of Medical Research, Australia
- Department of Molecular and Translational Medicine, School of Medicine, Nursing and Health Sciences, Monash University, Australia
- Research Institute in Oncology and Hematology, Cancer Care Manitoba, Canada
- Department of Internal Medicine, Rady Faculty of Health Science, University of Manitoba, Canada
- ANZAC Research Institute, Australia
- The University of Sydney Concord Clinical School, Faculty of Medicine and Health, Australia
- School of Medicine, University College Dublin, Belfield, Ireland
Figures
Figure 1 with 4 supplements
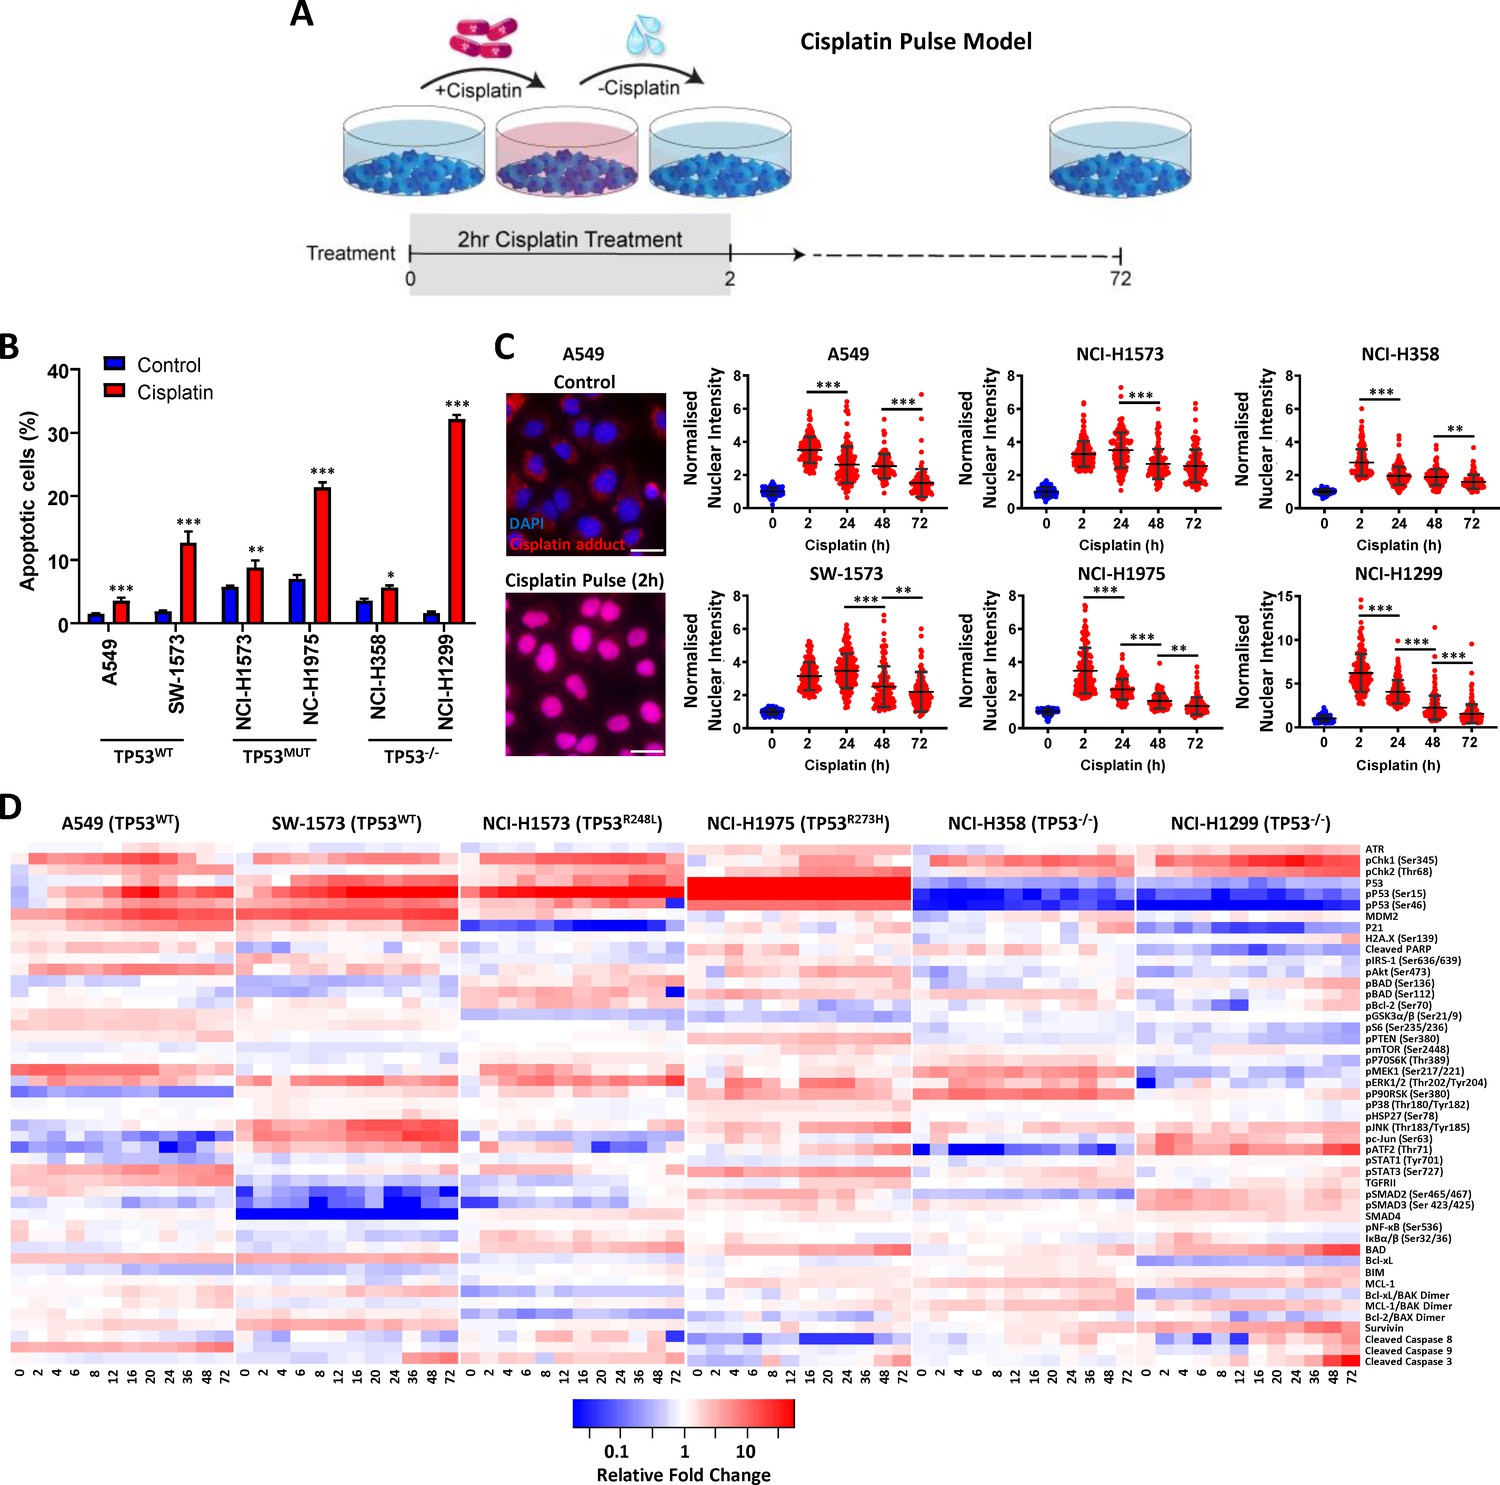
Multiplexed analysis of cisplatin-induced signalling.
(A) Schematic of the cisplatin pulse model (5 µg/mL, 2 hr) and continuous pulse model (5 μg/mL, 72 hr). (B) Apoptosis measured by propidium iodide staining for the sub-G1 population, performed 72 hr following a cisplatin pulse across a panel of lung adenocarcinoma cell lines, as indicated (n = 3, mean ± SD). Statistical significance was determined by t-test (***p<0.001, **p<0.01, *p<0.05). (C) Representative images of anti-cisplatin antibody staining in A549 cells following a cisplatin pulse, and quantification of nuclear cisplatin-DNA adducts across the cell line panel (n ≥ 100, mean ± SD). Nuclear staining intensity was normalized to background, cytoplasmic staining within each cell line. Statistical significance was determined by one-way ANOVA (***p<0.001, **p<0.01). All treatment conditions (red) are significantly different from control (blue), p<0.001. (D) Multiplexed analysis of DNA damage, apoptosis and signalling pathways following a cisplatin pulse across a panel of lung adenocarcinoma cell lines, as indicated (n = 3, mean).
-
Figure 1—source data 1
Summary of the analytes used for multiplex signalling analysis.
- https://cdn.elifesciences.org/articles/53367/elife-53367-fig1-data1-v1.xlsx
Figure 1—figure supplement 1
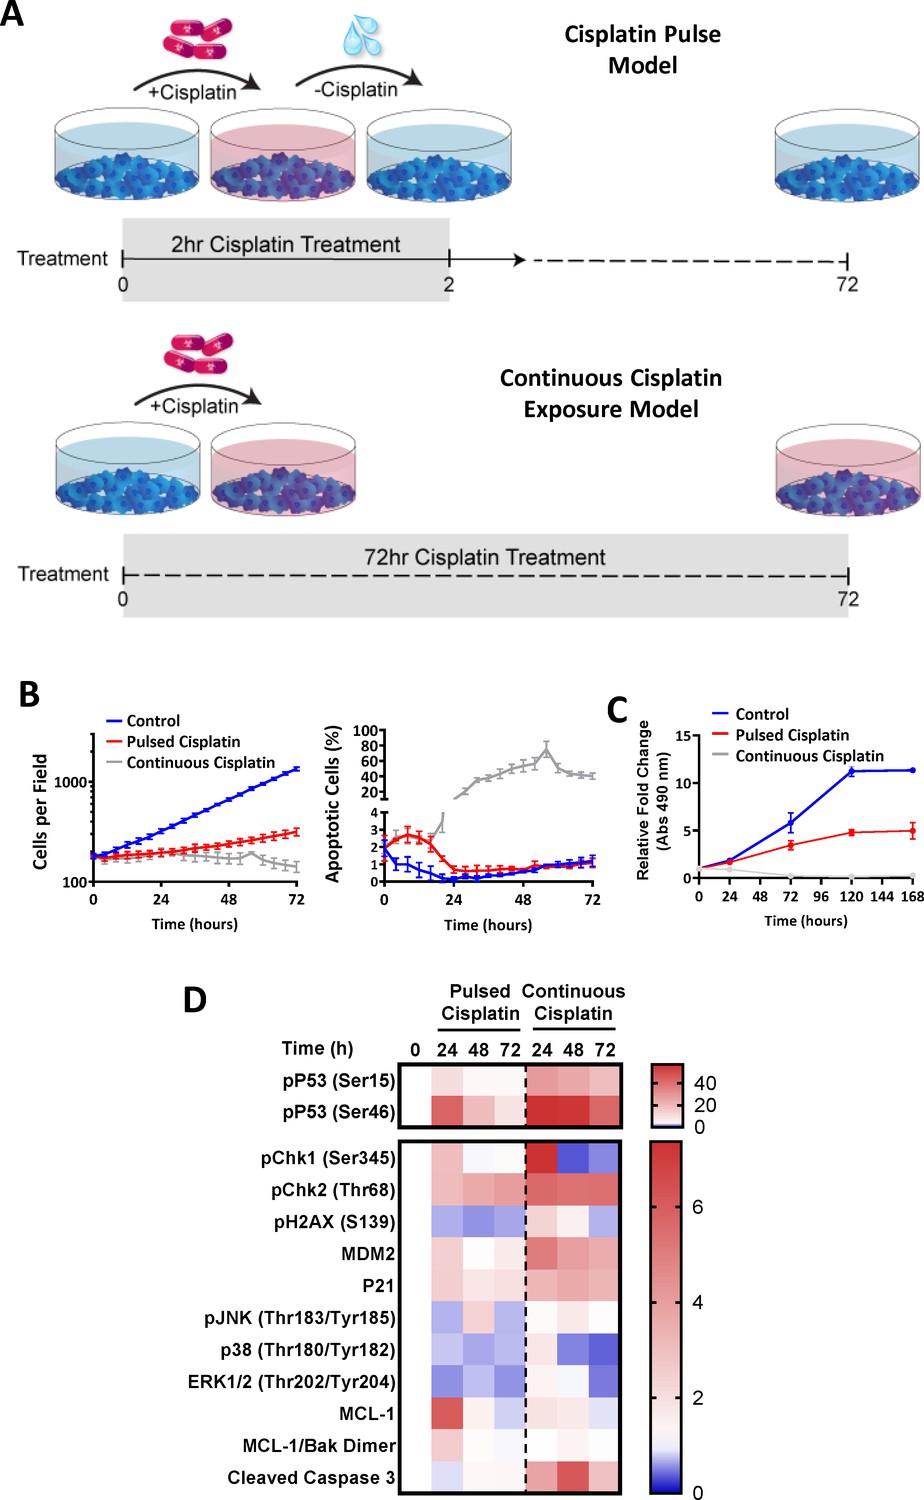
Continuous versus pulsed cisplatin treatment of A549 cells.
(A) Schematic of the cisplatin pulse model (5 µg/mL, 2 hr) and continuous pulse model (5 μg/mL, 72 hr). (B) Live-cell imaging of A549 cells treated either continuously, or with a cisplatin pulse. Apoptotic cells were identified by uptake of propidium iodide (mean ± SD). (C) MTS Proliferation assay performed on A549 cells treated either continuously, or with a cisplatin pulse (mean ± SD, n = 6). (D) Multiplexed analysis of key DNA damage, apoptosis and signalling proteins in A549 cells treated either continuously, or with a cisplatin pulse (n = 3, mean).
Figure 1—figure supplement 2
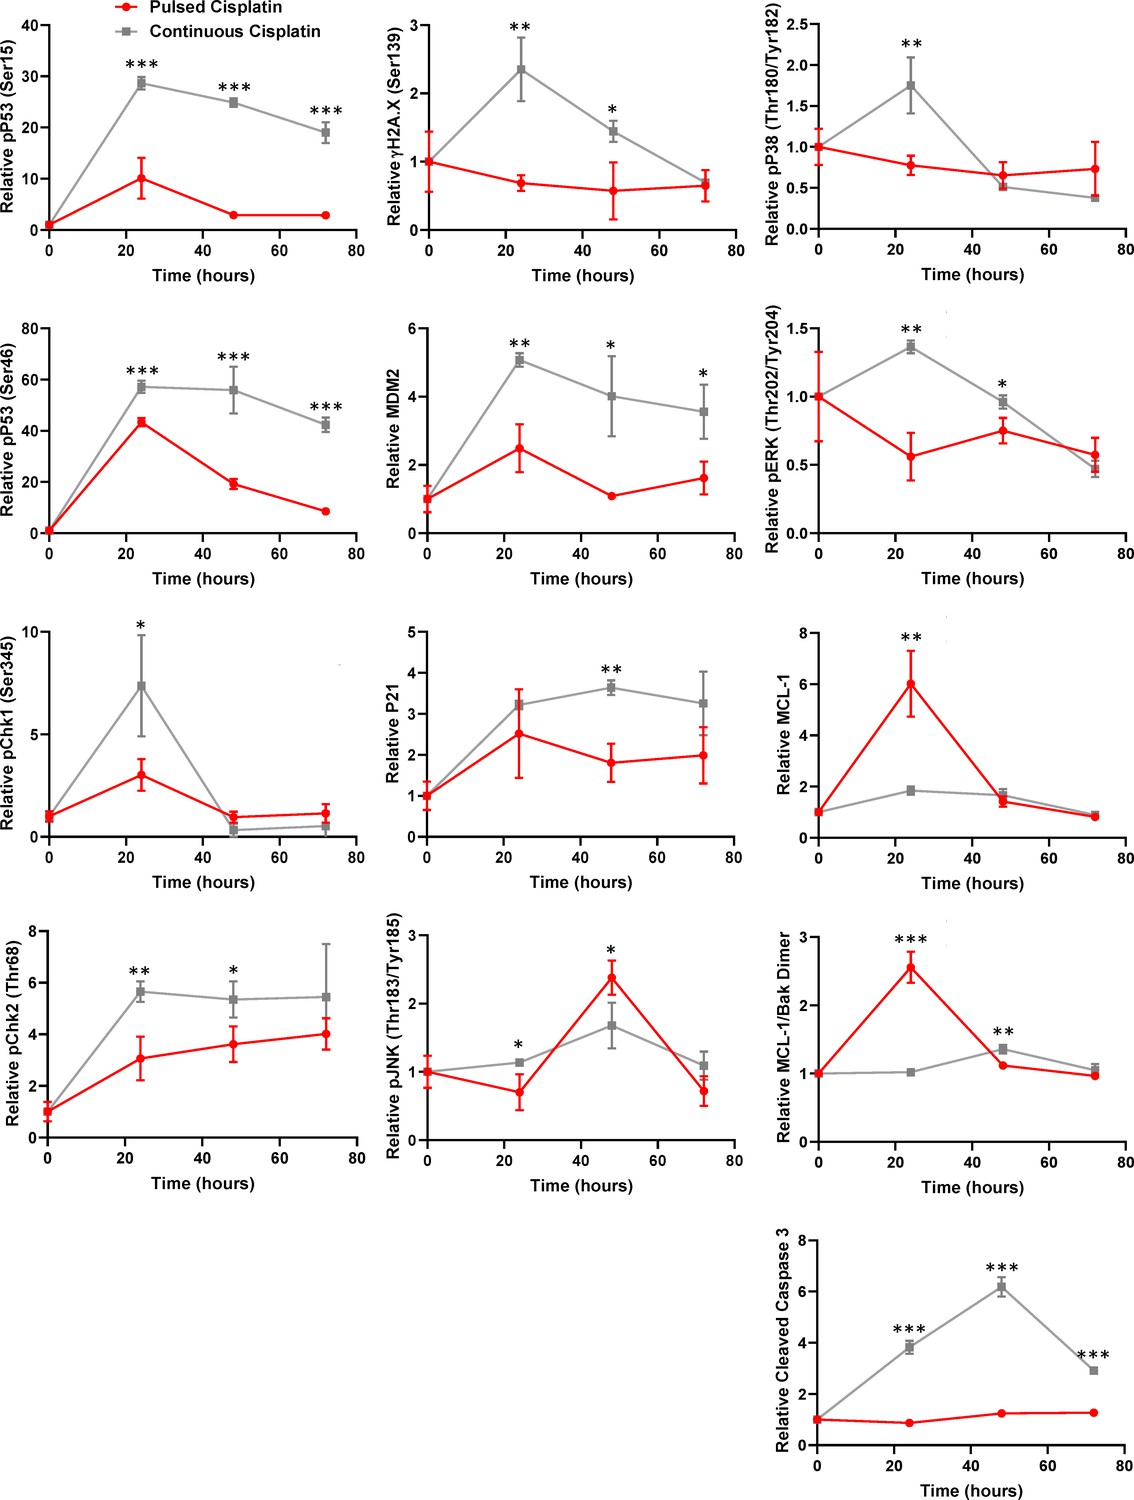
Continuous versus pulsed cisplatin treatment of A549 cells.
Raw data for the timecourse, multiplex analysis of DNA damage response proteins following continuous cisplatin treatment (grey) or a cisplatin pulse (red) (5 μg/mL, 2 hr) in A549 cells. Statistical significance was determined by Student’s t-test (n = 3, mean ± SD. ***p<0.001, **p<0.01, *p<0.05).
Figure 1—figure supplement 3
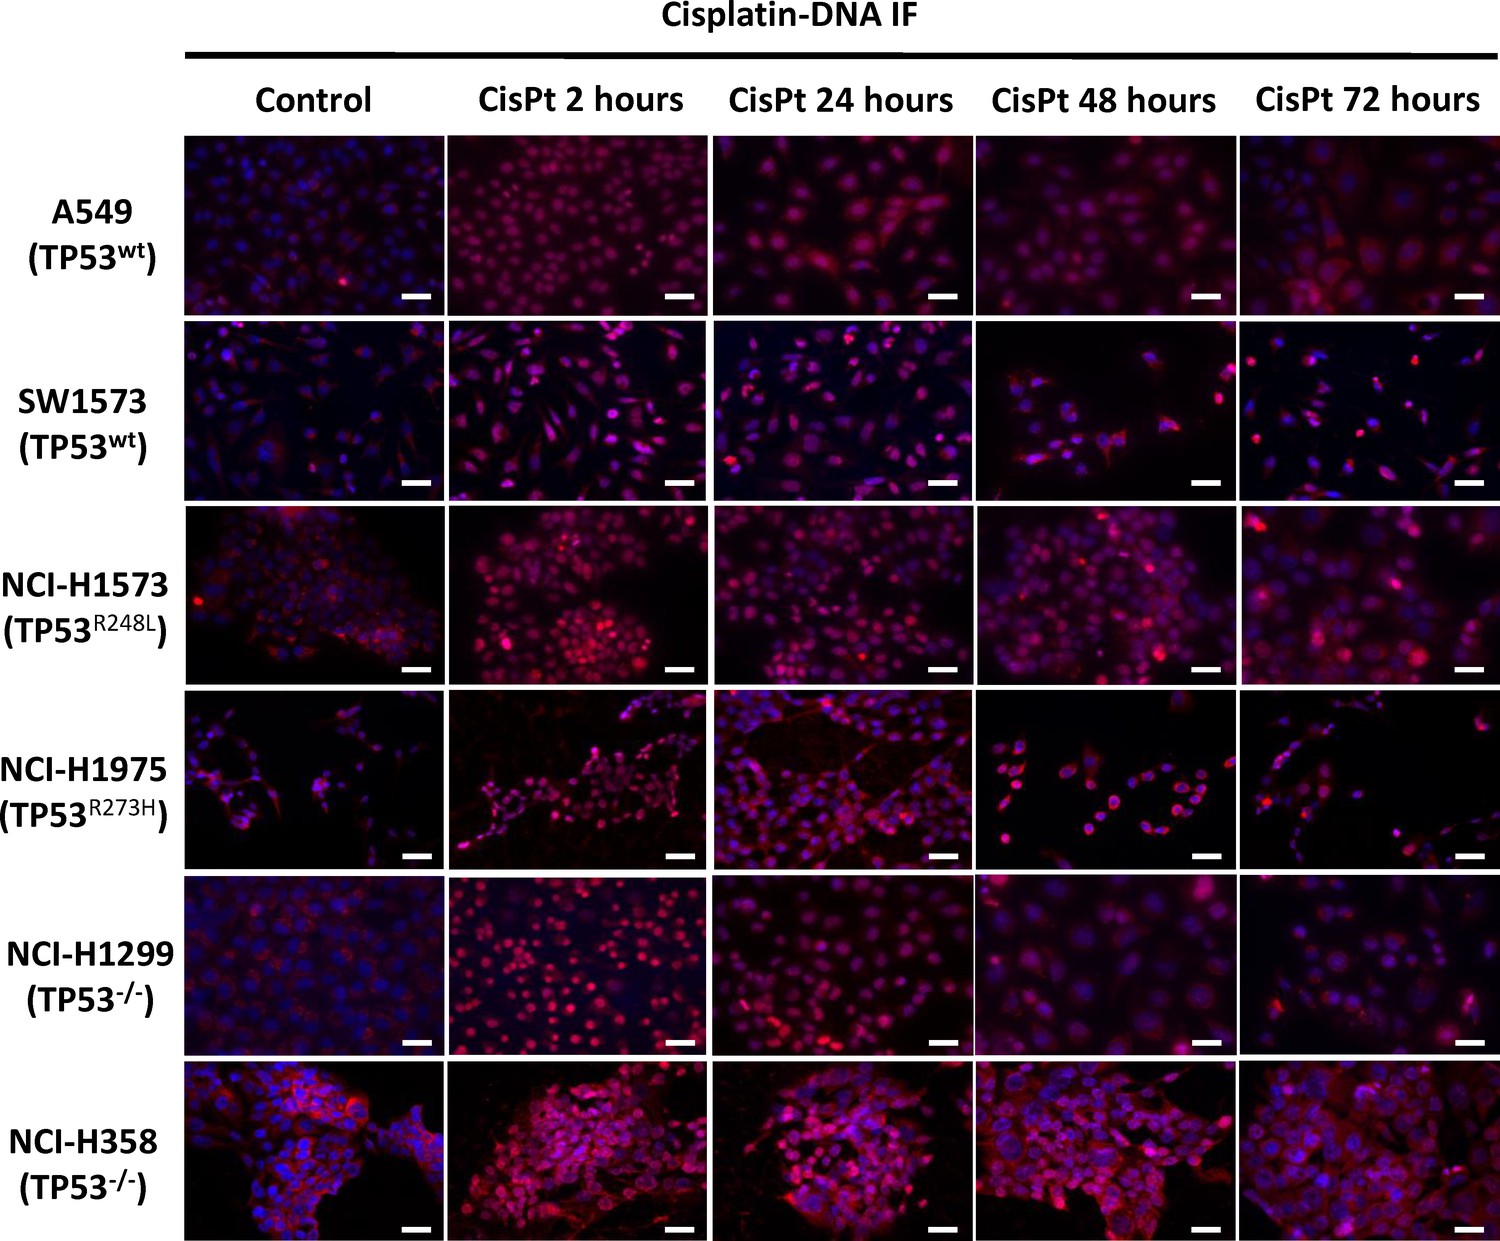
Imaging of cisplatin-DNA adducts.
Representative images of anti-cisplatin antibody staining across the cell line panel following a cisplatin pulse (5 μg/mL, 2 hr). Scale bar: 40 μm.
Figure 1—figure supplement 4
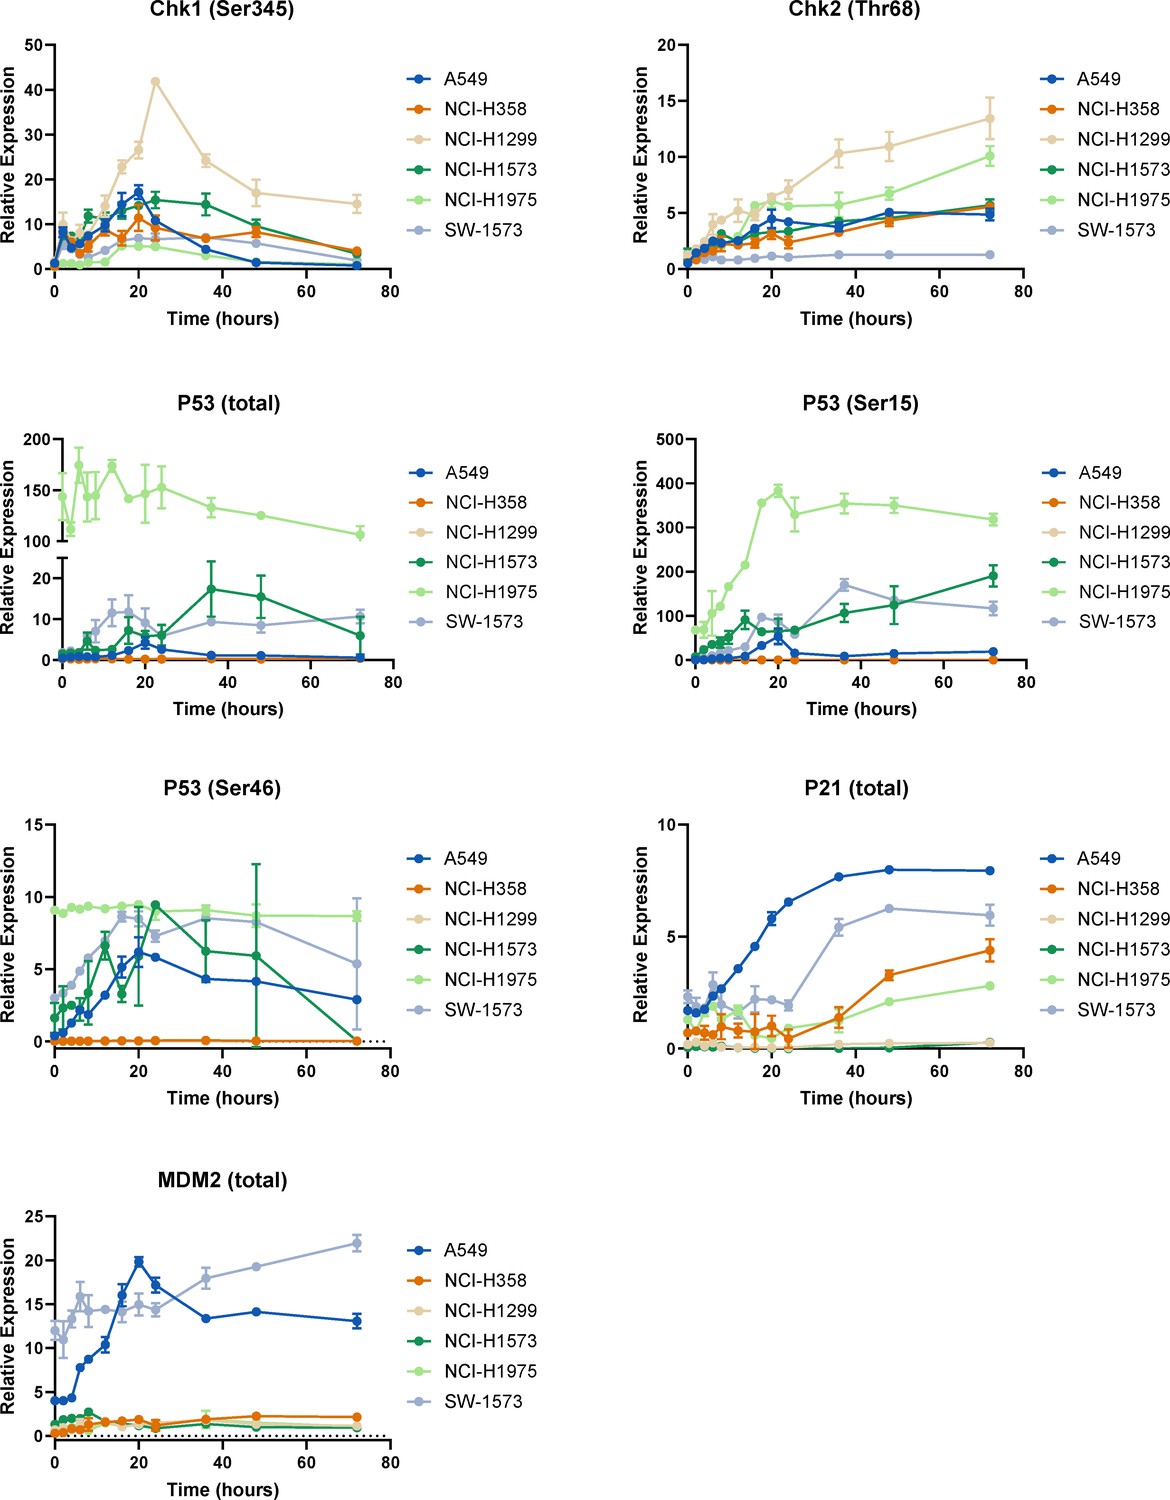
p53 pathway dynamics.
Raw data for the timecourse, multiplex analysis of DNA damage response proteins following a cisplatin pulse (5 μg/mL, 2 hr) across a panel of cell lines, as indicated (n = 3, mean ± SD).
Figure 2 with 1 supplement
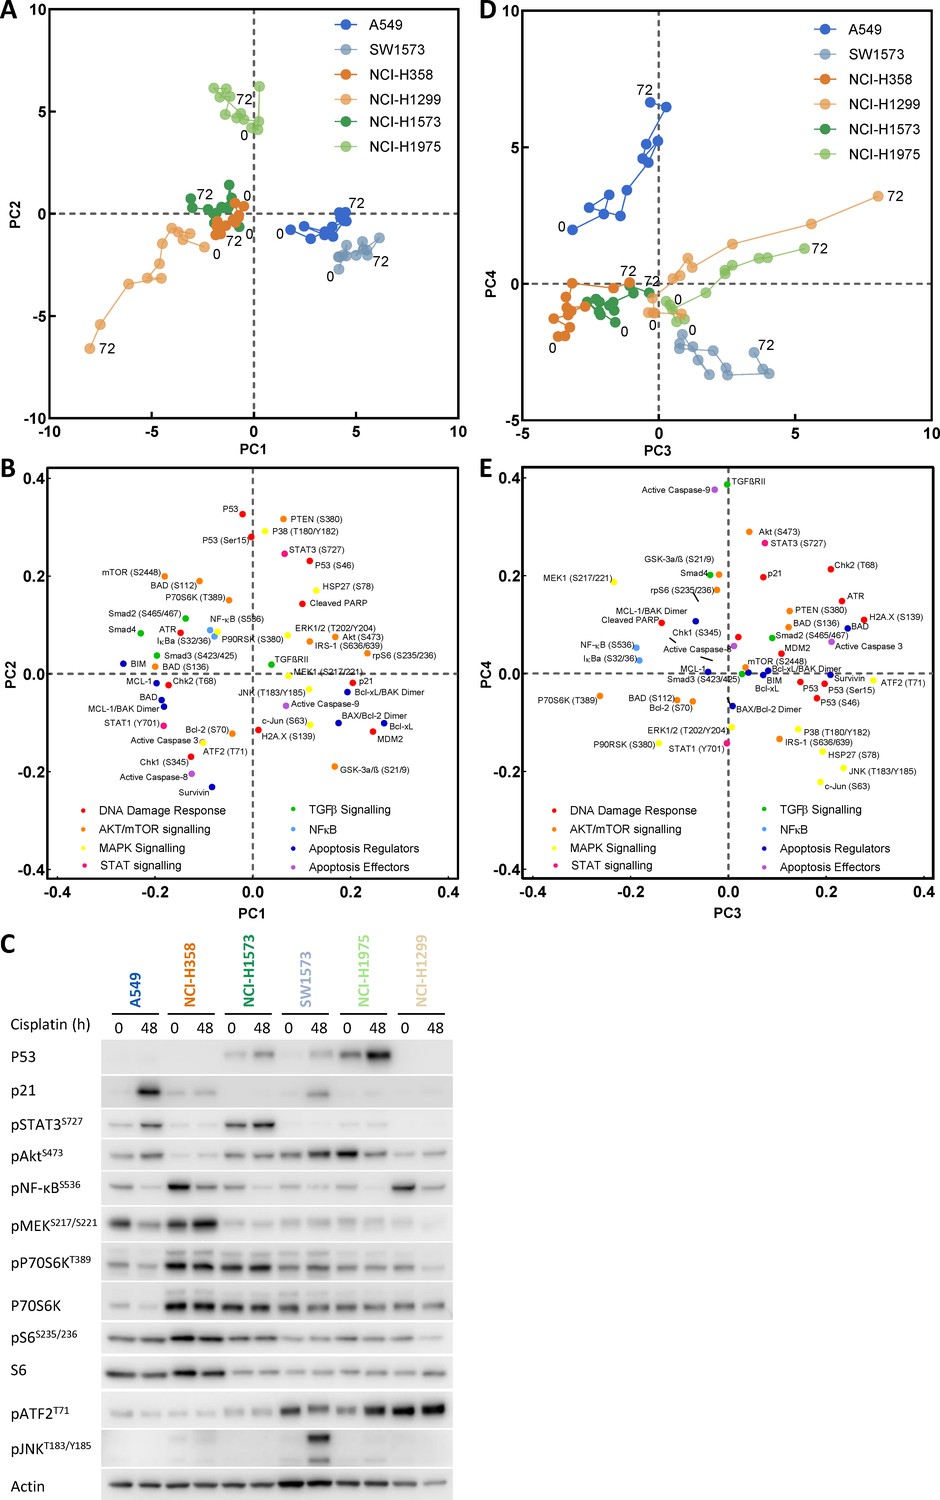
Principal component analysis.
(A) Visualisation of principal component 1 (PC1) against component 2 (PC2) for the principal component analysis of cisplatin induced signalling across the cell line panel. (B) Distribution of the analytes according to their weighting within PC1 and PC2. (C) Western blotting for selected analytes across the cell panel prior to, and 48 hr post a cisplatin pulse. (D) Visualisation of principal component 3 (PC3) against component 4 (PC4) for the principal component analysis of cisplatin induced signalling across the cell line panel. (E) Distribution of the analytes according to their weighting within PC3 and PC4.
Figure 2—figure supplement 1
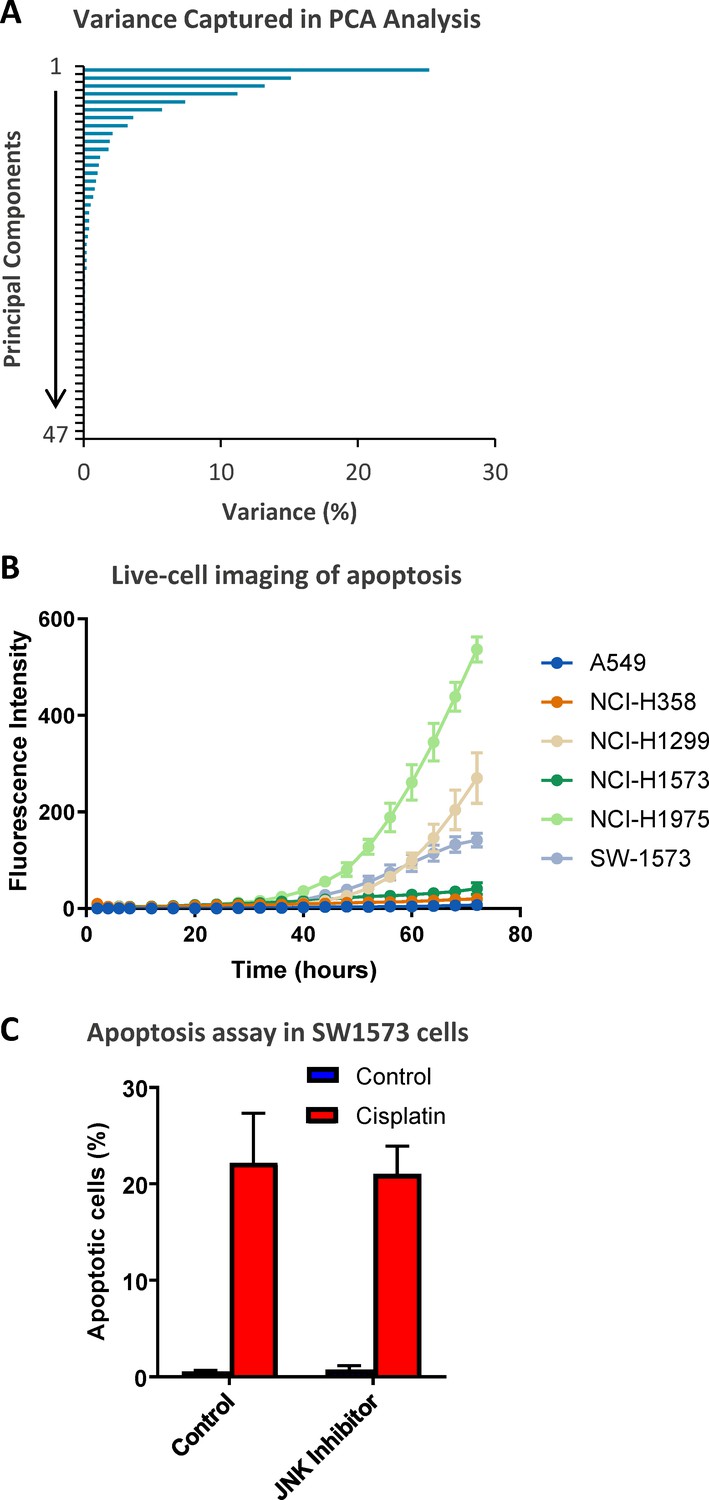
Extended analysis of the PCA data.
(A) The variance captured within each principal component of the principal component analysis (PCA), presented in Figure 2. (B) Live-cell imaging of apoptosis across the cell lines indicated on the Incucyte platform using a fluorescent caspase substrate (1 μM) (n = 3, mean ± SD). (C) Apoptosis measured by propidium iodide staining for the sub-G1 population in SW1573 cells, performed 72 hr following a cisplatin pulse (5 μg/mL, 2 hr) with the addition of a JNK inhibitor (JNK VIII, 20 µM) as indicated (n = 3, mean ± SD).
Figure 3 with 1 supplement

Visualising and targeting mechanisms of cisplatin resistance.
(A) An overlay of real-time imaging of apoptosis following a cisplatin pulse, performed on the Incucyte platform using a fluorescent caspase substrate (1 µM), on top of the PCA plot of component 3 against component 4. (B) Schematic of the cisplatin pulse model, with the addition of small molecule inhibitors, and outline of sample collection for apoptosis assays and western blotting. (C,D) Apoptosis measured by propidium iodide staining for the sub-G1 population in A549 and NCI-H358 cells, performed 72 hr following a cisplatin pulse with the addition of small molecule inhibitors (1 µM) as indicated (n = 3, mean ± SD). Statistical significance was determined by t-test (***p<0.001, **p<0.01). (E) Western blotting on lysates from NCI-H358 and NCI-H1299 cells following a cisplatin pulse, with the addition of dactolisib (1 µM), as indicated. (F) Schematic of the cisplatin pulse model, with the addition of siRNA pre-treatment, and outline of sample collection for apoptosis assays and western blotting. (G) Western blotting on lysates from NCI-H358 cells, treated with P70S6K or control siRNA, as indicated, prior to and following a cisplatin pulse (n = 3, mean ± SD). Statistical significance was determined by one-way ANOVA (**p<0.01, *p<0.05). (H) Apoptosis measured by propidium iodide staining for the sub-G1 population in NCI-H358 cells, treated with P70S6K, control siRNA or dactolisib, as indicated, performed 72 hr following a cisplatin pulse (n = 3, mean ± SD). Statistical significance was determined by one-way ANOVA (***p<0.001, *p<0.05). (I) Tumour growth in nude mice bearing NCI-H358 xenografts with continuous treatment of vehicle control or dactolisib (45 mg/kg) prior to, and following a single dose of carboplatin (60 mg/kg) (n ≥ 4, mean ± SEM). Statistical significance was determined by one-way ANOVA at each time point (***p<0.001, **p<0.01, *p<0.05). (J) Quantification of necrosis in NCI-H358 xenografts following the treatment described in (I) (n ≥ 4, mean ± SD). Statistical significance was determined by one-way ANOVA *p<0.05).
Figure 3—figure supplement 1
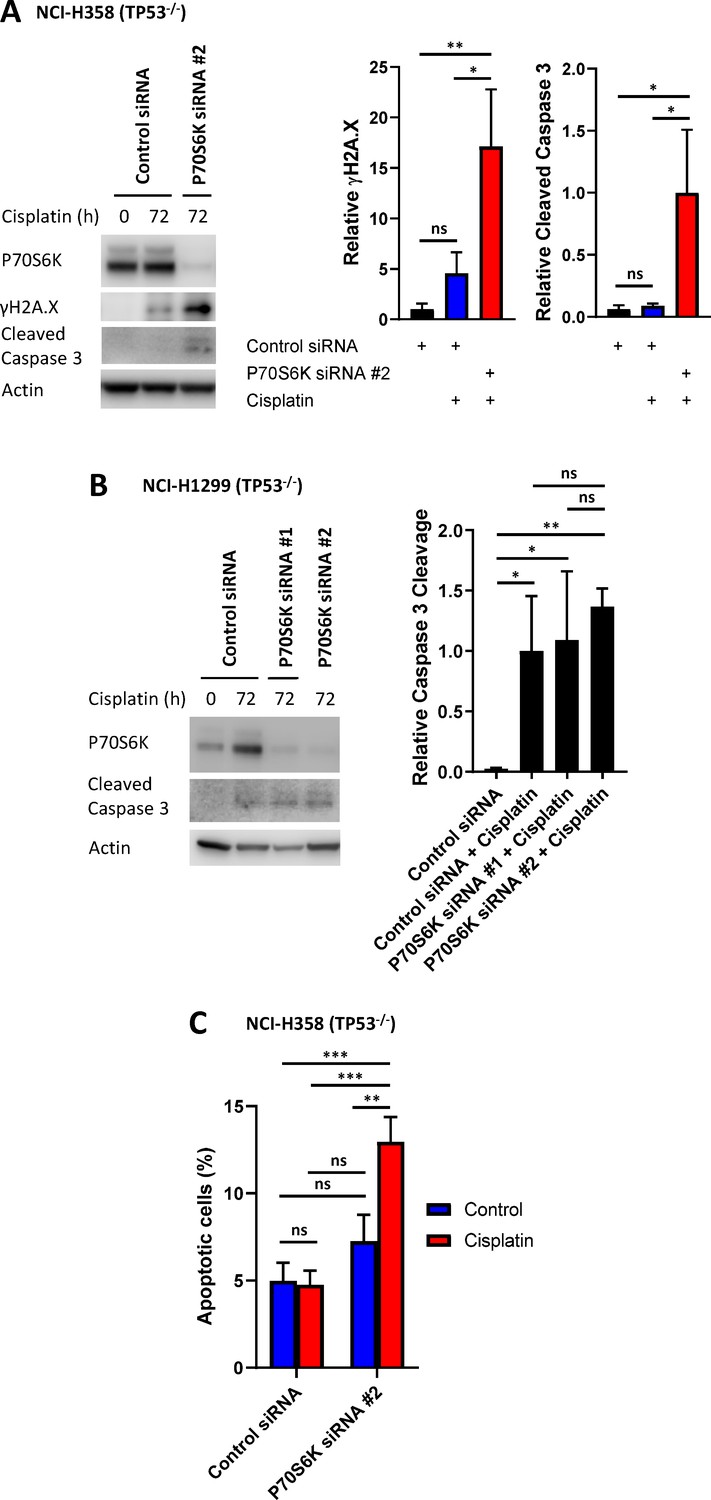
P70S6K knockdown in NCI-H358 and NCI-H1299 cells.
(A) Western blotting on lysates from NCI-H358 cells, treated with P70S6K or control siRNA, as indicated, prior to and following a cisplatin pulse (5 μg/mL, 2 hr). Quantification was performed on three individual replicates (n = 3, mean ± SD). Statistical significance was determined by one-way ANOVA (**p<0.01, *p<0.05). (B) Western blotting on lysates from NCI-H1299 cells, treated with P70S6K or control siRNA, as indicated, prior to and following a cisplatin pulse (5 μg/mL, 2 hr). Quantification was performed on three individual replicates (n = 3, mean ± SD). Statistical significance was determined by one-way ANOVA (**p<0.01, *p<0.05). (C) Apoptosis measured by propidium iodide staining for the sub-G1 population in NCI-H358 cells, treated with P70S6K or control siRNA, as indicated, performed 72 hr following a cisplatin pulse (n = 3, mean ± SD). Statistical significance was determined by one-way ANOVA (***p<0.001, *p<0.05).
Figure 4
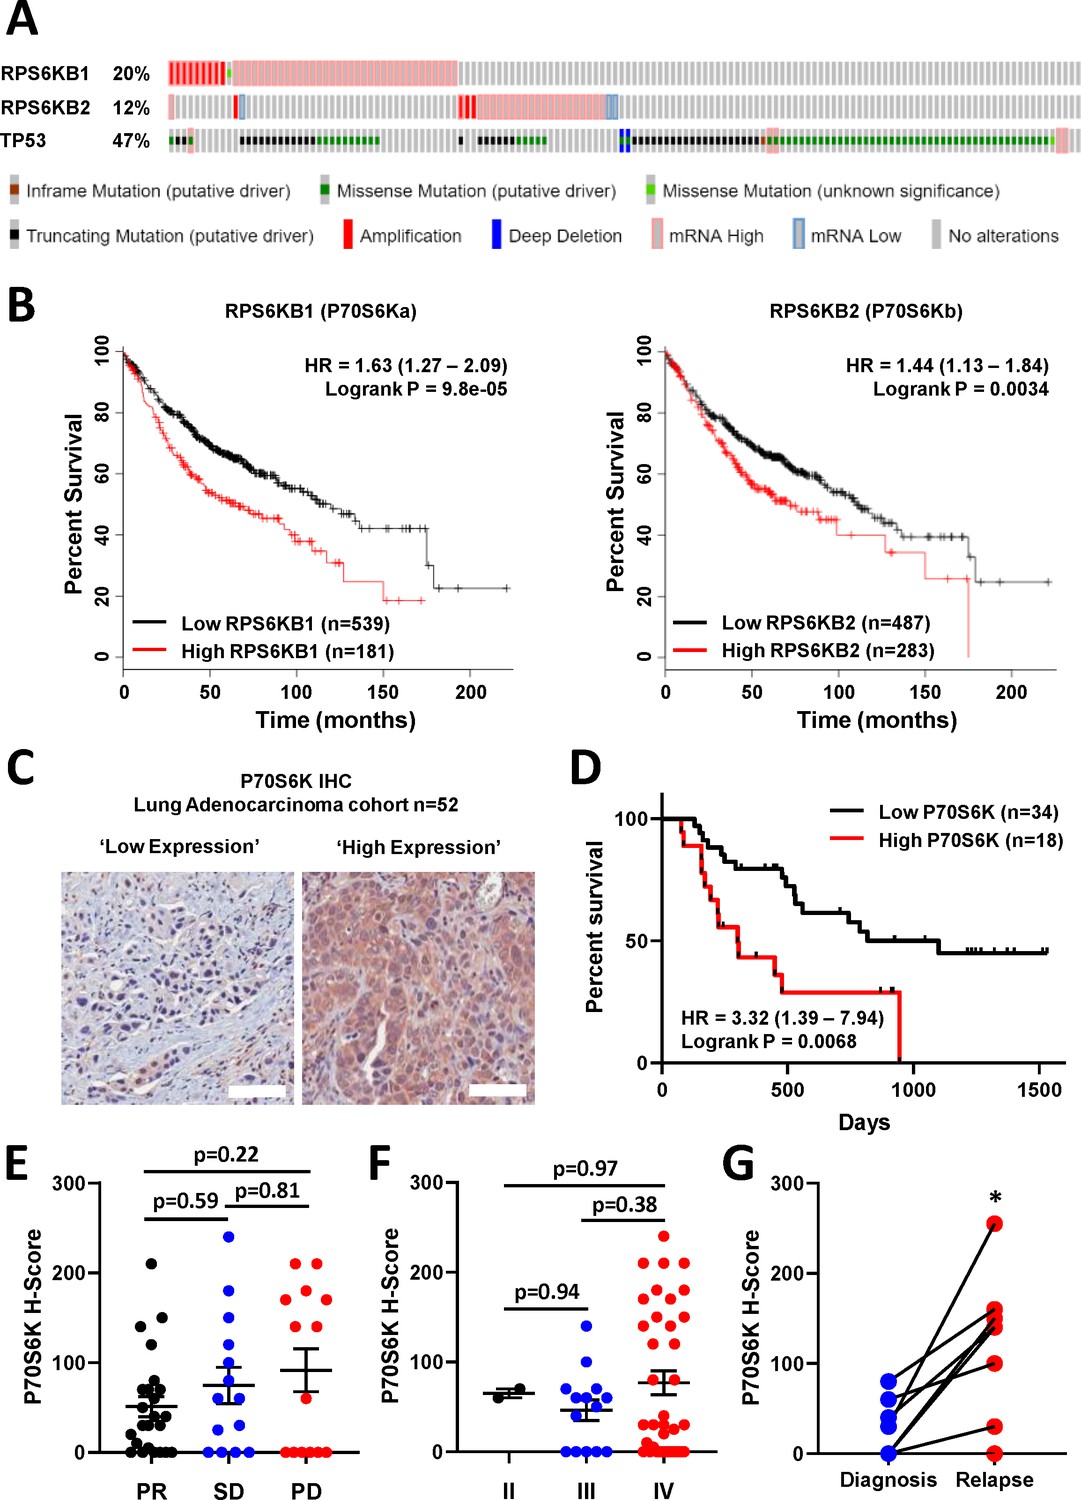
P70S6K in lung adenocarcinoma.
(A) The frequency of somatic mutations and mRNA over-expression for the RPS6KB1, RPS6KB2 and TP53 genes in a publically available cohort of lung adenocarcinoma patients (cBioPortal). (B) The association between RPS6KB1 and RPS6KB2 mRNA expression and overall patient survival in a publically available patient cohort (KM Plotter). Statistical significance was determined by log rank test. (C) Representative images of P70S6K immuno-histochemistry staining from a cohort of 52 lung adenocarcinoma patients (Scale bar = 100 µM). (D) Survival analysis based upon P70S6K staining in this cohort. Statistical significance was determined by log rank test. (E) The association between tumour P70S6K staining intensity (H-Score) and patients that underwent a partial response (PR), or presented with stable disease (SD) or progressive disease (PD). Statistical significance was determined by one-way ANOVA, (F) The association between tumour P70S6K staining intensity and tumour stage. Statistical significance was determined by one-way ANOVA. (G) P70S6K staining in eight matched patient samples from diagnosis and relapse (n = 8). Statistical significance was determined by t-test (*p<0.05).
Figure 5 with 3 supplements
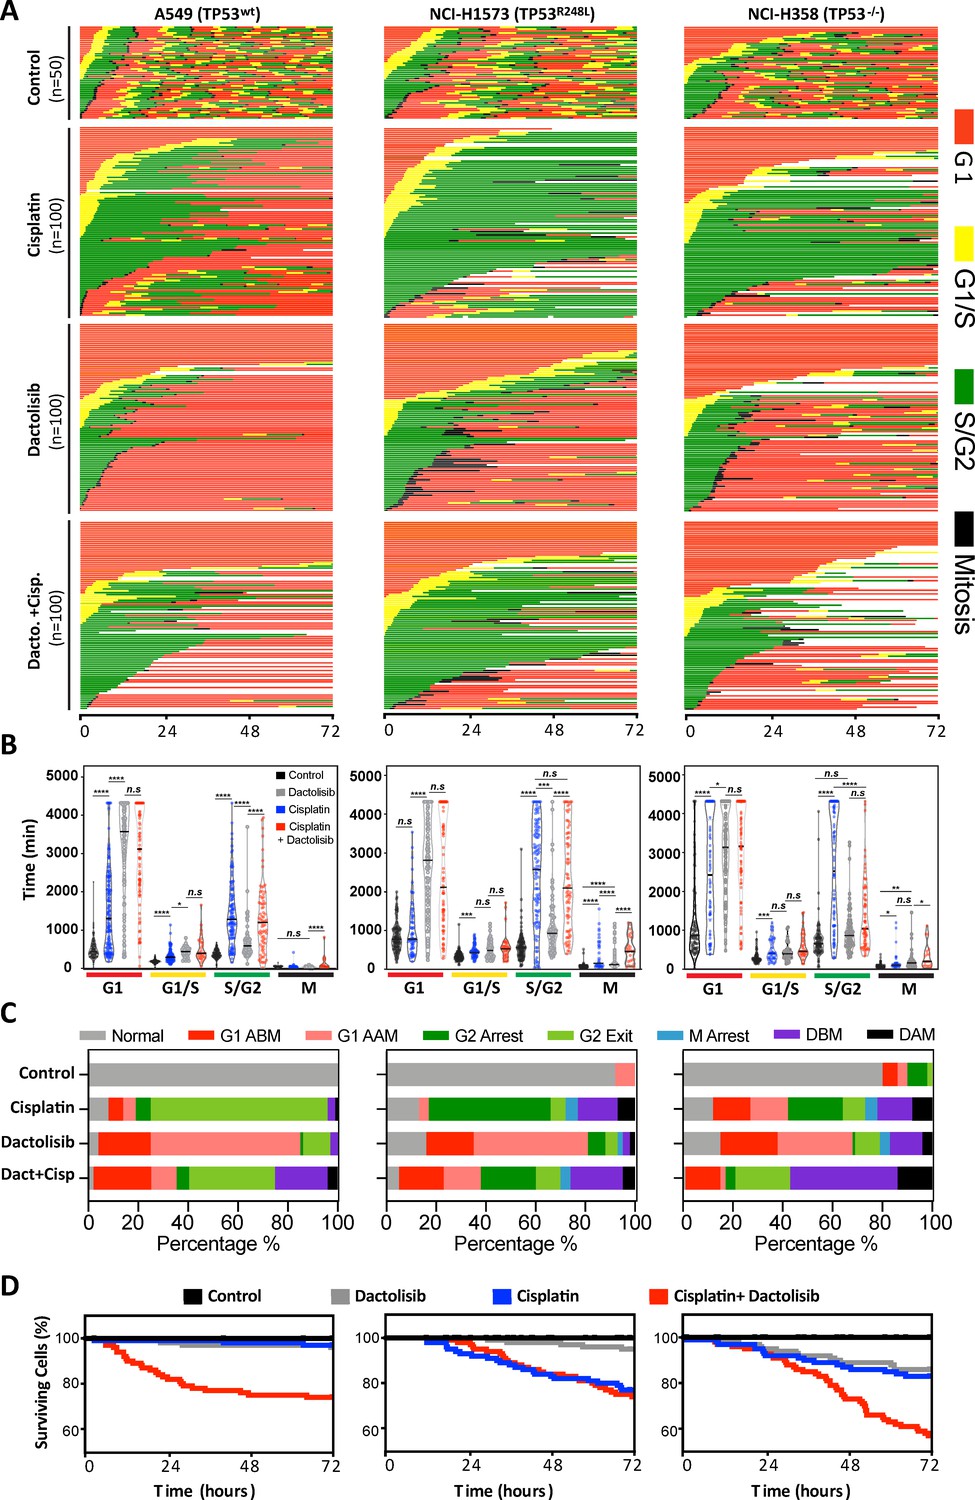
FUCCI analysis of cell cycle progression.
(A) Live-cell imaging of the FUCCI biosensor proteins mVenus-hGeminin(1/110) and mCherry-hCdt1(30/120), stably expressed by the A549, NCI-H1573 and NCI-H358 cell lines. Images were taken every 20 min for 72 hr under control conditions, or following a cisplatin pulse (5 µg/mL, 2 hr) in the presence or absence of dactolisib (1 µM). (B) Quantification of the length of each cell cycle phase under each treatment condition (n = 17–175, mean ± SD). Statistical significance was determined by one-way ANOVA (****p<0.0001, ***p<0.001, **p<0.01, *p<0.05). (C) Quantification of fate of each cell; including G1 arrest before mitosis (G1 ABM), G1 arrest after mitosis (G1 AAM), death before mitosis (DBM) and death after mitosis (DAM). (D) Survival curves indicating the proportion of viable cells over time under each treatment condition.
Figure 5—figure supplement 1
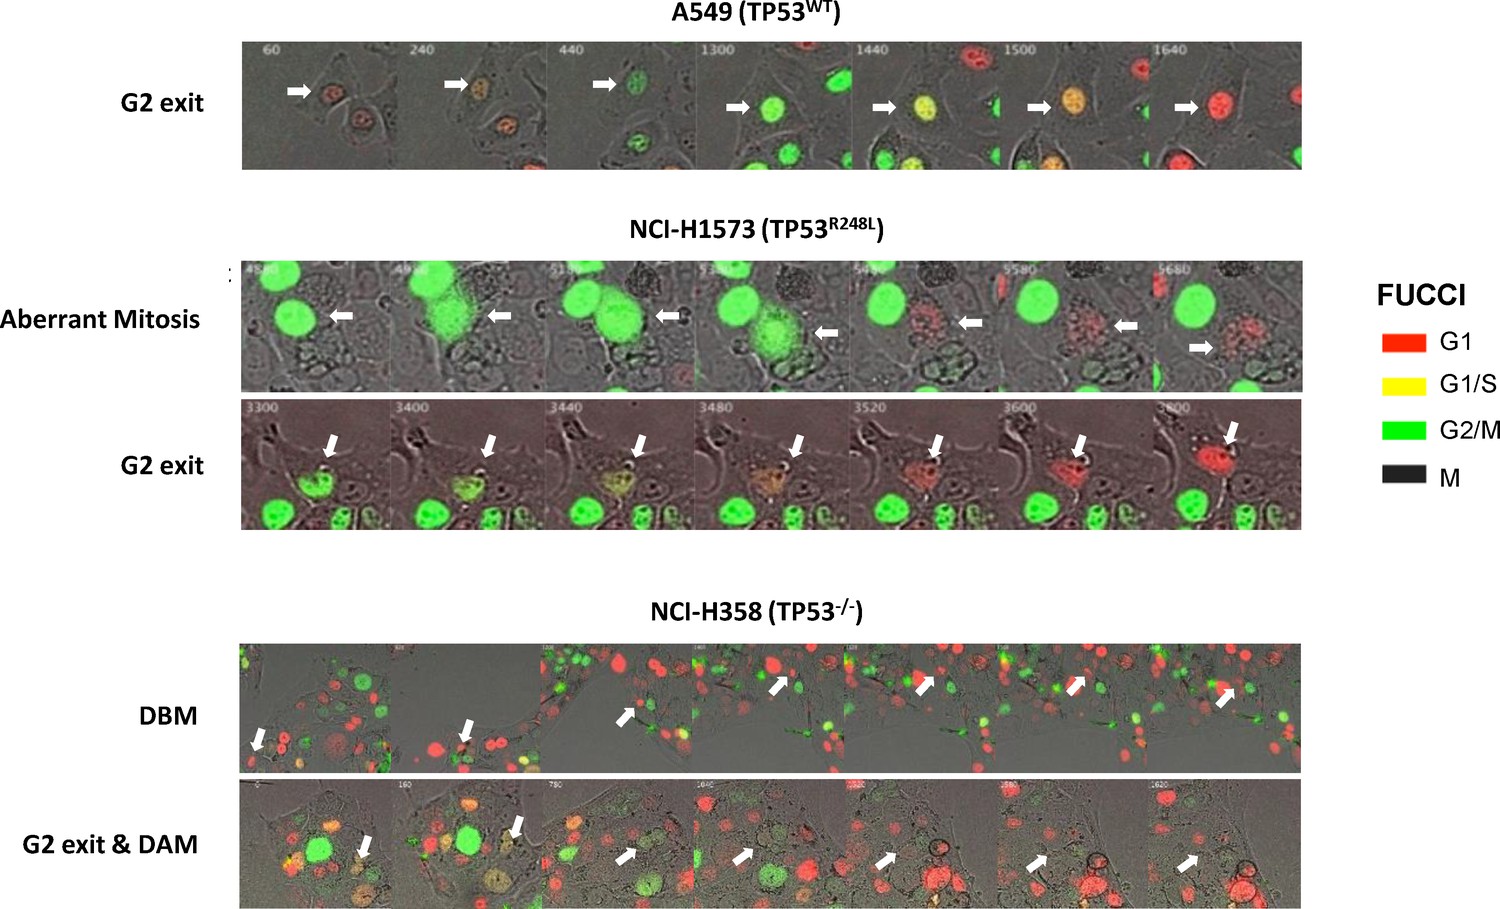
Representative images of cells expressing the FUCCI biosensor, undergoing an aberrant mitosis, G2 exit, Death before Mitosis (DBM) and Death after Mitosis (DAM) following a cisplatin pulse (5 μg/mL, 2 hr).
Figure 5—figure supplement 2
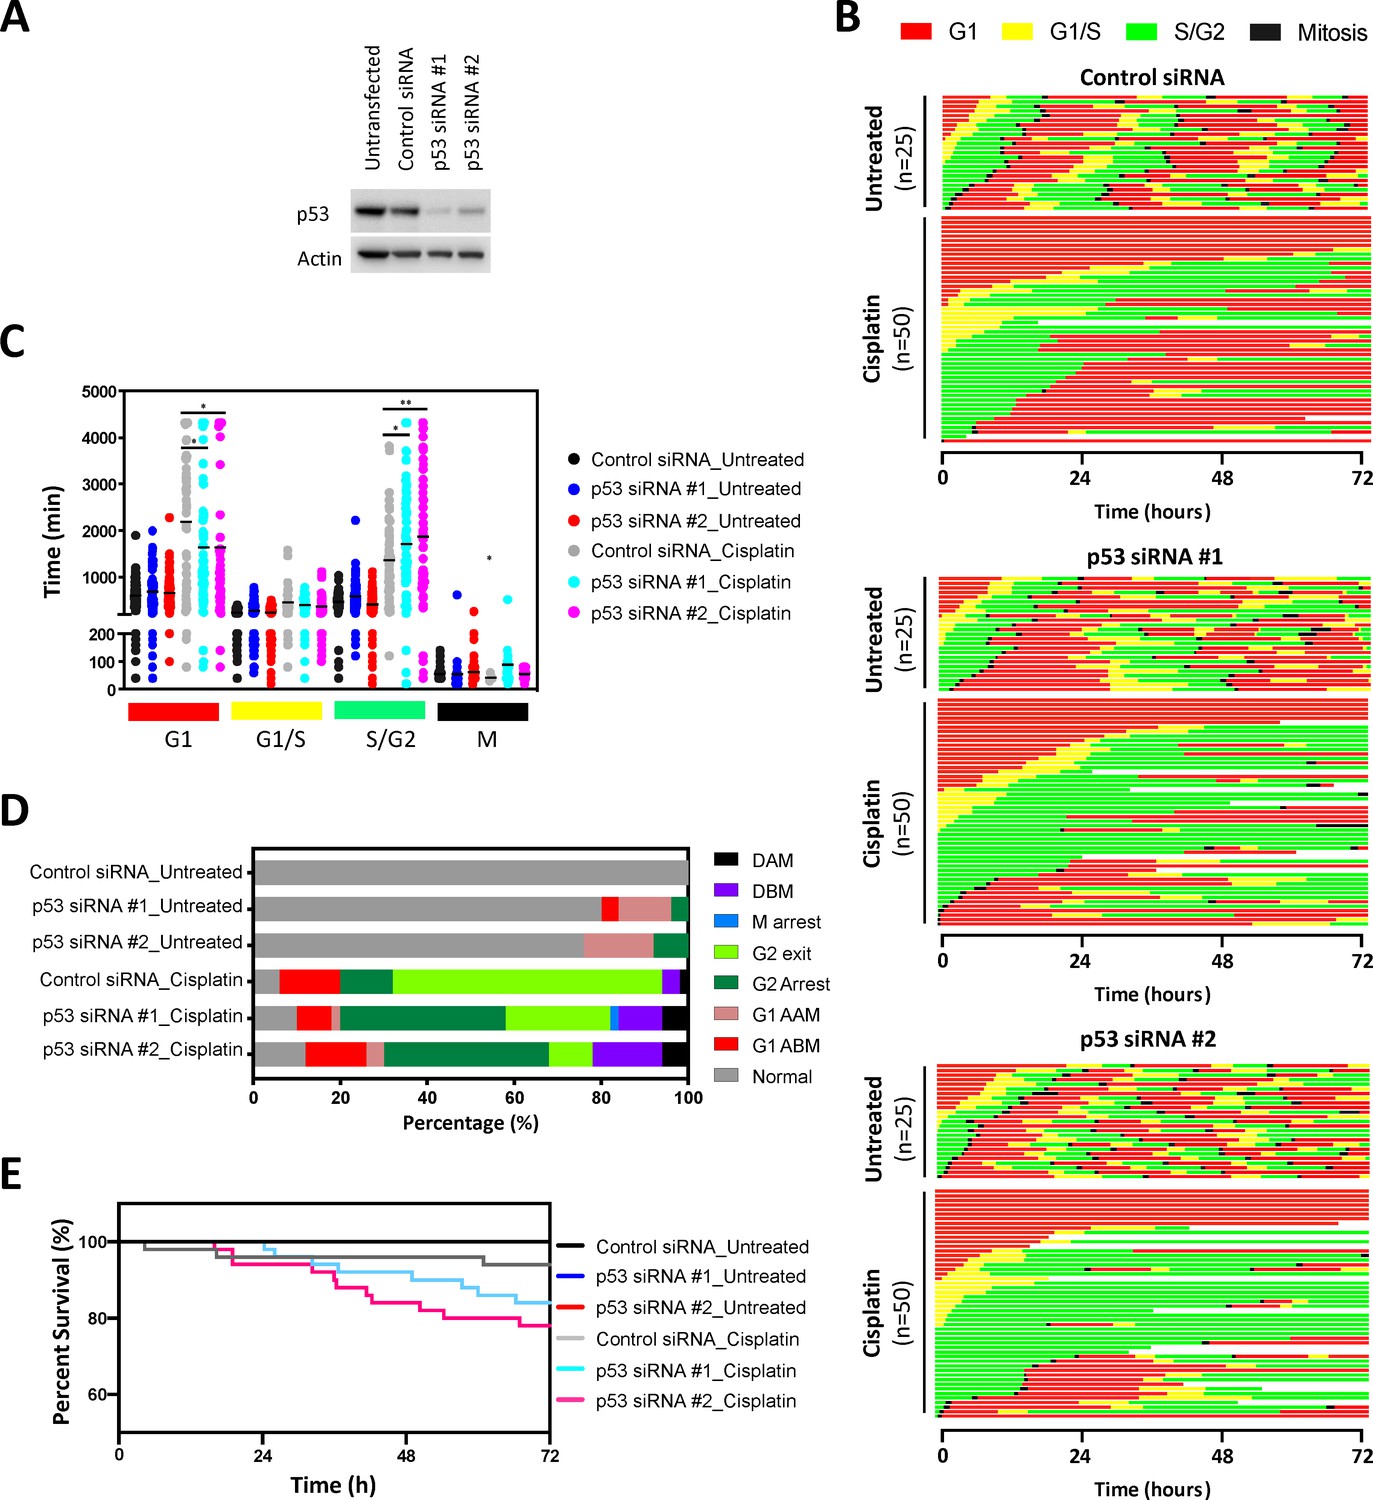
FUCCI analysis following p53 knockdown.
(A) Western blot confirming specific knockdown of p53 with two different siRNAs. (B) Live-cell imaging of the FUCCI biosensor proteins mVenus-hGeminin(1/110) and mCherry-hCdt1(30/120), stably expressed by the A549 cell line following 48 hr treatment with control or p53 targeting siRNA, as indicated. Images were taken every 20 min for 72 hr under control conditions, or following a cisplatin pulse (5 μg/mL, 2 hr). (C) Quantification of the length of each cell cycle phase under each treatment condition. Statistical significance was determined by one-way ANOVA (****p<0.0001, ***p<0.001, **p<0.01, *p<0.05). (D) Quantification of fate of each cell; including G1 arrest before mitosis (G1 ABM), G1 arrest after mitosis (G1 AAM), death before mitosis (DBM) and death after mitosis (DAM). (E) Survival curves indicating the proportion of viable cells over time under each treatment condition.
Figure 5—figure supplement 3
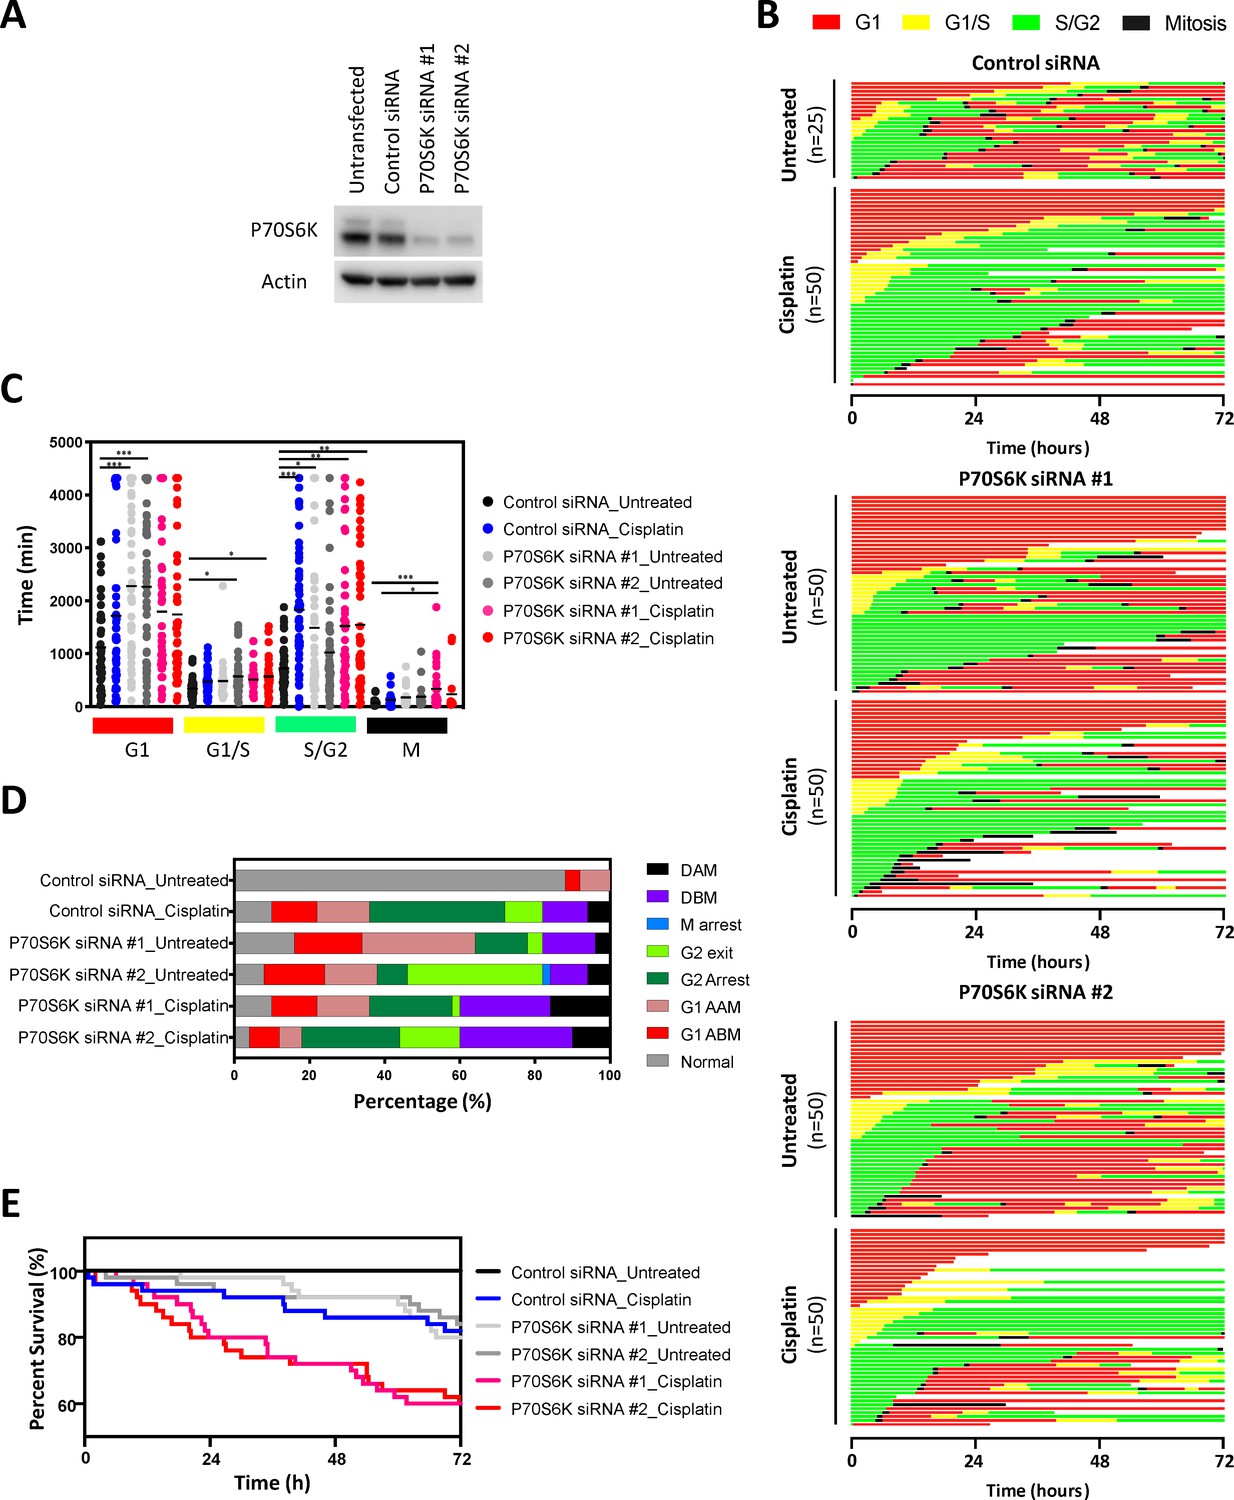
FUCCI analysis following P70S6K knockdown.
(A) Western blot confirming specific knockdown of P70S6K with two different siRNAs. (B) Live-cell imaging of the FUCCI biosensor proteins mVenus-hGeminin(1/110) and mCherry-hCdt1(30/120), stably expressed by the NCI-H358 cell line following 48 hr treatment with control or P70S6K targeting siRNA, as indicated. Images were taken every 20 min for 72 hr under control conditions, or following a cisplatin pulse (5 μg/mL, 2 hr) in the presence or absence of dactolisib (1 μM). (C) Quantification of the length of each cell cycle phase under each treatment condition (n = 17–175, mean ± SD). Statistical significance was determined by one-way ANOVA (****p<0.0001, ***p<0.001, **p<0.01, *p<0.05). (D) Quantification of fate of each cell; including G1 arrest before mitosis (G1 ABM), G1 arrest after mitosis (G1 AAM), death before mitosis (DBM) and death after mitosis (DAM). (E) Survival curves indicating the proportion of viable cells over time under each treatment condition.
Figure 6
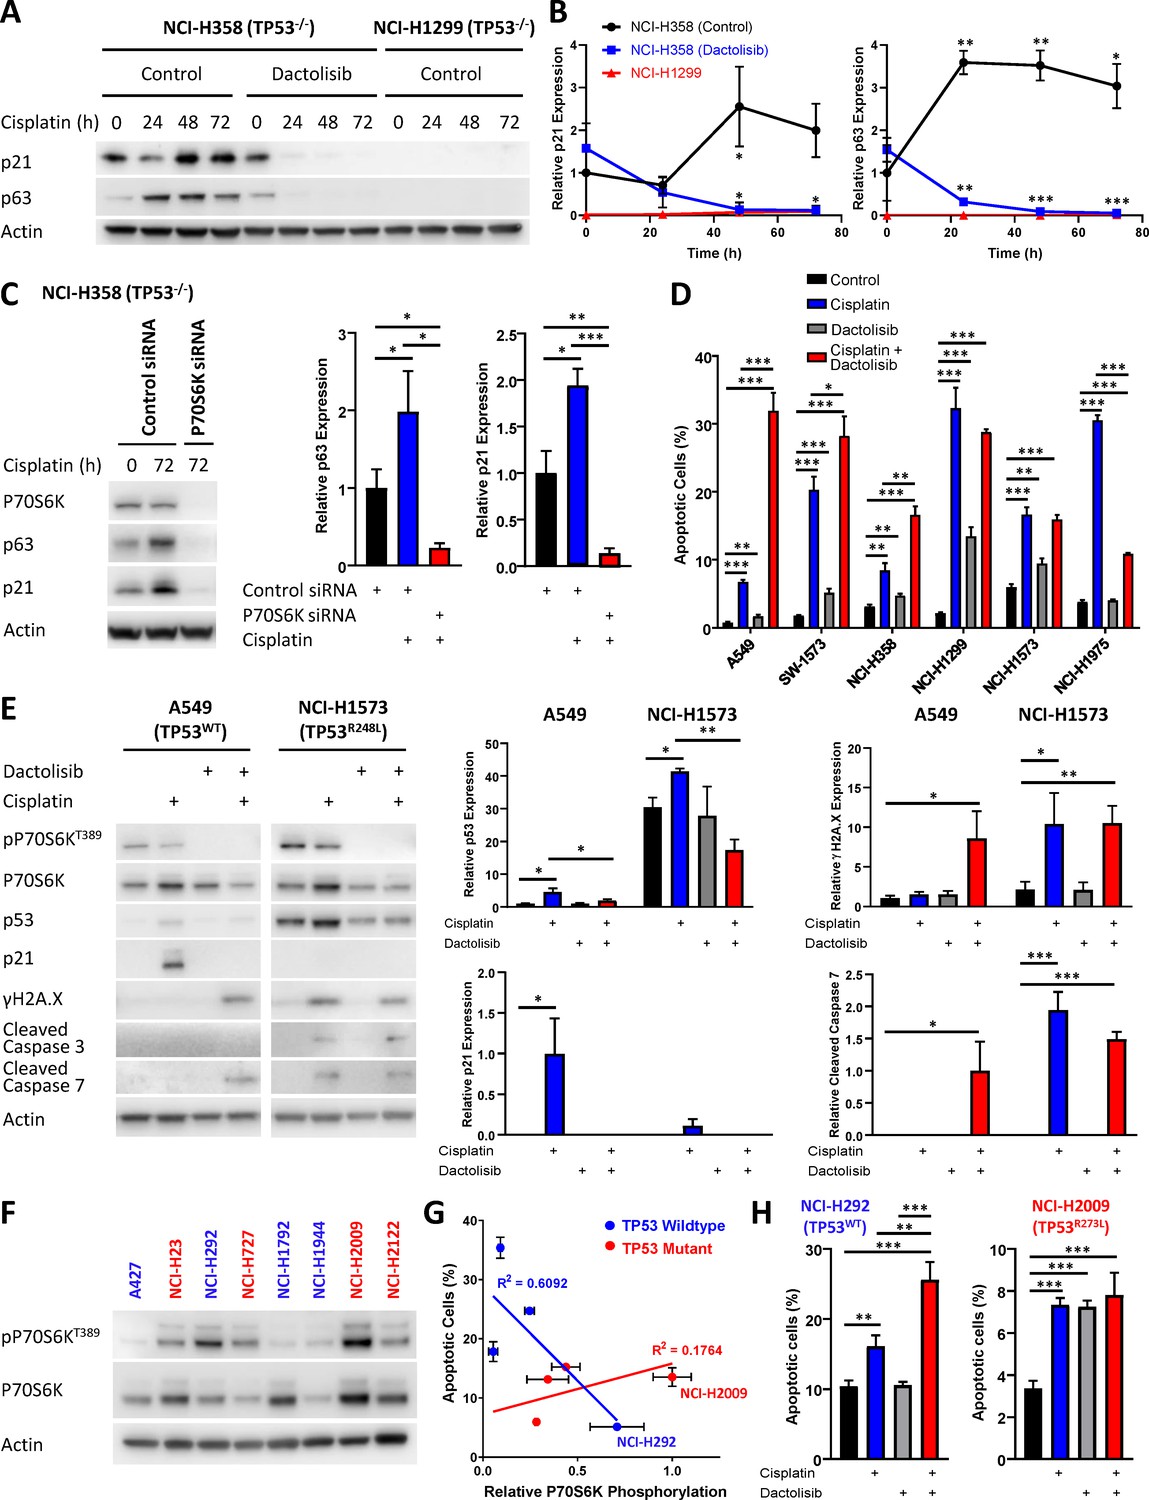
Response to dactolisib is dependent upon TP53 mutation status.
(A) Western blotting on lysates from NCI-H358 and NCI-H1299 cells following a cisplatin pulse, with the addition of dactolisib (1 µM), as indicated. (B) Quantification of effects of dactolisib upon cisplatin induced p63 and p21 expression (n = 3, mean ± SD). (C) Western blotting on lysates from NCI-H358 cells, treated with P70S6K or control siRNA, as indicated, prior to and following a cisplatin pulse (n = 3, mean ± SD). (D) Apoptosis measured by propidium iodide staining for the sub-G1 population performed 72 hr following a cisplatin pulse with the addition of dactolisib (1 µM) as indicated (n = 3, mean ± SD). (E) Western blotting on lysates from A549 and NCI-H1573 cells, 48 hr following a cisplatin pulse, with the addition of dactolisib (1 µM), as indicated (n = 3, mean ± SD). (F) Western blotting across a second panel of lung adenocarcinoma cell lines. (G) Correlation between P70S6K phosphorylation and apoptosis, as measured by propidium iodide staining for the sub-G1 population, performed 72 hr following a cisplatin pulse (n = 3, mean ± SD). For all panels the statistical significance was determined by one-way ANOVA (***p<0.001, **p<0.01, *p<0.05).
Figure 7

Schematic outlining the effect of cisplatin on cell cycle arrest, DNA damage and apoptosis across the spectrum of TP53 mutation states, and the influence of P70S6K expression levels or inhibition upon these processes.
Tables
Key resources table
| Reagent type (species) or resource | Designation | Source or reference | Identifiers | Additional information |
|---|---|---|---|---|
| Cell line (Homo sapiens) | A549 | ATCC | CCL-185, RRID:CVCL_0023 | |
| Cell line (Homo sapiens) | NCI-H358 | ATCC | CRL-5807, RRID:CVCL_1559 | |
| Cell line (Homo sapiens) | NCI-H1299 | ATCC | CRL-5803, RRID:CVCL_0060 | |
| Cell line (Homo sapiens) | NCI-H1573 | ATCC | CRL-5877, RRID:CVCL_1478 | |
| Cell line (Homo sapiens) | NCI-H1975 | ATCC | CRL-5908, RRID:CVCL_1511 | |
| Cell line (Homo sapiens) | SW1573 | ATCC | CRL-2170, RRID:CVCL_1720 | |
| Cell line (Homo sapiens) | A427 | ATCC | HTB-53, RRID:CVCL_1055 | |
| Cell line (Homo sapiens) | NCI-H23 | ATCC | CRL-H5800, RRID:CVCL_1547 | |
| Cell line (Homo sapiens) | NCI-H292 | ATCC | CRL-1848, RRID:CVCL_0455 | |
| Cell line (Homo sapiens) | NCI-H1944 | ATCC | CRL-5907, RRID:CVCL_1508 | |
| Cell line (Homo sapiens) | NCI-H2009 | ATCC | CRL-5911, RRID:CVCL_1514 | |
| Cell line (Homo sapiens) | NCI-H2122 | ATCC | CRL-5985, RRID:CVCL_1531 | |
| Antibody | anti-Cisplatin modified DNA antibody (rat monoclonal) | Abcam | ab103261, RRID:AB_10715243 | IF (1:500) |
| Antibody | anti-gamma H2A.X (phospho S139) antibody (mouse monoclonal) | Abcam | Ab26350, RRID:AB_470861 | WB (1:1000) |
| Antibody | Anti-phospho-STAT3 (Ser729) (rabbit monoclonal) | Cell Signaling Technology | #9134, RRID:AB_331589 | WB (1:1000) |
| Antibody | Anti-phospho-Akt (Ser473) (rabbit monoclonal) | Cell Signaling Technology | #9271, RRID:AB_329825 | WB (1:1000) |
| Antibody | Anti-phospho-NF-κB p65 (Ser536) (rabbit monoclonal) | Cell Signaling Technology | #3033, RRID:AB_331284 | WB (1:1000) |
| Antibody | Anti-phospho-p44/42 MAPK (Erk1/2) (Thr202/Tyr204) (rabbit monoclonal) | Cell Signaling Technology | #9101, RRID:AB_331646 | WB (1:1000) |
| Antibody | Anti-phospho-ATF-2 (Thr71) (rabbit monoclonal) | Cell Signaling Technology | #5112, RRID:AB_560873 | WB (1:1000) |
| Antibody | Anti-p70 S6 Kinase (rabbit monoclonal) | Cell Signaling Technology | #2708, RRID:AB_390722 | WB (1:1000), IHC (1:600) |
| Antibody | Anti-phospho-p70 S6 Kinase (Thr389) (rabbit monoclonal) | Cell Signaling Technology | #9205, RRID:AB_330945 | WB (1:1000) |
| Antibody | Anti-p21 Waf1/Cip1 (rabbit monoclonal) | Cell Signaling Technology | #2947, RRID:AB_823586 | WB (1:1000) |
| Antibody | Anti-cleaved Caspase-3 (Asp175) (rabbit monoclonal) | Cell Signaling Technology | #9661, RRID:AB_2341188 | WB (1:1000) |
| Antibody | Anti-cleaved Caspase-7 (Asp198) (rabbit monoclonal) | Cell Signaling Technology | #9491, RRID:AB_2068144 | WB (1:1000) |
| Antibody | Anti-p53 (mouse monoclonal) | Santa Cruz Biotechnology | sc-126, RRID:AB_628082 | WB (1:200) |
| Antibody | Anti-p63 (mouse monoclonal) | Novus Biologicals | NB100-691, RRID:AB_10002770 | WB (1:1000) |
| Antibody | Anti-β-Actin (mouse monoclonal) | Sigma Aldrich | AC-15, RRID:AB_476692 | WB (1:5000) |
| Transfected construct (human) | mVenus-hGeminin(1/110) (plasmid) | Sakaue-Sawano et al., 2008 | ||
| Transfected construct (human) | mCherry-hCdt1(30/120) (plasmid) | Sakaue-Sawano et al., 2008 | ||
| Chemical compound, drug | NVP-BEZ235 | Selleck Chem | S1009 | |
| Chemical compound, drug | MK-2206 2HCl | Selleck Chem | S1078 | |
| Chemical compound, drug | S3I-201 | Selleck Chem | S1155 | |
| Chemical compound, drug | U0126-EtOH | Selleck Chem | S1102 | |
| Chemical compound, drug | SC75741 | Selleck Chem | S7273 | |
| Chemical compound, drug | RNaseA | Life Technologies | AM2270 | |
| Chemical compound, drug | Propidium iodide | Sigma-Aldrich | P4170 | |
| Chemical compound, drug | CellTiter96 AQueous Non-Radioactive Cell Proliferation Assay | Promega | G5421 | |
| Chemical compound, drug | Cisplatin | Hospira Australia | 88S035 | |
| Commercial assay or kit | DNA Damage/Genotoxicity Magnetic Bead Panel (7-plex) | Merck Millipore | 48-621MAG | MAGPIX assay, detects ATR (total), Chk1 (Ser345), Chk2 (Thr68), H2A.X (Ser139), MDM2 (total), p21 (total), p53 (Ser15) |
| Commercial assay or kit | TGFβ Signaling Pathway Magnetic Bead Kit (6-plex) | Merck Millipore | 48-614MAG | MAGPIX assay, detects Akt (Ser473), ERK (Thr185/Tyr187), Smad2 (Ser465/Ser467), Smad3 (Ser423/Ser425), Smad4 (total), TGFβRII (total) |
| Commercial assay or kit | Bio-Plex Pro Cell Signaling Akt Panel (8-plex) | Bio-Rad | LQ00006JK0K0RR | MAGPIX assay, detects Akt (Ser473), BAD (Ser136), GSK-3α/β (Ser21/Ser9), IRS-1 (Ser636/Ser639), mTOR (Ser2248), p70 S6 kinase (Thr389), PTEN (Ser380), S6 ribosomal protein (Ser235/Ser236) |
| Commercial assay or kit | Bio-Plex Pro Cell Signalling MAPK Panel (9-plex) | Bio-Rad | LQ00000S6KL81S | MAGPIX assay, detects ATF-2 (Thr71), ERK (Thr202/Tyr204, Thr185/Tyr187), HSP27 (Ser78), JNK (Thr183/Tyr185), MEK1 (Ser217/Ser221), p38 MAPK (Thr180/Tyr182), p53 (Ser15), p90 RSK (Ser380), Stat3 (Ser727) |
| Commercial assay or kit | Bio-Plex Pro RBM Apoptosis Panel 2 | Bio-Rad | 171WAR2CK | MAGPIX assay, detects Bad, Bax/Bcl-2 dimer, Bcl-xL, Bim, Mcl-1 |
| Commercial assay or kit | Bio-Plex Pro RBM Apoptosis Panel 3 | Bio-Rad | 171WAR3CK | MAGPIX assay, detects active caspase-3, Bcl-xL/Bak dimer, Mcl-1/Bak dimer, Survivin |
| Commercial assay or kit | Total p53 magnetic bead | Merck Millipore | MP46662MAG | Individual MAGPIX bead kit |
| Commercial assay or kit | Cleaved PARP Magnetic Bead MAPmate | Merck Millipore | 46-656MAG | Individual MAGPIX bead kit |
| Commercial assay or kit | Phospho-NF-κB p65 (Ser536) Set | Bio-Rad | 171V50013M | Individual MAGPIX bead kit |
| Commercial assay or kit | Phospho-IκB-α (Ser32/Ser36) | Bio-Rad | 171V50010M | Individual MAGPIX bead kit |
| Commercial assay or kit | Phospho-c-Jun (Ser63) Set | Bio-Rad | 171V50003M | Individual MAGPIX bead kit |
| Commercial assay or kit | Phospho-Stat1 (Tyr701) Set | Bio-Rad | 171V50020M | Individual MAGPIX bead kit |
| Software | MATLAB and Statistics Toolbox Release 2019a | The Mathworks, Inc | ||
| Commercial assay or kit | NucView 488 Caspase-3 Enzyme substrate | Biotium | #10402 | |
| Other | Matrigel Basement Membrane | Bio-Strategy | BDAA354230 | |
| Chemical compound, drug | carboplatin | Abcam | ab120828 | |
| Antibody | Anti-Ki-67 (rabbit monoclonal) | ThermoFisher scientific | RM-9106, RRID:AB_2335745 | IHC (1:500) |
| Chemical compound, drug | jetPRIME DNA and siRNA transfection reagent | Polyplus transfection | 114–15 | |
| Transfected construct (human) | SignalSilence p70/85 S6 Kinase siRNA I | Cell Signaling Technology | #6566 | |
| Transfected construct (human) | SignalSilence p70/85 S6 Kinase siRNA II | Cell Signaling Technology | #6572 | |
| Transfected construct (human) | SignalSilence p53 siRNA I | Cell Signaling Technology | #6231 | |
| Transfected construct (human) | SignalSilence p53 siRNA II | Cell Signaling Technology | #6562 | |
| Sequenced-based reagent | SignalSilence Control siRNA (Unconjugated) | Cell Signaling Technology | #6568 |
Additional files
-
Supplementary file 1
Protein analytes previously implicated in the response to cisplatin.
- https://cdn.elifesciences.org/articles/53367/elife-53367-supp1-v1.docx
-
Supplementary file 2
Mutation status of the lung adenocarcinoma cell panel.
- https://cdn.elifesciences.org/articles/53367/elife-53367-supp2-v1.docx
-
Supplementary file 3
Summary of the analytes used for multiplex signalling analysis.
- https://cdn.elifesciences.org/articles/53367/elife-53367-supp3-v1.docx
-
Supplementary file 4
Characteristics of the patient cohort used to generate immuno-histochemical data.
- https://cdn.elifesciences.org/articles/53367/elife-53367-supp4-v1.docx
-
Supplementary file 5
Mutation status of second lung adenocarcinoma cell panel.
- https://cdn.elifesciences.org/articles/53367/elife-53367-supp5-v1.docx
-
Transparent reporting form
- https://cdn.elifesciences.org/articles/53367/elife-53367-transrepform-v1.docx
Download links
A two-part list of links to download the article, or parts of the article, in various formats.
Downloads (link to download the article as PDF)
Open citations (links to open the citations from this article in various online reference manager services)
Cite this article (links to download the citations from this article in formats compatible with various reference manager tools)
Analysis of pulsed cisplatin signalling dynamics identifies effectors of resistance in lung adenocarcinoma
eLife 9:e53367.
https://doi.org/10.7554/eLife.53367


