Integrated analysis of H2A.Z isoforms function reveals a complex interplay in gene regulation
- LBCMCP, Centre de Biologie Intégrative, Université de Toulouse, CNRS, UPS, France
- St-Patrick Research Group in Basic Oncology, Laval University Cancer Research Center and Oncology Division of CHU de Québec-Université Laval Research Center, Canada
- BigA Core Facility, Centre de Biologie Intégrative, Université de Toulouse, CNRS, UPS, France
Figures
Figure 1 with 1 supplement
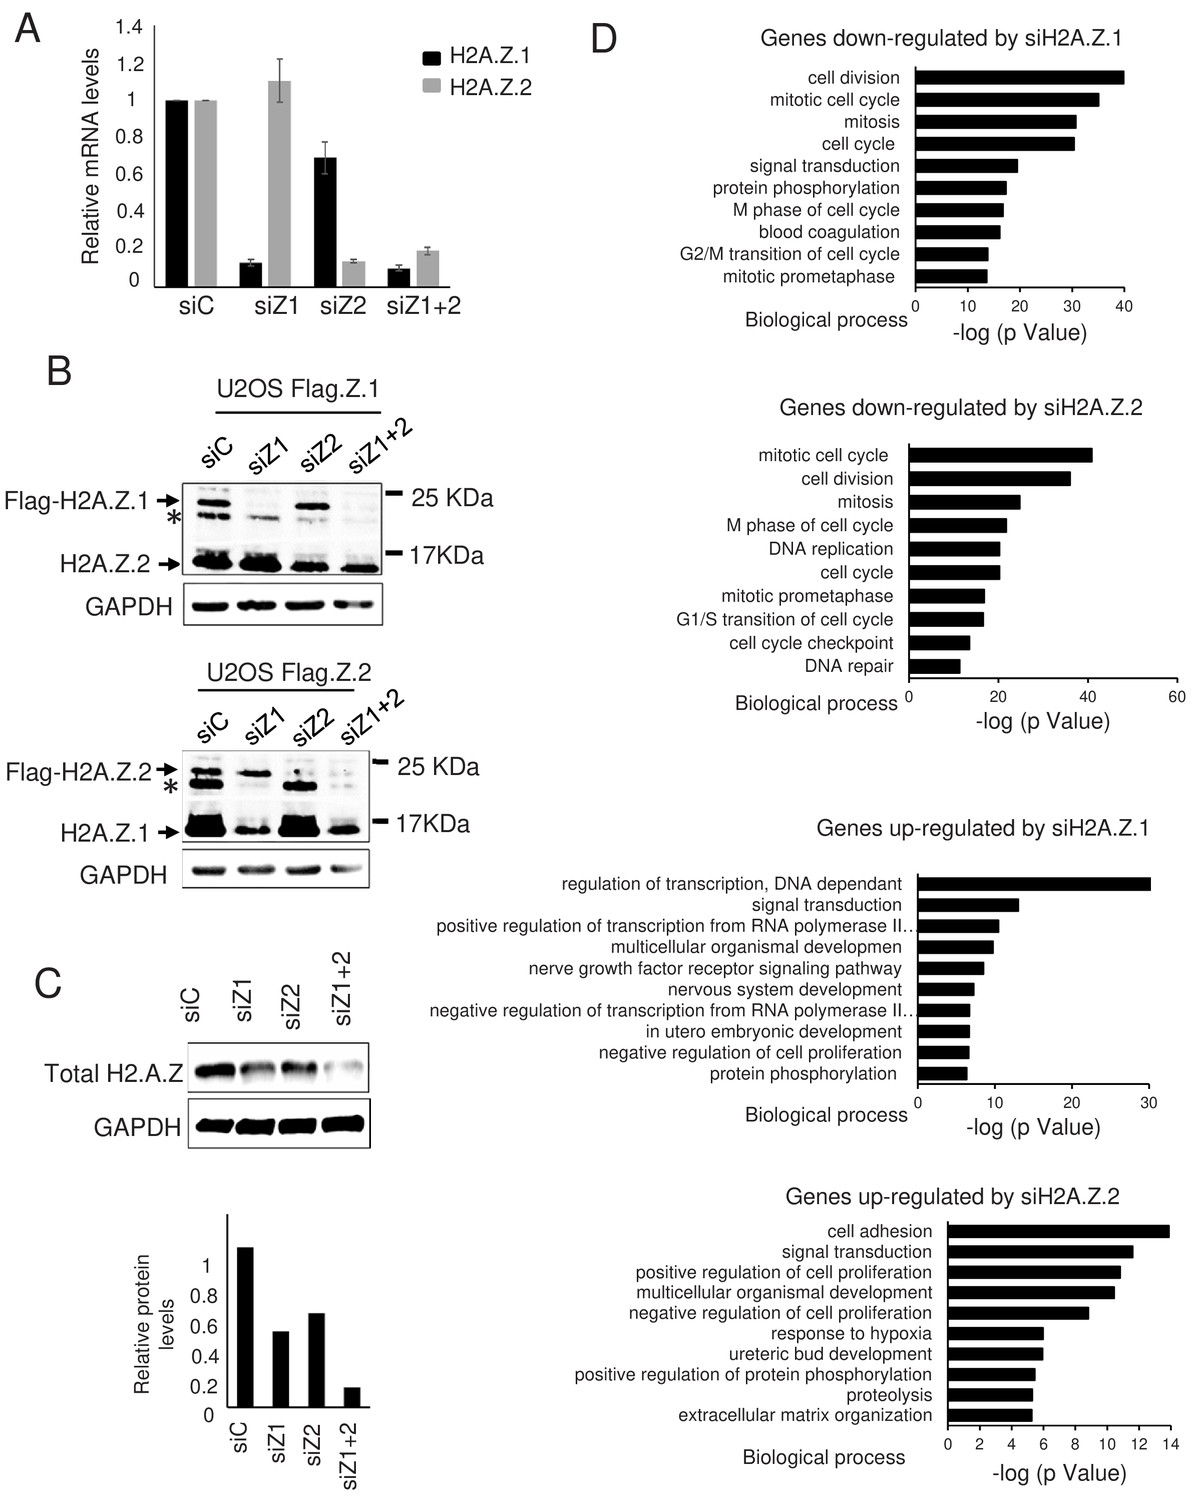
Effect of H2A.Z.1 and H2A.Z.2 depletion on gene expression.
(A) WI38 cells were transfected with the indicated siRNAs. 72 hr later, total RNA was prepared. The amount of H2A.Z.1 and H2A.Z.2 mRNA was quantified by RT-qPCR, standardised using GAPDH mRNA levels and calculated relative to one for cells transfected with the control siRNA. The mean and SDOM from five independent experiments are shown. (B) Genome edited U2OS cells expressing either tagged H2A.Z.1 (top) or tagged H2A.Z.2 (bottom) were transfected with the indicated siRNAs. 72 hr later, total cell extracts were prepared and subjected to western blot analysis using an anti H2A.Z antibody. The star * indicates a band probably corresponding to a post-translationally modified untagged H2A.Z isoform. (C) Same as in A, except that total cell extracts were prepared and subjected to western blot analysis using the indicated antibody, then protein signals were standardised using GAPDH protein levels and calculated relative to1 for cells transfected with the control siRNA. A representative experiment out of two is shown. (D) Gene ontology analyses (Genecodis) of genes downregulated upon H2A.Z.1or H2A.Z.2 depletion or upregulated upon H2A.Z.1 or H2A.Z.2 depletion (from top to bottom). The top 10 most significant enrichments are shown.
-
Figure 1—source data 1
Source data of the histogramme representing the depletion of H2A.
Z.1 and H2A.Z.2 in response to siRNAs in Figure 1A.
- https://cdn.elifesciences.org/articles/53375/elife-53375-fig1-data1-v1.xlsx
Figure 1—figure supplement 1
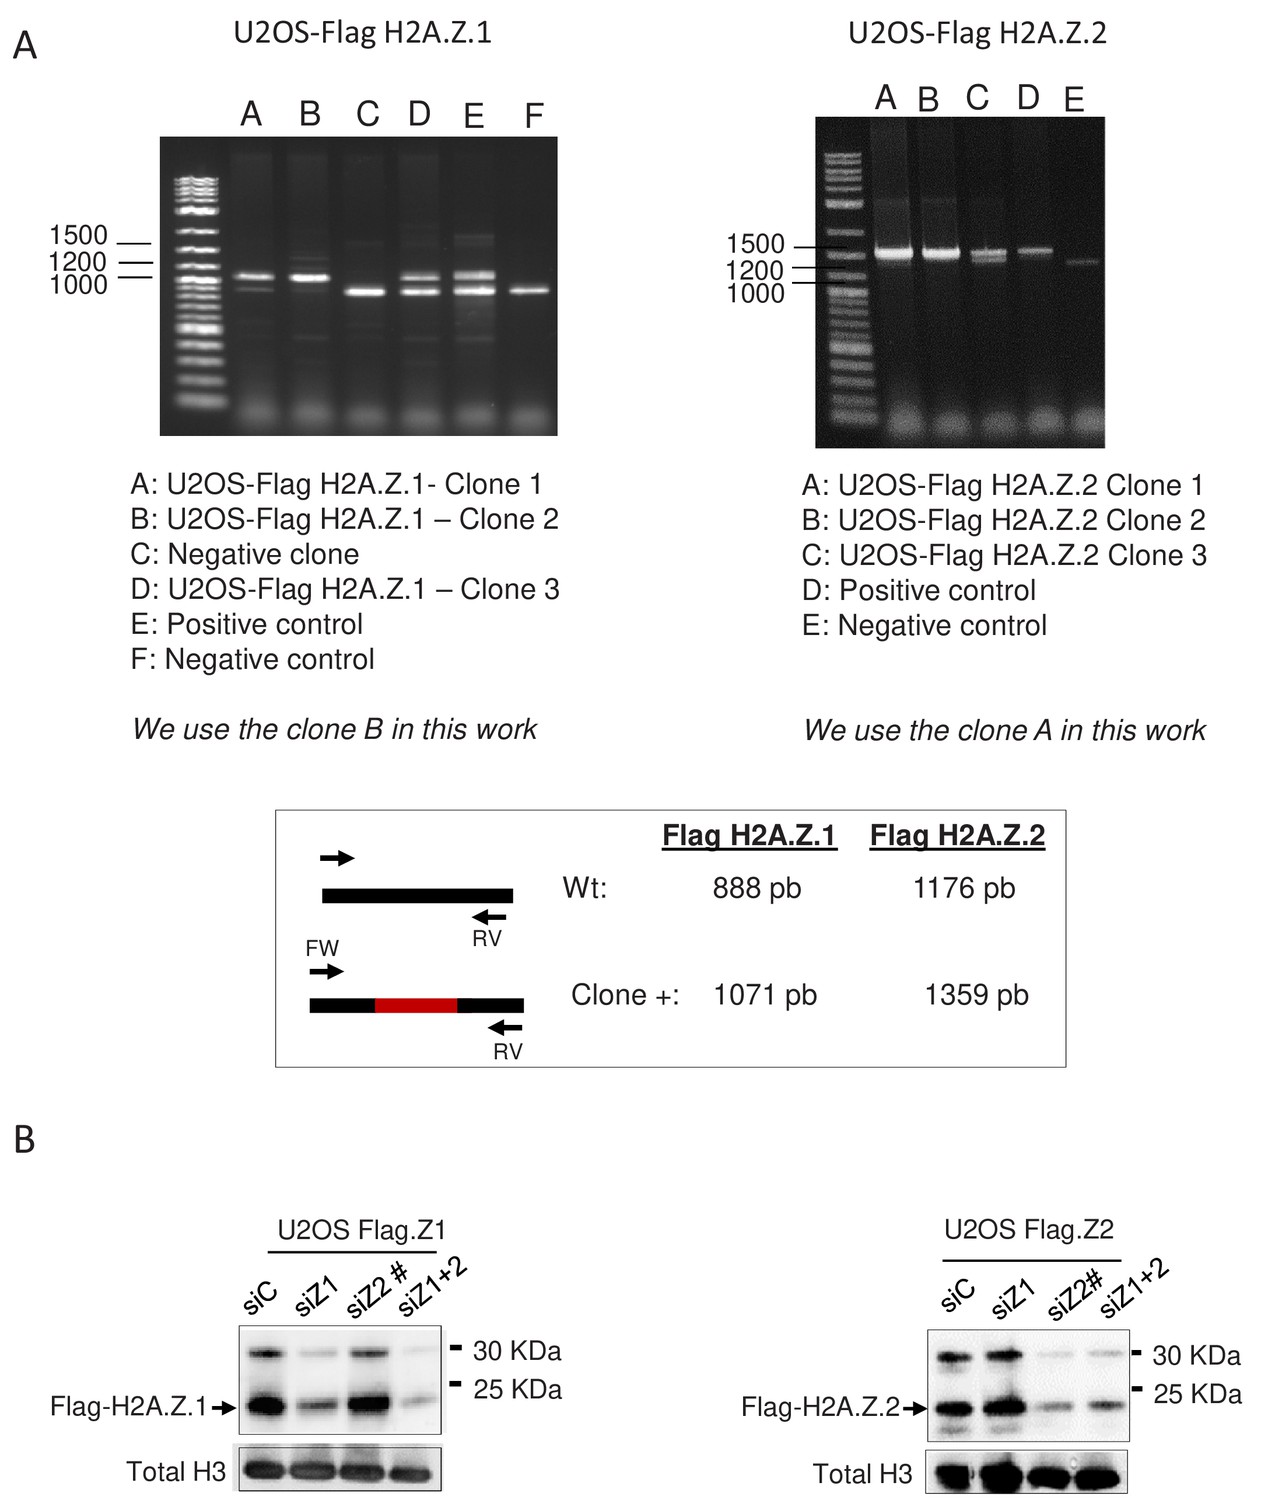
Characterisation of U2OS cells genome-edited to express 3xFlag-2xStrep H2A.Z.1 or H2A.Z.2.
(A) Genomic DNA samples were subjected to a PCR reaction using primers located outside of the inserted sequence as shown in the scheme (Bottom). The top panels show an analysis on agarose gel of the PCR products obtained on negative clones and on the genome-edited clones used in this study. Note the shift of the band in the genome-edited clones expressing Flag-H2A.Z.1 (Left) or Flag-H2A.Z.2 (Right), indicating the recombination. We chose the B clone from U2OS-Flag H2A.Z.1 and the A clone from U2OS-Flag H2A.Z.2 for further analyses. The bands were excised and sequenced to check the accuracy of the recombination. (B) Nuclear extracts from U2OS cells expressing Flag-H2A.Z.1 (Left) or Flag-H2A.Z.2 (Right) transfected with the indicated siRNA were subjected to a Flag western blot. Note the band migrating close to 30 kDa which likely corresponds to a post-translationally modified tagged histone. Note that the H2A.Z.2 siRNA is the one used in Figure 2—figure supplement 2 (si Z2#), ie? a different siRNA than in Figure 1.
Figure 2 with 5 supplements
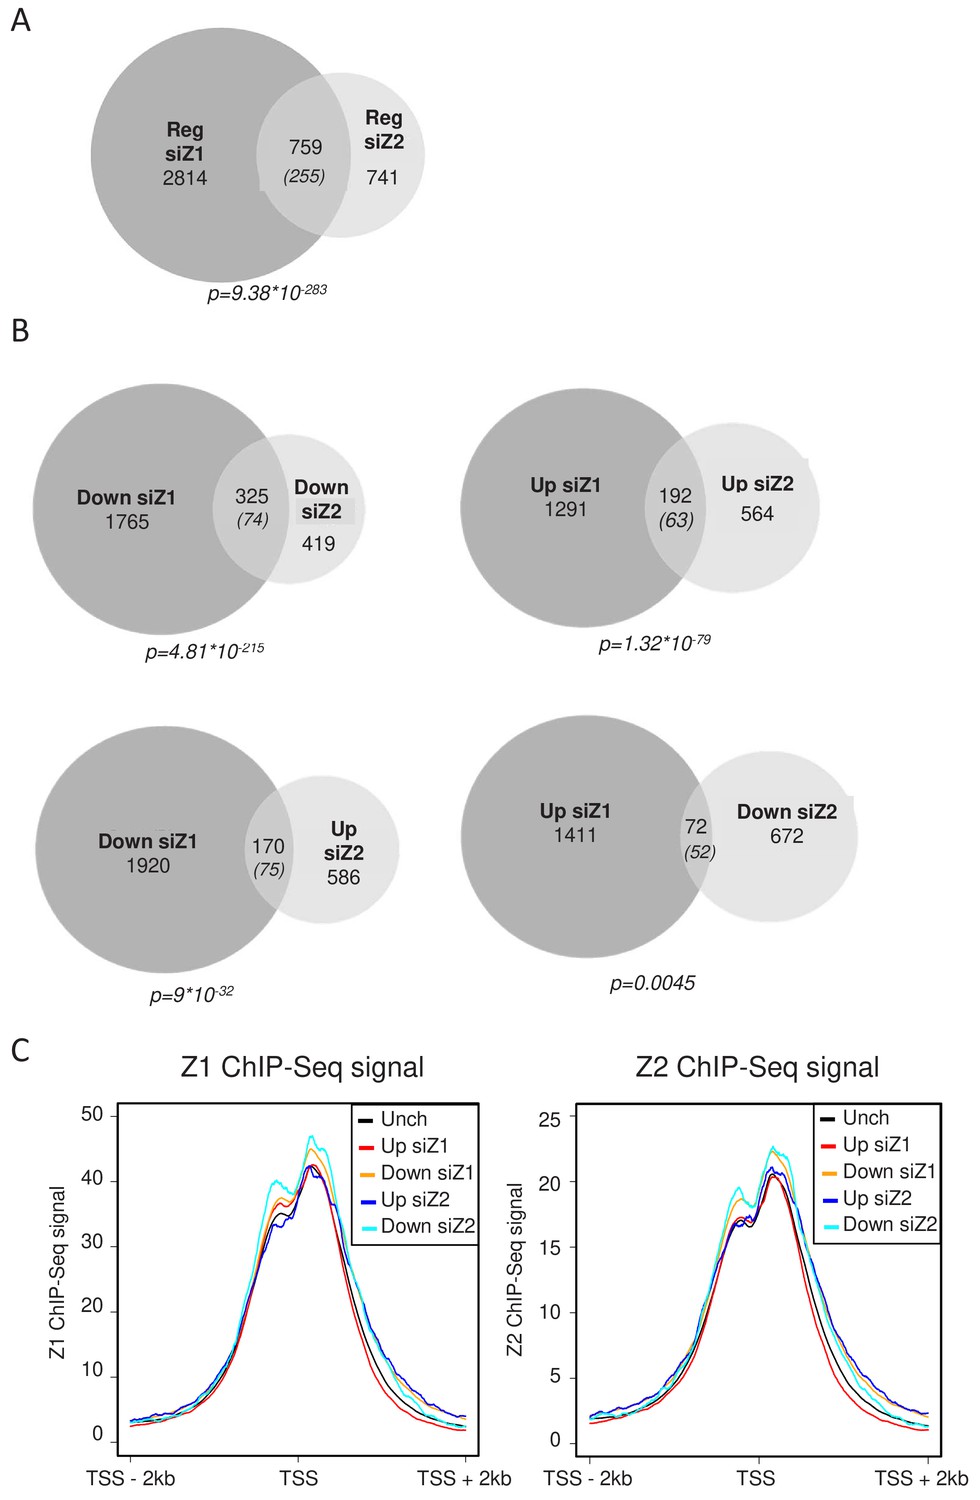
H2A.Z.1 and H2A.Z.2 regulate both distinct and overlapping sets of genes.
RNA-Seq data was analysed for differential gene expression in samples transfected with either H2A.Z.1 siRNA or H2A.Z.2 siRNA versus the control siRNA sample. (A) Venn diagram showing the intersection between genes differentially expressed upon H2A.Z.1 and H2A.Z.2 inhibition. The p value indicated below the diagram indicates the significance of the intersection calculated using the Chi square test considering all expressed genes. The numbers in brackets indicate the expected number of genes considering the total number of expressed genes if intersection was random. (B) Same as in A, except that the intersections indicate genes that are up-regulated or down-regulated in each sample and those that are regulated in an opposite way. Note that the intersection between genes up-regulated upon H2A.Z.1 depletion and down regulated upon H2A.Z.2 depletion is not highly significant. (C) U2OS cells expressing endogenously Flag-tagged H2A.Z.1 or H2A.Z.2 were subjected to ChIP-Seq experiments using anti-Flag antibodies. Metadata showing ChIP-Seq signals around TSS were computed for the five classes of genes (Unch: unchanged upon H2A.Z.1 or H2A.Z.2 depletion) defined from RNA-Seq data obtained in U2OS upon H2A.Z.1 or H2A.Z.2 depletion (see Figure 2—figure supplement 3). A representative experiment is shown. A replicate is shown in Fig. Figure 2—figure supplement 5A.
Figure 2—figure supplement 1
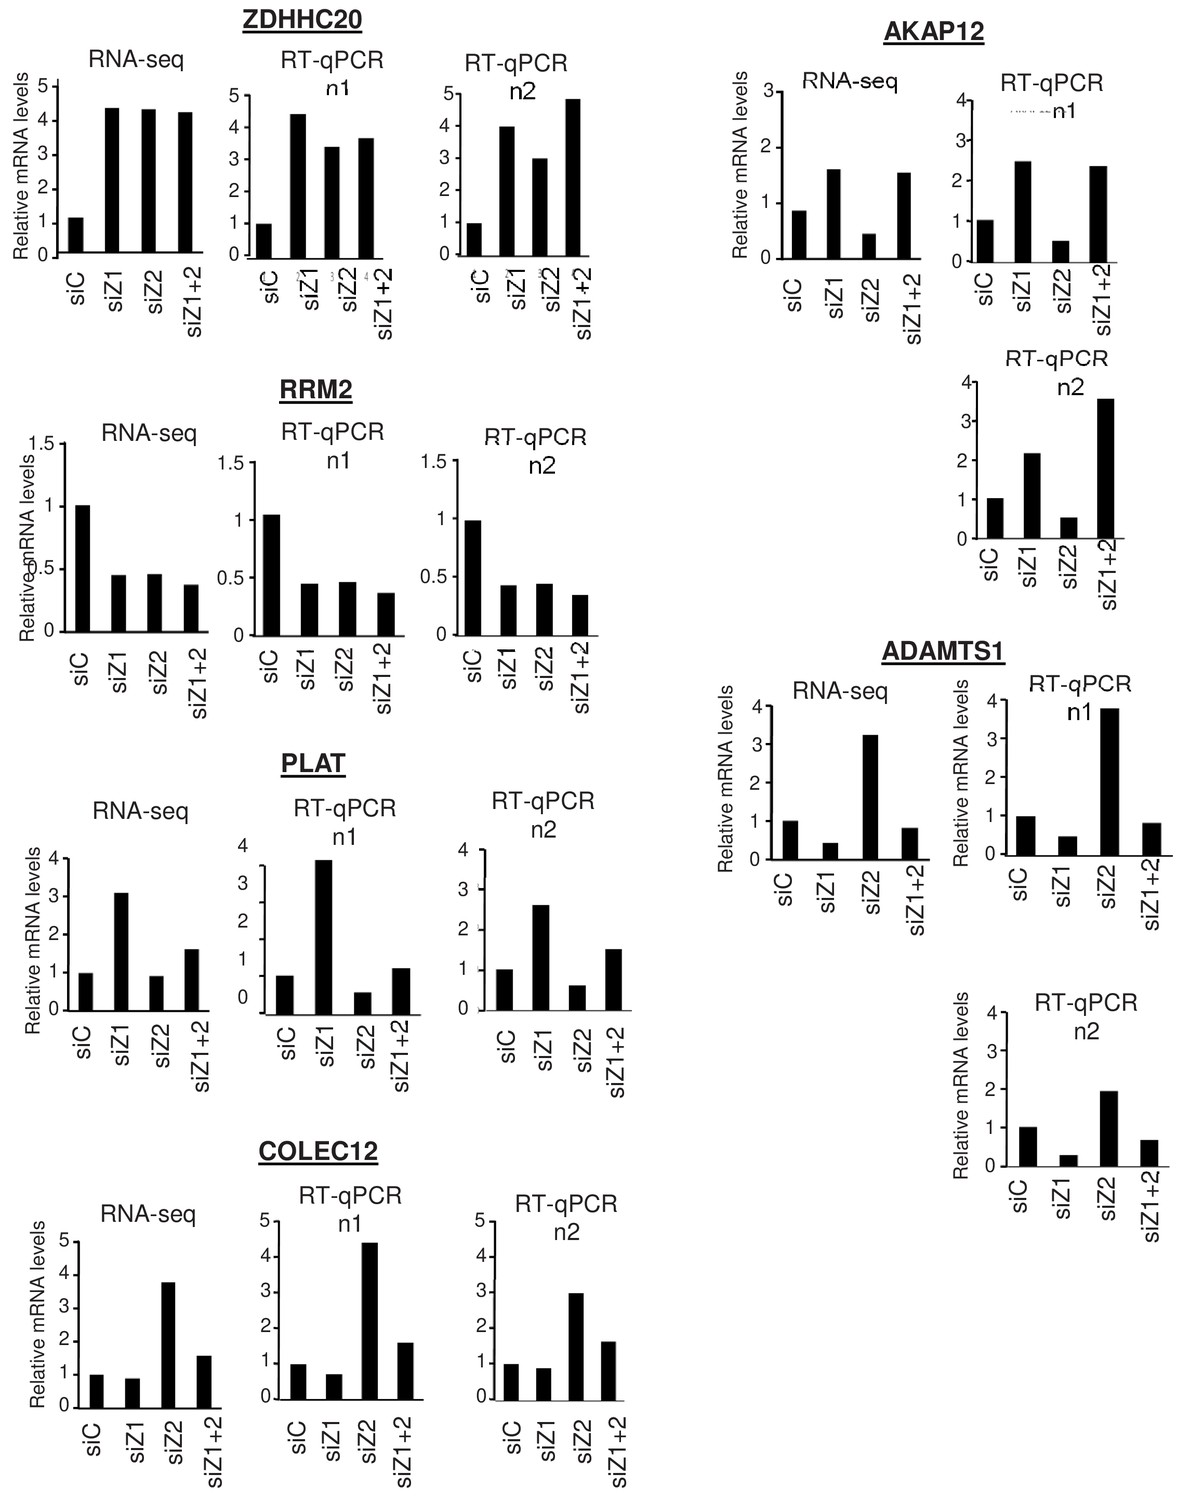
Validation of RNA Seq results.
WI38 cells were transfected with the indicated siRNAs. 72 hr later, total RNA was prepared and further purified to be subjected to RNA-Seq or analysed by RT-qPCR. RNA-Seq signals were averaged for the indicated genes and calculated relative to one for the control siRNA sample. RT-qPCR data for the indicated genes was standardised using GAPDH mRNA levels and calculated relative to one for cells transfected with the control siRNA. The data for the two samples sent to RNA-Seq are shown.
-
Figure 2—figure supplement 1—source data 1
Source data of the histogrammes representing the validation of RNA-seq effects by RT-qPCR on Figure 2—figure supplement 1.
- https://cdn.elifesciences.org/articles/53375/elife-53375-fig2-figsupp1-data1-v1.xlsx
Figure 2—figure supplement 2
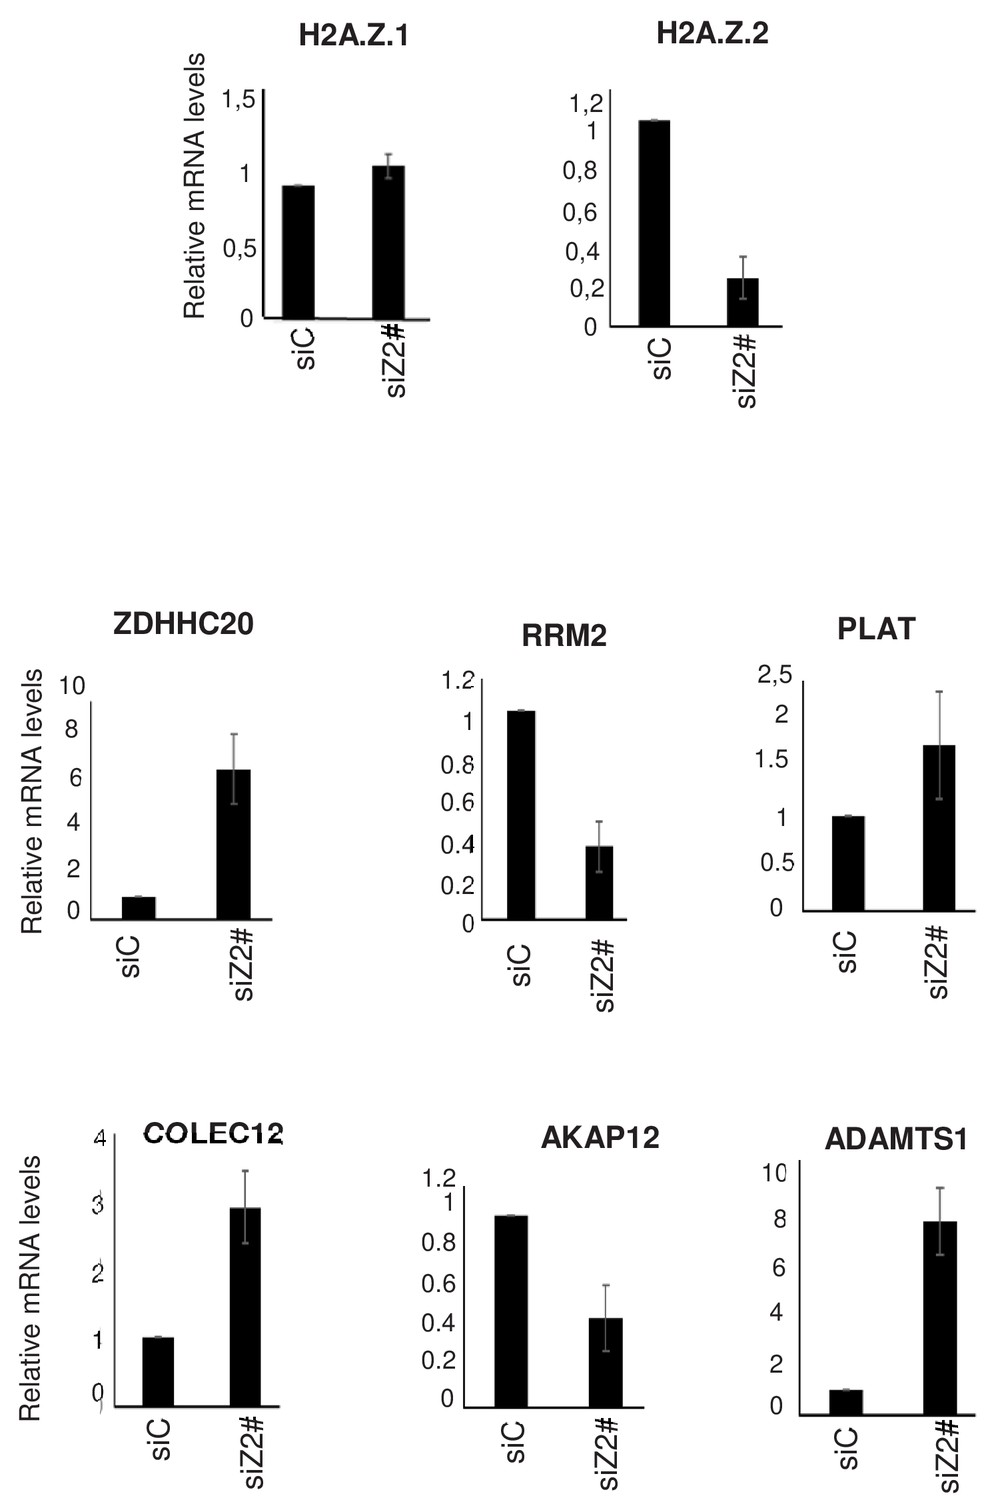
Effect of a second siRNA H2A.Z.2 (siZ2#).
WI38 cells were transfected using a control siRNA or a second independent siRNA against H2A.Z.2 (siZ2#). 72 hr later, total RNAs was prepared. The amount of the indicated mRNA was quantified by RT-qPCR, and was standardised using GAPDH mRNA levels and calculated relative to one in cells transfected using the control siRNA. The mean and SDOM from three independent experiments are shown.
-
Figure 2—figure supplement 2—source data 1
Source Data for the histogrammes representing the effect of a second siRNA H2A.Z.2 (siH2A.Z.2#) on Figure 2—figure supplement 2.
- https://cdn.elifesciences.org/articles/53375/elife-53375-fig2-figsupp2-data1-v1.xlsx
Figure 2—figure supplement 3
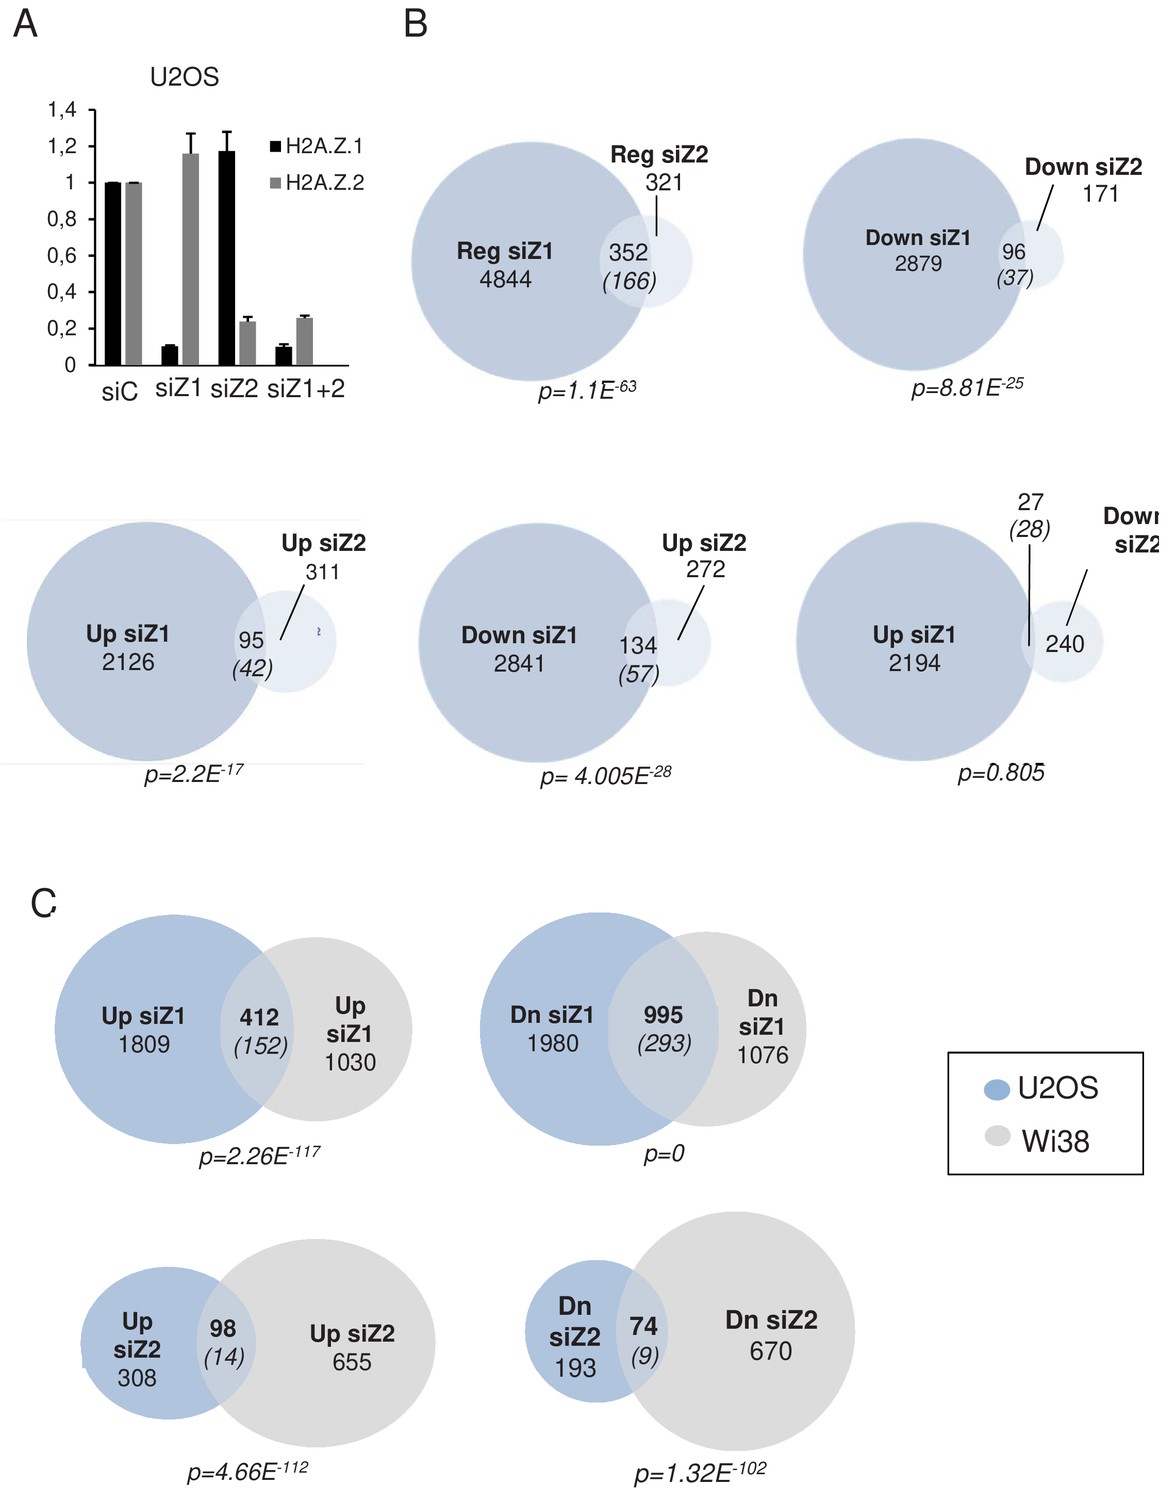
RNA-seq analysis after H2A.Z.1 and H2A.Z.2 depletion in U2OS cells.
(A) U2OS cells were transfected with the indicated siRNAs. 72 hr later, total RNA was prepared. The amount of H2A.Z.1 and H2A.Z.2 mRNA was quantified by RT-qPCR, standardised using GAPDH mRNA levels and calculated relative to one for cells transfected with the control siRNA. The mean and SDOM from three independent experiments are shown. (B) H2A.Z.1 and H2A.Z.2 regulate specific and common genes in U2OS cells. RNA Seq data from U2OS cells were analysed for differential gene expression in samples transfected by either the H2A.Z.1 siRNA or the H2A.Z.2 siRNA versus the control siRNA sample. Venn diagram showing the intersection between the genes differentially expressed upon H2A.Z.1 and H2A.Z.2 inhibition, between genes up-regulated in the two samples, down-regulated in the two samples or regulated in an opposite way in the two samples. Note that, as for WI38, the intersection between genes upregulated upon H2A.Z.1 depletion and down-regulated upon H2A.Z.2 depletion is not highly significant. The numbers in brackets indicate the expected number of genes considering the total number of expressed genes if intersection was random. The p-value was calculated using the Chi-square test considering all expressed genes. (C) H2A.Z.1 and H2A.Z.2 regulate different genes in WI38 and U2OS cells. Venn diagram showing the intersection between lists of differentially expressed genes from RNA Seq data from WI38 and U2OS cells. Note that despite significant overlap, gene lists were mostly different. The numbers in brackets indicate the expected number of genes considering the total number of expressed genes if intersection was random. The p-value was calculated using the Chi-square test considering all expressed genes.
-
Figure 2—figure supplement 3—source data 1
Source data of the histogramme representing the depletion of H2A.Z.1 and H2A.Z.2 in response to siRNAs in U2OS cells in Figure 2—figure supplement 3.
- https://cdn.elifesciences.org/articles/53375/elife-53375-fig2-figsupp3-data1-v1.xlsx
Figure 2—figure supplement 4
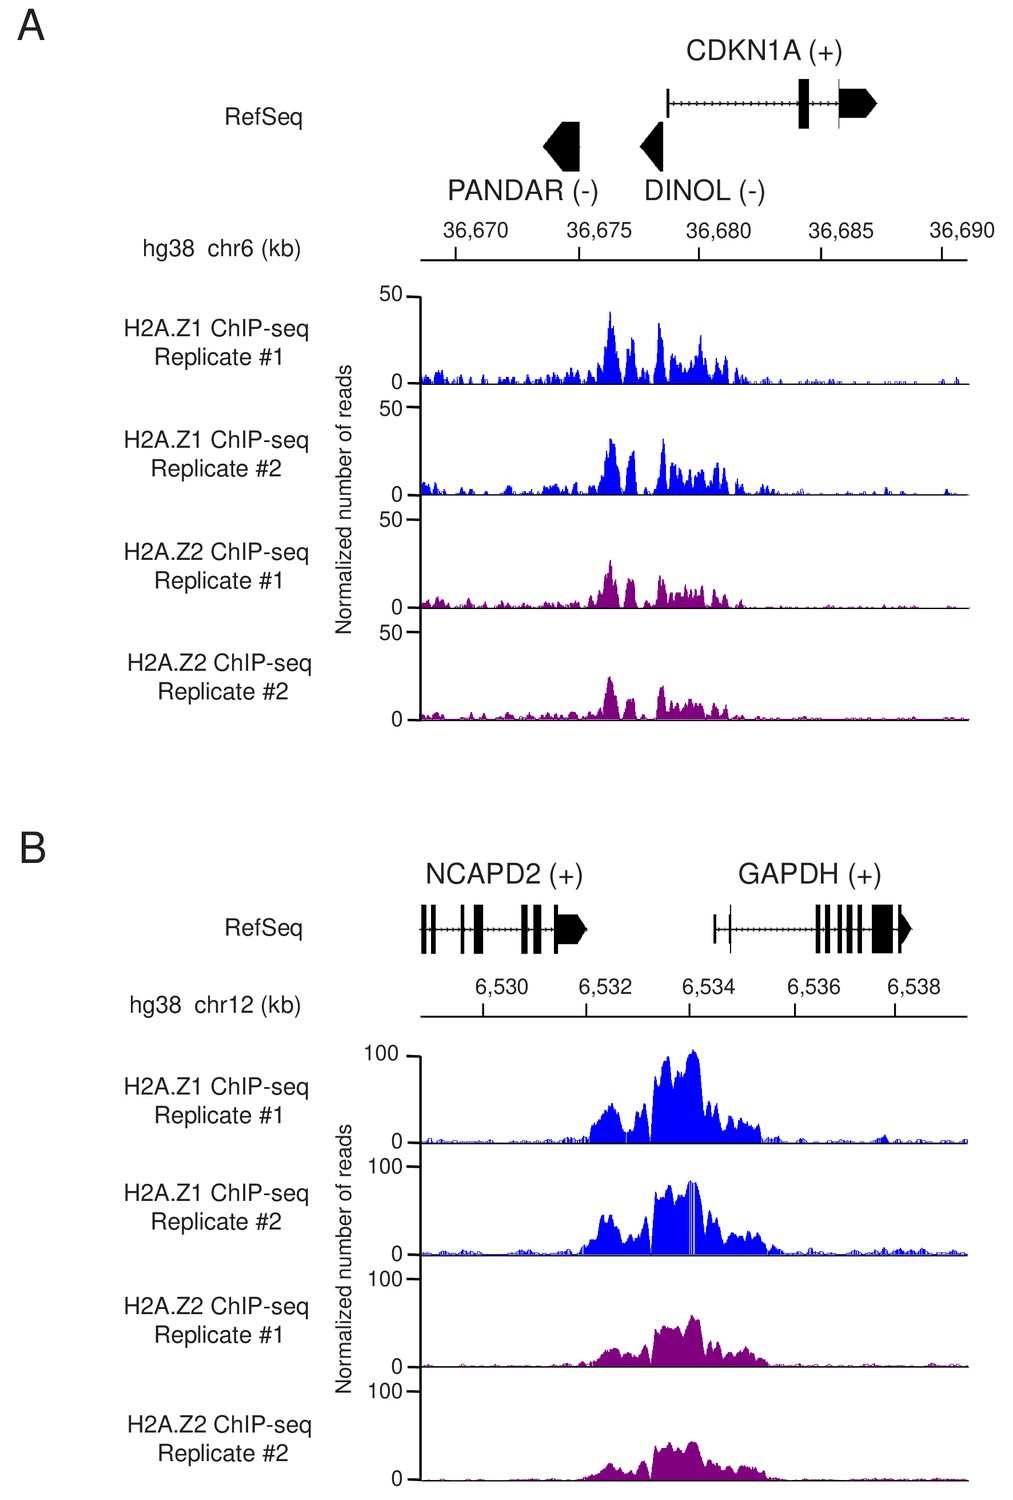
Profiles of tagged H2A.
Z.1 and H2A.Z.2 ChIP-Seq data at the CDKN1A/p21 and GAPDH loci. The two replicates of ChIP-Seq experiments using Flag antibodies from U2OS cells expressing either genome edited H2A.Z.1 or H2A.Z.2 were visualized on IGB (Integrated Genome Browser). The tracks show the normalized number of aligned reads of ChIP-seq datasets at the CDKN1A/p21 (A) and GAPDH (B) genes. RefSeq genes (hg38) are also shown with their DNA strands in brackets (if several transcript variants exist, only the 1st transcript variant is shown for simplicity).
Figure 2—figure supplement 5
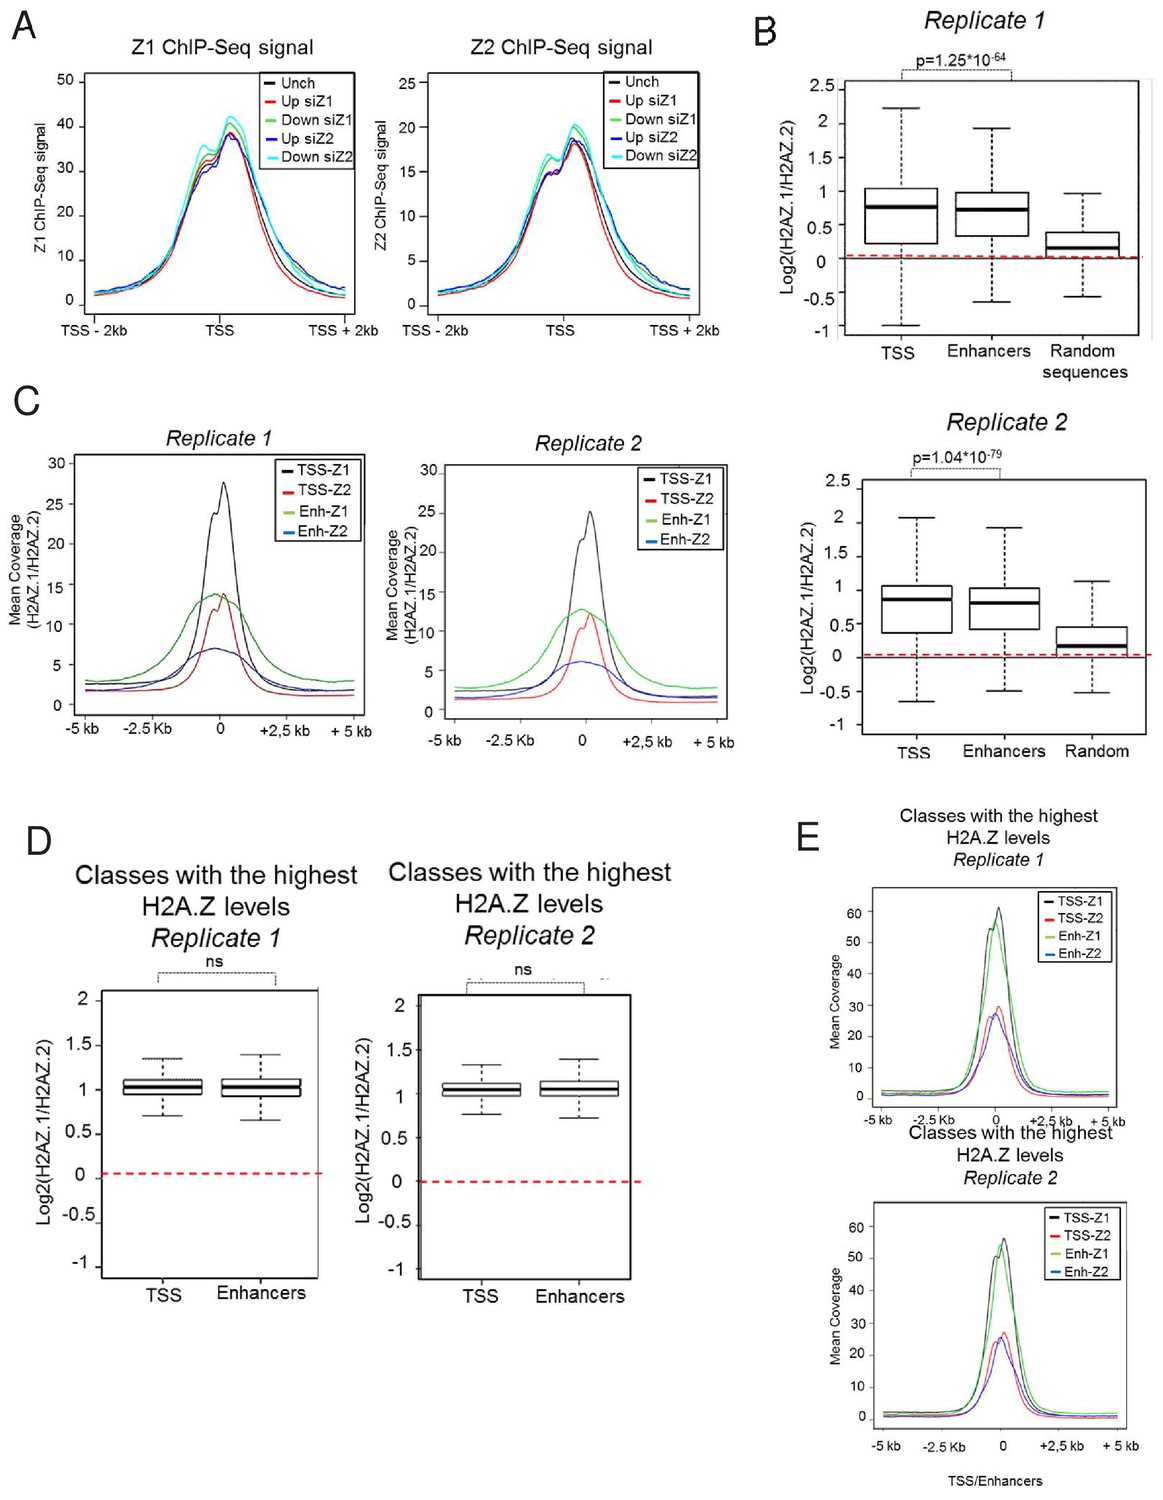
Analysis of H2A.Z.1 or H2A.Z.2 presence around TSS and enhancers.
(A) Replicates of ChIP-Seq experiments using Flag antibodies from U2OS cells expressing either genome edited H2A.Z.1 (left) or H2A.Z.2 (right) analysed as in Figure 2C. (B) Box plots representing the ratio of the mean amount of H2A.Z isoforms ChIP-Seq signals around all TSS (59,553 TSSs), at all U2OS enhancers (obtained through enhanceratlas: http://www.enhanceratlas.org/, 14,764 enhancers) and at 1000 random genomic sequences of 1000 bases. (C) Metadata showing the mean of H2A.Z.1 and H2A.Z.2 ChIP Seq signals on the 10 kB region encompassing all TSSs and all enhancers. For enhancers, the ‘0’ position corresponds to the centre of enhancers defined in enhanceratlas. (D) TSSs and enhancers were sorted in five classes according to the total levels of H2A.Z. The box plots show the ratio of the mean amount of H2A.Z isoforms ChIP-Seq signals around TSS (24,695/22,263 TSSs), and U2OS enhancers (1,707/1,459 enhancers) falling into the highest class (4 < ln (H2A.Z.1 + H2A.Z.2 ChIP-Seq signals)<5). (E) Metadata showing the mean of H2A.Z.1 and H2A.Z.2 ChIP Seq signals on the 10 kB region encompassing the TSS and enhancer populations defined in D). For enhancers, the ‘0’ position corresponds to the centre of enhancers defined in enhanceratlas.
Figure 3 with 2 supplements
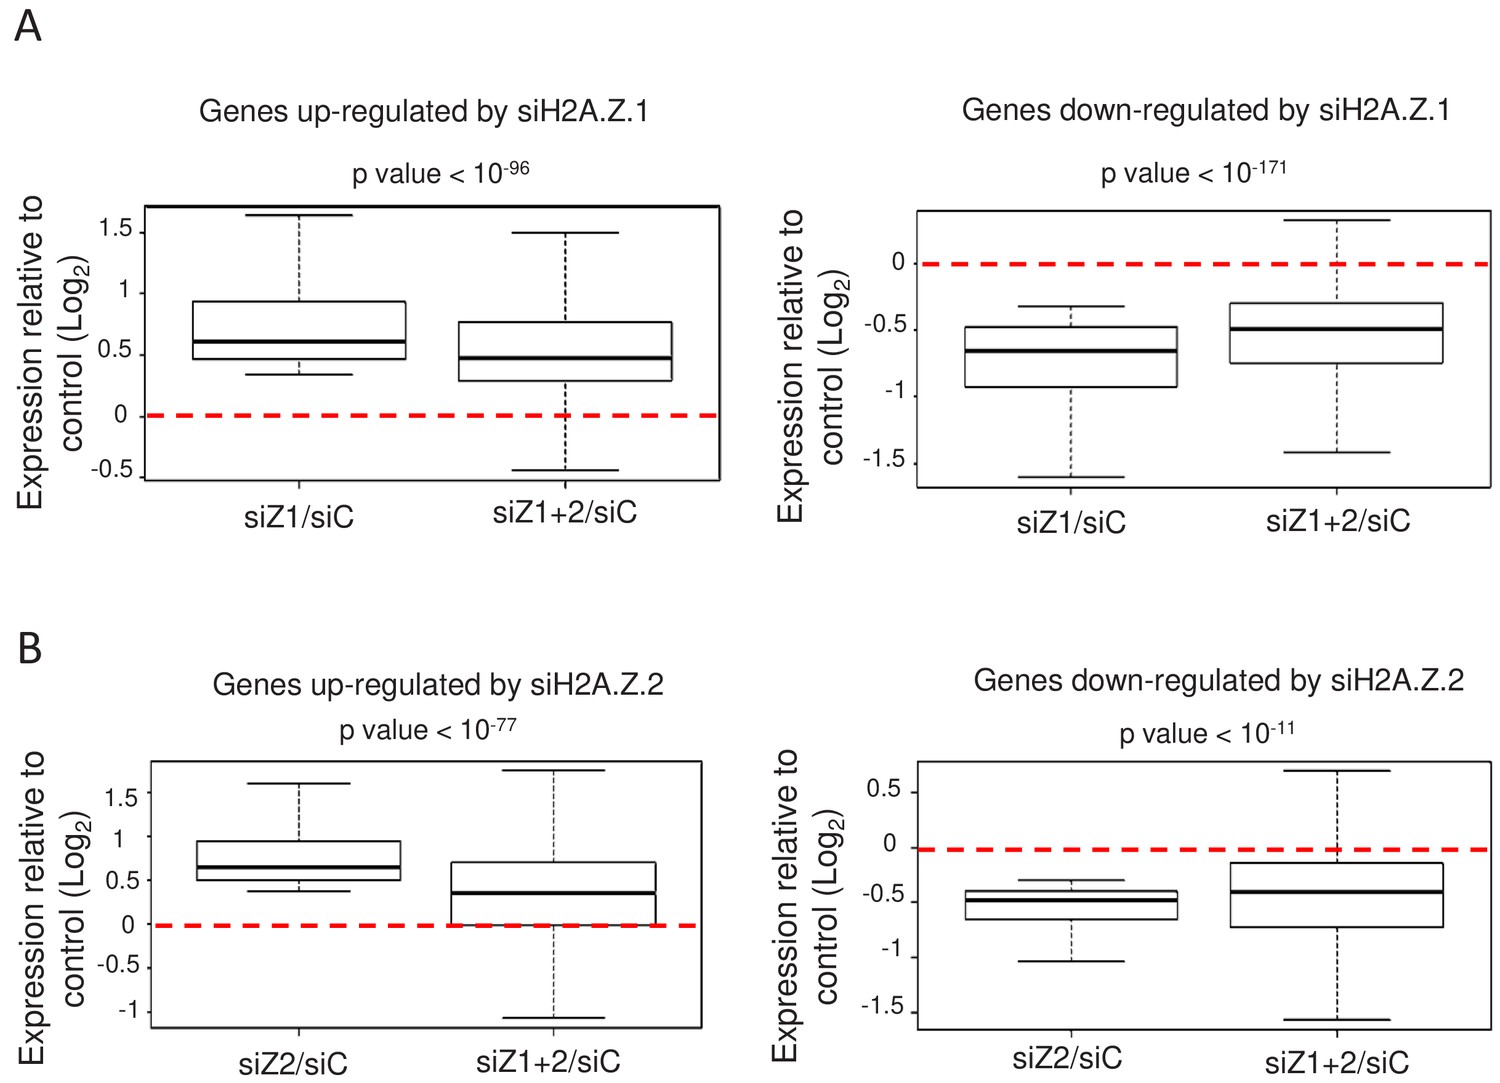
H2A.Z isoforms exert an antagonistic regulation on gene expression.
(A) For each gene up-regulated (left) or down-regulated (right) upon H2A.Z.1 depletion, we calculated the ratio between its expression in either H2A.Z.1 depleted cells (siZ1/siC) or cells depleted for H2A.Z.1 and H2A.Z.2 versus control cells (siZ1+2/SIC). The boxplots show the median, the 25% percentiles and the extrema of the Log2 of this ratio within the gene population (without outliers). The p value shows the significance of the difference between the two populations (paired welch test). (B) Same as in A, except that the calculation was done for genes up-regulated (left) or down-regulated (right) upon H2A.Z.2 depletion.
Figure 3—figure supplement 1
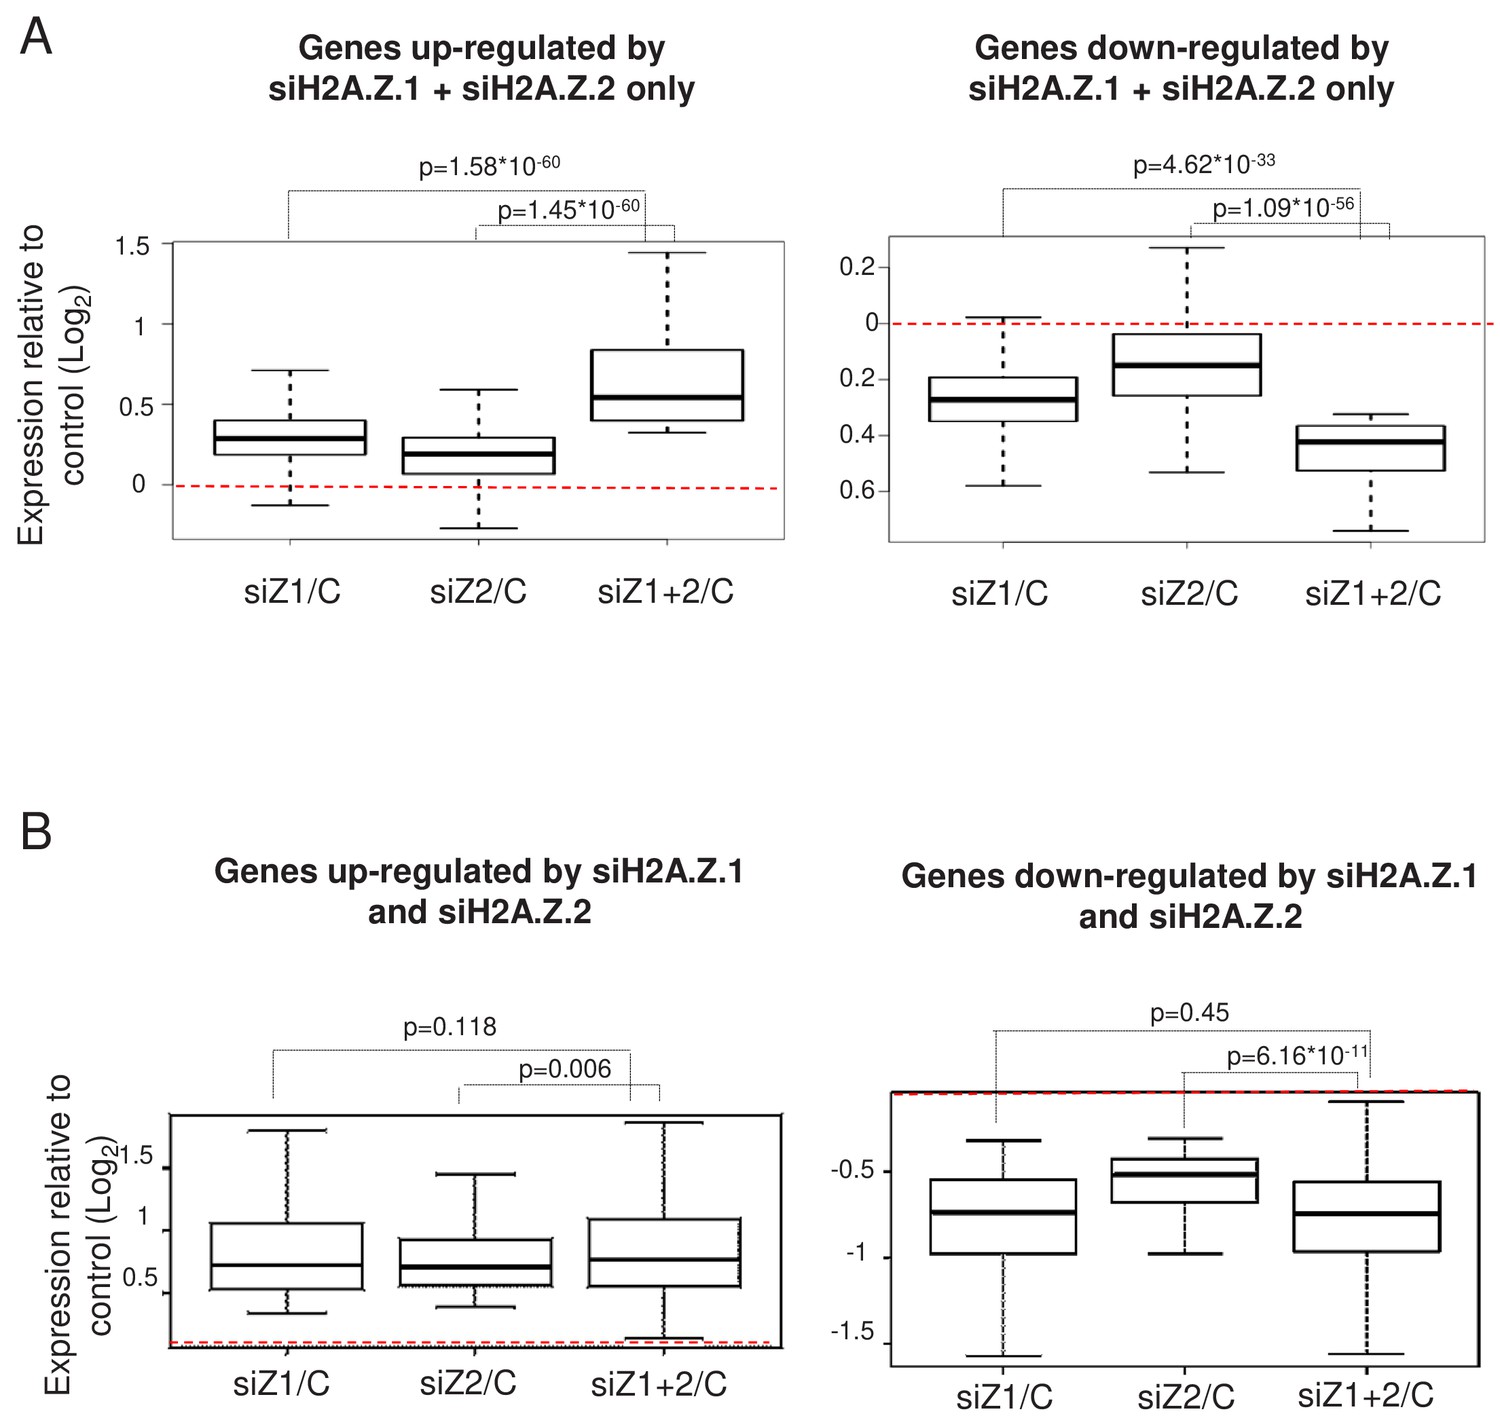
Effect of the double depletion of H2A.Z.1 and H2A.Z.2 on genes similarly regulated by H2A.Z.1 and H2A.Z.2.
(A) For genes up-regulated (left) or down-regulated only after the combined depletion of H2A.Z.1 and H2A.Z.2, we calculated the ratio between its expression in either H2A.Z.1-depleted cell, H2A.Z.2-depleted cells, or cells depleted for H2A.Z.1 and H2A.Z.2 together versus control cells. Boxplots show the median, the 25% percentiles and the extrema within the gene population of the Log2 of this ratio (without outliers). The p value shows the significance of the difference between the two populations (paired welch test). (B) Same as in A for genes up-regulated (left) or down-regulated (right) after the depletion of H2A.Z.1 and H2A.Z.2 alone.
Figure 3—figure supplement 2

Antagonistic regulation by H2A.Z isoforms in U2OS cells.
For each genes up-regulated (Top left) or down-regulated (Top, right) upon H2A.Z.1 depletion, we calculated the ratio between its expression in either H2A.Z.1 depleted cells or cells depleted for H2A.Z.1 and H2A.Z.2 versus control cells. Boxplots shows the median, the 25% percentiles and the extrema within the gene population of the Log2 of this ratio (without outliers). The p value shows the significance of the difference between the two populations (paired welch test). Bottom: genes up-regulated (left) or down-regulated (right) upon H2A.Z.2 depletion were analysed.
Figure 4
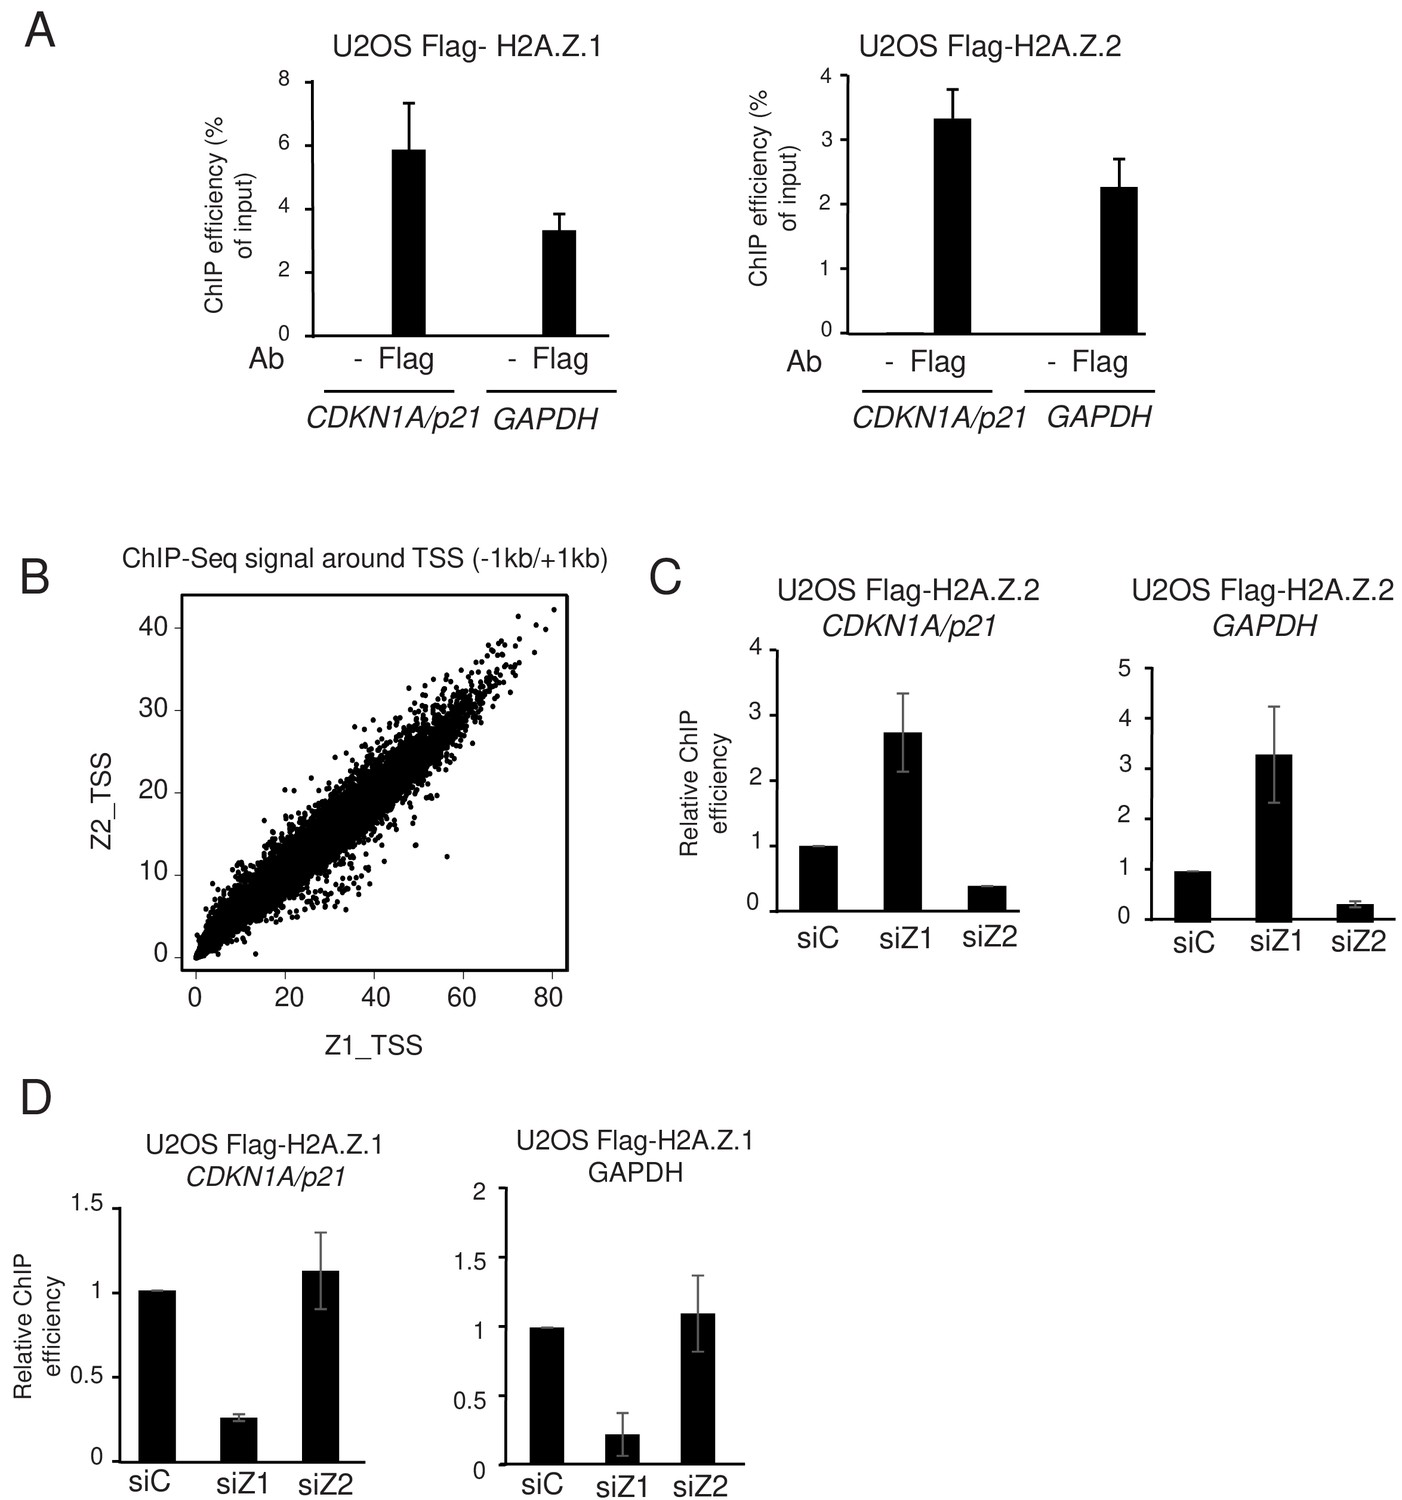
H2A.Z.1 and H2A.Z.2 replace each other at genes promoters.
(A) U2OS cells expressing endogenously tagged H2A.Z.1 or H2A.Z.2 as indicated were subjected to a ChIP assay using the Flag antibody or no antibody as a control. The amount of the indicated sequences was measured by qPCR and calculated relative to the input DNA. The mean and SDOM from three independent experiments are shown. (B) A ChIP Seq assay was performed on the same samples. The amount of H2A.Z.1 or H2A.Z.2 from −1000 to +1000 of each protein-coding gene TSS was calculated and plotted against one another. Note the striking correlation between the binding of H2A.Z.1 and H2A.Z.2. (C) U2OS cells expressing endogenously tagged H2A.Z.2 were transfected with the indicated siRNA. 72 hr later cells were harvested and subjected to a ChIP experiment in the presence of spike-in chromatin. The amount of the indicated promoter was measured by qPCR, calculated relative to spike-in signals and relative to one for cells transfected with the control siRNA. The mean and SDOM from three independent experiments are shown. (D) Same as in C, except that U2OS cells expressing endogenously tagged H2A.Z.1 were used.
-
Figure 4—source data 1
Source Data of the histogrammes representing ChIP expreriments in U2OS cells expressing tagged H2A.
Z isoforms on Figure 4A.
- https://cdn.elifesciences.org/articles/53375/elife-53375-fig4-data1-v1.xlsx
-
Figure 4—source data 2
Source Data of ChIP showing the competition between the two isoforms on Figure 4C and D.
- https://cdn.elifesciences.org/articles/53375/elife-53375-fig4-data2-v1.xlsx
Figure 5 with 2 supplements
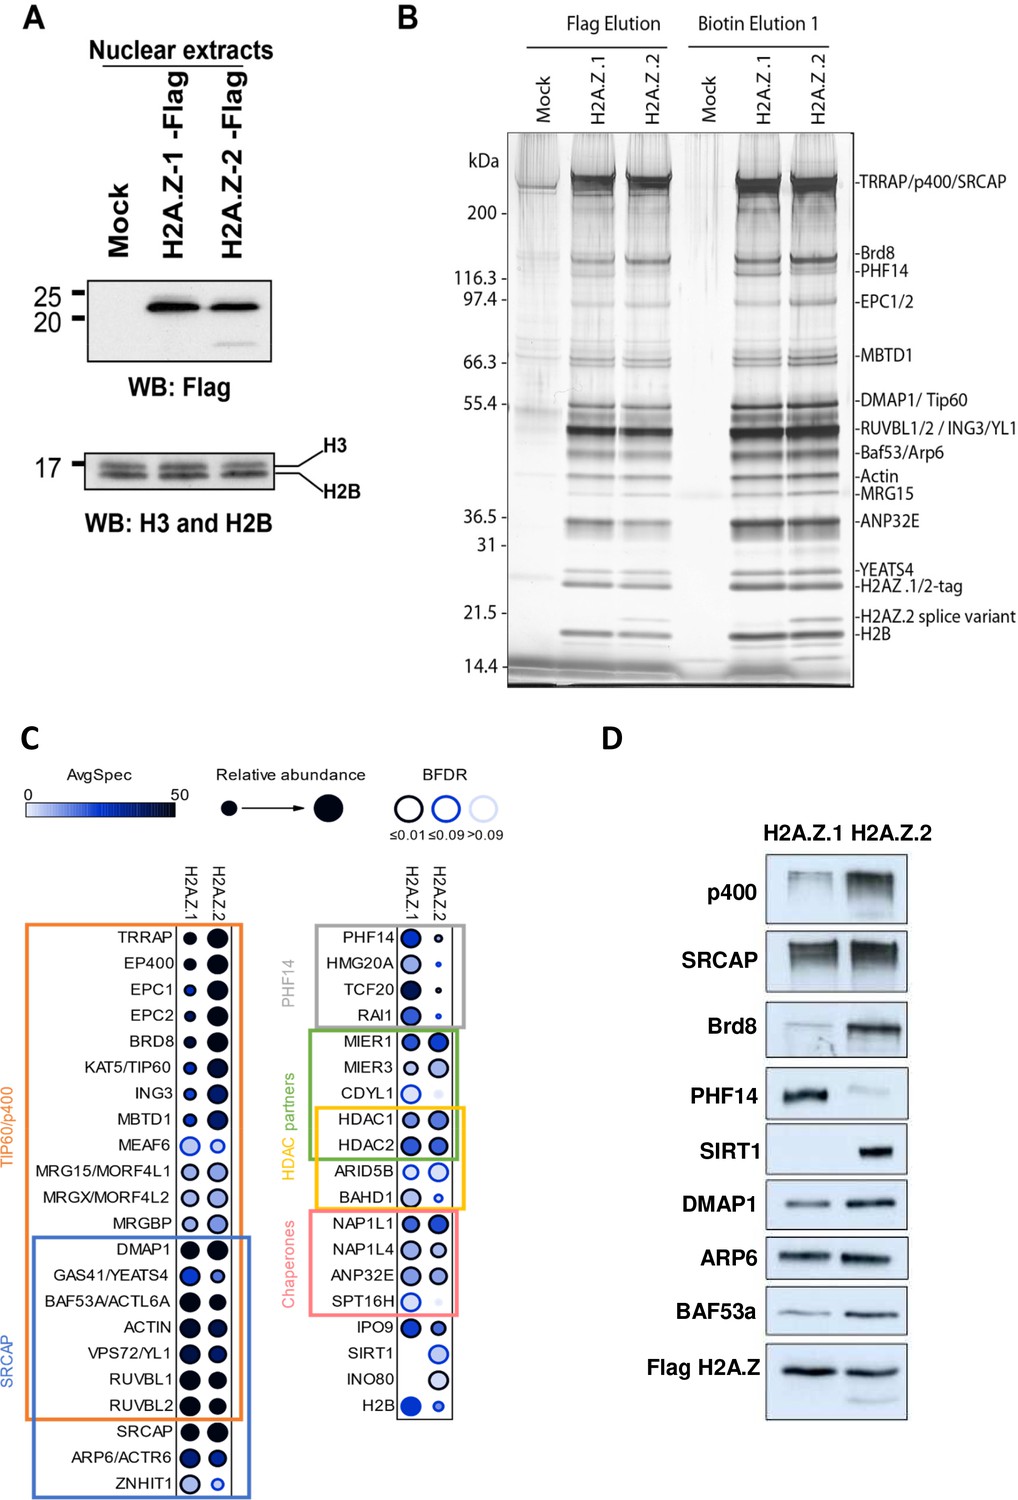
Identification of differential H2AZ.1 and H2AZ.2 interactors.
(A) Comparison of expression levels of tagged endogenous H2A.Z.1 (heterozygous) and H2A.Z.2 (homozygous) clones used in tandem affinity purification from nuclear extracts (see Figure 5—figure supplement 1). (B) Silver stained gel of fractions obtained for the purification of H2A.Z.1 and H2A.Z.2 from nuclear extracts of K562 cells shown in (A). A mock non-tagged cell line is used as control. Flag peptide elution is obtained from the first purification step (M2-Flag resin) and biotin elution from the second final step (Strep-Tactin resin). Known components of protein complexes interacting with histone H2A.Z are identified on the right (PHF14 is also indicated). (C) Dot-blot representation of AP-MS experiments using tagged H2A.Z.1 and H2A.Z.2 as baits. Circle filling represents average spectral counts, while circle diameter represents relative enrichment in one bait versus the other and circle border represents BFDR confidence level. Known/expected partners based on the literature and large-scale public data (BioGrid) include TIP60/p400, SRCAP and HDAC complexes. Data represent two replicates for each bait and were normalized on H2AZ-H2B chaperone levels (ANP32E, NAP1L1 and NAP1L4). (D) Western-blot validation of interactions shown in (B–C). TAP-purified fractions were normalized based on Flag-H2A.Z signals, loaded on SDS-PAGE gels, and blotted with the indicated antibodies.
Figure 5—figure supplement 1

Tagging of H2A.Z isoforms by CRISPR/Cas9 in K562 cells used for characterisation of interactomes.
(A) Schematic of the H2AFZ locus (4q23), Cas9 target site, and donor construct used to insert the 3xFlag-2xStrep tag to the C-terminus of the H2A.Z.1 protein. Annotated are the positions of the stop codon (red), the PAM (green) that specifies the cleavage site, the gRNA target sequence, and the left and right homology arms (HA) used for HR-directed insertion. (B) Schematic of the H2AFV locus (7p13), depicted as in (A). (C) Schematic and results of a PCR-based assay (out-out PCR) on genomic DNA to detect targeted integration (TI) of the tag sequence in single-cell-derived K562 clones obtained by limiting dilution. Primers are located outside of the homology arms and are designed to yield a longer PCR product if the tag is inserted, as described in Figure 1—figure supplement 1. Note that the H2A.Z.1-tagged clone is heterozygous, whereas the H2A.Z.2-tagged clone is homozygous. These two clones were used for subsequent analyses since tag expression levels were similar (D) Chromatin-enriched nuclear extracts from the indicated cell line were subjected to a total H2A.Z western blot. (E) K562 cells expressing endogenously tagged H2A.Z.1 or Z2 were subjected to a ChIP-Seq experiments. Protein-coding genes were ranked in 4 classes of equal number based on their expression levels. Meta data showing binding of H2A.Z.1 or H2A.Z.2 ChIP Seq signal around the TSS for the 4 classes of genes are shown. (F) The amount of H2A.Z.1 or Z2 in the −1000 to +1000 from each transcription start site of each protein-coding gene were calculated and plotted against each other. Note the striking correlation between the binding of Z1 and Z2.
Figure 5—figure supplement 2
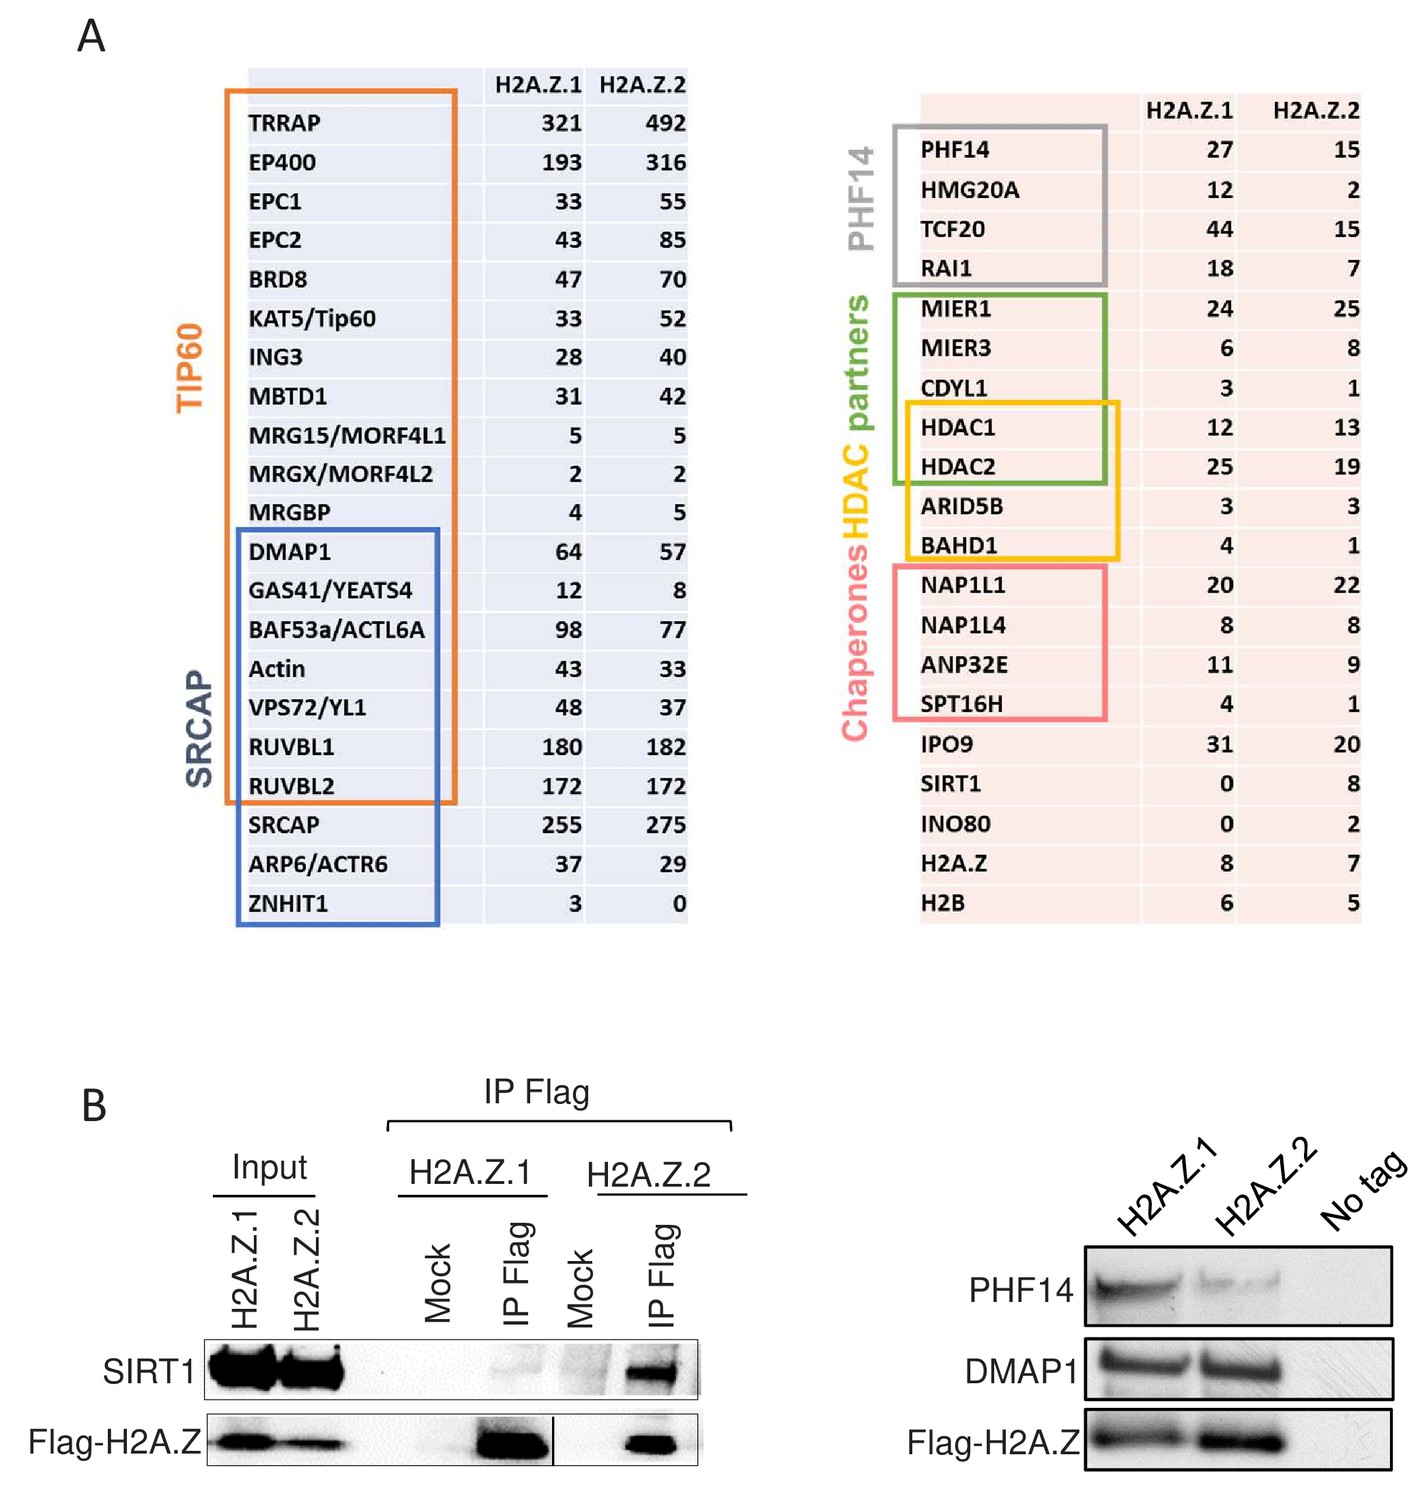
Mass spectrometry analysis of the H2A.Z.1/2 purifications shown in Figure 5B and validation in U2OS cells.
(A) Total spectral counts obtained in one experiment with each biotin elution fraction are shown and grouped by known complexes based on the literature and BIOGRID. (B) Nuclear extracts from U2OS expressing tagged H2A.Z.1 or tagged H2A.Z.2 were subjected to an immunoprecipitation using the indicated antibody or no antibody as a control. Immunoprecipitates were analysed by western blot using anti-SIRT1 and anti-Flag antibodies. Note that despite lower expression of H2A.Z.2, more SIRT1 was found associated with it. Note that PHF14 was undetectable in these experiments (data not shown), probably because of lack of good antibodies. We thus used higher amount of cells to purify H2A.Z-isoforms interacting proteins as performed in Figure 5 for mass spectrometry analysis (see below in (C)). (C) Soluble nuclear extracts from U2OS cells expressing either tagged H2A.Z.1, tagged H2A.Z.2 or no Tag as indicated was subjected to tandem affinity purification (anti-Flag resin followed by Flag peptide elution). The amount of cells was adapted to have approximately the same amount of immunoprecipitated H2A.Z isoforms. Flag-eluted proteins were analysed by western blot using the indicated antibody. Note the higher amount of PHF14 found in the H2A.Z.1 fraction although amounts of purified H2A.Z1 and DMAP levels were higher in the H2A.Z.2 fraction.
Figure 6 with 3 supplements
PHF14 and SIRT1 mediate H2A.Z.1 and H2A.Z.2 functions respectively.
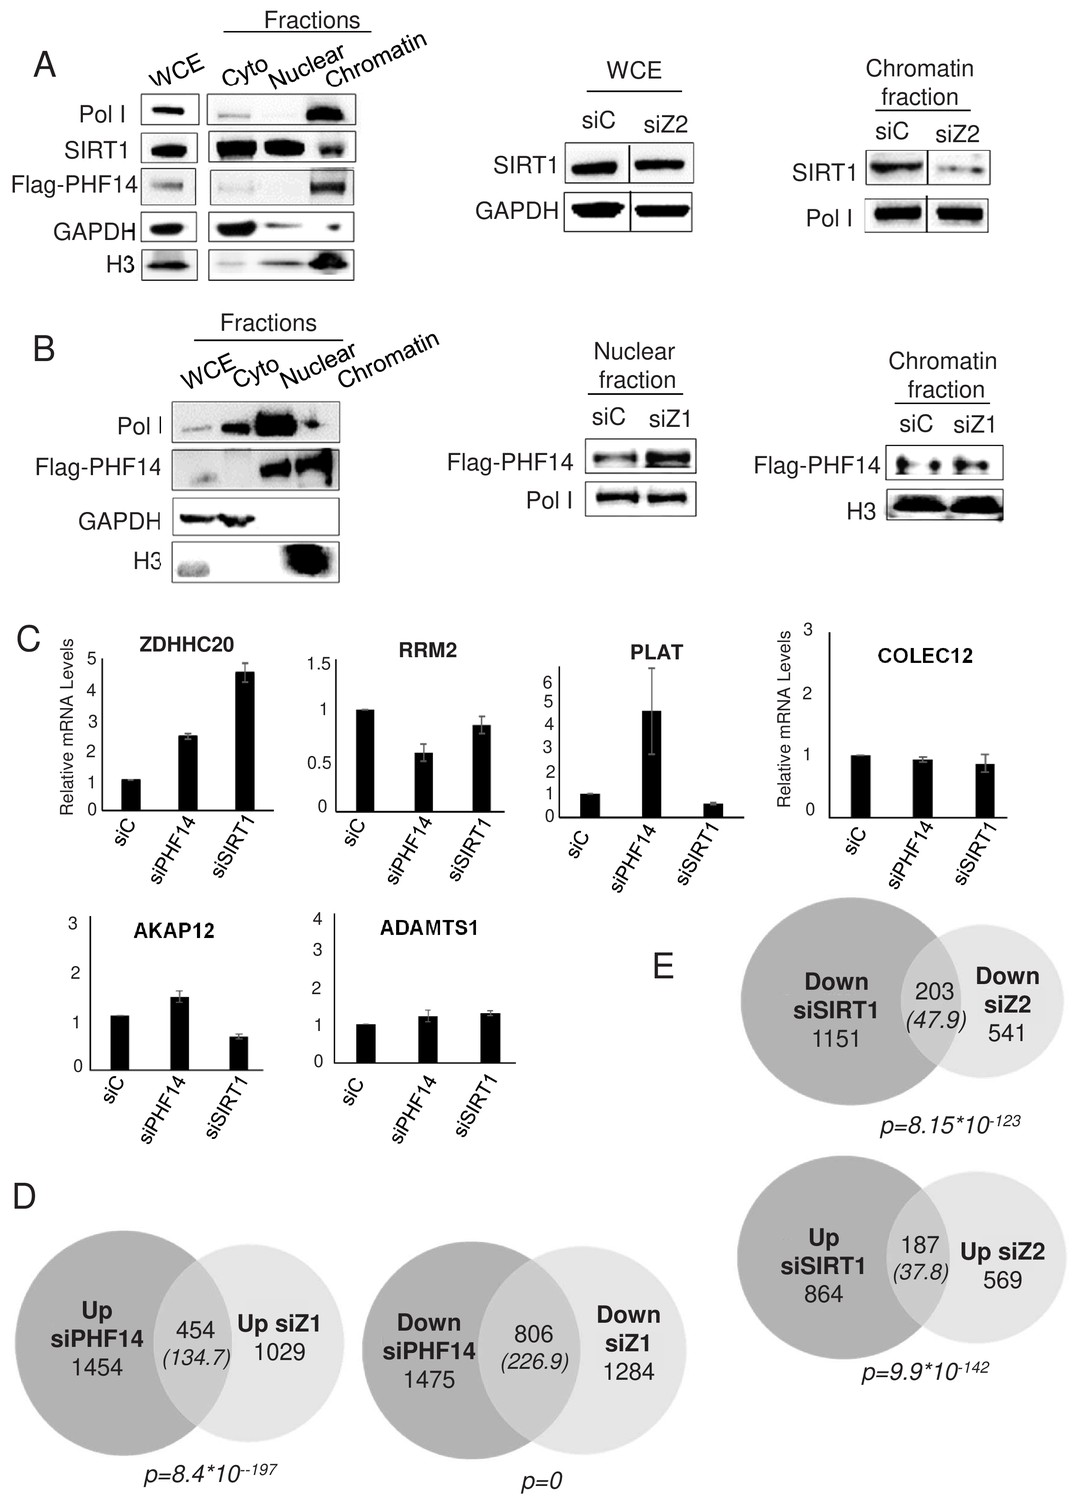
(A) Left panel: U2OS cells expressing endogenously tagged PHF14 were subjected to cell fractionation experiments in mild conditions. Cell fractions were then subjected to western blot analysis using the indicated antibody. Right panel: U2OS cells expressing endogenously tagged PHF14 were transfected with the indicated siRNA and analysed 72 hr later as in the left panel. A representative experiment from three independent experiments are shown (see Figure 6—figure supplement 2 for a replicate) B) Left panel: U2OS cells expressing endogenously tagged PHF14 were subjected to cell fractionation experiments using NP40. Cell fractions were then subjected to western blot analysis using the indicated antibody. Right panel: U2OS cells expressing endogenously tagged PHF14 were transfected with the indicated siRNA and analysed 72 hr later as in the left panel. A representative experiment from three independent experiments are shown (see Figure 6—figure supplement 2 for a replicate) C) WI38 cells were transfected with the indicated siRNA. 72 hr later, total RNA was prepared and analysed by RT-qPCR to assess the expression of the indicated genes. Data was standardised using GAPDH mRNA levels and calculated relative to one for cells transfected with the control siRNA. The mean and SDOM from three independent experiments are shown. (D and E) WI38 cells were transfected with the indicated siRNA. 72 hr later, total RNA was prepared and further purified to be subjected to RNA-Seq. Genes differentially expressed upon PHF14 or SIRT1 depletion were characterised. The Venn diagrams indicating the intersection of genes regulated by PHF14 and H2A.Z.1 (D) or by SIRT1 and H2A.Z.2 (E) are shown. The p value indicates the significance of the intersection (Chi square test) considering the total number of expressed genes. The numbers in brackets indicate the expected number of genes considering the total number of expressed genes if intersection was random.
-
Figure 6—source data 1
Source Data of histogrammes on Figure 6C representing the validation by RT-qPCR of the RNA-seq after siSIRT1 and siPHF14.
- https://cdn.elifesciences.org/articles/53375/elife-53375-fig6-data1-v1.xlsx
Figure 6—figure supplement 1
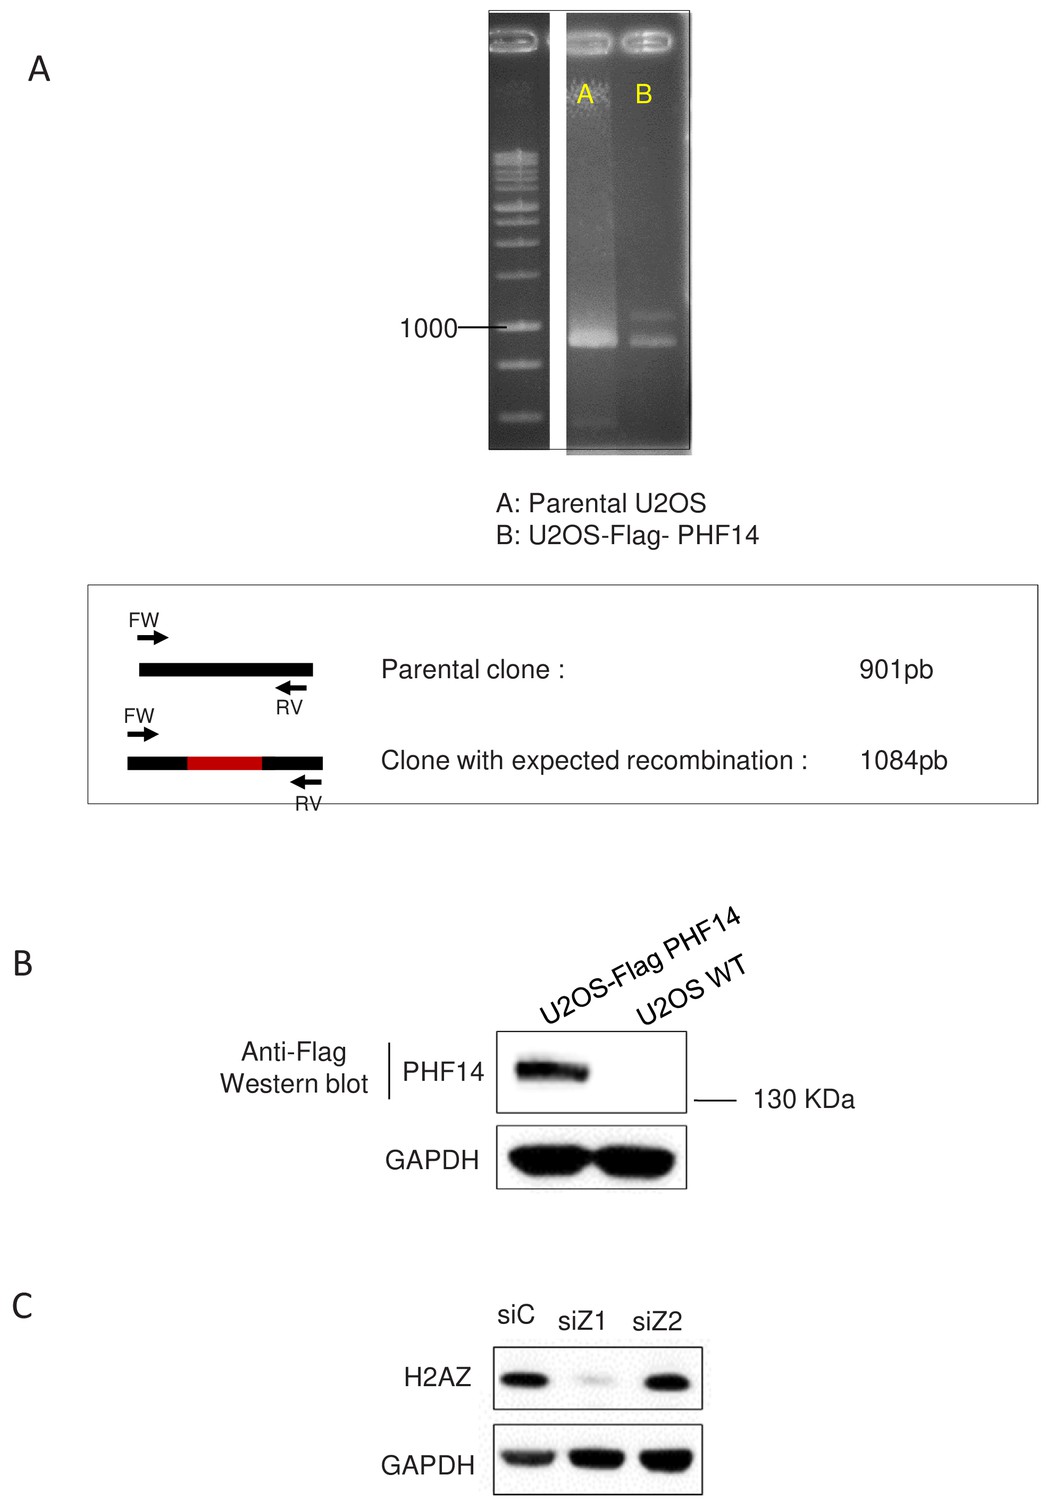
Characterisation of U2OS cells expressing 3xFlag-2xStrep tagged PHF14.
(A) Genomic DNA samples were subjected to a PCR reaction using primers located outside of the inserted sequence as shown in the scheme (Bottom). The top panels show an analysis on agarose gel of the PCR product obtained on a negative clone and on the genome-edited clone used in this study. Note the upper band which appeared in the genome-edited clone expressing Flag-PHF14, indicating recombination at one allele. The bands were excised and sequenced to check the accuracy of the recombination. (B) Total cell extracts from U2OS-Flag PHF14 cells or from parental U2OS cells were prepared and analysed by western blot using anti-Flag antibody. (C) H2A.Z western blot performed on total cell extracts in the experiment shown in Figure 6A.
Figure 6—figure supplement 2
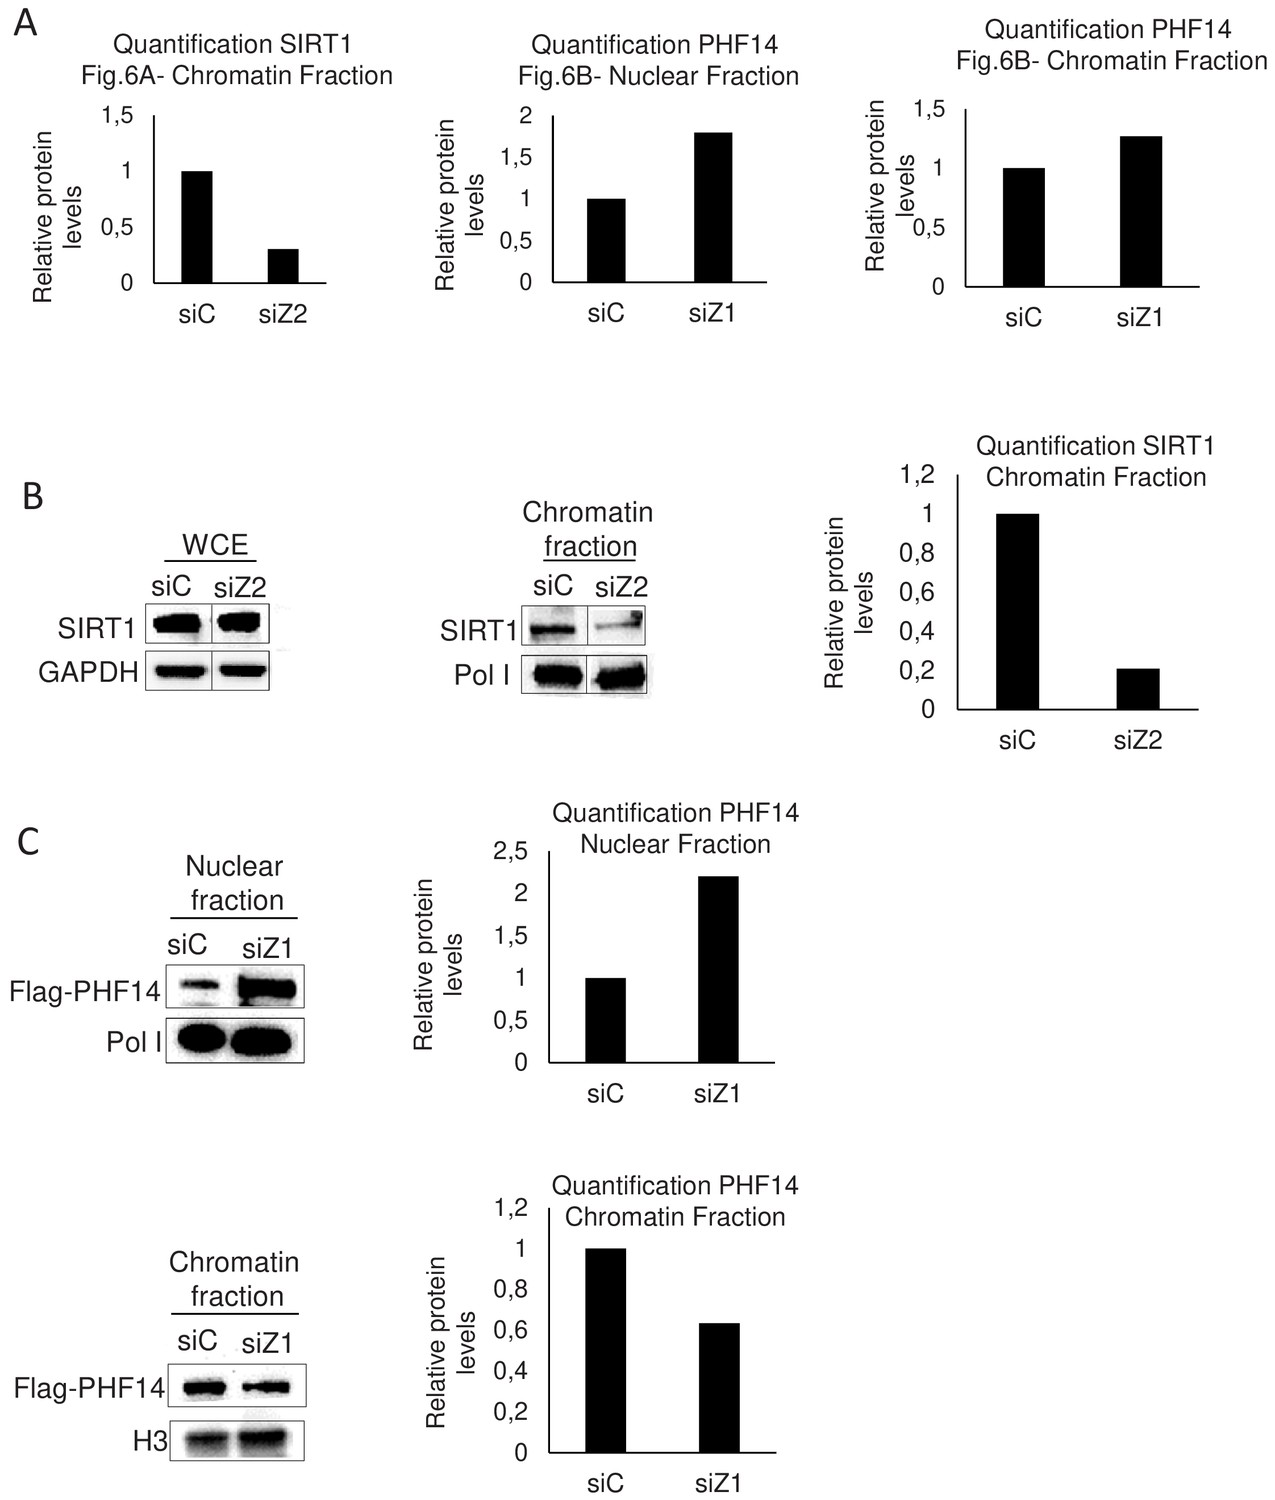
Quantification and replicate of Figure 6A and B experiments.
(A) The indicated bands from the experiment shown in Figure 6A and B were quantified using image J. (B) Replicate of Figure 6A experiments and its quantification. (C) Replicate of Figure 6B experiments and its quantification. Note the reproducible increase of PHF14 expression in the soluble nuclear fraction upon Z1 depletion, although no decrease of PHF14 expression in the chromatin fraction can be observed, which suggests that PHF14 expression is slightly induced upon H2A.Z.1 depletion. Since PHF14 mRNA expression levels do not change (data not shown), it perhaps reflects a slightly increased stability of PHF14 when H2A.Z.1 expression is depleted.
Figure 6—figure supplement 3

Validation of siRNAs targetting SIRT1 and PHF14.
(A) Validation of PHF14 and SIRT1 siRNA. Top: WI38 cells were transfected using siRNA against SIRT1 or PHF14. 72 hr later, total RNAs was prepared. The amount of SIRT1 and PHF14 mRNA was quantified by RT-qPCR, and was standardised using GAPDH mRNA levels and calculated relative to one in cells transfected using the control siRNA. The mean and SDOM from seven independent experiments are shown. Note that SIRT1 depletion seems to slightly favours PHF14 expression and vice-versa. Bottom: Total cell extracts from WI38 cells were also prepared and the depletion of SIRT1 protein was verified by western blot using specific antibody. Since commercial PHF14 antibody has poor quality in western blot, total cell extracts from U2OS Flag-PHF14 cells were used to perform western blot with anti-Flag antibody after siPHF14 transfection. (B) Effect on H2A.Z.1 and H2A.Z.2 expression. WI38 cells were transfected as in A. Levels of total H2A.Z protein were analysed by western blot. Total RNA was also prepared and the amount of the two isoforms levels was verified by RT-qPCR, standardised using GAPDH mRNA levels and calculated relative to one in cells transfected using the control siRNA. The mean and SDOM from three independent experiments are shown.
-
Figure 6—figure supplement 3—source data 1
Source Data of histogrammes on Figure 6—figure supplement 3A representing the efficiency of siRNA against SIRT1 and PHF14.
- https://cdn.elifesciences.org/articles/53375/elife-53375-fig6-figsupp3-data1-v1.xlsx
-
Figure 6—figure supplement 3—source data 2
Source Data of histogrammes on Figure 6—figure supplement 3B representing the effect of siSIRT1 and siPHF14 on H2A.Z.1 and H2A.Z.2 mRNAs.
- https://cdn.elifesciences.org/articles/53375/elife-53375-fig6-figsupp3-data2-v1.xlsx
Figure 7 with 1 supplement
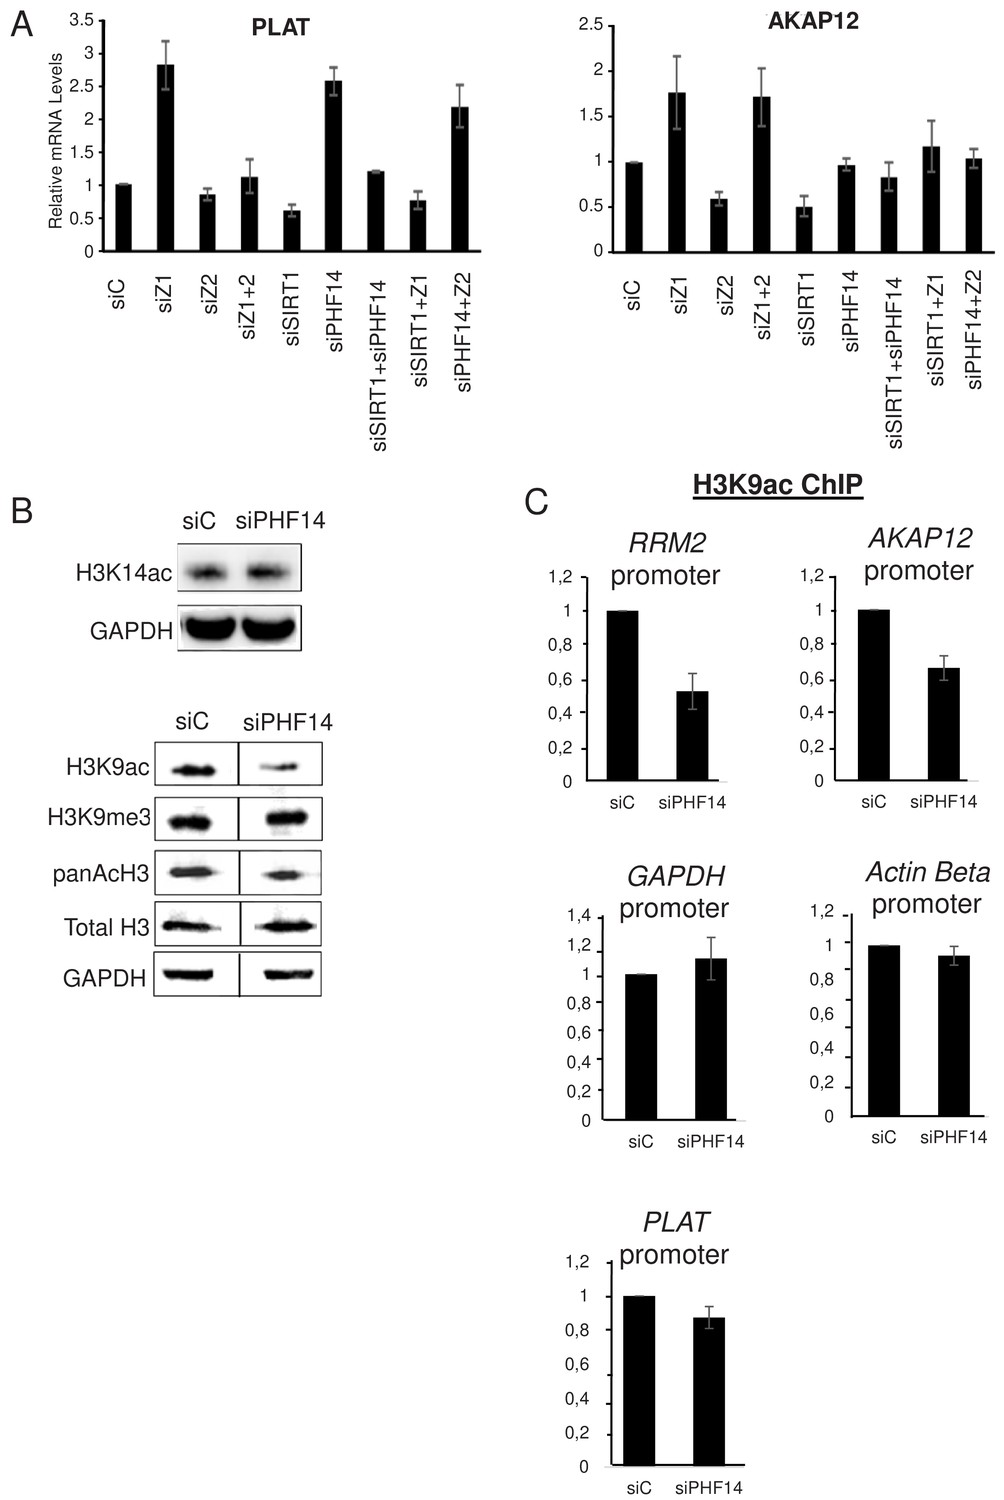
PHF14 and SIRT1 can mediate the antagonism between H2A.Z.1 and H2A.Z.2.
(A) WI38 cells were transfected with the indicated siRNAs alone or in combination. 72 hr later, total RNA was prepared and analysed by RT-qPCR to assess the expression of the indicated genes. Data was standardised using GAPDH mRNA levels and calculated relative to one for cells transfected with the control siRNA. The mean and SDOM from three independent experiments are shown. (B) WI38 cells were transfected with the indicated siRNA. 72 hr later, whole cell extracts were prepared and subjected to western blot analysis using the indicated antibody. A replicate is shown in Figure 7—figure supplement 1. (C) WI38 cells were transfected with the indicated siRNA. 72 hr later, transfected cells were subjected to a ChIP assay using antibodies directed against H3K9ac (left) or anti-H3 (right).Drosophilaor mouse spike-in chromatin was added after sonication as an internal control. The amount of the indicated human promoters was quantified by qPCR, standardised using the spike-in signal and calculated relative to one for control cells. The mean and SDOM from three independent experiments are shown. Legends to Supplementary Figures.
-
Figure 7—source data 1
Source Data of histogrammes in Figure 7C representing ChIP H3K9 after PHF14 depletion on different promoters.
- https://cdn.elifesciences.org/articles/53375/elife-53375-fig7-data1-v1.xlsx
Figure 7—figure supplement 1
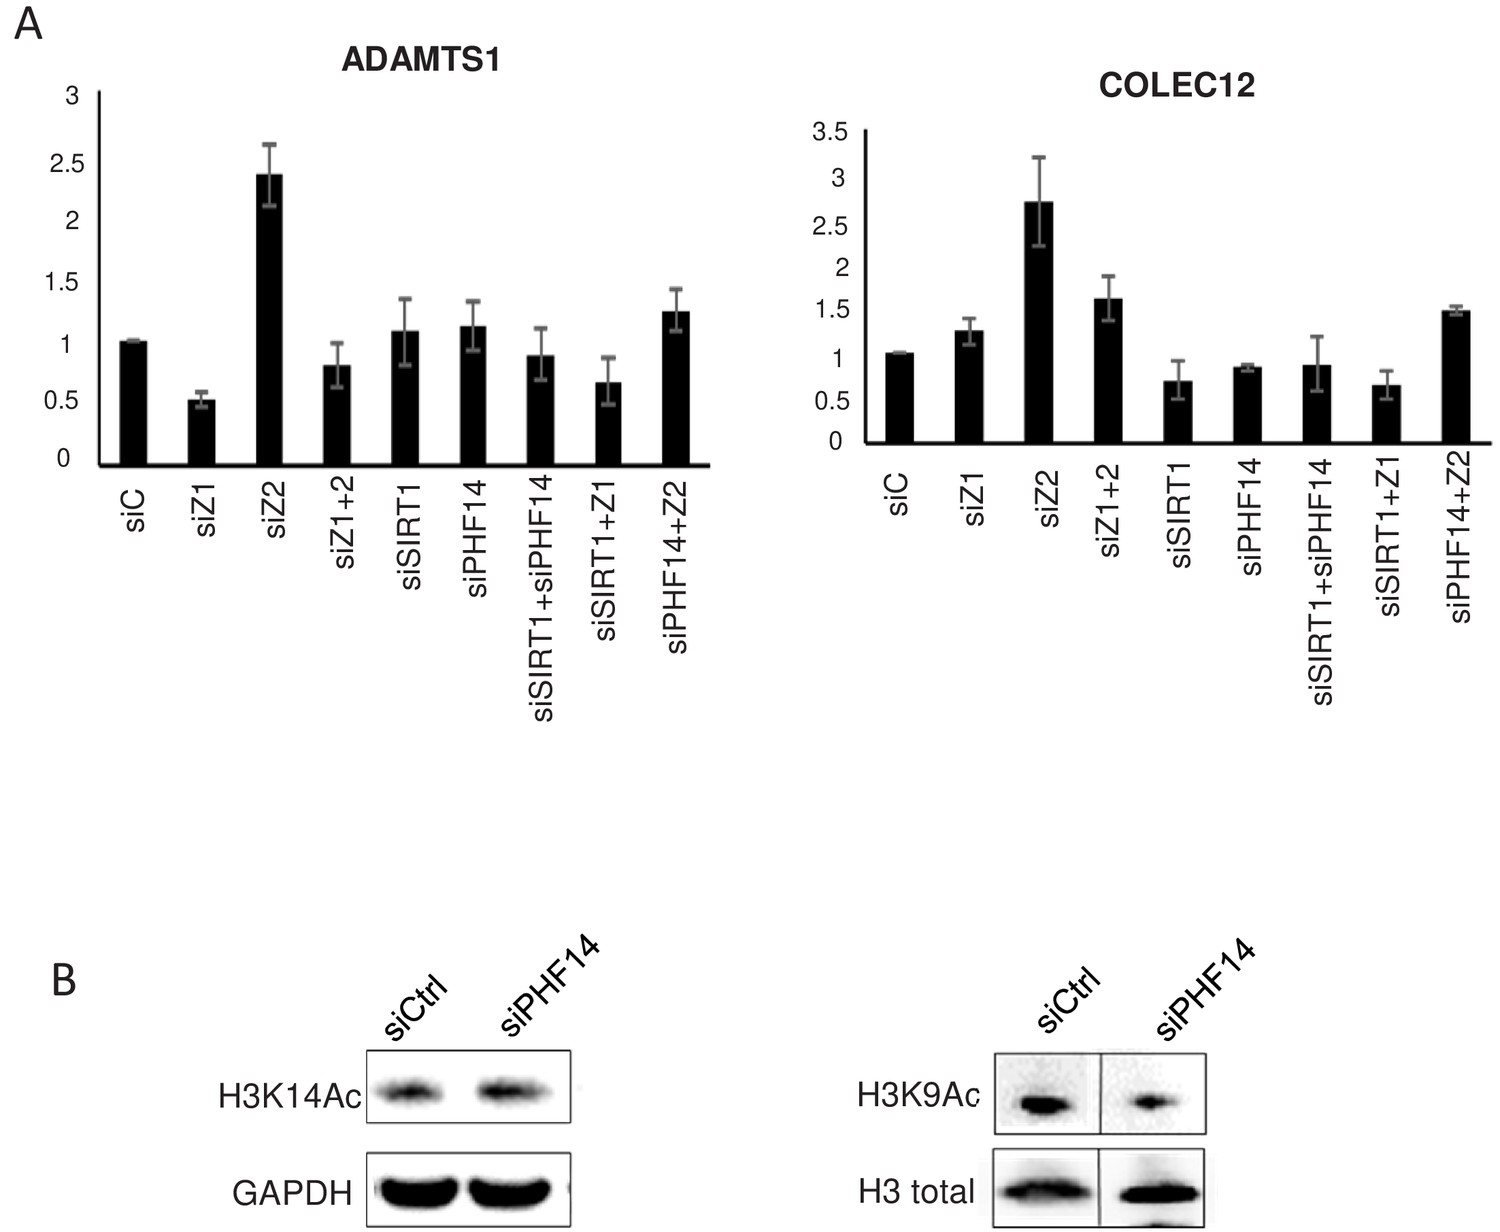
PHF14 mediates antagonistic effect of H2A.Z.1 and H2A.Z.2 on ADAMTS1 and COLEC12 mRNA expression.
(A) WI38 cells were transfected using the indicated siRNA alone or in combination. 72 hr later, total RNA was prepared and analysed by RT-qPCR to assess the expression of the indicated genes. Data were standardised using GAPDH mRNA levels and calculated relative to one in cells transfected using the control siRNA. The mean and SDOM from three independent experiments are shown. (B) Replicate of Figure 7B experiment. List of Supplementary Files.
-
Figure 7—figure supplement 1—source data 1
Source Data of histogrammes on Figure 7A and on Figure 7—figure supplement 1B showing that the antagonism between H2A.Z.1 and H2A.Z.2 is mediated by SIRT1 and PHF14.
- https://cdn.elifesciences.org/articles/53375/elife-53375-fig7-figsupp1-data1-v1.xlsx
Additional files
-
Supplementary file 1
Genes upregulated upon H2A.Z.1 depletion in WI38 cells.
- https://cdn.elifesciences.org/articles/53375/elife-53375-supp1-v1.xlsx
-
Supplementary file 2
Genes upregulated upon H2A.Z.2 depletion in WI38 Cells.
- https://cdn.elifesciences.org/articles/53375/elife-53375-supp2-v1.xlsx
-
Supplementary file 3
Genes down-regulated upon H2A.Z.1 depletion in WI38 cells.
- https://cdn.elifesciences.org/articles/53375/elife-53375-supp3-v1.xlsx
-
Supplementary file 4
Genes down-regulated upon H2A.Z.2 depletion in WI38 cells.
- https://cdn.elifesciences.org/articles/53375/elife-53375-supp4-v1.xlsx
-
Supplementary file 5
Genes regulated upon the combined depletion of H2A.Z.1 and H2A.Z.2 in WI38 cells.
- https://cdn.elifesciences.org/articles/53375/elife-53375-supp5-v1.xlsx
-
Supplementary file 6
Genes upregulated upon H2A.Z.1 depletion in U2OS cells.
- https://cdn.elifesciences.org/articles/53375/elife-53375-supp6-v1.xlsx
-
Supplementary file 7
Genes upregulated upon H2A.Z.2 depletion in U2OS Cells.
- https://cdn.elifesciences.org/articles/53375/elife-53375-supp7-v1.xlsx
-
Supplementary file 8
Genes down-regulated upon H2A.Z.1 depletion in U2OS cells.
- https://cdn.elifesciences.org/articles/53375/elife-53375-supp8-v1.xlsx
-
Supplementary file 9
Genes down-regulated upon H2A.Z.2 depletion in U2OS cells.
- https://cdn.elifesciences.org/articles/53375/elife-53375-supp9-v1.xlsx
-
Supplementary file 10
Genes regulated upon the combined depletion of H2A.Z.1 and H2A.Z.2 in U2OS cells.
- https://cdn.elifesciences.org/articles/53375/elife-53375-supp10-v1.xlsx
-
Supplementary file 11
Genes regulated upon PHF14 depletion in WI38 cells.
- https://cdn.elifesciences.org/articles/53375/elife-53375-supp11-v1.xlsx
-
Supplementary file 12
Genes regulated upon SIRT1 depletion in WI38 cells.
- https://cdn.elifesciences.org/articles/53375/elife-53375-supp12-v1.xlsx
-
Supplementary file 13
List of siRNA and primers.
- https://cdn.elifesciences.org/articles/53375/elife-53375-supp13-v1.xlsx
-
Transparent reporting form
- https://cdn.elifesciences.org/articles/53375/elife-53375-transrepform-v1.pdf
Download links
A two-part list of links to download the article, or parts of the article, in various formats.
Downloads (link to download the article as PDF)
Open citations (links to open the citations from this article in various online reference manager services)
Cite this article (links to download the citations from this article in formats compatible with various reference manager tools)
Integrated analysis of H2A.Z isoforms function reveals a complex interplay in gene regulation
eLife 9:e53375.
https://doi.org/10.7554/eLife.53375


