A branched heterochronic pathway directs juvenile-to-adult transition through two LIN-29 isoforms
- Friedrich Miescher Institute for Biomedical Research, Switzerland
- University of Basel, Switzerland
Figures
Figure 1
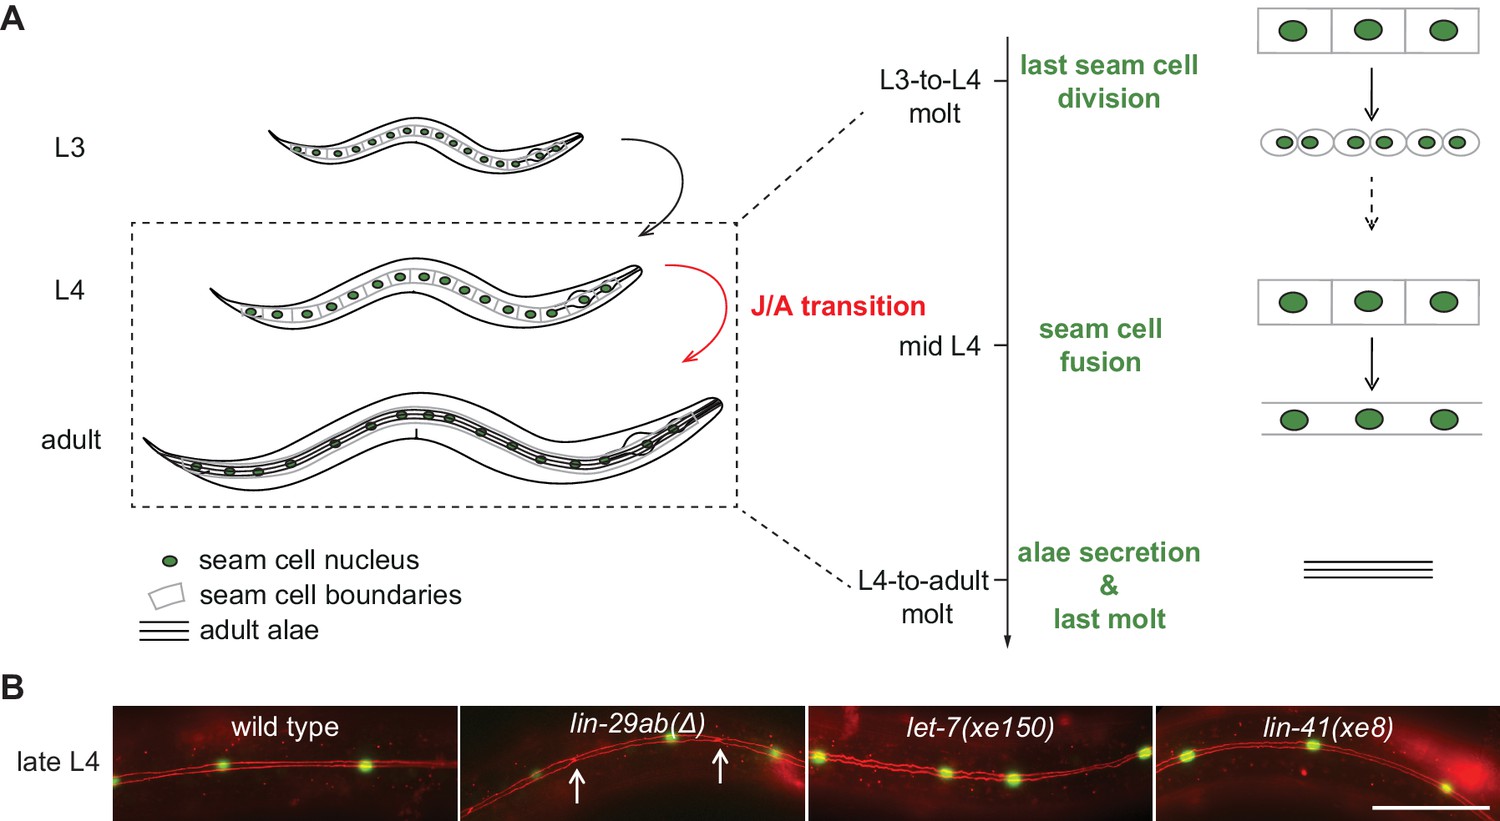
Uncoupling of coordinated execution of J/A transition events in let-7 and lin-41 mutant animals.
(A) Schematic representation of juvenile-to-adult (J/A) transition events in the C. elegans epidermis: final division of seam cells (square-shaped cells with green nuclei) at the L3-to-L4 molt; seam cell fusion into a syncytium during mid-L4 stage; synthesis of an adult cuticle containing lateral alae (three horizontal bars) at the L4-to-adult molt; and a subsequent exit from the molting cycle. (B) Micrographs of late L4-stage animals of indicated genotypes expressing scm::gfp (green, marking seam cells) and ajm-1::mCherry (red, marking hypodermal cell junctions). Arrows indicate cell boundaries between unfused cells. Representative of n > 20. Scale bar: 50 μm.
-
Figure 1—source data 1
Quantification of unfused seam cell junctions, raw data related to Figure 1B.
- https://cdn.elifesciences.org/articles/53387/elife-53387-fig1-data1-v1.xlsx
Figure 2
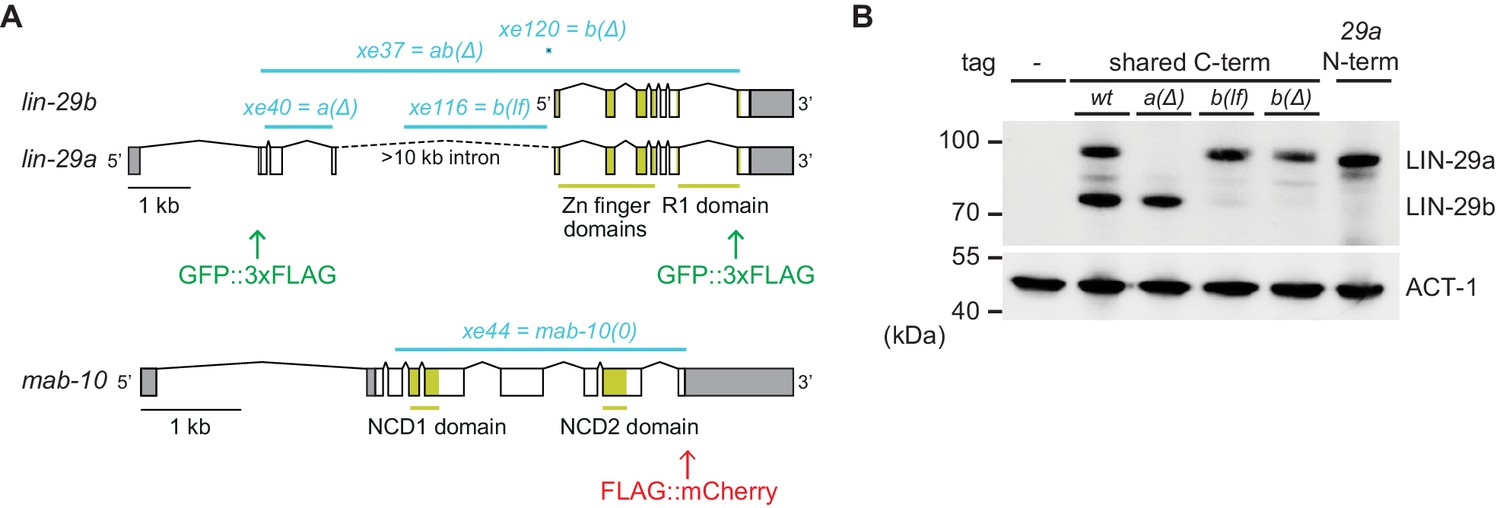
Generation of lin-29a and lin-29b isoform-specific mutants.
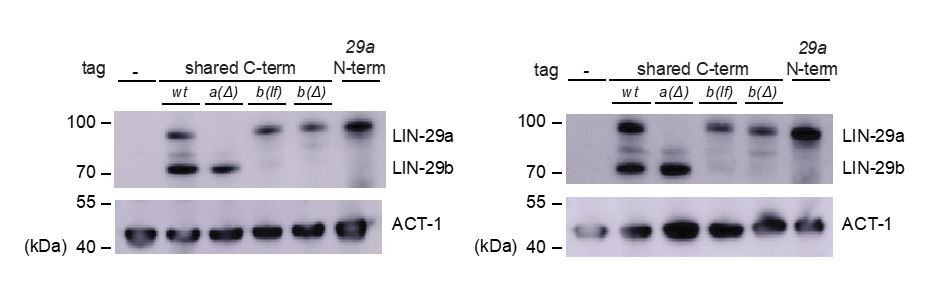
(A) Schematic representation of the lin-29 and mab-10 genomic regions. Mutant alleles and endogenously tagged alleles used in this study are indicated. Insertion of agfp::3xflag-encoding sequence at the 5' end specifically tags LIN-29a at its N-terminus, while insertion at the 3’ end tags both isoforms at the shared C-terminus. Insertion of this C-terminal tag in a lin-29(xe40[lin-29a(Δ)]) genetic background yields specific tagging of LIN-29b. Allele numbers refer to modifications in otherwise wild-type backgrounds; numbers for equivalent mutations in the endogenously tagged backgrounds, used for protein detection by microscopy and Western blotting, are provided in the Key resources table. (B) Western blot of C-terminally GFP::3xFLAG-tagged endogenous LIN-29a and LIN-29b proteins in the different mutant backgrounds using anti-FLAG antibody. Animals were grown for 36 hr at 25°C to the late L4 stage. Actin-1 is used as loading control.
Figure 3
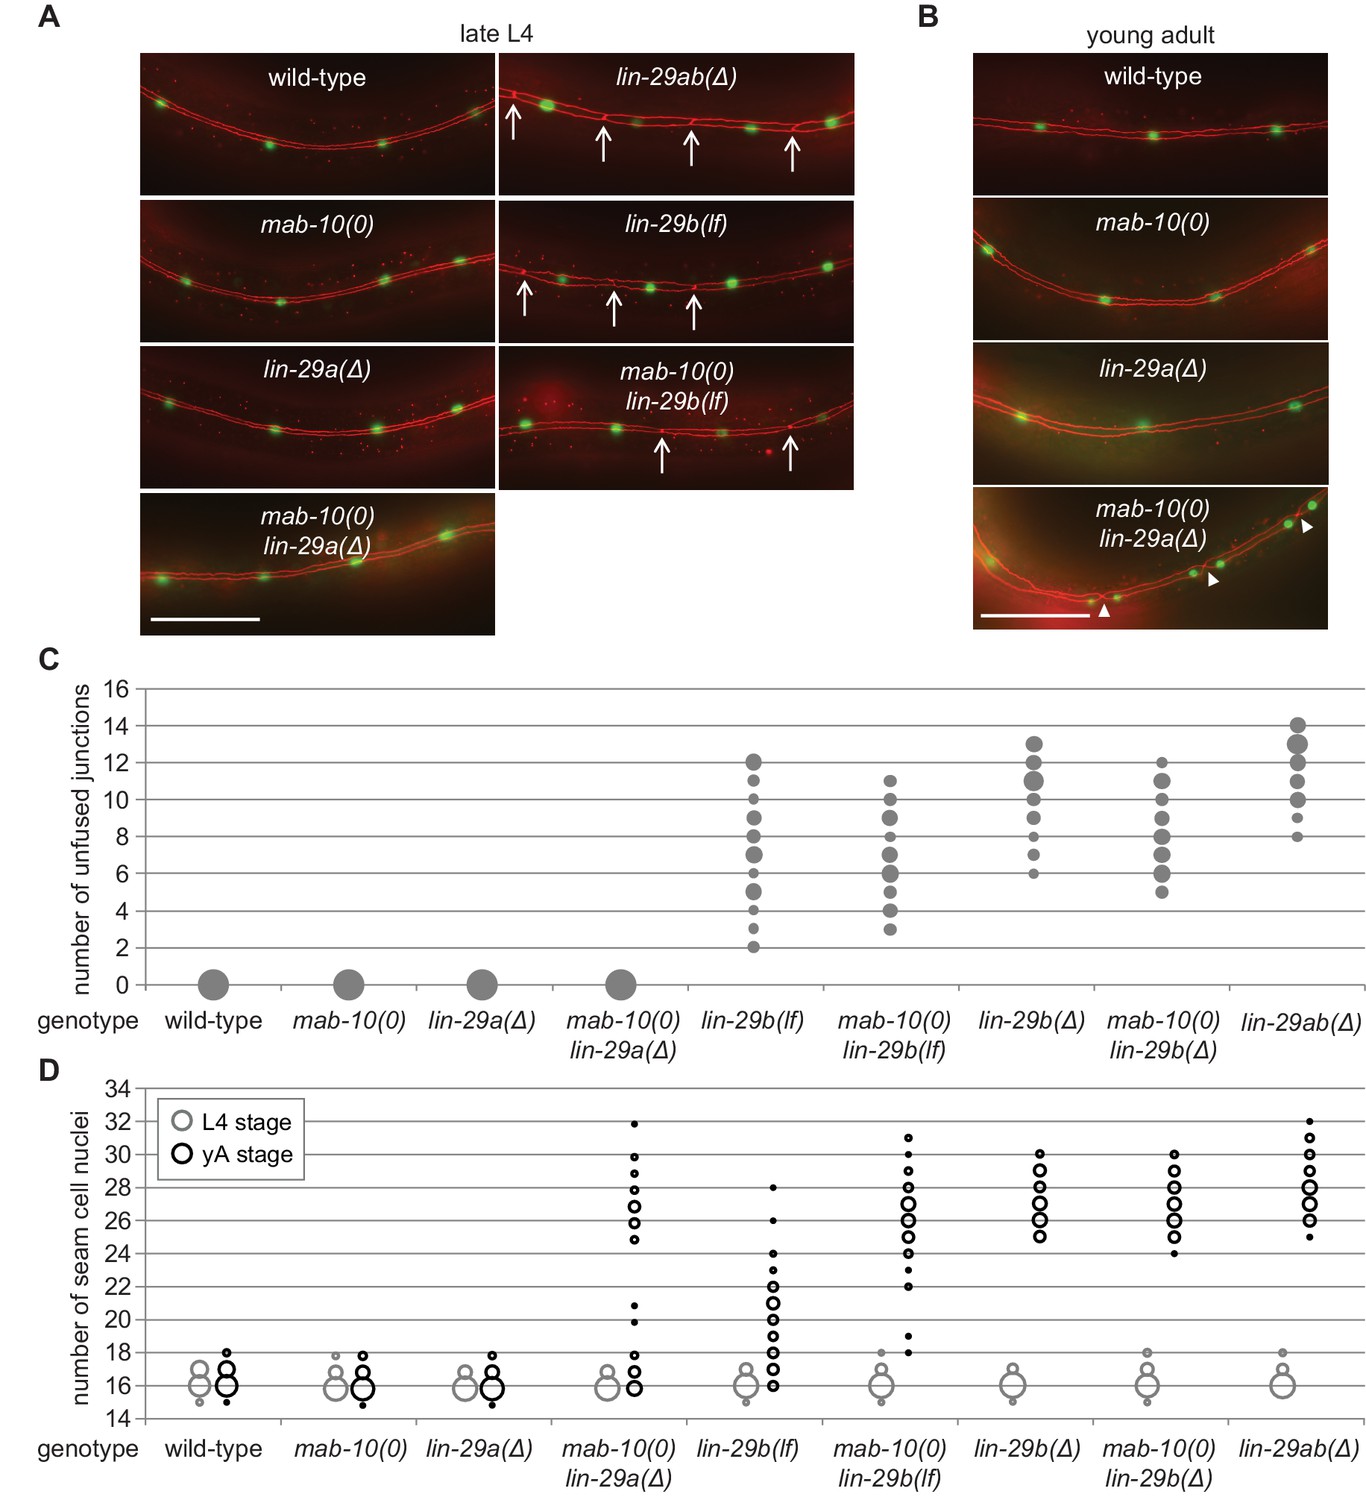
LIN-29b has a fundamental role in the regulation of early J/A transition events.
(A–B) Micrographs of late L4 stage (A) and young adult (B) animals of indicated genotype expressing scm::gfp (green, marking seam cells) and ajm-1::mCherry (red, marking seam cell boundaries). Arrows indicate cell boundaries between unfused seam cells, arrowheads indicate newly formed seam cell boundaries. Scale bars: 50 μm. (C) Quantification of unfused seam cell junctions inL4 larval stage animals of the indicated genetic backgrounds. Areas of bubbles represent the percentage of worms with the respective number of unfused junctions (n > 20 for each genotype). (D) Quantification of seam cell numbers in L4 larval stage and young adult (yA) animals of the indicated genetic backgrounds. Areas of bubbles represent the percentage of worms with the respective number of seam cells (n = 20 for L4, n > 50 for yA worms per genotype).
-
Figure 3—source data 1
Quantification of unfused seam cell junctions, raw data related to Figure 3C.
- https://cdn.elifesciences.org/articles/53387/elife-53387-fig3-data1-v1.xlsx
-
Figure 3—source data 2
Quantification of unfused seam cell junctions, raw data related to Figure 3B.
- https://cdn.elifesciences.org/articles/53387/elife-53387-fig3-data2-v1.xlsx
-
Figure 3—source data 3
Quantification of seam cell numbers, raw data related to Figure 3D.
- https://cdn.elifesciences.org/articles/53387/elife-53387-fig3-data3-v1.xlsx
Figure 4
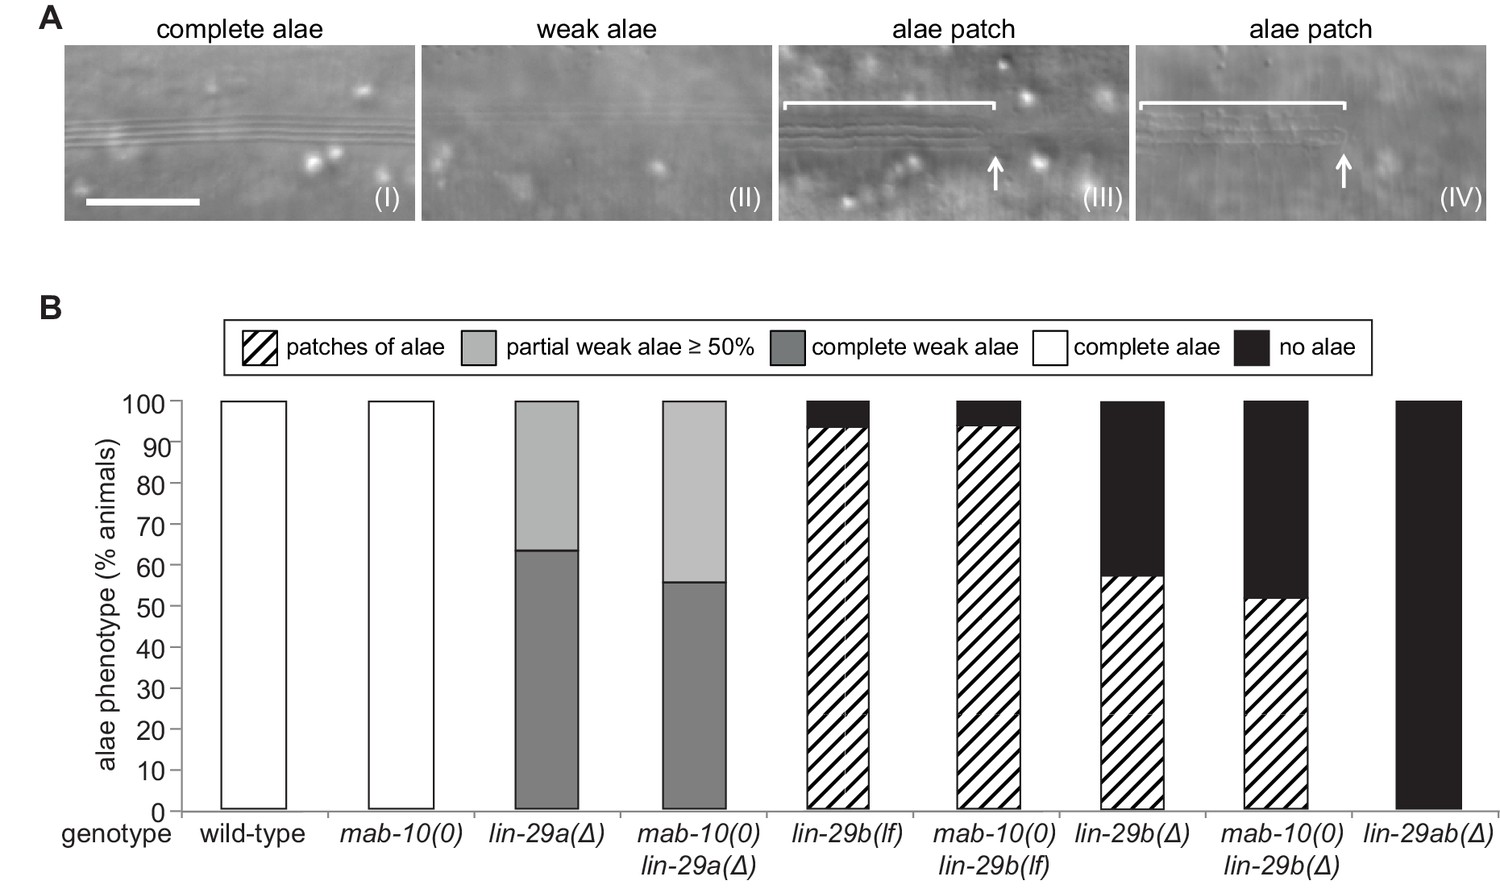
LIN-29a and LIN-29b, but not MAB-10, are required for wild-type alae formation.
(A) Micrographs illustrating categories of alae structures observed on the cuticle of wild-type (I) and mutant (II – IV) young adult animals. The example pictures show (I) wild-type N2, (II) mab-10(0) lin-29a(Δ), (III) mab-10(0) lin-29b(lf) and (IV) mab-10(0) lin-29b(Δ) animals, respectively. Scale bar: 10 μm. (B) Quantification of different alae structures in young adult worms of indicated genotypes (n > 30).
-
Figure 4—source data 1
Quantification of alae structures, raw data related to Figure 4B.
- https://cdn.elifesciences.org/articles/53387/elife-53387-fig4-data1-v1.xlsx
Figure 5
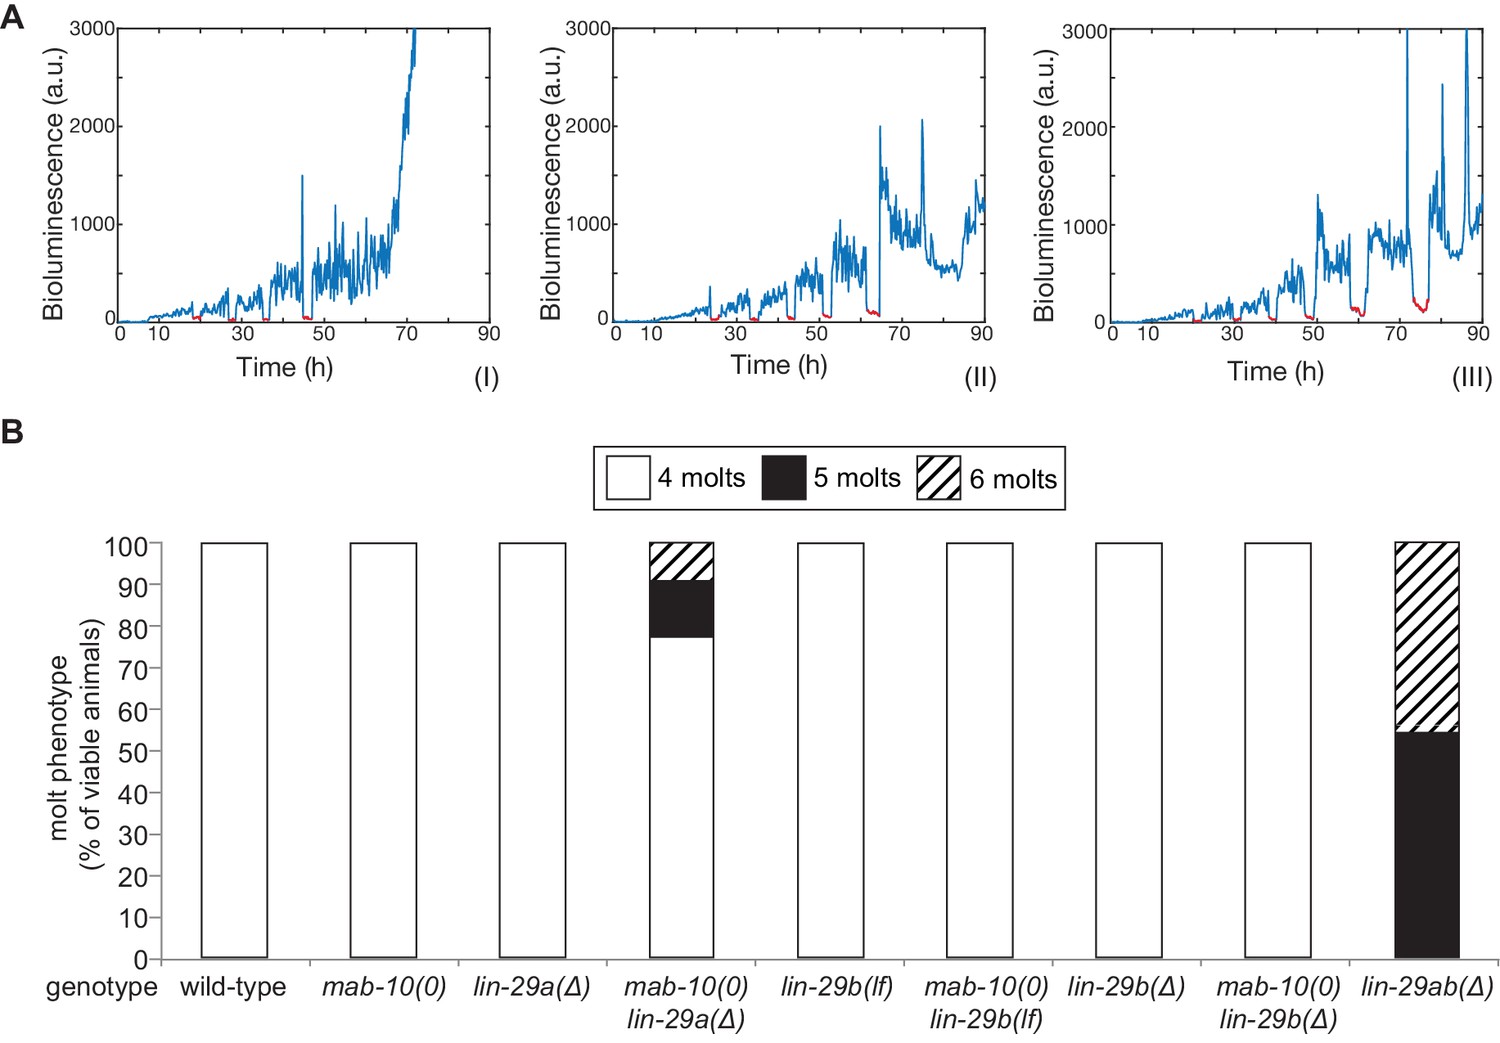
The molting cycle is regulated by both LIN-29 isoforms.
(A) Examples of luciferase assay traces revealing four (I), five (II) or six (III) molts through a drop in luciferase signal (red segment). Examples are from wild-type (I) and lin-29ab(Δ) (II-III). (B) Quantification of the number of molts in animals of the indicated genotypes (n > 20) based on the assay shown in (A). A fraction of mab-10(0) lin-29a(∆) , lin-29b(∆) and mab-10(0) lin-29b(∆) animals die at the J/A transition ; these animals were censored and not included in the quantification.
-
Figure 5—source data 1
Quantification of number of molts, raw data related to Figure 5B.
- https://cdn.elifesciences.org/articles/53387/elife-53387-fig5-data1-v1.xlsx
Figure 6 with 2 supplements
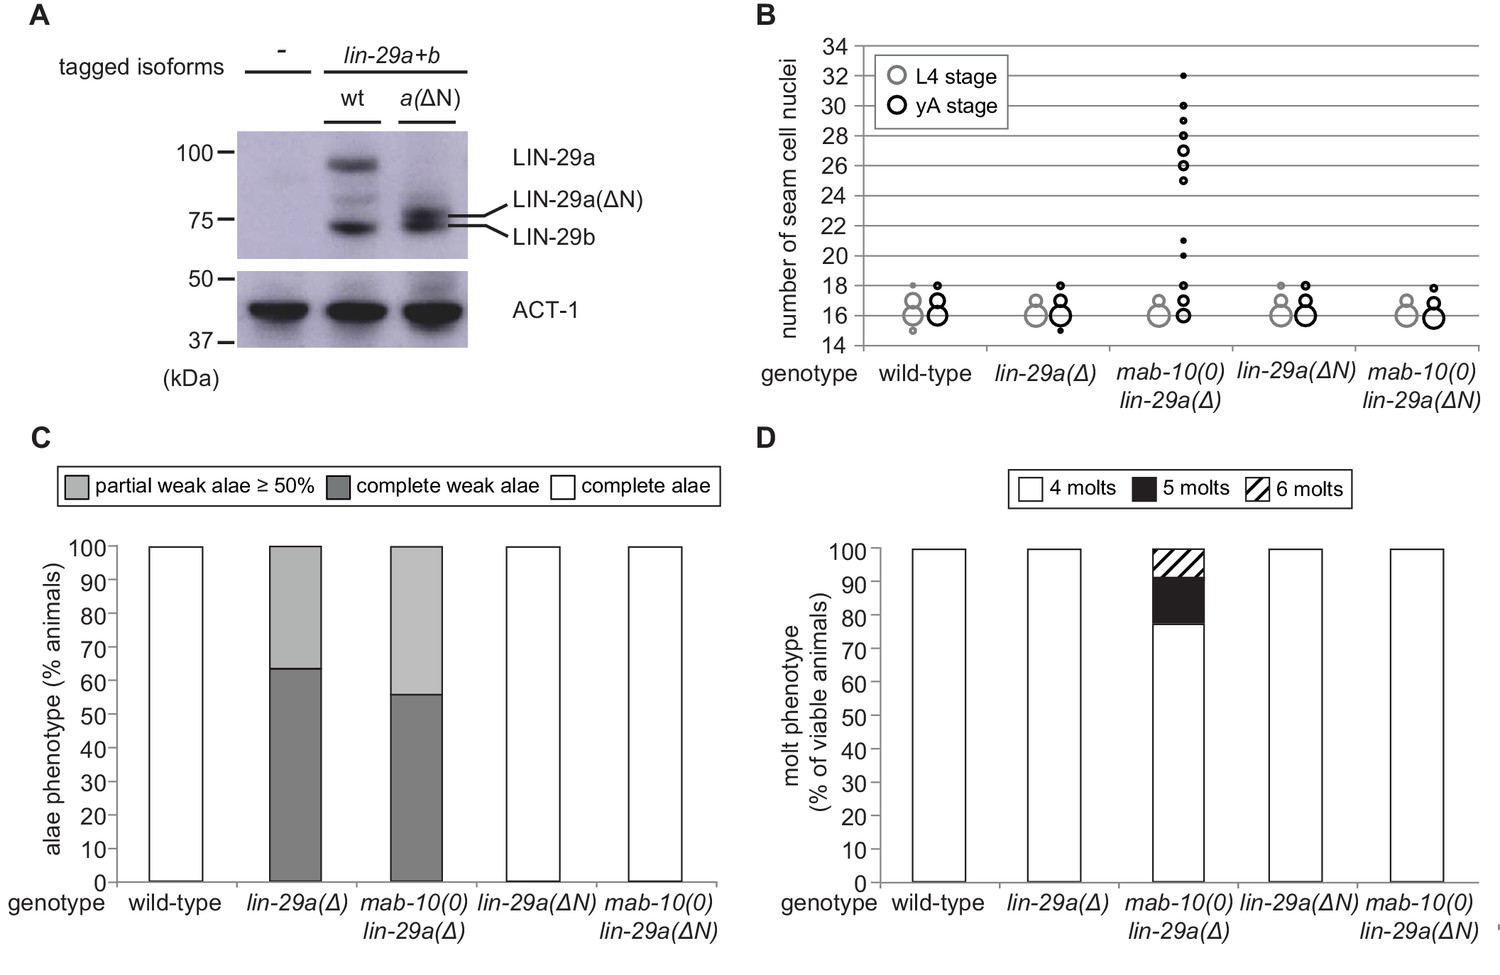
The LIN-29a-specific domain is dispensable for the execution of the J/A transition.
(A) Western blot of endogenous C-terminally GFP::3xFLAG-tagged LIN-29a and LIN-29b proteins in the lin-29a(ΔN) background (HW2408) using an anti-FLAG antibody. Actin-1 is used as loading control. (B) Seam cell number quantification in L4 larval stage and young adult (yA) animals of the indicated genetic backgrounds (n > 25 for L4, n > 25 for yA worms per genotype). The data for lin-29a(Δ) and mab-10(0) lin-29a(Δ) is re-plotted from Figure 2 for comparison. (C) Quantification of different alae structures in young adult worms of indicated genotypes (n > 20). The data for lin-29a(Δ) and mab-10(0) lin-29a(Δ) is re-plotted from Figure 3 for comparison. (D) Quantification of the number of molts for animals of indicated genotypes (n > 20). The data for lin-29a(Δ) and mab-10(0) lin-29a(Δ) is re-plotted from Figure 3 for comparison. In (B – D), lin-29(∆N) is lin-29(xe200).
-
Figure 6—source data 1
Quantification of seam cell numbers, raw data related to Figure 6B.
- https://cdn.elifesciences.org/articles/53387/elife-53387-fig6-data1-v1.xlsx
-
Figure 6—source data 2
Quantification of alae structures, raw data related to Figure 6C.
- https://cdn.elifesciences.org/articles/53387/elife-53387-fig6-data2-v1.xlsx
-
Figure 6—source data 3
Quantification of number of molts, raw data related to Figure 6D.
- https://cdn.elifesciences.org/articles/53387/elife-53387-fig6-data3-v1.xlsx
Figure 6—figure supplement 1
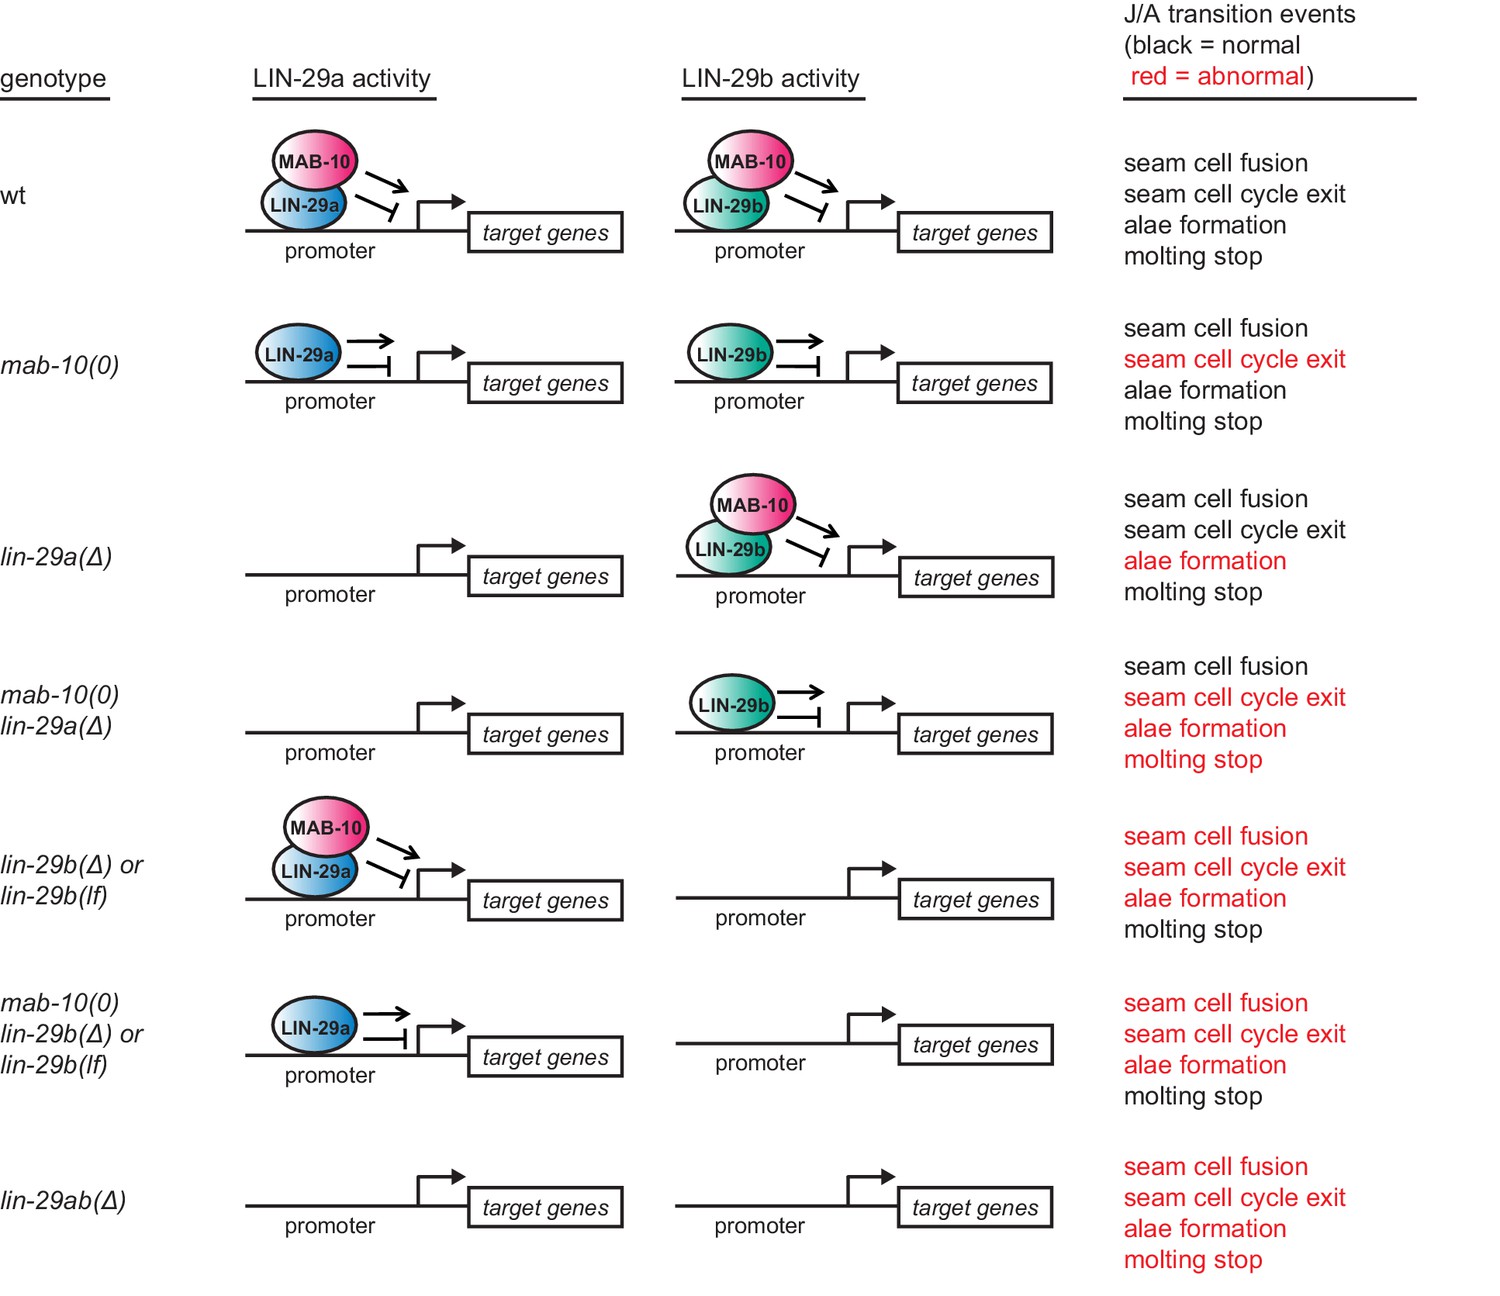
Summary of the J/A transition phenotypes seen for different permutations of lin-29a, lin-29b, and mab-10 mutations.
Note that extra seam cell divisions in mab-10(0) mutant animals occur only in older adults. Some older mab-10 mutant adults may also undergo extra molts (Harris and Horvitz, 2011), although we did not observe this.
Figure 6—figure supplement 2
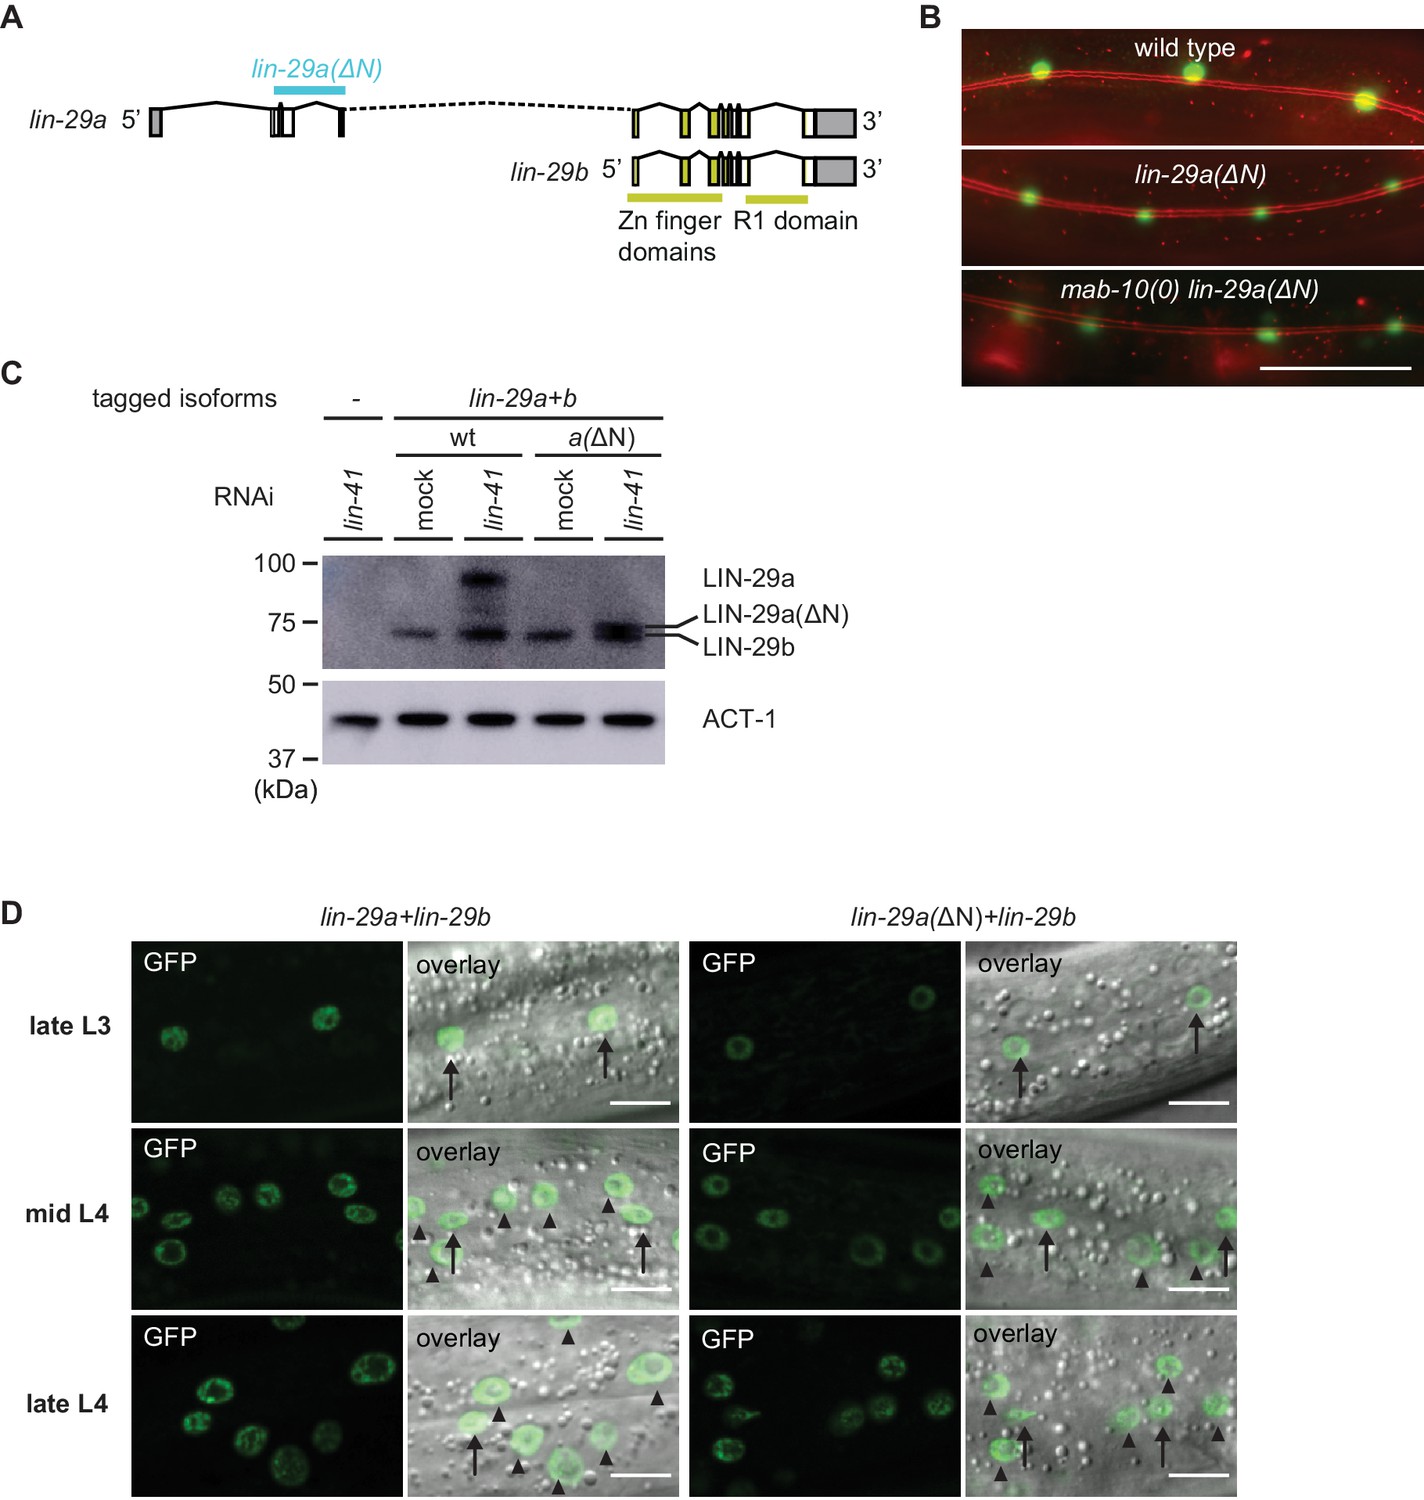
Characterization of lin-29a(∆N) expression and function.
(A) Schematic representation of the lin-29a(ΔN) deletion. (B) Micrographs of late L4-stage animals of indicated genotypes expressing scm::gfp (green, marking seam cells) and ajm-1::mCherry (red, marking hypodermal cell junctions). In both lin-29a(xe200[lin-29a(ΔN)]) and mab-10(0) lin-29a(xe200) animals, fusion occurs normally. Scale bar: 50 μm. (C) Western blot of C-terminally GFP::3xFLAG-tagged endogenous LIN-29a and LIN-29b proteins in a wild-type and the lin-29a(ΔN) background (HW2408), respectively, using anti-FLAG antibody. Animals were grown for 20 hr at 25°C to the L3 stage on mock RNAi and lin-41 RNAi bacteria, respectively. Both LIN-29a and LIN-29a(∆N) accumulate upon knock-down of lin-41. Actin-1 is used as a loading control. (D) Confocal images of endogenously tagged LIN-29 protein isoforms in the wild type and lin-29a(ΔN) background (HW2408) in the epidermis of animals at the indicated developmental stages. Animals were staged by examination of gonad development. Arrows indicate seam cell, arrowheads hyp7 nuclei. Scale bars: 10 μm.
-
Figure 6—figure supplement 2—source data 1
Quantification of unfused seam cell junctions, raw data related to Figure 6—figure supplement 2B.
- https://cdn.elifesciences.org/articles/53387/elife-53387-fig6-figsupp2-data1-v1.xlsx
Figure 7 with 1 supplement
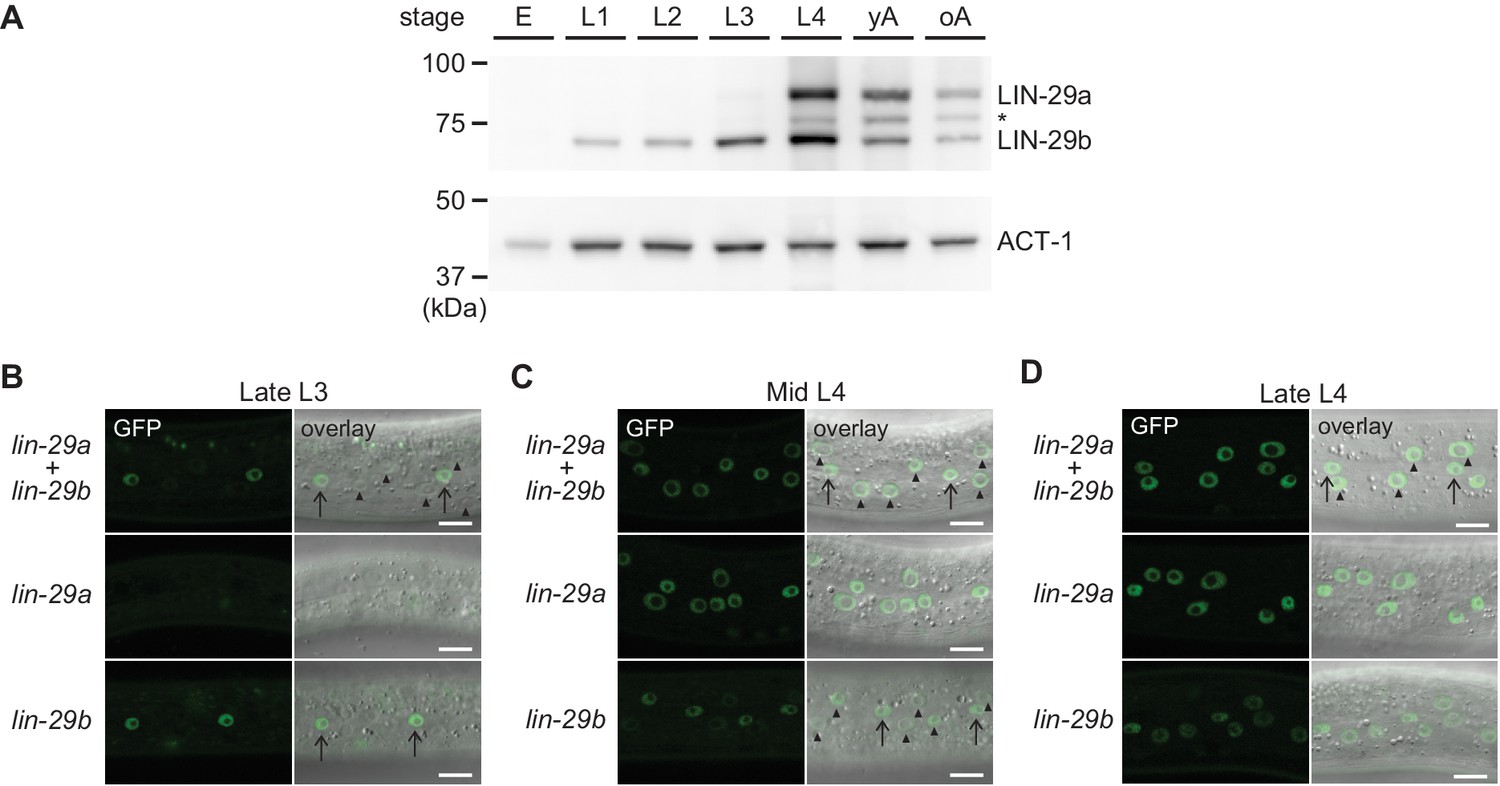
Spatial and temporal expression pattern of LIN-29a and LIN-29b.
(A) Western blot of C-terminally GFP::3xFLAG-tagged endogenous LIN-29a and LIN-29b proteins in different developmental stages using an anti-FLAG antibody. Actin-1 is used as a loading control. The asterisk indicates a band of unclear origin. (B–D) Confocal images of endogenously tagged LIN-29 isoforms in the epidermis of animals at the indicated developmental stages, which were confirmed by examination of gonad development. Arrows indicate seam cell, arrowheads hyp7 nuclei. Scale bars: 10 μm.
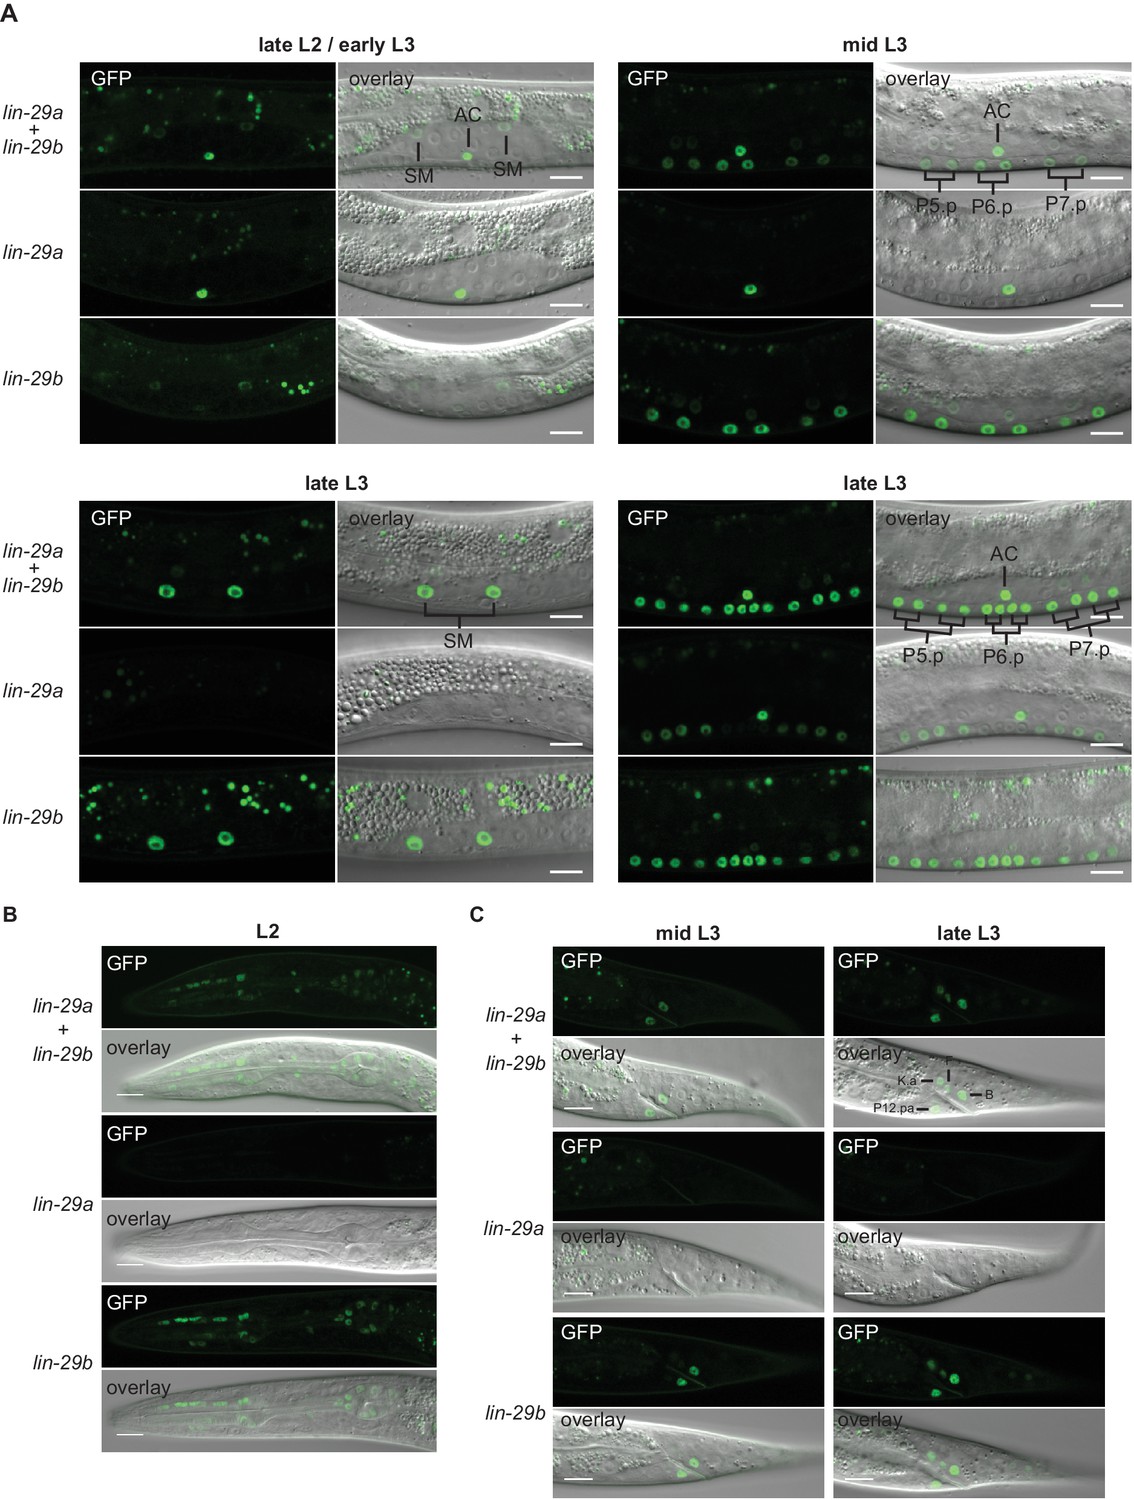
Figure 7—figure supplement 1
Expression of lin-29 isoforms.
(A) Confocal images of endogenously tagged LIN-29 protein isoforms in the region of the vulva and the uterus at the indicated developmental stages. At the L2-to-L3 molt (A), lin-29a is expressed in the anchor cell (AC), while lin-29b is weakly expressed in the sex myoblasts (SMs). In mid-L3 stage worms, the six daughters of the VPCs P5.p-P7.p express lin-29b. At the late L3 stage, lin-29b is strongly expressed in the sex myoblast (SM) daughters and all 12 granddaughters of the VPCs P5.p-P7.p, while LIN-29a specifically accumulates in the granddaughters of P5.p and P7.p, but not in those of P6.p. Scale bars: 10 μm. (B) Confocal images of endogenously tagged LIN-29 protein isoforms in the pharynx of L2 stage animals at the indicated developmental stages. lin-29b is expressed in the pharynx throughout larval and adult development. Scale bars: 10 μm. (C) Confocal images of endogenously tagged LIN-29 protein isoforms in the tail region at the indicated developmental stages. LIN-29b first accumulates in the two rectal cells B and P12.pa, before accumulating in the four additional rectal cells F, K.a, K’ and U (the latter two are not visible in this focal plane). LIN-29a is not detected in these cells. Scale bars: 10 μm.
Figure 8
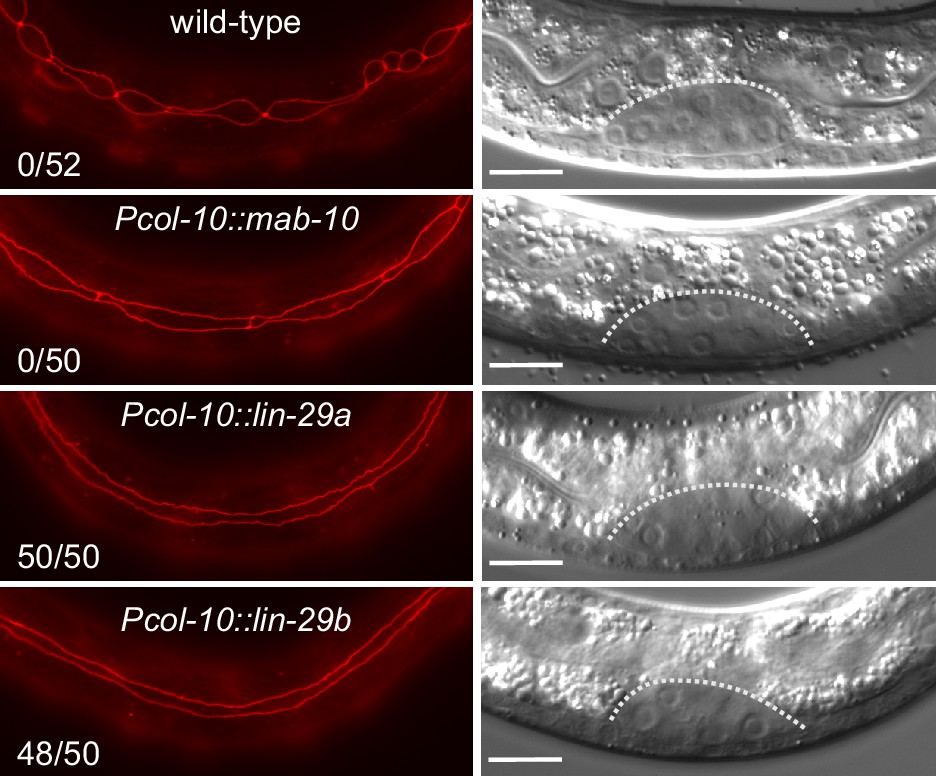
Precocious LIN-29 accumulation is sufficient for seam cell fusion in early L2 worms.
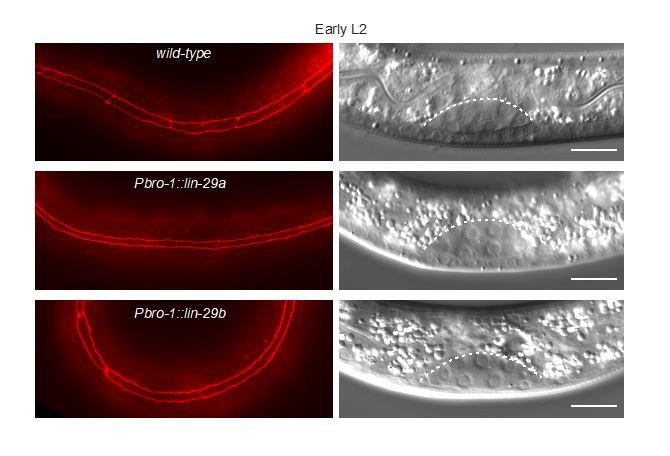
Micrographs of early L2 animals expressing ajm-1::mCherry (red, marking hypodermal cell junctions) and the indicated transgenes (‘wild-type’: no transgene). Animal stage was confirmed by gonad morphology as shown in the DIC pictures. Numbers indicate fractions of animals with complete precocious seam cells fusion. Scale bars: 10 μm.
Figure 9 with 2 supplements
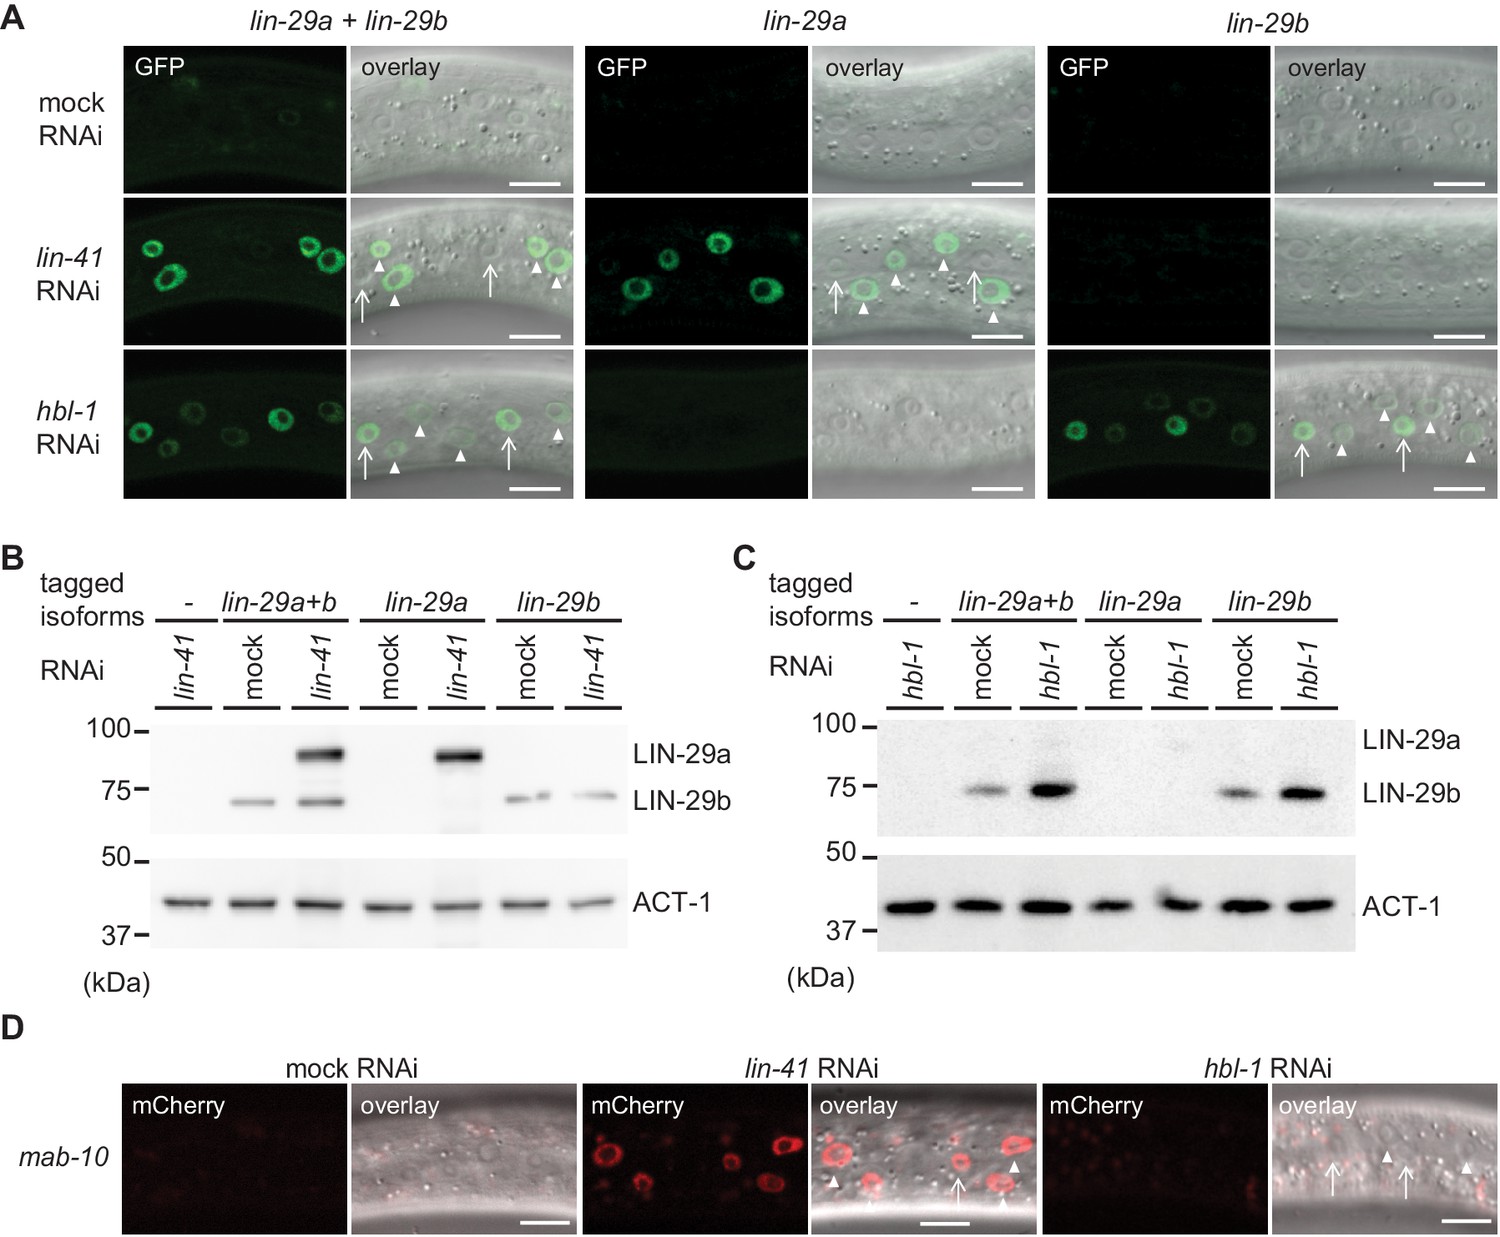
lin-29a and lin-29b expression are specifically regulated by LIN41 and HBL-1, respectively.
(A) Confocal images of endogenously tagged LIN-29 protein isoforms in the epidermis (strains HW1822, HW1826, HW1835). Animals were grown at 25°C for 20 hr to the early L3 stage on RNAi bacteria as indicated. Arrows indicate seam cell, arrowheads hyp7 nuclei. Scale bars: 10 μm. (B–C) Western blot of GFP::3xFLAG-tagged endogenous LIN-29a and LIN-29b proteins using an anti-FLAG antibody. Actin-1 is used as a loading control. Animals were grown for 20 hr at 25°C to the early L3 stage on RNAi bacteria as indicated. (D) Confocal images of endogenously tagged MAB-10 protein in the epidermis. Animals were grown at 25°C for 20 hr on lin-41, hbl-1 or mock RNAi bacteria. Arrowheads indicate hyp7 cells, arrows seam cells. Scale bars: 10 μm.
Figure 9—figure supplement 1

Expression of lin-29a on lin-41 RNAi over time.
(A–B) Confocal images of endogenously tagged LIN-29 protein isoforms in the epidermis (strains HW1822, HW1826, HW1835). Animals were grown at 25°C for 20 hr (A) or 22 hr (B) to the early L3 stage on RNAi bacteria as indicated. Arrows indicate seam cell, arrowheads hyp7 nuclei. Scale bars: 10 μm.
Figure 9—figure supplement 2

mRNA levels of lin-29b in worms grown on lin-41 and hbl-1 RNAi over time.
RT-qPCR analysis to measure the -∆∆Ct of lin-29b mRNA levels (normalized by act-1 mRNA levels) over time. Wild-type animals exposed to lin-41 and hbl-1 RNAi compared to mock RNAi.
Figure 10 with 1 supplement

LIN-28 coordinates both lin-29a and lin-29b regulation.
(A) Confocal images of endogenously tagged LIN-29 protein isoforms in wild-type or lin-28(n719) background in the epidermis (strains HW1822, HW1826, HW1835, HW1924, HW1925, HW1926). Animals were grown at 25°C for 20 hr (control strains) and 22 hr (lin-28(n719) strains) to reach an equivalent early L3 developmental stage. Arrows indicate seam cell, arrowheads hyp7 nuclei. Scale bars: 10 μm. (B) RT-qPCR analysis to measure the -∆∆Ct of lin-29a mRNA levels in wild-type and lin-28(n719) mutant background (normalized by act-1 mRNA levels) over time. (C) RT-qPCR analysis to measure the -∆∆Ct of lin-29b mRNA levels in wild-type and lin-28(n719) mutant background (normalized by act-1 mRNA levels) over time.
Figure 10—figure supplement 1
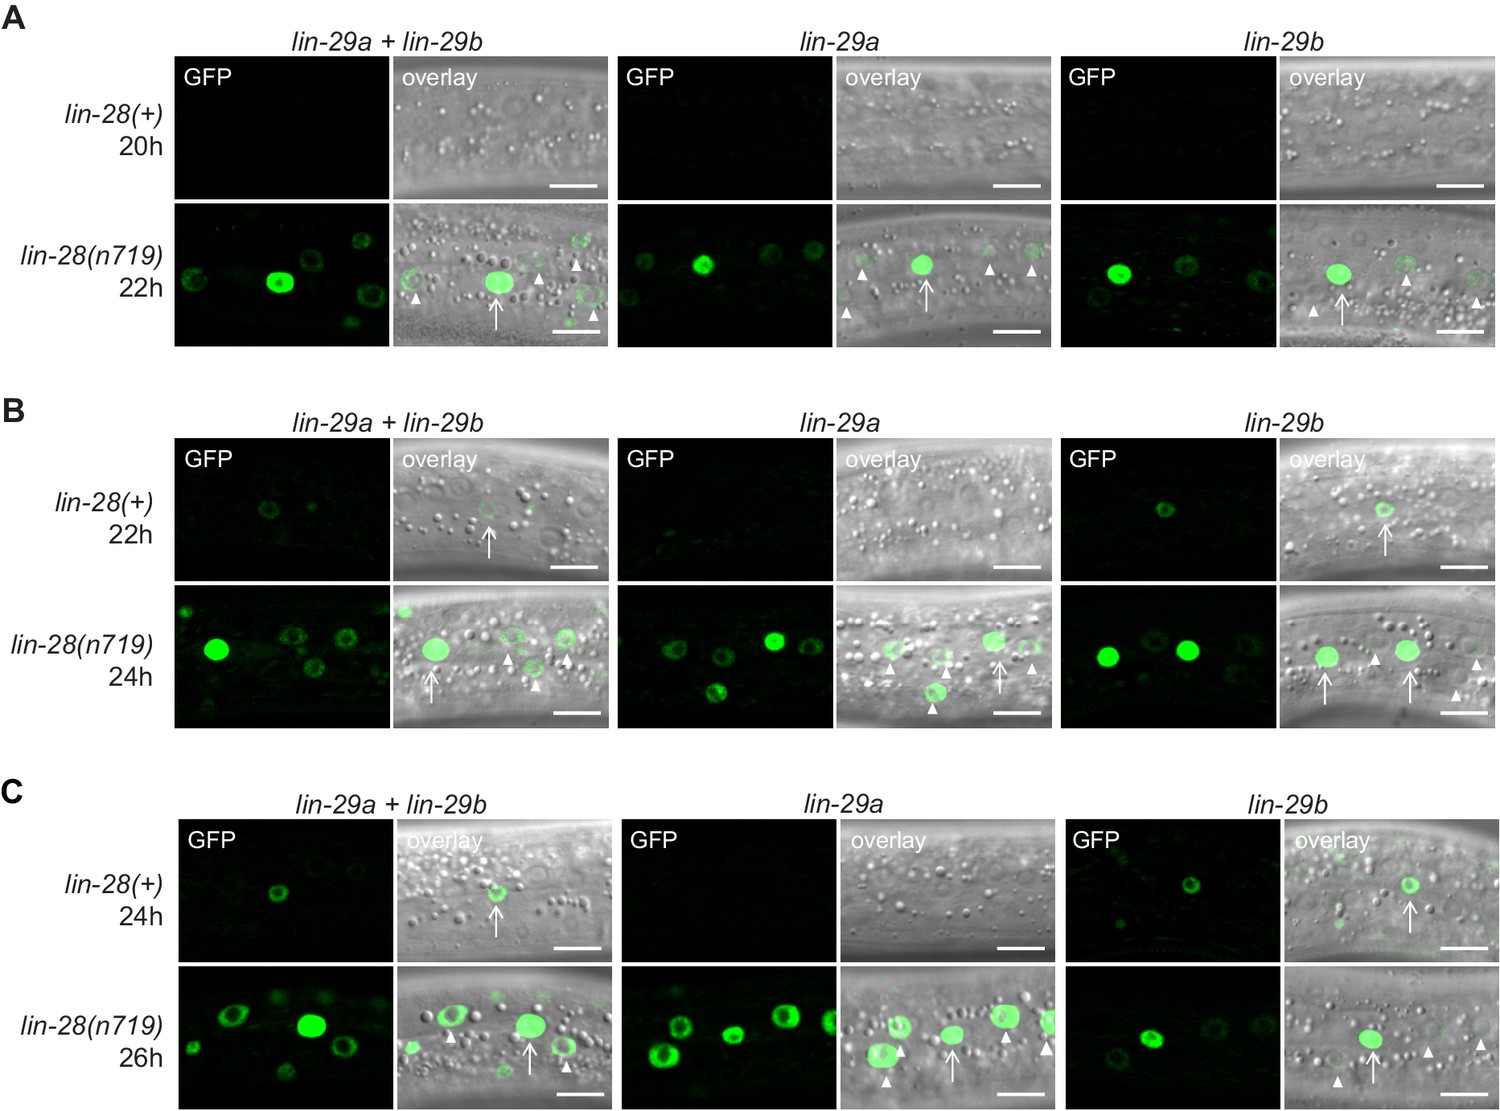
Expression of lin-29a and lin-29b in wild-type and lin-28 mutant animals over time.
(A–C) Confocal images of endogenously tagged LIN-29 protein isoforms in wild-type (lin-28(+)) or lin-28(n719) background in the epidermis (strains HW1822, HW1826, HW1835, HW1924, HW1925, HW1926). Animals were grown at 25°C for 20 hr, 22 hr and 24 hr (A, B, and C, resp., for control strains) and 22 hr, 24 hr and 26 hr (A, B, and C, resp., for lin-28(n719) strains) to reach an equivalent developmental stage. Arrows indicate seam cell, arrowheads hyp7 nuclei. Scale bars: 10 μm.
Figure 11
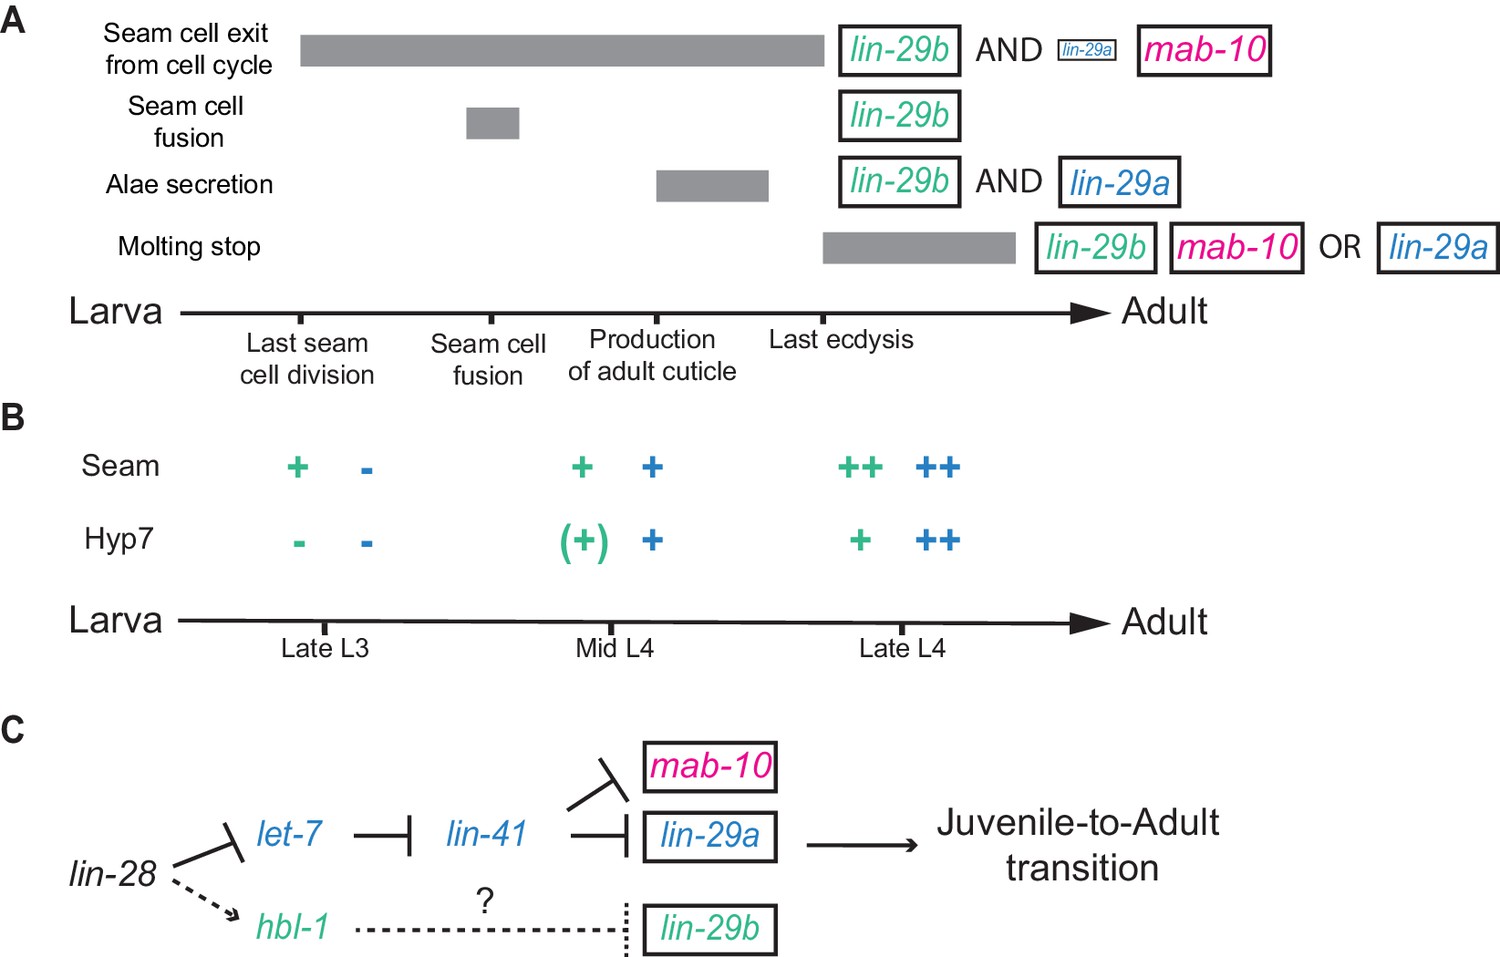
Summary.
(A) Illustration of the contributions of LIN-29 isoforms and the co-factor MAB-10 to the different J/A transition events. The arrow represents developmental time with relevant events indicated. Filled boxes indicate the duration of a specific J/A transition event. The exact time point when seam cells exit the cell cycle is unknown and might occur at any time after the last division at the L3/L4 molt and before the L4/adult molt. Although adults do not molt, it is unknown when exit from the molting cycle occurs. (B) Schematic depiction of lin-29a (blue) and lin-29b (green) expression patterns in seam cells and hyp7. Relevant developmental stages are indicated on the arrow representing developmental time. (C) Revised model of the heterochronic pathway. Two parallel arms of the heterochronic pathway exert their functions through distinct LIN-29 isoforms. Their activities are coordinated throught the upstream function of LIN-28. Dashed arrow indicate indirect regulation which involve let-7 sisters miRNAs in hyp7 (Abbott et al., 2005) and LIN-46 in the seam cells (Ilbay and Ambros, 2019; Ilbay et al., 2019).
Author response image 1
Replicate Western blot experiments.
Author response image 2
Vulval phenotypes upon precocious lin-29 expression.
Author response image 3
Seam cell fusion upon precocious lin-29 expression in only the seam.
Tables
Key resources table
| Reagent type (species) or resource | Designation | Source | Identifiers | Additional information |
|---|---|---|---|---|
| Strain, strain background Caenorhabditis elegans | N2 | CGC | N2 | Genotype: Wild-type Figure: all |
| Strain, strain background Caenorhabditis elegans | SX346 | (Lehrbach et al., 2009) PMID:19713957 | Genotype: unc119(e2598) III; wIs51[scm::gfp] V; lin-15(n765) X; mjIs15[ajm-1::mCherry] Figure: 1B, 3A, 3B, 3C, 3D, 6B, 8, 6S1B | |
| Strain, strain background Caenorhabditis elegans | HW1387 | (Aeschimann et al., 2019) PMID:30910805 | Genotype: wIs51[scm::gfp] V; mjIs15[ajm-1::mCherry]; let-7(n2853) X Figure:1B | |
| Strain, strain background Caenorhabditis elegans | HW2960 | This study | Genotype: let-7(xe150(ΔPlet-7)) X; xeEx365 [Plet-7::let-7::sl1_operon_gfp, unc-119 (+); Prab-3::mCherry; Pmyo-2::mCherry; Pmyo-3::mCherry]; wIs51[scm::gfp] V; mjIs15[ajm-1::mCherry] Figure:1B | |
| Strain, strain background Caenorhabditis elegans | HW1865 | (Aeschimann et al., 2019) PMID:30910805 | Genotype: lin-41(xe8)/lin-41(bch28[Peft-3::gfp::h2b::tbb-2 3'UTR] xe70) I; wIs51[scm::gfp] V; lin-15(n765) X; mjIs15[ajm-1::mCherry] Figure:1B | |
| Strain, strain background Caenorhabditis elegans | HW1822 | (Aeschimann et al., 2019) PMID:30910805 | Genotype: lin-29(xe61[lin-29::gfp::3xflag]) II Figure: 2B, 6A, 7A, 7B, 7C, 7D, 9A, 9B, 9C, 10A, 6S1C, 6S1D, 7S1A, 7S1B, 7S1C, 9S1A, 9S1B, 10S1A, 10S1B, 10S1C | |
| Strain, strain background Caenorhabditis elegans | HW1826 | (Aeschimann et al., 2019) PMID:30910805 | Genotype: lin-29(xe63[gfp::3xflag::lin-29a]) II Figure: 2B, 6A, 7A, 7B, 7C, 7D, 9A, 9B, 9C, 10A, 7S1A, 7S1B, 7S1C, 9S1A, 9S1B, 10S1A, 10S1B, 10S1C | |
| Strain, strain background Caenorhabditis elegans | HW1835 | (Pereira et al., 2019) PMID:30599092 | Genotype: lin-29(xe40 xe65 [lin-29b::gfp::3xflag]) II Figure: 2B, 6A, 7A, 7B, 7C, 7D, 9A, 9B, 9C, 10A, 7S1A, 7S1B, 7S1C, 10S1A, 10S1B, 10S1C | |
| Strain, strain background Caenorhabditis elegans | HW2335 | This study | Genotype: lin-29(xe61 xe114 [lin-29::gfp::3xflag])/mnC1 II Figure: 2B | |
| Strain, strain background Caenorhabditis elegans | HW2353 | This study | Genotype: lin-29(xe61 xe121 [lin-29::gfp::3xflag])/mnC1 II Figure: 2B | |
| Strain, strain background Caenorhabditis elegans | HW1861 | (Aeschimann et al., 2019) PMID:30910805 | Genotype: lin-29a(xe40) II; wIs51[scm::gfp] V; mjIs15[ajm-1::mCherry] Figure: 3A, 3B, 3C, 3D, 4A, 4B, 6B | |
| Strain, strain background Caenorhabditis elegans | HW1862 | (Aeschimann et al., 2019) PMID:30910805 | Genotype: mab-10(xe44) II; wIs51[scm::gfp] V; mjIs15[ajm-1::mCherry] Figure: 3A, 3B, 3C, 3D, 4A, 4B | |
| Strain, strain background Caenorhabditis elegans | HW1860 | This study | Genotype: lin-29 (xe37)/mnC1 II; wIs51[scm::gfp] V; lin-15(n765) X; mjIs15[ajm-1::mCherry] Figure: 1B, 3A, 3C, 3D, 4A, 4B | |
| Strain, strain background Caenorhabditis elegans | HW1864 | This study | Genotype: mab-10(xe44) lin-29(xe40)/mnC1; wIs51[scm::gfp] V; lin-15(n765) X; mjIs15[ajm-1::mCherry] Figure: 3A, 3B, 3C, 3D, 4A, 4B, 6B | |
| Strain, strain background Caenorhabditis elegans | HW2469 | This study | Genotype: lin-29(xe116) II; wIs51[scm::gfp] V; mjIs15[ajm-1::mCherry] Figure: 3A, 3C, 3D, 4A, 4B | |
| Strain, strain background Caenorhabditis elegans | HW2471 | This study | Genotype: lin-29(xe120) II; wIs51[scm::gfp] V; mjIs15[ajm-1::mCherry] Figure: 3A, 3C, 3D, 4A, 4B | |
| Strain, strain background Caenorhabditis elegans | HW2480 | This study | Genotype: mab-10(xe44) lin-29(xe116)/mnC1 II; wIs51[scm::gfp] V; mjIs15[ajm-1::mCherry] Figure: 3A, 3C, 3D, 4A, 4B | |
| Strain, strain background Caenorhabditis elegans | HW2481 | This study | Genotype: mab-10(xe44) lin-29(xe120)/mnC1 II; wIs51[scm::gfp] V; mjIs15[ajm-1::mCherry] Figure: 3A, 3C, 3D, 4A, 4B | |
| Strain, strain background Caenorhabditis elegans | HW1949 | This study | Genotype: xeSi301 [Peft-3::luc::gfp::unc-54 3'UTR, unc-119(+)] III Figure: 5B, 6D | |
| Strain, strain background Caenorhabditis elegans | HW2085 | This study | Genotype: lin-29(xe37); xeSi301[Peft-3::luc::gfp::unc-54 3'UTR, unc-119(+)] III Figure: 5B | |
| Strain, strain background Caenorhabditis elegans | HW2086 | This study | Genotype: lin-29(xe40); xeSi301[Peft-3::luc::gfp::unc-54 3'UTR, unc-119(+)] III Figure: 5B, 6D | |
| Strain, strain background Caenorhabditis elegans | HW2087 | This study | Genotype: mab-10(xe44); xeSi301[Peft-3::luc::gfp::unc-54 3'UTR, unc-119(+)] III Figure: 5B | |
| Strain, strain background Caenorhabditis elegans | HW2137 | This study | Genotype: mab-10(xe44) lin-29(xe40) II; xeSi301[Peft-3::luc::gfp::unc-54 3'UTR, unc-119(+)] III Figure: 5B, 6D | |
| Strain, strain background Caenorhabditis elegans | HW2377 | This study | Genotype: lin-29(xe116) II; xeSi301[Peft-3::luc::gfp::unc-54 3'UTR, unc-119(+)] III Figure: 5B | |
| Strain, strain background Caenorhabditis elegans | HW2378 | This study | Genotype: mab-10(xe44) lin-29(xe116)/mnC1 II; xeSi301[Peft-3::luc::gfp::unc-54 3'UTR, unc-119(+)] III Figure: 5B | |
| Strain, strain background Caenorhabditis elegans | HW2410 | This study | Genotype: lin-29(xe120) II; xeSi301[Peft-3::luc::gfp::unc-54 3'UTR, unc-119(+)] III Figure: 5B | |
| Strain, strain background Caenorhabditis elegans | HW2504 | This study | Genotype: mab-10(xe44) lin-29(xe120)/mnC1 II; xeSi301 [Peft-3::luc::gfp::unc-54 3'UTR, unc-119(+)] III Figure: 5B | |
| Strain, strain background Caenorhabditis elegans | HW2408 | This study | Genotype: lin-29(xe61 xe133 [lin-29::gfp::3xflag]) II Figure: 6A, 6S1C, 6S1D | |
| Strain, strain background Caenorhabditis elegans | HW2819 | This study | Genotype: lin-29(xe200) II; wIs51[scm::gfp] V; mjIs15[ajm-1::mCherry] Figure: 6B, 6S1B | |
| Strain, strain background Caenorhabditis elegans | HW2831 | This study | Genotype: mab-10(xe44)lin-29(xe200) II; wIs51[scm::gfp] V; mjIs15[ajm-1::mCherry] Figure: 6B, 6S1B | |
| Strain, strain background Caenorhabditis elegans | HW2764 | This study | Genotype: lin-29 [(xe200) lin-29a exon 2–4 deletion] II; xeSi301 [Peft-3::luc::gfp::unc-54 3'UTR, unc-119(+)] III Figure: 6D | |
| Strain, strain background Caenorhabditis elegans | HW2859 | This study | Genotype: mab-10(xe44) lin-29 [(xe200) lin-29a exon 2–4 deletion] II; xeSi301[Peft-3::luc::gfp::unc-54 3'UTR, unc-119(+)] III Figure: 6D | |
| Strain, strain background Caenorhabditis elegans | IFM155 | This study | Genotype: unc-119(ed3) bchSi39[Peft-3::TIR1::tbb-2 3’UTR, Punc-119::degron-unc-119::unc-119 3’UTR] III Figure: 8 | |
| Strain, strain background Caenorhabditis elegans | HW2349 | This study | Genotype: ttTi5605 II (EG6699); bchSi39[Peft-3::TIR1::tbb-2 3’UTR, Punc-119::degron::unc-119::unc-119 3’UTR] unc-119(ed3) III Figure: 8 | |
| Strain, strain background Caenorhabditis elegans | HW2350 | This study | Genotype: bchSi39[Peft-3::TIR1::tbb-2 3’UTR, Punc-119::degron-unc-119::unc-119 3’UTR] unc-119(ed3) III; oxTi365 V (EG8082) Figure: 8 | |
| Strain, strain background Caenorhabditis elegans | HW2505 | This study | Genotype: xeSi422[Pcol-10::flag-ha-degron::lin-29a::lin-29 3'UTR::operon linker (SL2) with gfp-h2b::tbb-2 3'UTR] II; bchSi39[Peft-3::TIR1::tbb-2 3’UTR, Punc-119::degron-unc-119::unc-119 3’UTR] III; mjIs15[ajm-1::mCherry]* Figure: 8 | |
| Strain, strain background Caenorhabditis elegans | HW2506 | This study | Genotype: xeSi424[Pcol-10::flag-ha-degron::mab-10::mab-10 3'UTR::operon linker (SL2) with gfp-h2b::tbb-2 3'UTR] V; bchSi39[Peft-3::TIR1::tbb-2 3’UTR, Punc-119::degron-unc-119::unc-119 3’UTR] III; mjIs15[ajm-1::mCherry]* Figure: 8 | |
| Strain, strain background Caenorhabditis elegans | HW2604 | This study | Genotype: xeSi423 [Pcol-10::flag-ha-degron::lin-29b::lin-29 3'UTR::operon linker (SL2) with gfp-h2b::tbb-2 3'UTR] II; bchSi39[Peft-3::TIR1::tbb-2 3’UTR, Punc-119::degron-unc-119::unc-119 3’UTR] III; mjIs15[ajm-1::mCherry]* Figure: 8 | |
| Strain, strain background Caenorhabditis elegans | HW2047 | (Pereira et al., 2019) PMID:30599092 | Genotype: mab-10(xe75[mab-10::flag::mCherry]) Figure: 9D | |
| Strain, strain background Caenorhabditis elegans | HW1924 | This study | Genotype: lin-28(n719) I; lin-29(xe61[lin-29::gfp::3xflag]) II Figure: F10A | |
| Strain, strain background Caenorhabditis elegans | HW1925 | This study | Genotype: lin-28(n719) I; lin-29(xe63[gfp::3xflag::lin-29a]) II Figure: 10A | |
| Strain, strain background Caenorhabditis elegans | HW1926 | This study | Genotype:lin-28(n719) I; lin-29(xe65 [lin-29b::gfp::3xflag; lin-29(xe40)]) II Figure: 10A | |
| Strain, strain background Caenorhabditis elegans | MT1524 | (Moss et al., 1997) PMID:9054503 | Genotype: lin-28(n719) I Figure: 10B | |
| Antibody | Monoclonal mouse anti-FLAG M2-Peroxidase (HRP) | Sigma-Aldrich | CAT#A8592 | Western Blot (1:1000) |
| Antibody | Monoclonal mouse anti-Actin clone C4 | Millipore | CAT#MAB1501 | Western Blot (1:10000) |
| Antibody | Horseradish peroxidase-conjugated anti-mouse secondary antibody | GE Healthcare | CAT#NXA931 | Western Blot (1:7500) |
| Chemical compound, drug | Levamisol hydrochloride | Fluka Analytical | CAT#31742 | |
| Chemical compound, drug | Firefly D-Luciferin | p.j.k. | CAT#102111 | |
| Chemical compound, drug | 3-indoleacetic acid (‘auxin’) | Sigma-Aldrich | CAT#I2886 | |
| Commercial assay or kit | ImProm-II Reverse Transcription System | Promega | CAT#A3800 | |
| Commercial assay or kit | PowerUp SYBR Green Master Mix | Thermo Fisher Scientific | CAT#A25742 | |
| Commercial assay or kit | NucleoBond Xtra Midi | Macherey-Nagel | CAT#740410.50 | |
| Commercial assay or kit | NucleoBond Finalizer Plus | Macherey-Nagel | CAT#740520.20 | |
| Commercial assay or kit | Zymoclean Gel DNA Recovery Kit | Zymo Research | CAT#D4001 | |
| Recombinant DNA reagent | Plasmid used in this study are listed inSupplementary file 1A | |||
| Sequence-based reagent | Oligonucleotides used in this study are listed inSupplementary file 1B |
-
*These lines have been derived from a strain containing him-5(e1490) and wIs54[scm::gfp] V. We have not validated the presence of either mutation or transgene in the derived strain.
Author response table 1
| Line | Hatched | Unhatched | Total |
|---|---|---|---|
| Pcol-10::lin-29a | 96 | 4 | 100 |
| Pcol-10::lin-29b | 95 | 5 | 100 |
| Pcol-10::mab-10 | 95 | 5 | 100 |
| N2 | 95 | 5 | 100 |
Author response table 2
| Line | Fertile1 | Sterile | Censored2 | Total |
|---|---|---|---|---|
| Pcol-10::lin-29a | 8 | 15 | 7 | 30 |
| Pcol-10::lin-29b | 16 | 5 | 9 | 30 |
| Pcol-10::mab-10 | 24 | 2 | 4 | 30 |
| N2 | 30 | 0 | 0 | 30 |
Additional files
-
Supplementary file 1
(A) Plasmids used in this study. (B) Oligonucleotides and sgRNAs used in this study.
- https://cdn.elifesciences.org/articles/53387/elife-53387-supp1-v1.pdf
-
Transparent reporting form
- https://cdn.elifesciences.org/articles/53387/elife-53387-transrepform-v1.docx
Download links
A two-part list of links to download the article, or parts of the article, in various formats.
Downloads (link to download the article as PDF)
Open citations (links to open the citations from this article in various online reference manager services)
Cite this article (links to download the citations from this article in formats compatible with various reference manager tools)
A branched heterochronic pathway directs juvenile-to-adult transition through two LIN-29 isoforms
eLife 9:e53387.
https://doi.org/10.7554/eLife.53387


