Germline burden of rare damaging variants negatively affects human healthspan and lifespan
- Brigham and Women’s Hospital, Harvard Medical School, United States
- Gero LLC, Russian Federation
- The Faculty of Bioengineering and Bioinformatics, Lomonosov Moscow State University, Russian Federation
- Skolkovo Institute of Science and Technology, Skolkovo Innovation Center, Russian Federation
- Moscow Institute of Physics and Technology, Russian Federation
Figures
Figure 1 with 1 supplement
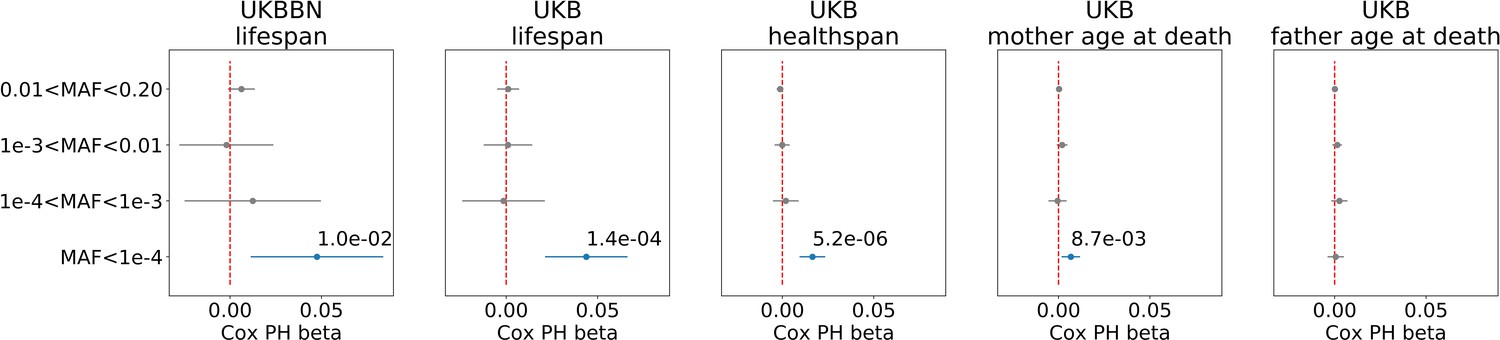
Association of burden of PTVs binned by population frequency (or minor allele frequency, MAF) with lifespan, healthspan, and parental age at death.
Number of ultra-rare variants belonging to each MAF bin was calculated for each exome and tested for association with lifespan phenotypes using Cox proportional hazards model and covariates to account for population structure. UKBBN lifespan was tested for associations with corresponding PTVs burdens using sex and 20 first principal components (PCs) from PCA analysis with 1000G project. UKB lifespan during follow-up was tested for associations using sex, age of enrollment, assessment centers and 40 PCs provided by UKB as covariates. UKB healthspan, mother’s and father’s ages at death were tested for associations using sex, assessment centers and 40 PCs as covariates. Beta coefficients estimated by Cox proportional hazards model (Cox PH beta) are plotted as dots with whiskers representing 95% confidence intervals. p-Values are shown for significant results only. Blue color designates statistically significant associations. Red dashed line designates zero Cox PH beta coefficient value. MAF - minor allele frequency, PTV - protein-truncating variants (defined as stop codon gains, frameshifts, canonical splice acceptor/donor sites variant), UKB - UK Biobank, UKBBN - UK Brain Bank Network.
-
Figure 1—source data 1
Source data for Figure 1.
- https://cdn.elifesciences.org/articles/53449/elife-53449-fig1-data1-v2.xlsx
Figure 1—figure supplement 1
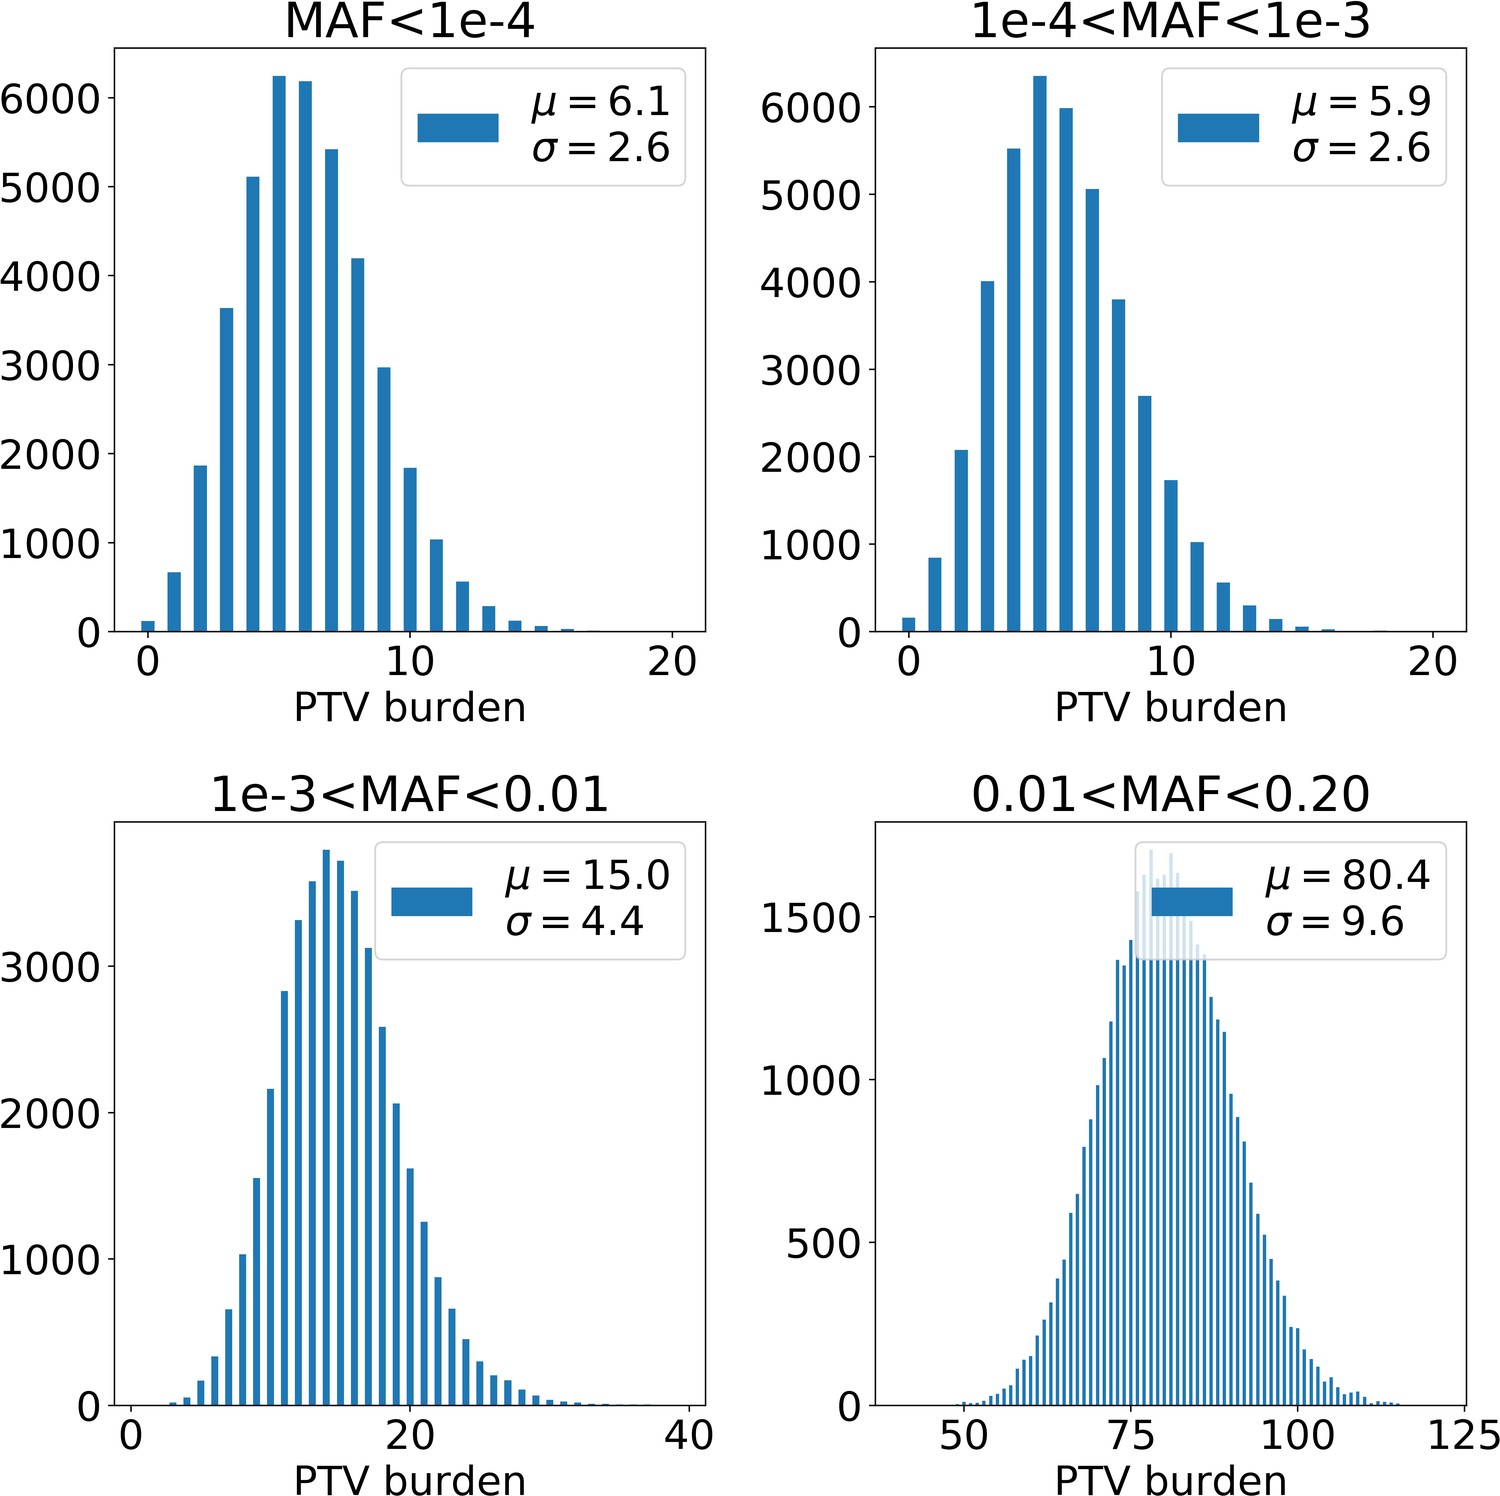
Distributions of PTV number per UKB exome depending on the variant population frequency (or minor allele frequency, MAF).
The burden of variants increases with the frequency of the variant in the population. µ and shown in the upper right corners are mean and standard deviation of the corresponding distribution. PTV - protein-truncating variants (defined as stop codon gains, frameshifts, canonical splice acceptor/donor sites variant).
Figure 2
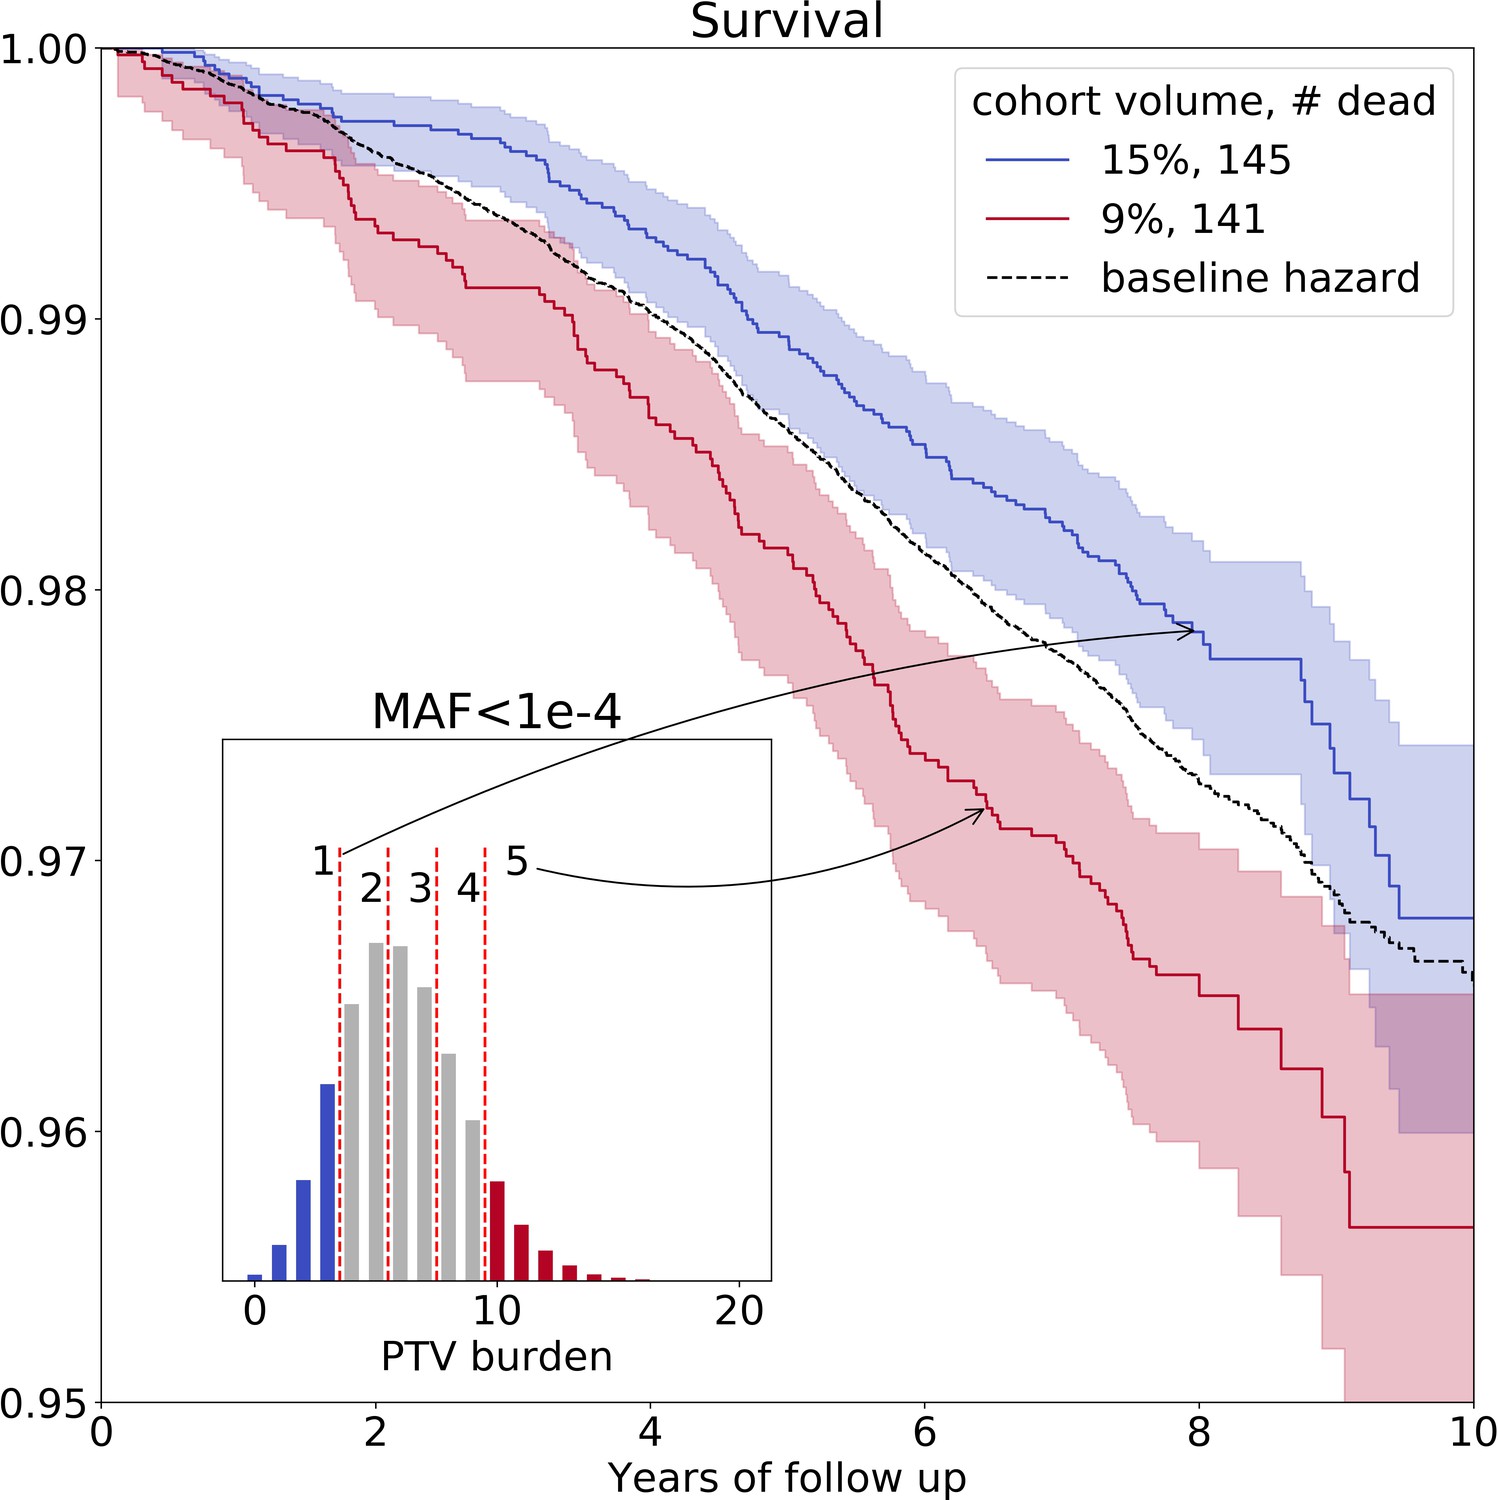
Ultra-rare () PTV burden distribution and survival curves for the deceased UKB subjects stratified into groups based on the increasing burden.
Blue line represents survival of individuals with low PTV burden (3 or less ultra-rare PTVs per genome) and red line represents survival of individuals with high PTV burden (10 or more ultra-rare PTVs per genome) during eleven years of follow-up (log-rank test ). The absolute number of deceased subjects in each line, and the corresponding percentage, is indicated in the legend. The inset shows the distribution of the number of ultra-rare () PTVs per deceased individual in UKB cohort, colored accordingly to the survival curves. MAF - minor allele frequency, PTV - protein-truncating variants (defined as stop codon gains, frameshifts, canonical splice acceptor/donor sites variant).
Figure 3

Association of ultra-rare () variants burden with UKB and UKBBN lifespan, UKB healthspan, and parental longevity (father’s and mother’s age at death).
The number of ultra-rare variants belonging to each category was calculated for each genome and tested for association with lifespan phenotypes using Cox proportional hazards model and covariates to account for population structure. UKBBN lifespan was tested using sex and 20 first principal components (PCs) taken from principal component analysis of common variants shared between UKBBN and 1000G project. UKB lifespan during follow-up was tested for association with ultra-rare variants burdens using sex, age of enrollment, assessment centers, and 40 PCs provided by UKB as covariates. Sex, assessment centers, and 40 PCs were used as covariates for associations with UKB healthspan, and mother’s and father’s age at death. Beta coefficients estimated by Cox proportional hazards model (Cox PH beta) are plotted as dots with whiskers representing 95% confidence intervals. p-Values are shown for significant results only. Blue color designates statistically significant associations. Red dashed line designates zero Cox PH beta coefficient value. UKB - UK Biobank, UKBBN - UK Brain Bank Network, TF - transcription factor, UTR - untranslated region, MAF - minor allele frequency, PTV - protein-truncating variants (defined as stop codon gains, frameshifts, canonical splice acceptor/donor sites).
-
Figure 3—source data 1
Source data for Figure 3.
- https://cdn.elifesciences.org/articles/53449/elife-53449-fig3-data1-v2.xlsx
Figure 4 with 4 supplements
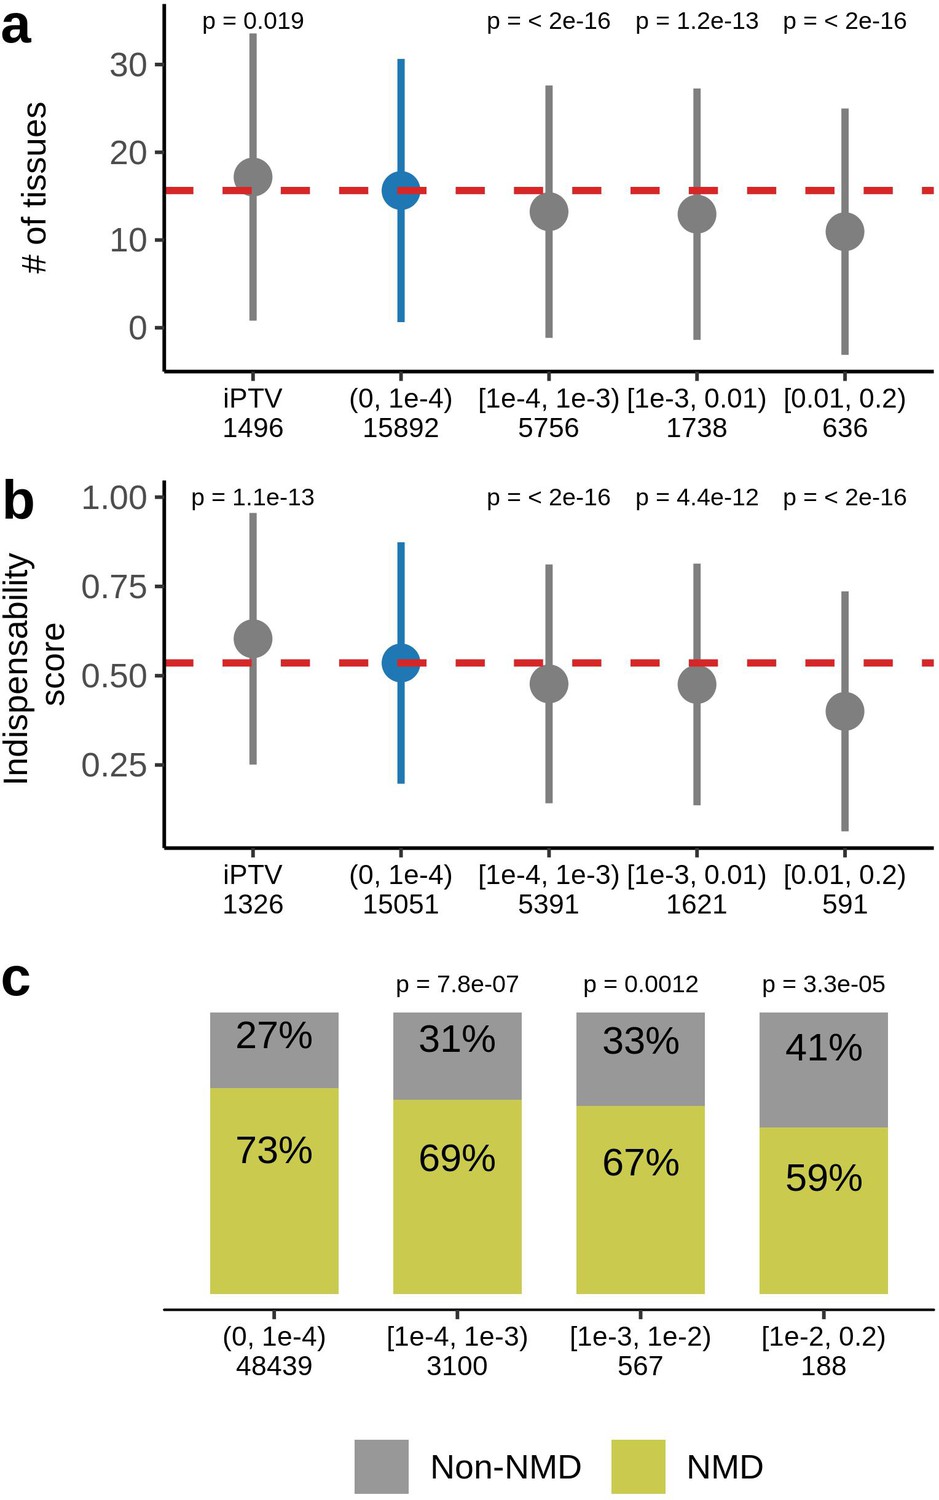
Characteristics of genes harboring PTVs binned by allele frequency in UKB.
(a) PTV-intolerant (iPTV) genes and genes harboring ultra-rare PTVs ( bin) are more broadly expressed and (b) have higher indispensability scores (a metric to measure gene essentiality introduced by Khurana et al., 2013). The results of comparisons are grouped in subsequent MAF bins and the numbers in the horizontal axis represent the number of genes included in the analysis. (c) Ultra-rare stop gains are more likely to trigger nonsense-mediated decay (NMD) based on 50 bp rule prediction, the numbers in the horizontal axis represent the total number of stop gains in each bin. Each group was compared to the bin of rarest variants , where PTVs are significantly associated with lifespan. p-Values in (a) and (b) are calculated using Wilcoxon rank-sum test, p-values in (c) are calculated using Fisher’s exact test. NMD - nonsense-mediated mRNA decay, PTV - protein-truncating variant (defined as stop codon gains, frameshifts, canonical splice acceptor/donor sites variant), iPTV - genes intolerant to PTV.
Figure 4—figure supplement 1
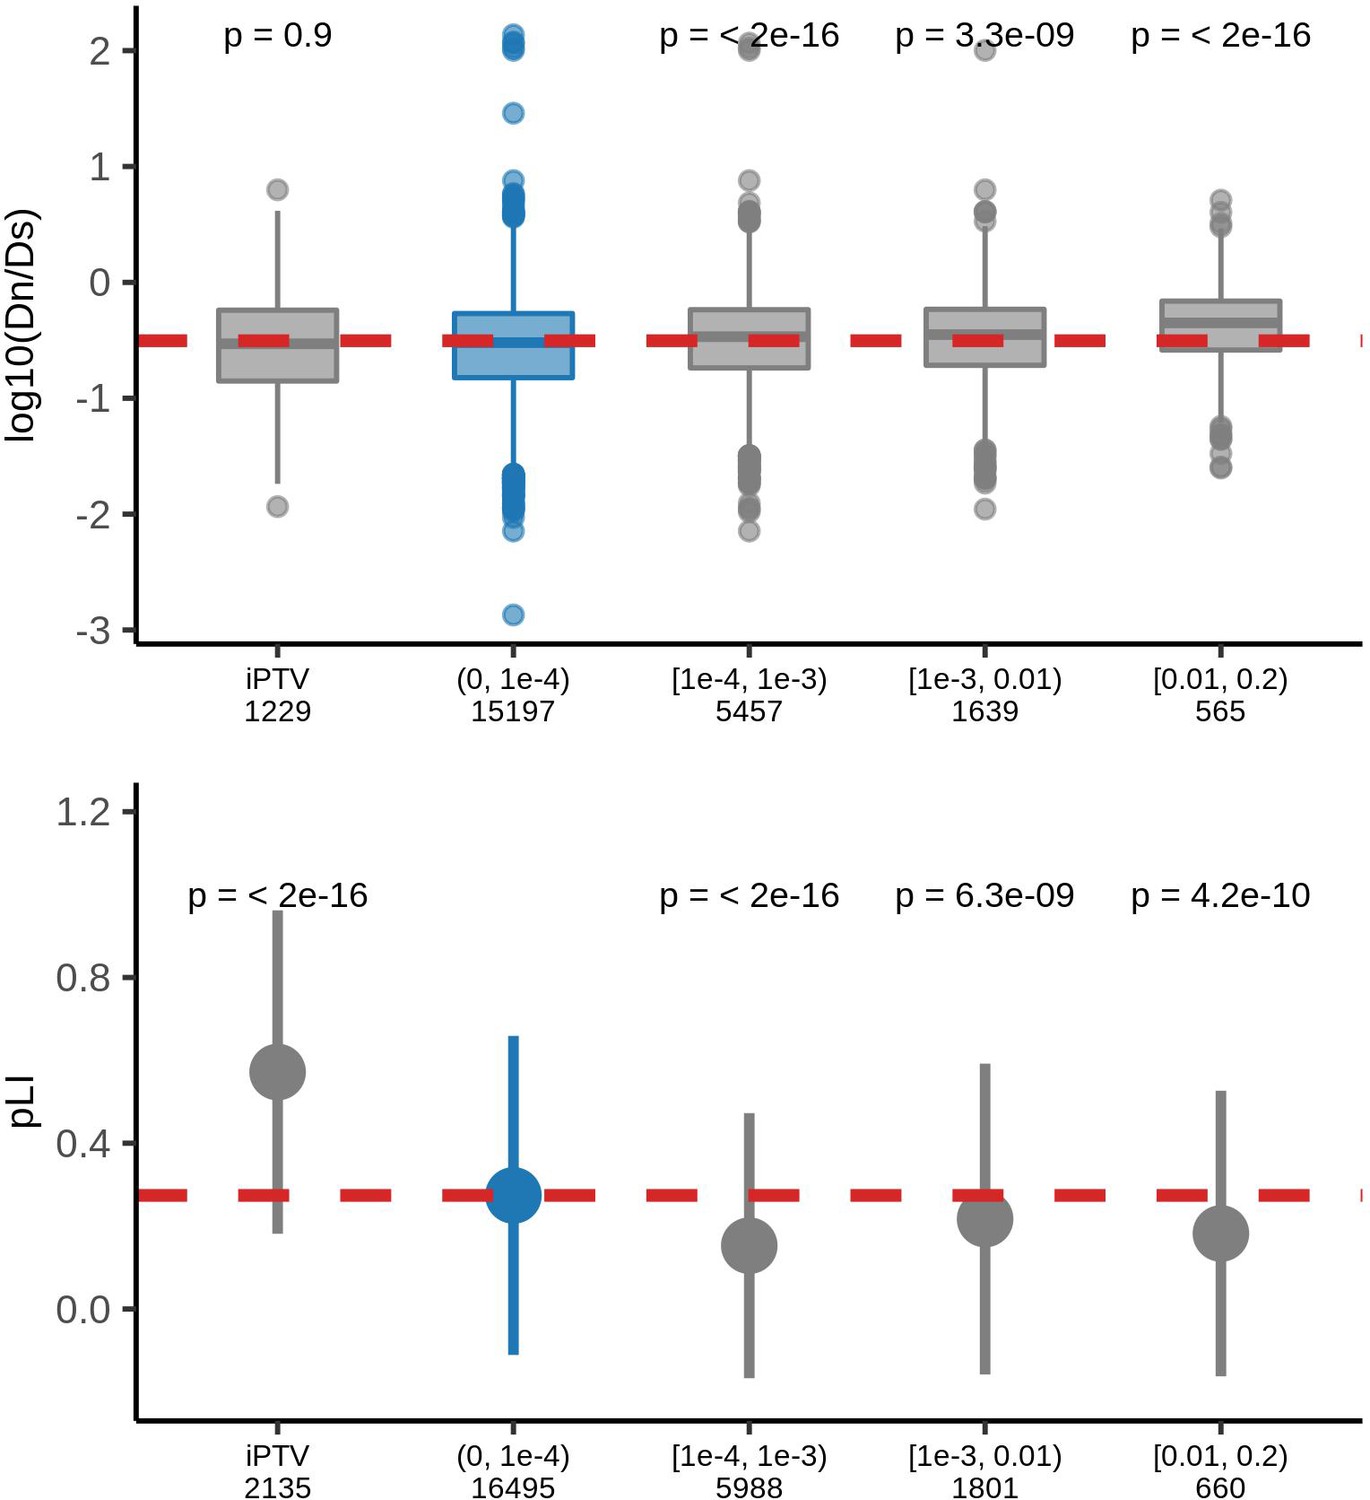
Comparison of the constraints of genes that harbors protein-truncating variants with different MAFs and genes free of those variants.
Top: human-chimpanzee ratios, bottom: pLI scores for genes harboring PTVs belonging to different MAF bins or lacking PTVs (iPTV) in UKB population. Numbers below each bin represents number of genes harboring PTVs of corresponding population frequency included in the analyses.
Figure 4—figure supplement 2
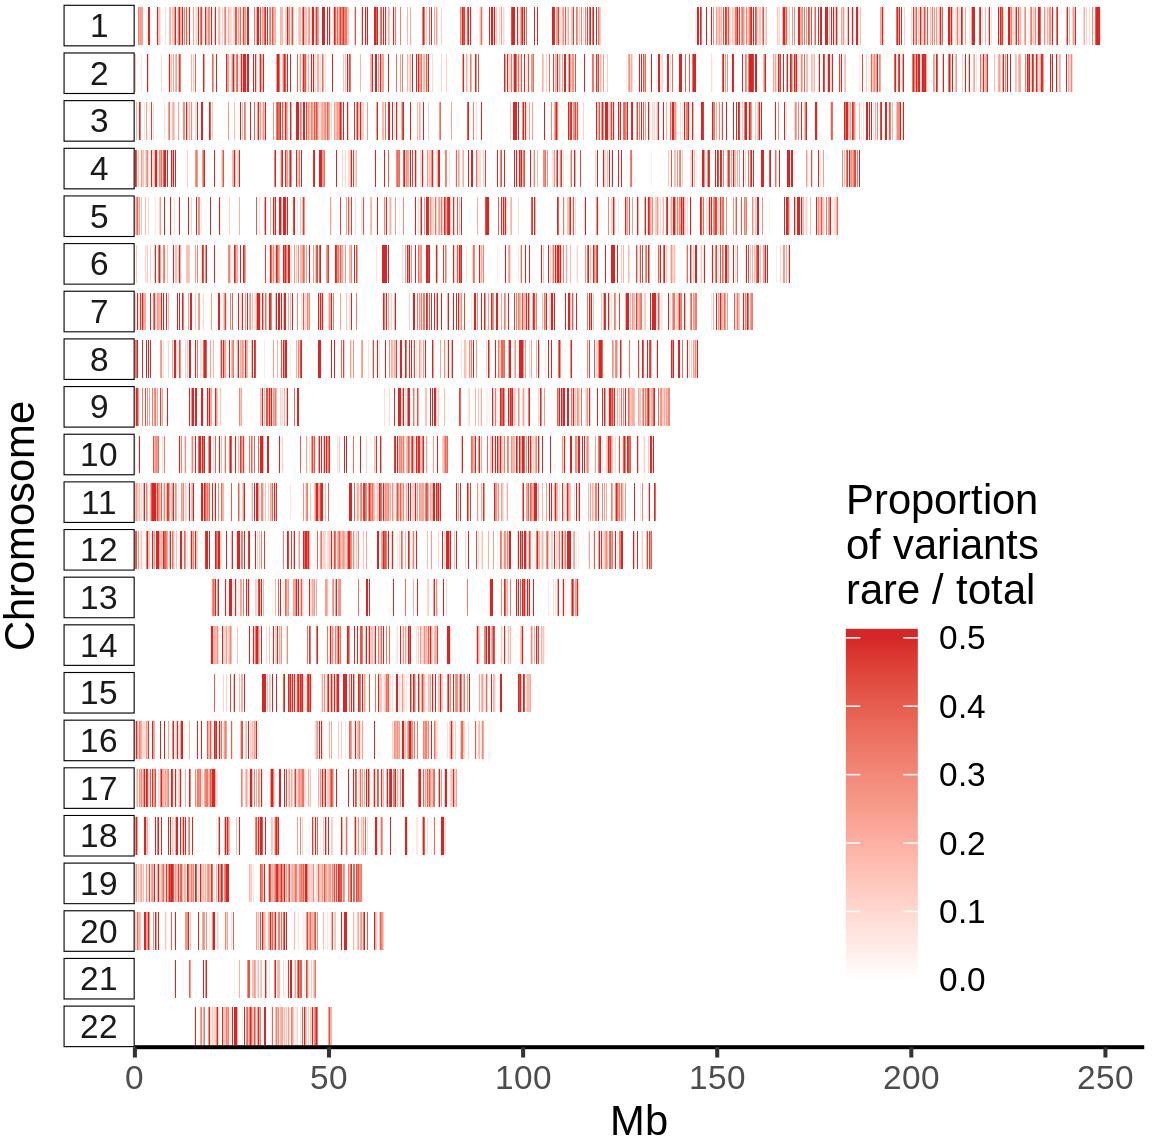
Distribution of ultra-rare PTVs across human genome normalized by number of total variants.
Positions were binned by 50 bp window and plotted according to the chromosome (vertical axis) and position (horizontal axis). Each line represents a 50 window, and color intensity corresponds to proportion of ultra-rare PTVs to total number of variants identified in UKB subjects.
Figure 4—figure supplement 3
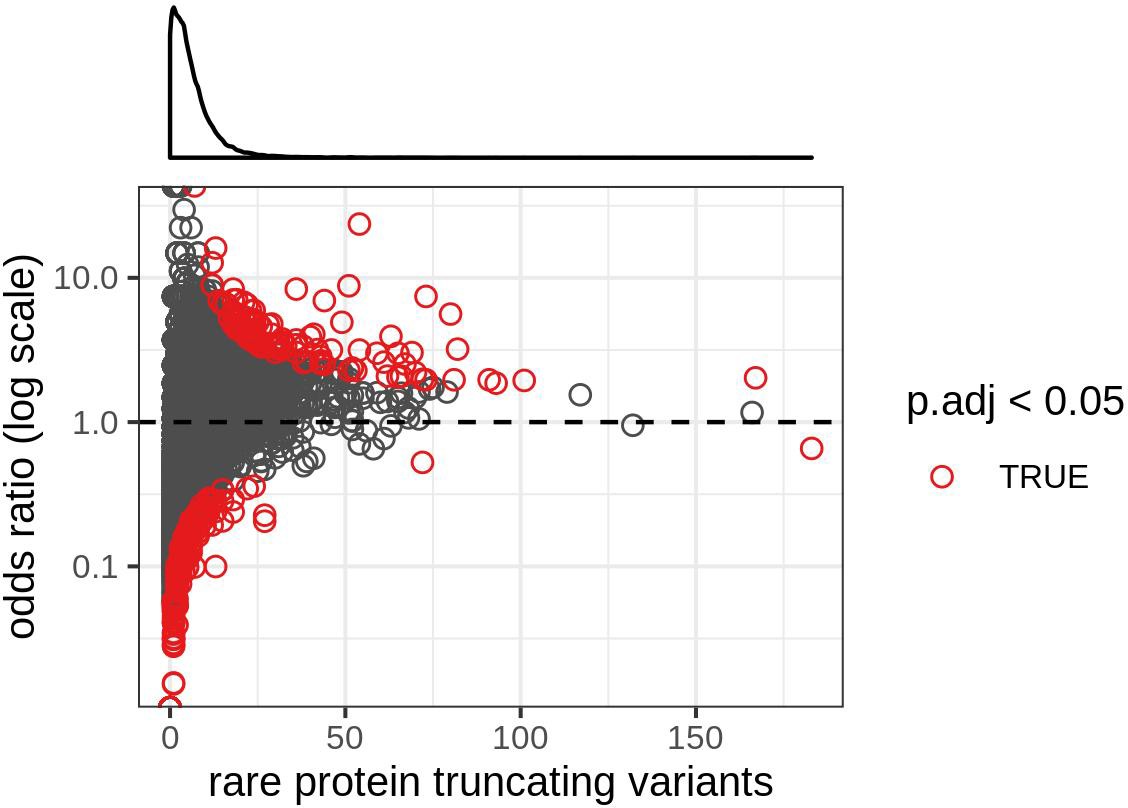
Relationship between the number of ultra-rare protein-truncating variants and the odds ratio obtained in the Fisher’s exact test for each gene.
Each dot is a gene. Genes with an odds ratio below one had a disproportionately low number of rare PTVs. Shown in red are genes with Bonferroni-corrected p-value<0.05. For this analysis protein-truncating variants were restricted to stop codon gains and frameshifts.
Figure 4—figure supplement 4
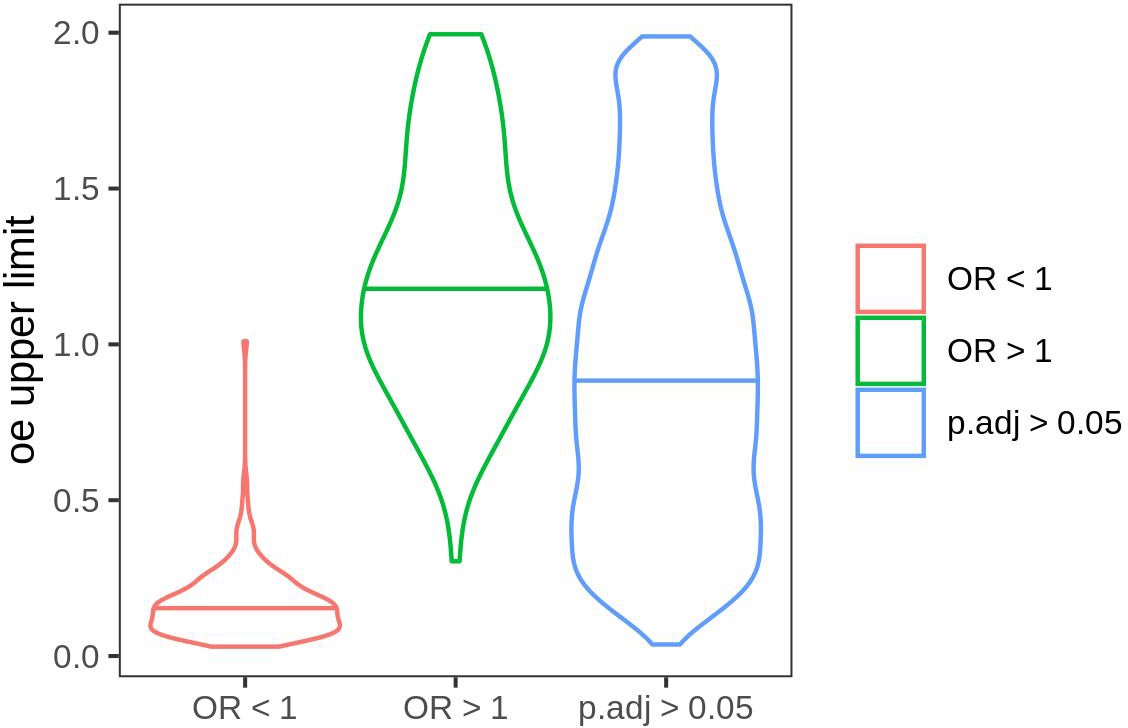
Distribution of oe scores in genes with odds ratio (OR) below 1 (OR <1), OR greater than 1 (OR >1), and the rest of the genes which obtained a non-significant p-value (>0.05).
In order to identify genes with a significantly low number of rare PTVs, we performed a Fisher’s exact test using number of rare PTVs and synonymous variants. For each gene, we build a 2 × 2 contingency table containing the number of rare PTVs observed in the gene and those observed in the rest of the genome, and the number of synonymous variants observed in the gene and those observed in the rest of the genome. We first focused on the genes that pass Bonferroni-corrected p-value cut-off of 0.05. Those with odds ratio (OR) <1 showed a disproportionately low number of ultra-rare PTVs, and genes with OR >1 were enriched in ultra-rare PTVs. The oe scores from gnomAD correspond to the gene selective constraints against loss-of-function variants, e.g. essential genes are known to have low oe scores. We used here the upper limit of the 95% confidence interval obtained from gnomAD v2.1.1. For this analysis protein-truncating variants were restricted to stop codon gains and frameshifts.
Figure 5

Deleterious effect of the ultra-rare PTVs are also associated with lifespan.
(a) Survival of UKB subjects with 5 ultra-rare PTVs per exome. The inset shows association between lifespan and the properties of genes harboring ultra-rare PTV: evolutionary constraint quantified by ratios (the ratio of substitution rates at non-synonymous and synonymous sites) in human-chimpanzee orthologs; indispensability score (IS) as in Khurana et al., 2013; genome-wide haploinsufficiency score (GHIS) as in Steinberg et al. (2015); (relative) number of tissues expressing the gene; observed/expected (oe) score; prediction for variants being loss-of-function (LOF, see LOF-gene) and triggering NMD (see NMD-gene). Orange and blue areas in (a) designate survival windows for subjects dying earlier in life (young) and later in life (old) and this color scheme is the same as that in the plots B-D. Difference in (B) GHIS scores, (C) percent of tissues expressing gene affected by variants, and (D) oe scores, and (e) proportion of predicted loss-of-function () variants for individuals with same PTV number but differing in lifespan (i.e. dying younger (47.4 − 58.9 years) or older (73.8 − 78.5 years)). p-Values in (b) and (d) were calculated by Student t-test, p-value in (c) and (e) were calculated by Wilcoxon rank-sum test. NMD - nonsense-mediated decay, IS - indispensability score, GHIS - genome-wide haploinsufficiency score, LOF - loss of function, PTV - protein-truncating variant (defined as stop codon gains, frameshifts, canonical splice acceptor/donor sites variant).
Tables
Table 1
Incidence of first disease (end of healthspan) statistics in UK Biobank subjects.
MI - myocardial infarction, COPD - chronic obstructive pulmonary disease, CHF - congestive heart failure.
| Number of events | |
|---|---|
| Cancer | 6239 |
| Diabetes | 2009 |
| MI | 1862 |
| COPD | 619 |
| Stroke | 527 |
| Dementia | 211 |
| Death | 126 |
| CHF | 114 |
Table 2
Cause of death reported for 1,122 and 359 subjects in UKB and UKBBN cohorts, respectively.
UKB - UK Biobank, UKBBN - UK Brain Bank Network.
| UKB | Ukbbn | |
|---|---|---|
| Neoplasm | 638(56.9%) | 20(5.6%) |
| Circulatory system | 208(18.5%) | 90(25.1%) |
| Respiratory system | 82(7.3%) | 171(47.6%) |
| Digestive | 47(4.2%) | 7(1.9%) |
| Nervous system | 43(3.8%) | 51(14.2%) |
| External | 35(3.1%) | — |
| Other (infections, congenital, endocrine, mental) | 69(6.1%) | 19(5.3%) |
Table 3
Association of burden of ultra-rare () PTVs with healthspan and mother’s age at death is sex-specific.
Number of ultra-rare variants was calculated for each genome and tested for association with lifespan phenotypes using Cox proportional hazards model and covariates to account for population structure (see Materials and methods). Beta coefficients reported in the ’coef’ column. Bold font designates statistically significant associations. N - number of individuals analyzed, events - number of corresponding events reported in UK Biobank.
| Phenotype | Sex | Coef | Ci (2.5%) | Ci (97.5%) | p-value | N | Events |
|---|---|---|---|---|---|---|---|
| Death | female | 0.048 | 0.012 | 0.083 | 0.008 | 21742 | 450 |
| Death | male | 0.041 | 0.011 | 0.070 | 0.007 | 18626 | 672 |
| Mother age at death | female | 0.008 | 0.001 | 0.015 | 0.026 | 21320 | 12370 |
| Mother age at death | male | 0.006 | −0.002 | 0.013 | 0.130 | 17989 | 11081 |
| Father age at death | female | 0.002 | −0.004 | 0.008 | 0.558 | 20914 | 15679 |
| Father age at death | male | −0.001 | −0.008 | 0.006 | 0.796 | 17783 | 13785 |
| Healthspan | female | 0.024 | 0.014 | 0.034 | 4.1E-06 | 21742 | 5667 |
| Healthspan | male | 0.009 | −0.001 | 0.019 | 0.070 | 18626 | 6037 |
Table 4
Variant annotations for 8,959,608 SNPs from FE dataset which is part of UKB.
Variant types selected for analysis are written in italics, and PTV burden components marked in bold. Some variants may have multiple effects. PTV - protein-truncating variants, UTR - untranslated region, TF - transcription factor, TFBS - transcription factor binding site.
| Variant effect | Number of variants |
|---|---|
| intron_variant | 3643472 |
| missense_variant | 2281322 |
| synonymous_variant | 1159078 |
| splice_region_variant | 333226 |
| downstream_gene_variant | 329399 |
| upstream_gene_variant | 303346 |
| 3_prime_UTR_variant | 303346 |
| 5_prime_UTR_variant | 192159 |
| frameshift_variant | 96359 |
| intragenic_variant | 85619 |
| sequence_feature | 79868 |
| stop_gained | 68054 |
| structural_interaction_variant | 57365 |
| TF_binding_site_variant | 45909 |
| 5_prime_UTR_premature_start_codon_gain_variant | 34381 |
| splice_donor_variant | 22476 |
| disruptive_inframe_deletion | 21392 |
| splice_acceptor_variant | 18591 |
| conservative_inframe_deletion | 12612 |
| disruptive_inframe_insertion | 11080 |
| intergenic_region | 11012 |
| conservative_inframe_insertion | 8665 |
| start_lost | 5807 |
| stop_lost | 2442 |
| protein_protein_contact | 1590 |
| stop_retained_variant | 1077 |
| initiator_codon_variant | 609 |
| TFBS_ablation | 180 |
| bidirectional_gene_fusion | 17 |
| gene_fusion | 7 |
| exon_loss_variant | 5 |
| 3_prime_UTR_truncation | 3 |
| non_canonical_start_codon | 2 |
Additional files
-
Supplementary file 1
Statistics from gene burden test for lifespan in UKB.
Burdens of ultra-rare PTVs for each gene were compared between subjects with short and long lifespan.
- https://cdn.elifesciences.org/articles/53449/elife-53449-supp1-v2.xls
-
Supplementary file 2
Statistics from gene burden test for healthspan in UKB.
Burdens of ultra-rare PTVs for each gene were compared between subjects with short and long healthspan in both sexes, and separately in females and males .
- https://cdn.elifesciences.org/articles/53449/elife-53449-supp2-v2.xls
-
Supplementary file 3
Statistics from gene burden test of ultra-rare PTVs in UKB population.
Burden of ultra-rare PTVs for each gene and burden of synonymous variants was compared to the global burdens of ultra-rare PTVs and synonymous variants.
- https://cdn.elifesciences.org/articles/53449/elife-53449-supp3-v2.xls
-
Transparent reporting form
- https://cdn.elifesciences.org/articles/53449/elife-53449-transrepform-v2.docx
Download links
A two-part list of links to download the article, or parts of the article, in various formats.
Downloads (link to download the article as PDF)
Open citations (links to open the citations from this article in various online reference manager services)
Cite this article (links to download the citations from this article in formats compatible with various reference manager tools)
Germline burden of rare damaging variants negatively affects human healthspan and lifespan
eLife 9:e53449.
https://doi.org/10.7554/eLife.53449


