Lipid polarity gradient formed by ω-hydroxy lipids in tear film prevents dry eye disease
- Laboratory of Biochemistry, Faculty of Pharmaceutical Sciences, Hokkaido University, Japan
Figures
Figure 1
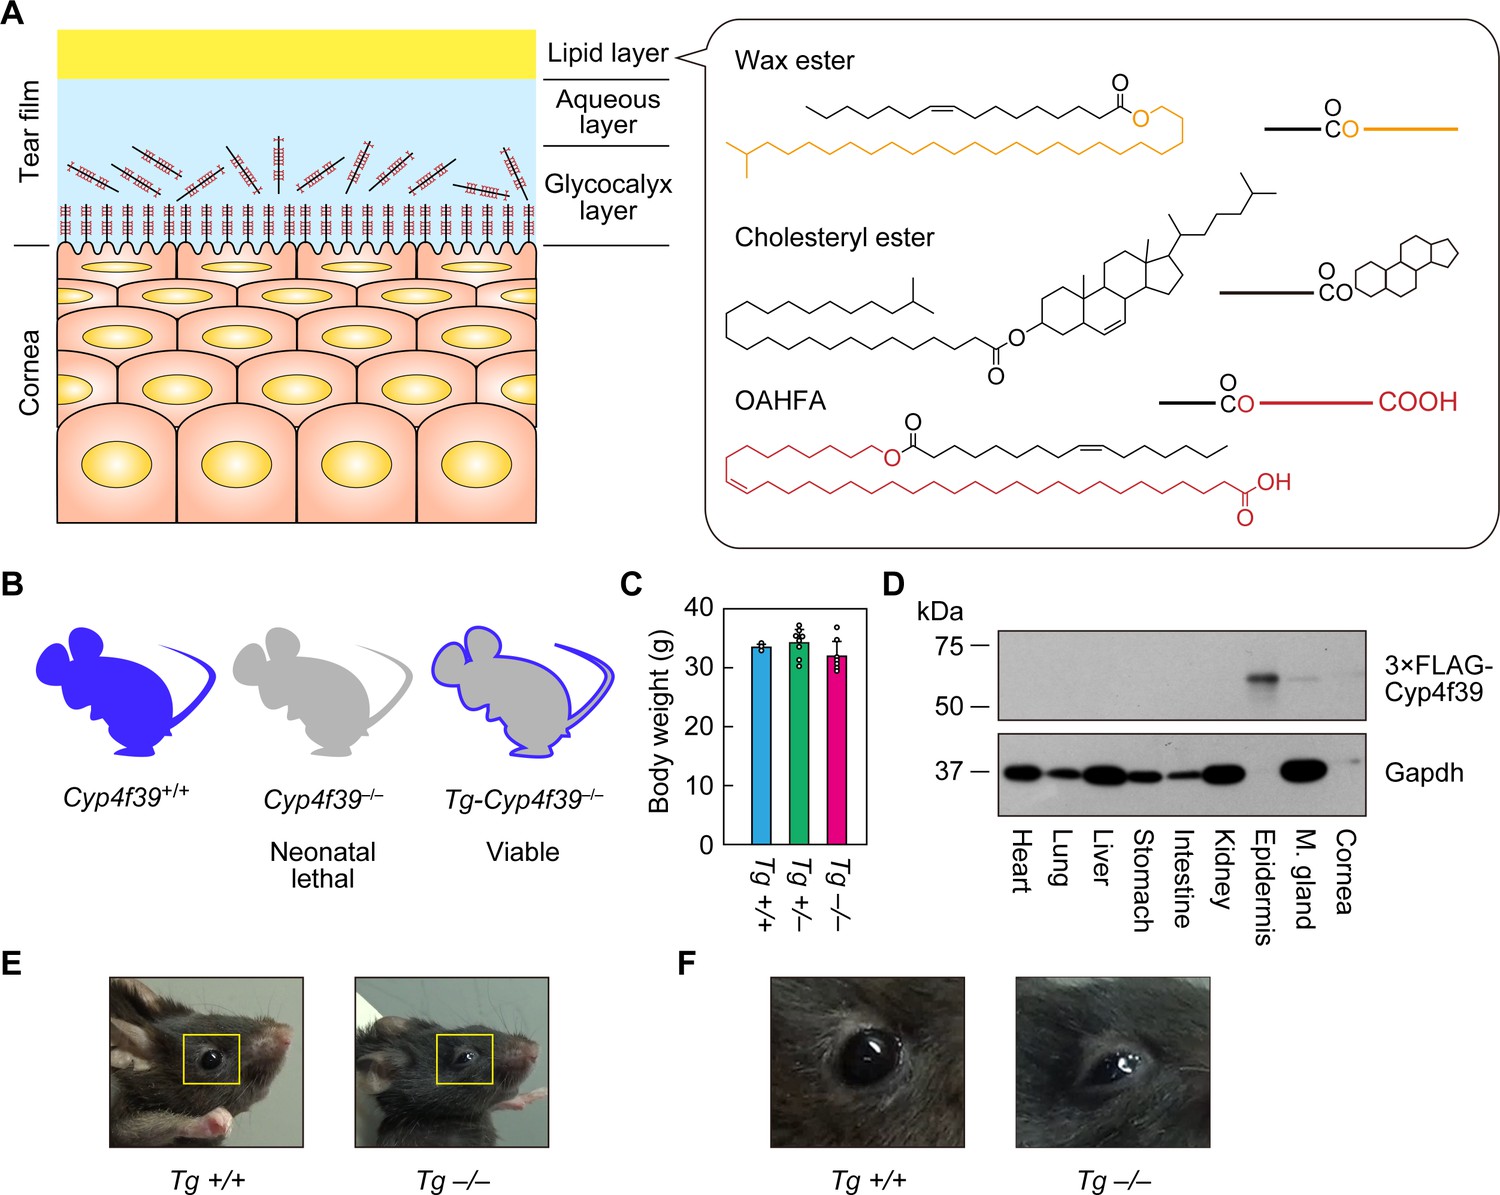
Generation of Tg-Cyp4f39–/– mice.
(A) Schematic illustration of the cornea, tear film, and structures of major meibum lipids (wax ester [WE], cholesteryl ester [CE], and (O-Acyl)-ω-hydroxy fatty acid [OAHFA]), together with their simplified structures. Orange and red indicate the fatty alcohol (FAl) and ω-OH fatty acid (FA) moieties, respectively. (B) Schematic diagram of Cyp4f39+/+ (wild type), Cyp4f39–/– (Cyp4f39 whole-body knockout), and Tg-Cyp4f39–/– mice. Blue represents Cyp4f39 expression and gray indicates Cyp4f39 deficiency. (C) Body weight of Tg-Cyp4f39+/+ (n = 3), Tg-Cyp4f39+/– (n = 8), and Tg-Cyp4f39–/– (n = 7) mice at 10–12 months of age. Values presented are means ± SD. (D) Total lysates (20 μg) prepared from the heart, lung, liver, stomach, small intestine, kidney, epidermis, meibomian gland, and cornea of 12-month-old Tg-Cyp4f39–/– mice were separated by SDS-PAGE and subjected to immunoblotting with anti-FLAG and anti-GAPDH antibodies (loading control). (E, F) Photographs of 12-month-old Tg-Cyp4f39+/+ and Tg-Cyp4f39–/– mice. The photographs in (F) are enlargements of the areas enclosed by the yellow frames in panel (E). Tg +/+, Tg-Cyp4f39+/+; Tg–/–, Tg-Cyp4f39–/–; M. gland, Meibomian gland.
Figure 2
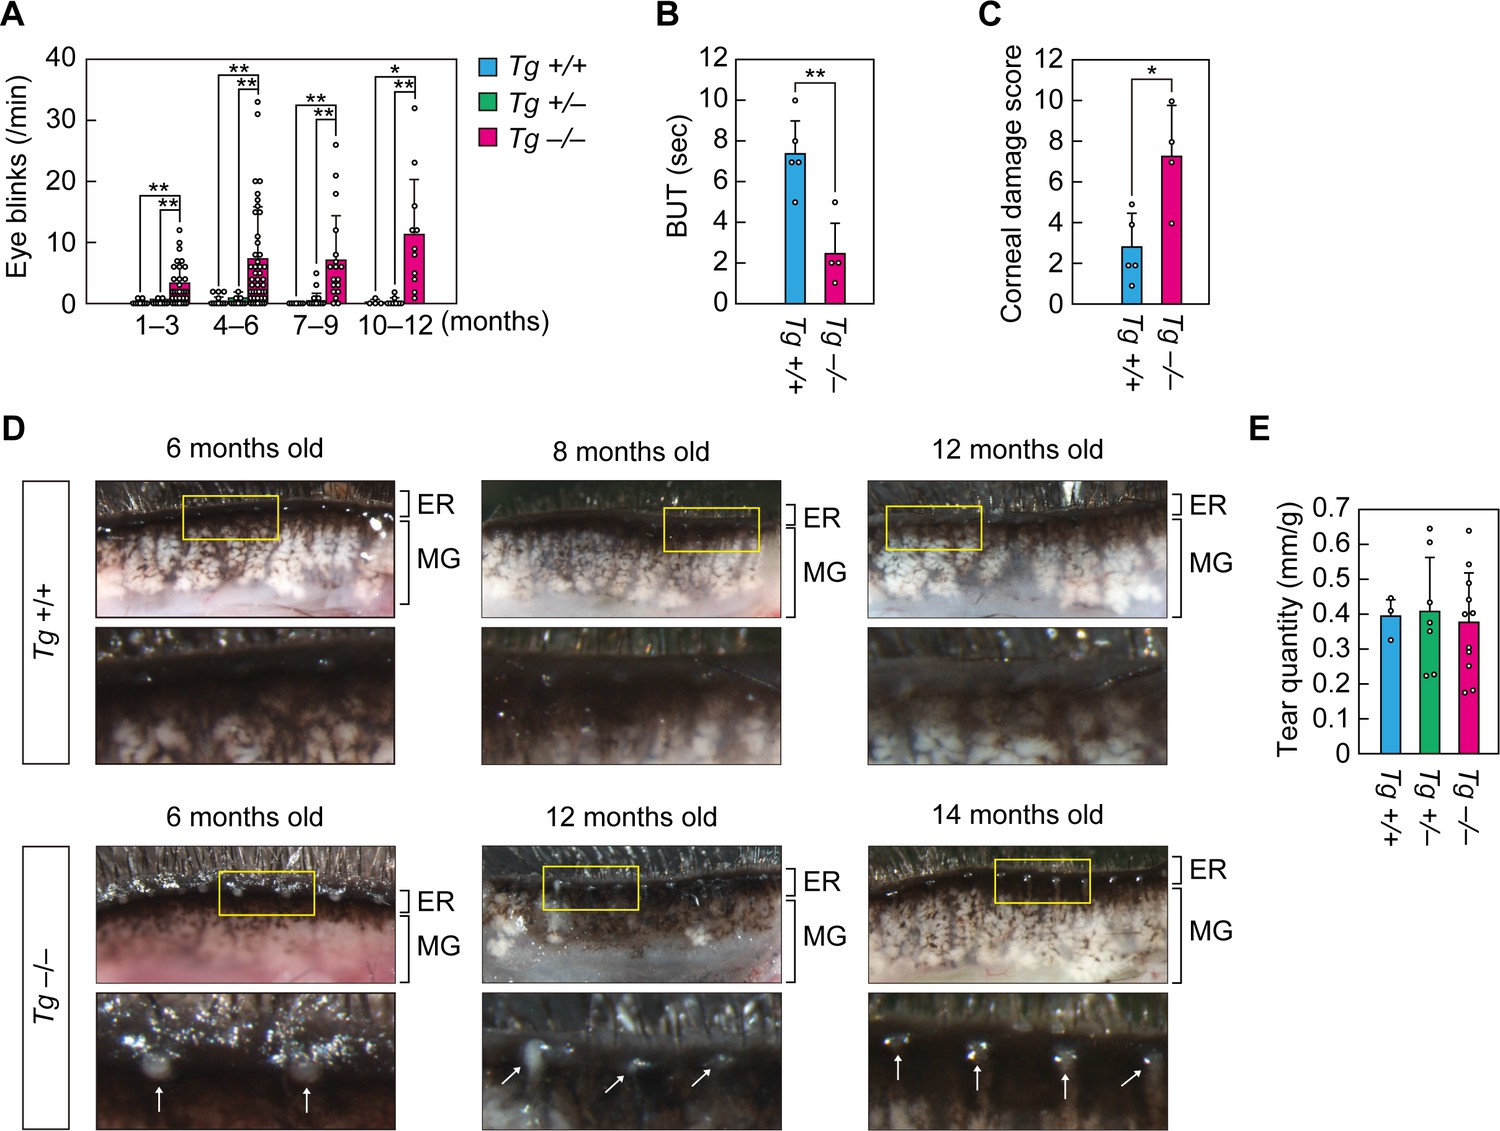
Cyp4f39-deficient mice exhibit dry eye.
(A) Blink frequency was measured in 1–12-month-old Tg-Cyp4f39+/+ (n = 7), Tg-Cyp4f39+/– (n = 9), and Tg-Cyp4f39–/– (n = 14) mice. The total number of measurements for mice at each age were: Tg-Cyp4f39+/+ mice, 11 at 1–3 months, 19 at 4–6 months, 10 at 7–9 months, 4 at 10–12 months; Tg-Cyp4f39+/– mice, 12 at 1–3 months, 24 at 4–6 months, 18 at 7–9 months, 8 at 10–12 months; and Tg-Cyp4f39–/– mice, 35 at 1–3 months, 45 at 4–6 months, 18 at 7–9 months, and 11 at 10–12 months. Values presented are means of blink rate per min ± SD (*, p<0.05; **, p<0.01; Tukey-Kramer’s test). Break-up time (BUT) (B) and corneal damage score (C) were measured for 8–17-month-old Tg-Cyp4f39+/+ (n = 3) and Tg-Cyp4f39–/– (n = 4) mice. Experiments were performed on both eyes, and 5 and 4 measurements were obtained from Tg-Cyp4f39+/+ and Tg-Cyp4f39–/–mice, respectively. Values presented are means ± SD (*, p<0.05; **, p<0.01; Student’s t-test). (D) Upper eyelids from 6–12-month-old Tg-Cyp4f39+/+ mice and 6–14-month-old Tg-Cyp4f39–/– mice and photographed under a light microscope. The lower images are enlarged views of the areas surrounded by yellow rectangles in the upper images. The white arrows represent obstruction of the meibomian gland orifice. (E) Tear quantity was measured in 10–12-month-old Tg-Cyp4f39+/+ (n = 3), Tg-Cyp4f39+/– (n = 7), and Tg-Cyp4f39–/– (n = 11) mice using the phenol red-thread test. Values presented are means ± SD (*, p<0.05; Student’s t-test). Tg +/+, Tg-Cyp4f39+/+; Tg +/–, Tg-Cyp4f39+/–; Tg –/–, Tg-Cyp4f39–/–; ER, eyelid rim; MG, meibomian gland.
Figure 3
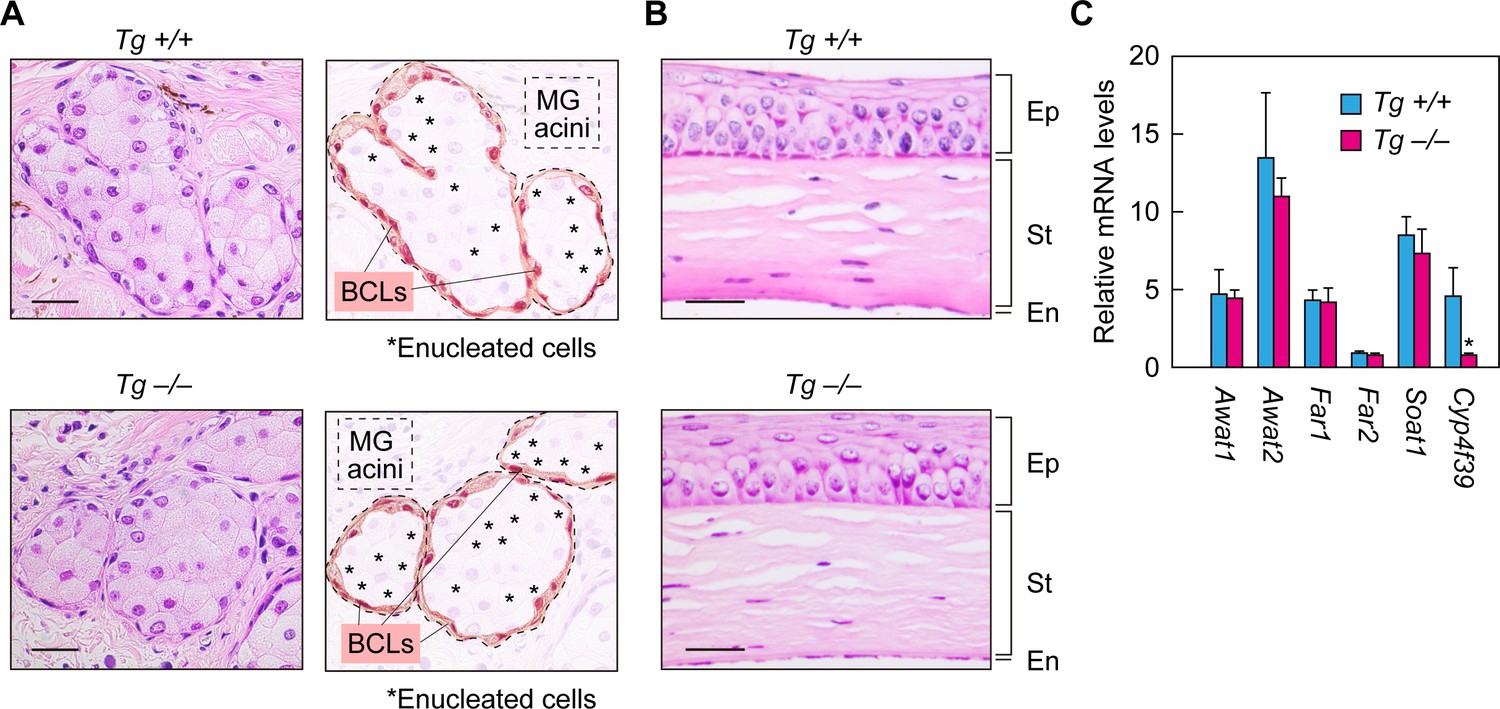
Normal formation of meibomian glands and cornea and normal gene expression in Cyp4f39-deficient mice.
(A, B) Paraffin sections of 12-month-old Tg-Cyp4f39+/+ and Tg-Cyp4f39–/– mice were stained with hematoxylin and eosin. Bright-field images of meibomian glands (A, left panels) and cornea (B) photographed under a light microscope, and schematic diagrams of the meibomian gland acini (A, right panels) are presented. Scale bar, 25 μm. (C) Total RNAs were prepared from the meibomian glands of 12-month-old Tg-Cyp4f39+/+ (n = 3) and Tg-Cyp4f39–/– (n = 3) mice and subjected to real-time quantitative RT-PCR using specific primers for Awat1, Awat2, Far1, Far2, Soat1, Cyp4f39, or the housekeeping gene Hprt. Values are amounts of each mRNA relative to that of Hprt and represent means ± SD (*, p<0.05; Student’s t-test). Tg +/+, Tg-Cyp4f39+/+; Tg –/–, Tg-Cyp4f39–/–; MG, meibomian gland; BCL, basal cell layer; Ep, epithelium; St, stroma; En, endothelium.
Figure 4 with 1 supplement
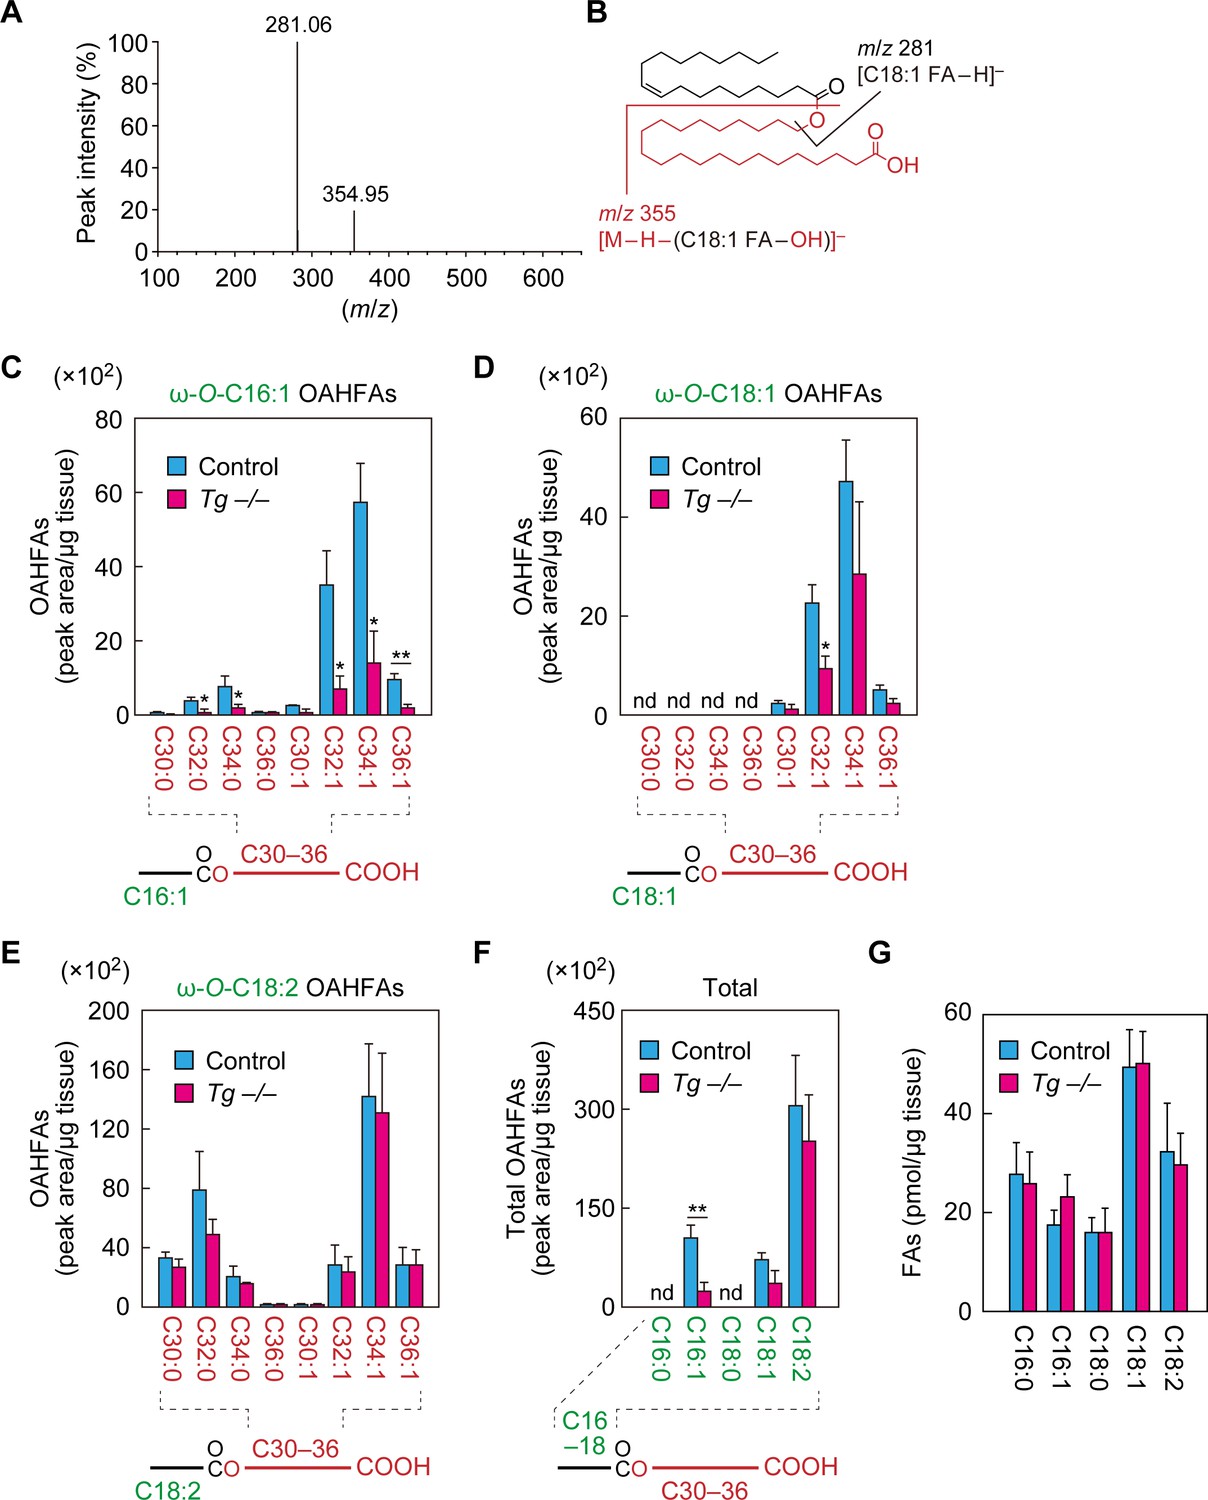
Reduction of C16:1 OAHFAs in meibomian glands from Cyp4f39-deficient mice.
(A, B) Product ion scanning of the OAHFA (O-C18:1)-ω-OH C22:0 FA was performed by LC-MS/MS by selecting the [M–H]– ion, with m/z 619.5, as a precursor ion. The MS spectrum (A) and the predicted cleavage positions (B) are shown. A synthesis scheme for OAHFA [(O-C18:1)-ω-OH C22:0 FA] is provided in Figure 4—figure supplement 1. (C–F) Lipids were extracted from the meibomian glands of 12-month-old control (Tg-Cyp4f39+/+ [n = 2] and Tg-Cyp4f39+/– [n = 1]) and Tg-Cyp4f39–/– (n = 3) mice. After derivatization with AMPP, OAHFAs containing C16:0 (F), C16:1 (C, F), C18:0 (F), C18:1 (D, F), and C18:2 (E, F) FA were analyzed by LC-MS/MS. The peak areas for OAHFA species that have different FA chain lengths and degrees of unsaturation (saturated or monounsaturated; panels [C–E]), and their total amounts (F) are shown. Values presented are means ± SD (*, p<0.05; **, p<0.01; Student’s t-test). The simplified structure for each OAHFA is shown below the graph. (G) Lipids extracted from the meibomian glands of 6–12-month-old Tg-Cyp4f39+/+ (n = 3) and Tg-Cyp4f39–/– mice (n = 3) were subjected to alkaline treatment and AMPP derivatization, and C16:0, C16:1, C18:0, C18:1, and C18:2 FAs were quantified using LC-MS/MS. Values are presented as means ± SD. nd, not detected; Tg –/–, Tg-Cyp4f39–/–.
Figure 4—figure supplement 1

Synthesis scheme of OAHFA ([O-C18:1]-ω-OH C22:0 FA).
Figure 5 with 3 supplements
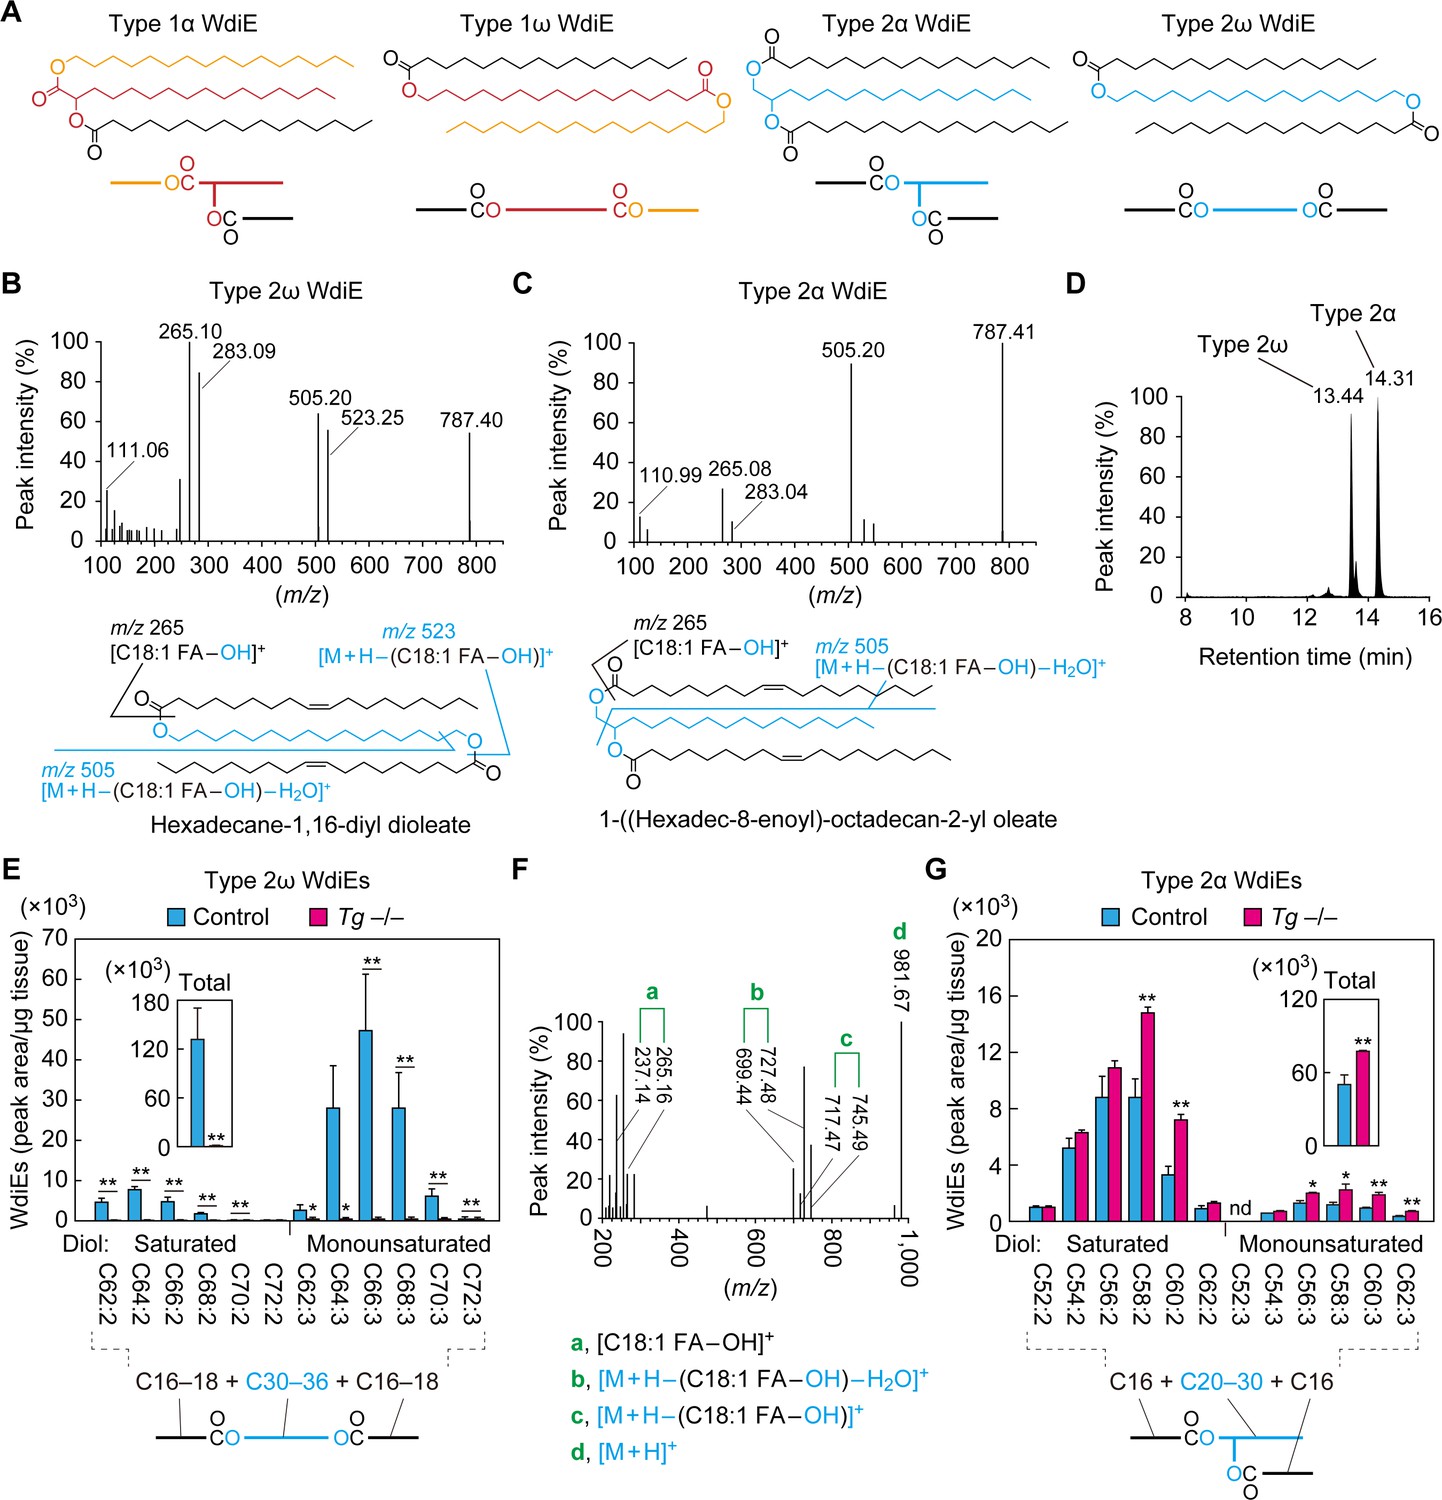
Absence of type 2ω WdiEs in meibomian glands from Cyp4f39-deficient mice.
(A) Structures and simplified structures of type 1α, 1ω, 2α and 2ω WdiEs. Blue, red, and orange represent fatty diols, hydroxy FAs, and FAls, respectively. (B–D) Product ion scanning of the type 2ω WdiE ([1,ω-O-C18:1]-C16:0) (B) and the type 2α WdiE [(1,α-O-C18:1)-C16:0] (C) was performed using LC-MS/MS by selecting [M + H]+ ions with m/z 787.7 as the precursor ions. The MS spectra (B, C), the predicted cleavage positions (B, C), and the LC chromatogram (D) are shown. Synthesis schemes for the type 2ω WdiE hexadecane-1,16-diyl dioleate ([1,ω-O-C18:1]-C16:0) and type 2α WdiE 1-([hexadec-8-enoyl]oxy)-octadecan-2-yl oleate ([1,α-O-C18:1]-C16:0), and their fragment predictions in MS product ion scanning are provided in Figure 5—figure supplements 1–3. (E–G) Lipids were extracted from the meibomian glands of 12-month-old control (Tg-Cyp4f39+/+ [n = 2] and Tg-Cyp4f39+/– [n = 1]) (E–G) and Tg-Cyp4f39–/– (n = 3) mice (E, G), and type 2ω WdiEs (E, F) and type 2α WdiEs (G) were analyzed by LC-MS/MS. (E, G) The peak areas of WdiE species of different chain lengths, with or without saturation, and their total amounts (insets) are shown. Values presented are means ± SD (*, p<0.05; **, p<0.01; Student’s t-test). The simplified structure representing each WdiE is shown below the graph. nd, not detected; Tg –/–, Tg-Cyp4f39–/–. (F) Product ion scanning was performed by selecting the [C66:3 WdiE + H]+ ion, which has an m/z value of 981.7, as the precursor ion. The MS spectrum of type 2ω C66:3 WdiE is shown.
Figure 5—figure supplement 1
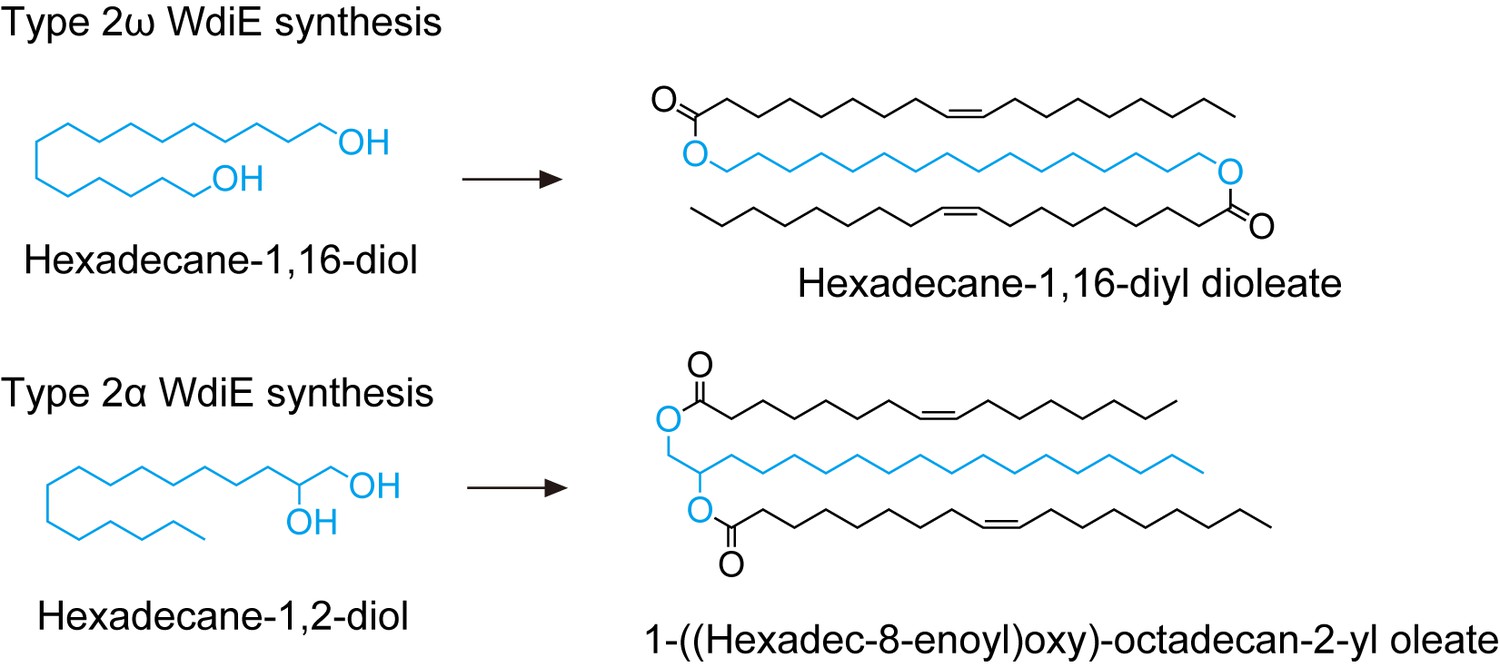
Synthesis schemes for type 2ω WdiE ([1,ω-O-C18:1]-C16:0) and type 2α WdiE ([1,α-O-C18:1]-C16:0).
Figure 5—figure supplement 2
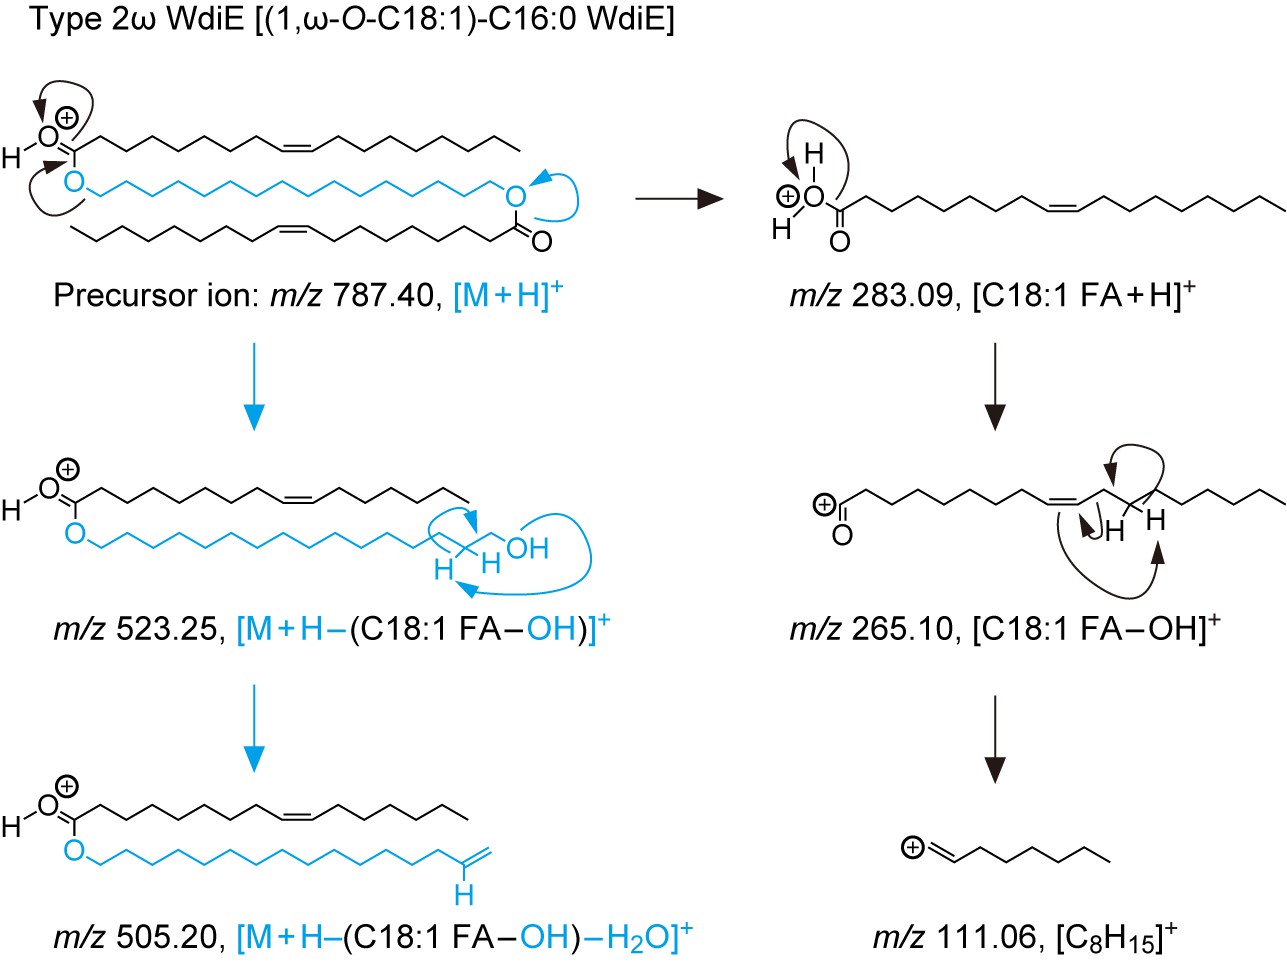
Predicted fragments from type 2ω WdiE.
Figure 5—figure supplement 3
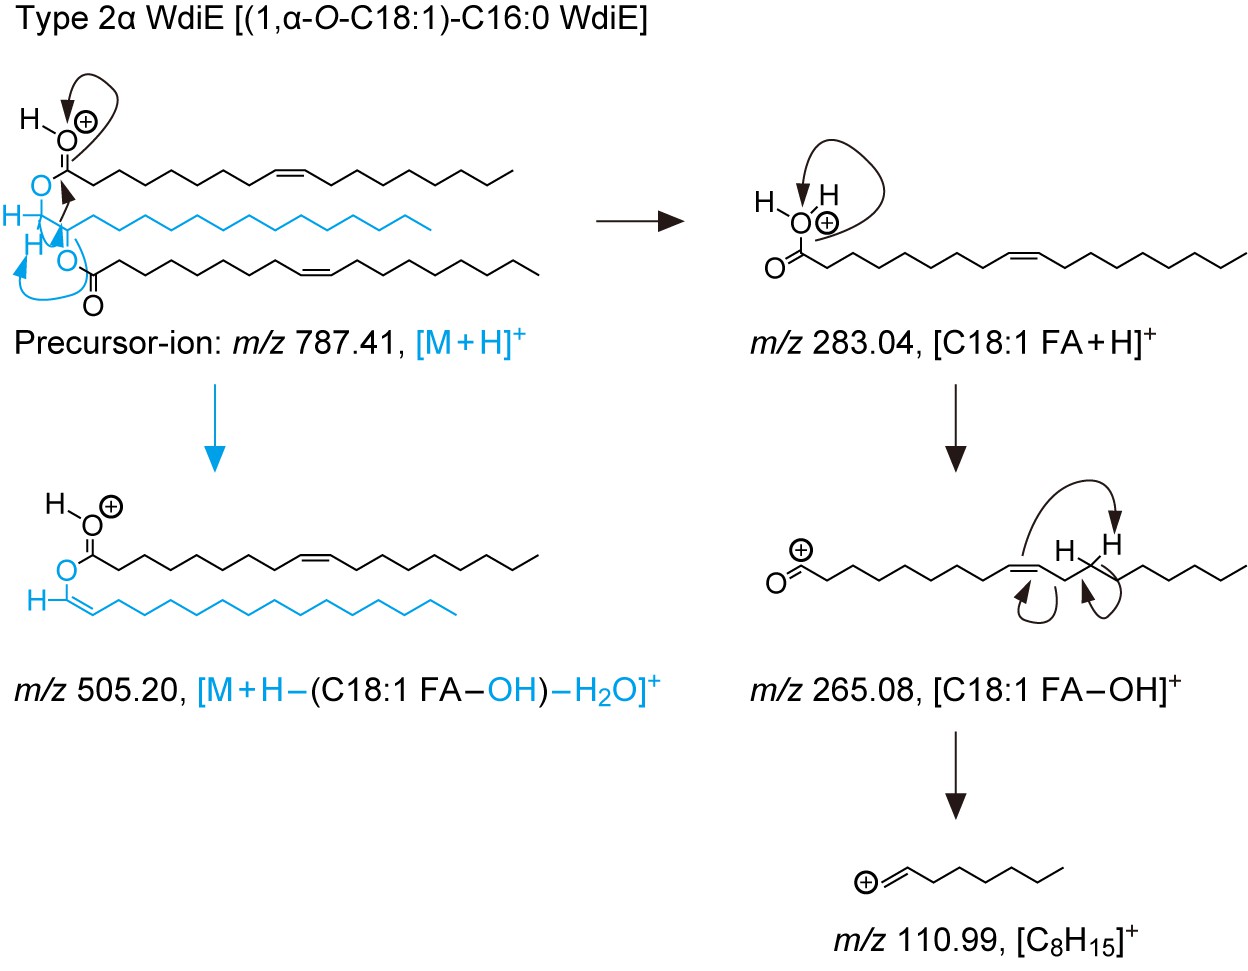
Predicted fragments from type 2α WdiE.
Figure 6
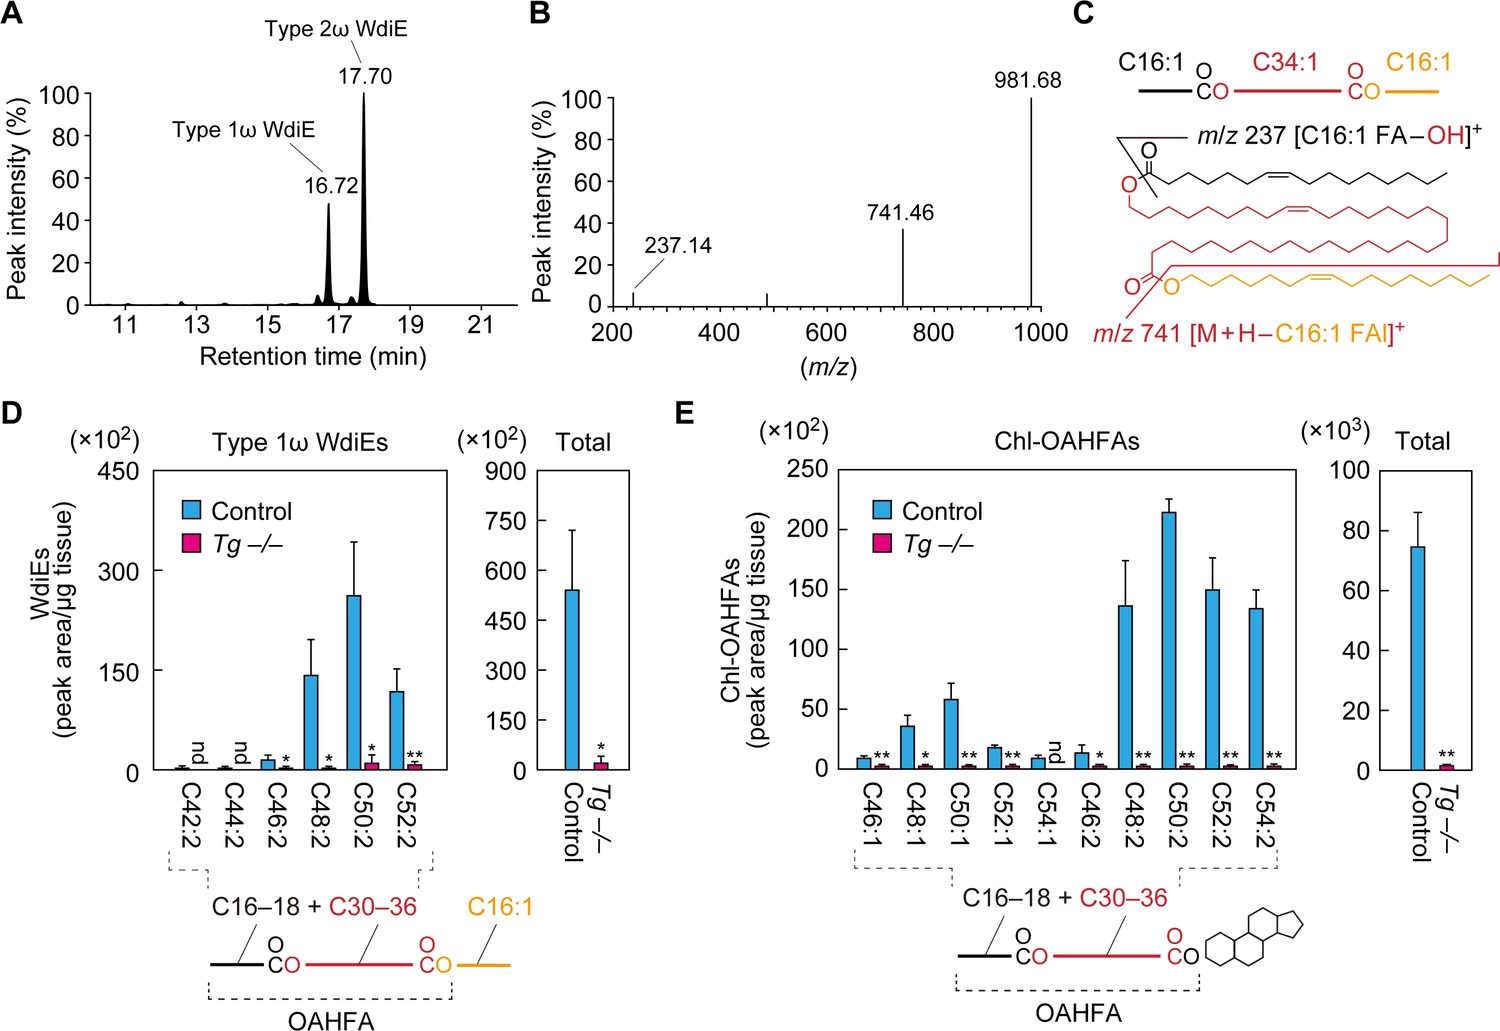
Absence of type 1ω WdiEs and Chl-OAHFAs in meibomian glands from Cyp4f39-deficient mice.
(A–C) Meibum lipids were prepared from 12-month-old Tg-Cyp4f39+/+ mice and subjected to product ion scanning by selecting the [C66:3 WdiE + H]+ ion, with an m/z value of 981.7, as the precursor ion. LC chromatogram of C66:3 WdiEs (A) and MS spectrum of type 1ω C66:3 WdiE (B) are shown. The structure of the type 1ω C66:3 WdiE is illustrated (C), as predicted from the fragment ion analysis in panel (B). (D, E) Lipids were extracted from the meibomian glands of 12-month-old control (Tg-Cyp4f39+/+ [n = 2] and Tg-Cyp4f39+/– [n = 1]) and Tg-Cyp4f39–/– (n = 3) mice. Then, type 1ω WdiEs (D) and Chl-OAHFAs (E) were analyzed by LC-MS/MS. The peak areas (left-hand panels) of lipid species with different chain lengths, with or without saturation, and their total amounts (right-hand panels) are shown. Values presented are means ± SD (*, p<0.05; **, p<0.01; Student’s t-test). The simplified structure of each lipid is shown below the graphs. nd, not detected; Tg –/–, Tg-Cyp4f39–/–.
Figure 7
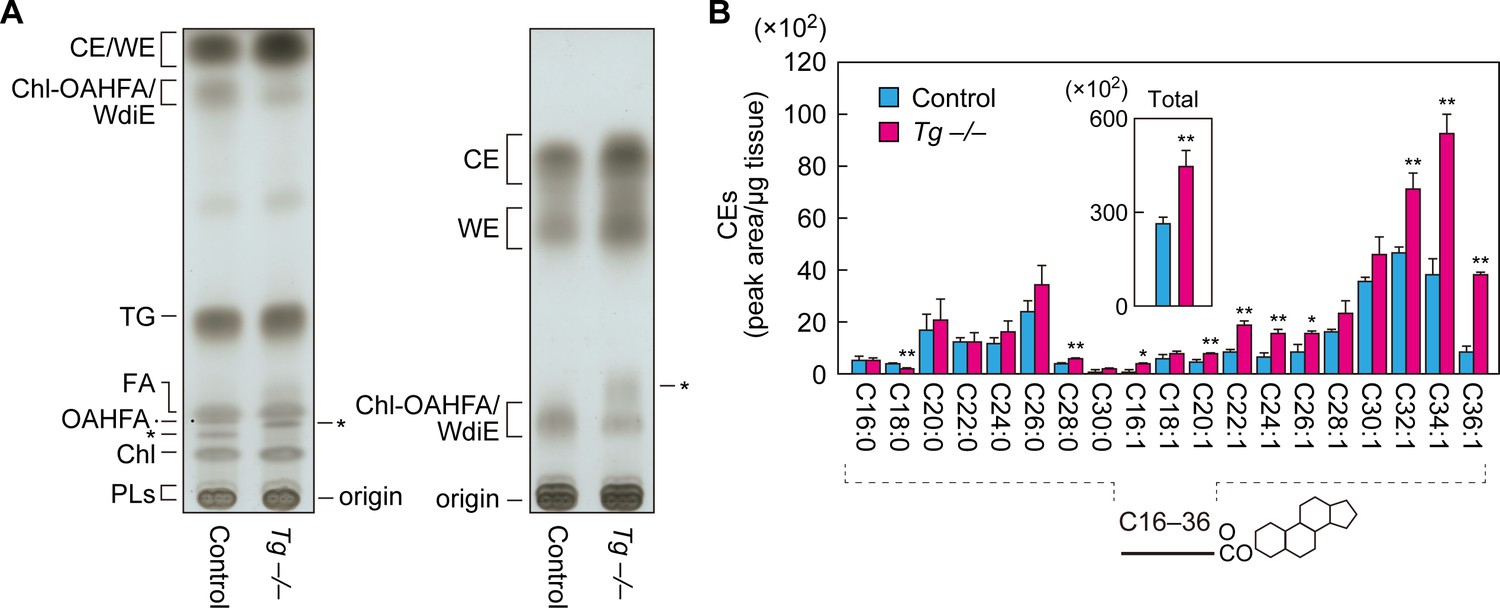
Increased CEs and WEs in Cyp4f39-deficient mice.
(A) Meibum lipids prepared from 12-month-old control (Tg-Cyp4f39+/+) and Tg-Cyp4f39–/– mice were separated by TLC using solution 1 (hexane/diethyl ether/acetic acid [90:25:1, v/v; left]) or solution 2 (hexane/toluene [1:1, v/v; right]) as the resolving solution, followed by detection using copper phosphate reagent. Asterisks indicate unknown lipids. (B) Lipids were extracted from the meibomian glands of 12-month-old control (Tg-Cyp4f39+/+ [n = 2] and Tg-Cyp4f39+/– [n = 1]) and Tg-Cyp4f39–/– (n = 3) mice, and CEs were analyzed by LC-MS/MS. The peak areas for CE species with different FA chain lengths, with or without saturation, and their total amounts (inset) are shown. Values presented are means ± SD (*, p<0.05; **, p<0.01; Student’s t-test). The simplified structure of CE is shown below the graph. Chl, cholesterol; TG, triglyceride; PL, phospholipid; Tg –/–, Tg-Cyp4f39–/–.
Figure 8
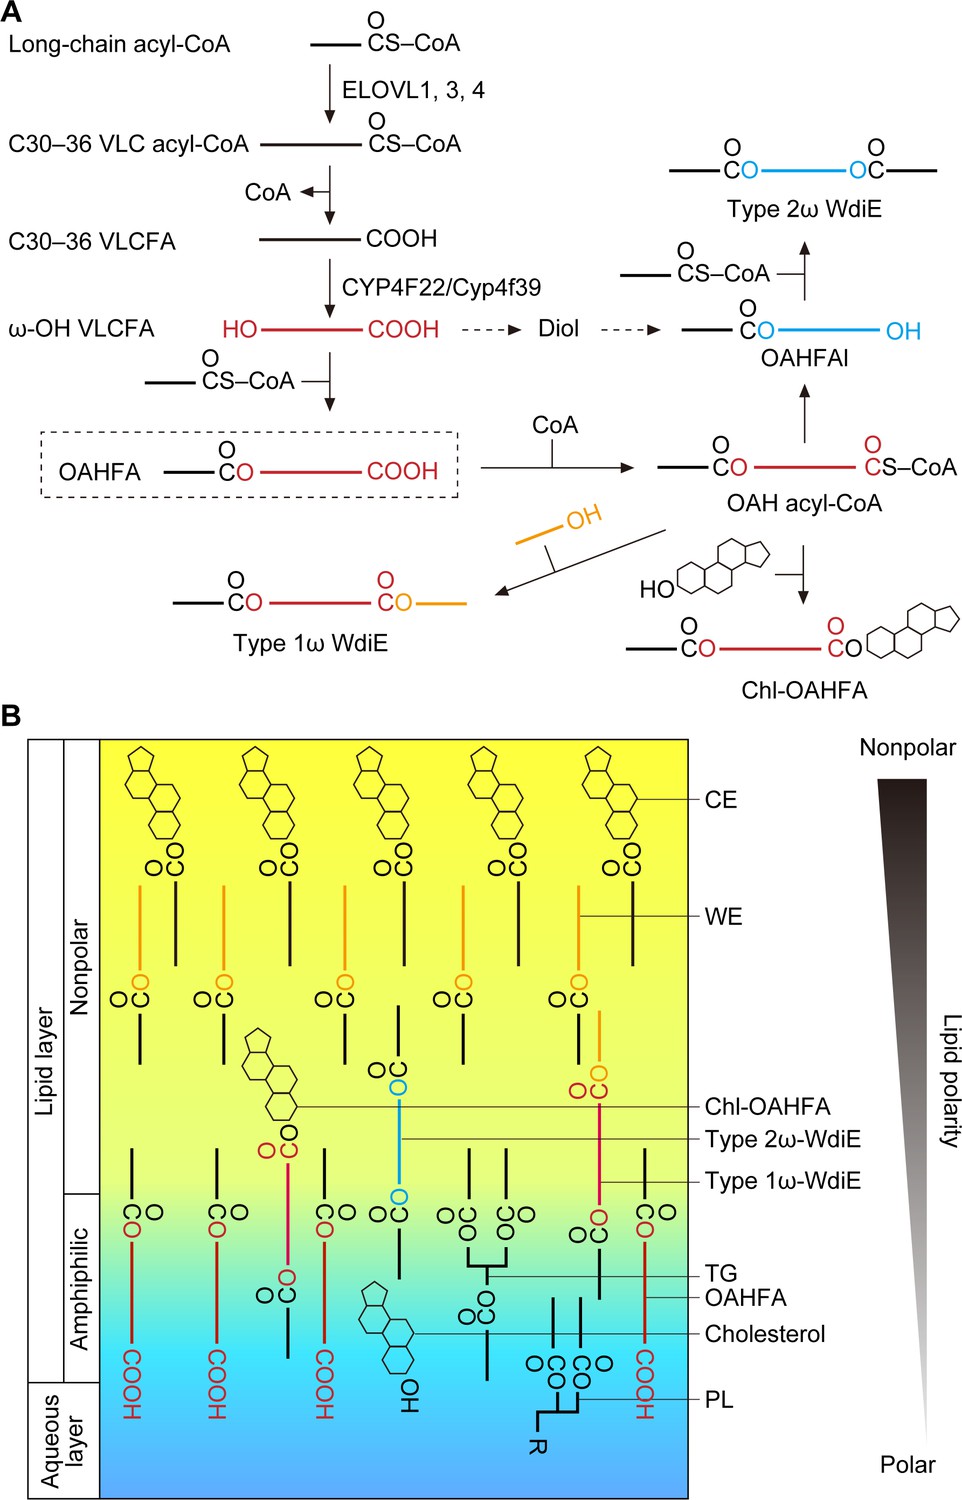
Models of the synthesis pathways of OAHFAs and their derivatives and of the lipid polarity gradient in TFLL.
(A) Model of synthesis pathways of OAHFAs and their derivatives. Meibum lipids are shown as simplified structures (red, ω-OH FA; orange, FAl; blue, fatty diol). (B) Model of lipid polarity gradient formation by meibum lipids in the TFLL. CEs and WEs, which have the lowest polarity among meibum lipids, form the nonpolar lipid sublayer that faces the external environment. OAHFAs, phospholipids (PLs), cholesterol, and triglycerides (TGs) form the amphiphilic lipid sublayer that contacts the aqueous layer. Chl-OAHFAs and WdiEs are located at the interface between these two sublayers and have a role in connecting them.
Tables
Table 1
FA composition of type 2ω/α WdiEs in meibum lipids and the most abundant molecular species predicted.
| WdiE type | Total carbon chain length and degree of unsaturation | FA composition (%) | The most abundant molecular species predicted | ||
|---|---|---|---|---|---|
| C16:1 FA | C18:1 FA | ω/α-OH diol | FAs | ||
| 2ω | C62:2 | 95 | 5 | C30:0 | C16:1–C16:1 |
| 2ω | C64:2 | 78 | 22 | C32:0 | C16:1–C16:1 |
| 2ω | C66:2 | 55 | 45 | C32:0 | C16:1–C18:1 |
| 2ω | C68:2 | 14 | 86 | C32:0 | C18:1–C18:1 |
| 2ω | C70:2 | 25 | 75 | C34:0 | C18:1–C18:1 |
| 2ω | C72:2 | 93 | 7 | C36:0 | C16:1–C20:1 |
| 2ω | C62:3 | 99 | 1 | C30:1 | C16:1–C16:1 |
| 2ω | C64:3 | 96 | 4 | C32:1 | C16:1–C16:1 |
| 2ω | C66:3 | 78 | 22 | C34:1 | C16:1–C16:1 |
| 2ω | C68:3 | 44 | 56 | C34:1 | C16:1–C18:1 |
| 2ω | C70:3 | 7 | 93 | C34:1 | C18:1–C18:1 |
| 2ω | C72:3 | 14 | 86 | C36:1 | C18:1–C18:1 |
| 2α | C52:2 | 98 | 2 | C20:0 | C16:1–C16:1 |
| 2α | C54:2 | 68 | 32 | C22:0 | C16:1–C16:1 |
| 2α | C56:2 | 91 | 9 | C24:0 | C16:1–C16:1 |
| 2α | C58:2 | 90 | 10 | C26:0 | C16:1–C16:1 |
| 2α | C60:2 | 70 | 30 | C28:0 | C16:1–C16:1 |
| 2α | C62:2 | 69 | 31 | C30:0 | C16:1–C16:1 |
| 2α | C54:3 | 90 | 10 | C22:1 | C16:1–C16:1 |
| 2α | C56:3 | 73 | 27 | C24:1 | C16:1–C16:1 |
| 2α | C58:3 | 98 | 2 | C26:1 | C16:1–C16:1 |
| 2α | C60:3 | 93 | 7 | C28:1 | C16:1–C16:1 |
| 2α | C62:3 | 83 | 17 | C30:1 | C16:1–C16:1 |
Key resources table
| Reagent type (species) or resource | Designation | Source or reference | Identifiers | Additional information |
|---|---|---|---|---|
| Mouse: M. musculus (C57BL/6J) | C57BL/6J; wildtype | Japan SLC | ||
| Mouse: M. musculus (C57BL/6J) | Cyp4f39+/– | Miyamoto et al., 2020 | ||
| Mouse: M. musculus (C57BL/6J) | Tg-Cyp4f39–/– | This study | ||
| Antibody | Mouse monoclonal anti-FLAG M2 | Merck | Cat# 3165 RRID:AB_259529 | (1 μg/mL) |
| Antibody | Mouse monoclonal anti-GAPDH 5A12 | FUJIFILM Wako Pure Chemical | Cat# 01625523 RRID:AB_2814991 | (1:2000) |
| Antibody | Anti-mouse IgG HRP-linked F(ab’)2 fragment | GE Healthcare Life Sciences | Cat# NA9310 RRID:AB_772193 | (1:7500) |
| Chemical compound, drug | Uranine (sodium fluorescein) | Tokyo Chemical Industry | Cat# F0096 | |
| Chemical compound, drug | Pentobarbital sodium salt | Tokyo Chemical Industry | Cat# P0776 | |
| Chemical compound, drug | Isoflurane | FUJIFILM Wako Pure Chemical | Cat# 099–06571 | |
| Chemical compound, drug | Super Fix | KURABO | Cat# KY-500 | |
| Chemical compound, drug | 22-Hydroxydocosanoic acid (ω-OH behenic acid) | Larodan | Cat# 14–2222 | |
| Chemical compound, drug | Triethylamine | FUJIFILM Wako Pure Chemical | Cat# 202–02646 | |
| Chemical compound, drug | Oleoyl chloride | FUJIFILM Wako Pure Chemical | Cat# 329–79572 | |
| Chemical compound, drug | 1,16-Hexadecanediol | Tokyo Chemical Industry | Cat# H0552 | |
| Chemical compound, drug | 1,2-Hexadecanediol | Tokyo Chemical Industry | Cat# H0993 | |
| Chemical compound, drug | 4-Dimethylaminopyridine | FUJIFILM Wako Pure Chemical | Cat# 040–19213 | |
| Commercial assay or kit | NucleoSpin RNA Kit | Machery-Nagel | Cat# U0955C | |
| Commercial assay or kit | One Step TB Green PrimeScript RT-PCR Kit II | Takara Bio | Cat# RR086A | |
| Commercial assay or kit | AMP+ MaxSpec Kit | Cayman Chemical | Cat# 710000 | |
| Recombinant DNA reagent | pCE-puro 3×FLAG-1 | Kihara et al., 2006 | ||
| Recombinant DNA reagent | pCE-puro 3×FLAG-Cyp4f39 | This study | ||
| Recombinant DNA reagent | pH3700-pL2 | Carroll et al., 1993 | ||
| Recombinant DNA reagent | pH3700-pL2−3×FLAG-Cyp4f39 | This study | ||
| Software, algorithm | MassLynx software | Waters | RRID:SCR_014271 | |
| Software, algorithm | Microsoft Excel software | Microsoft | RRID:SCR_016137 | |
| Software, algorithm | JMP13 software | SAS Institute |
Additional files
-
Supplementary file 1
List of oligonucleotides used.
- https://cdn.elifesciences.org/articles/53582/elife-53582-supp1-v1.docx
-
Supplementary file 2
Selected m/z values for AMPP-OAHFAs in MS/MS analysis.
- https://cdn.elifesciences.org/articles/53582/elife-53582-supp2-v1.docx
-
Supplementary file 3
Selected m/z values for type 2ω/α WdiEs in MS/MS analysis.
- https://cdn.elifesciences.org/articles/53582/elife-53582-supp3-v1.docx
-
Supplementary file 4
Selected m/z values for type 1ω WdiEs in MS/MS analysis.
- https://cdn.elifesciences.org/articles/53582/elife-53582-supp4-v1.docx
-
Supplementary file 5
Selected m/z values for Chl-OAHFAs in MS/MS analysis.
- https://cdn.elifesciences.org/articles/53582/elife-53582-supp5-v1.docx
-
Supplementary file 6
Selected m/z values for CEs in MS/MS analysis.
- https://cdn.elifesciences.org/articles/53582/elife-53582-supp6-v1.docx
-
Transparent reporting form
- https://cdn.elifesciences.org/articles/53582/elife-53582-transrepform-v1.docx
Download links
A two-part list of links to download the article, or parts of the article, in various formats.
Downloads (link to download the article as PDF)
Open citations (links to open the citations from this article in various online reference manager services)
Cite this article (links to download the citations from this article in formats compatible with various reference manager tools)
Lipid polarity gradient formed by ω-hydroxy lipids in tear film prevents dry eye disease
eLife 9:e53582.
https://doi.org/10.7554/eLife.53582


