Quantitative analysis of how Myc controls T cell proteomes and metabolic pathways during T cell activation
- Cell Signalling and Immunology Division, School of Life Sciences, University of Dundee, United Kingdom
Figures
Figure 1 with 2 supplements

Myc controls cell growth by selectively remodelling T cell proteomes.
(A) Forward scatter area (FSC-A) of IL-7 maintained or 24 hr anti-CD3 + anti-CD28 (TCR) activated Cd4Cre+ (MycWT) and Cd4Cre+Mycfl/fl (MyccKO) T cells. (B–C, E–O) Quantitative proteomics data of ex vivo naïve WT and 24 hr TCR activated CD4+ and CD8+ T cells from MycWT and MyccKO mice. (B) Total protein content (µg/million cells). (C) Mean protein copy number per cell estimated using proteomic ruler (Wiśniewski et al., 2014) of Myc. (D) Myc expression measured by flow cytometry in 24 hr TCR activated MycWT and MyccKO CD4+ and CD8+ T cells. Proteins from 24 hr TCR activated MycWT (E) CD8+ and (F) CD4+ T cells were ranked by mass contribution and the mean cumulative protein mass was plotted against protein rank (left panel). Numbers in each quartile indicate total proteins summed with those in the quartiles below. Volcano plots show foldchange in protein copy number between TCR activated MyccKO and MycWT T cells, with proteins that contribute the top 75% of the T cell mass shown in red (right panel). (G) Heat maps of naïve and TCR activated MycWT and MyccKO CD8+ and CD4+ proteomes. Relative protein abundance is graded from low (blue) to high (yellow) per row. Input data for heatmaps is listed in Supplementary file 1. Mean protein copy number per cell for activation markers (H) IL7ra (J) CD69 and (K) CD44 and key transcription factors (I) Klf2, (L) Rel, (M) JunB, (N) Tbet, and (O) Irf4. Symbols on bar charts represent biological replicates: error bars show mean ± S.E.M. Quantitative proteomics was performed on biological triplicates. Fold-change calculations and statistical testing comparing naïve WT vs TCR MycWT, naïve WT vs TCR MyccKO, and TCR MycWT vs TCR MyccKO protein copy number per cell is listed in Supplementary file 1.
Figure 1—figure supplement 1
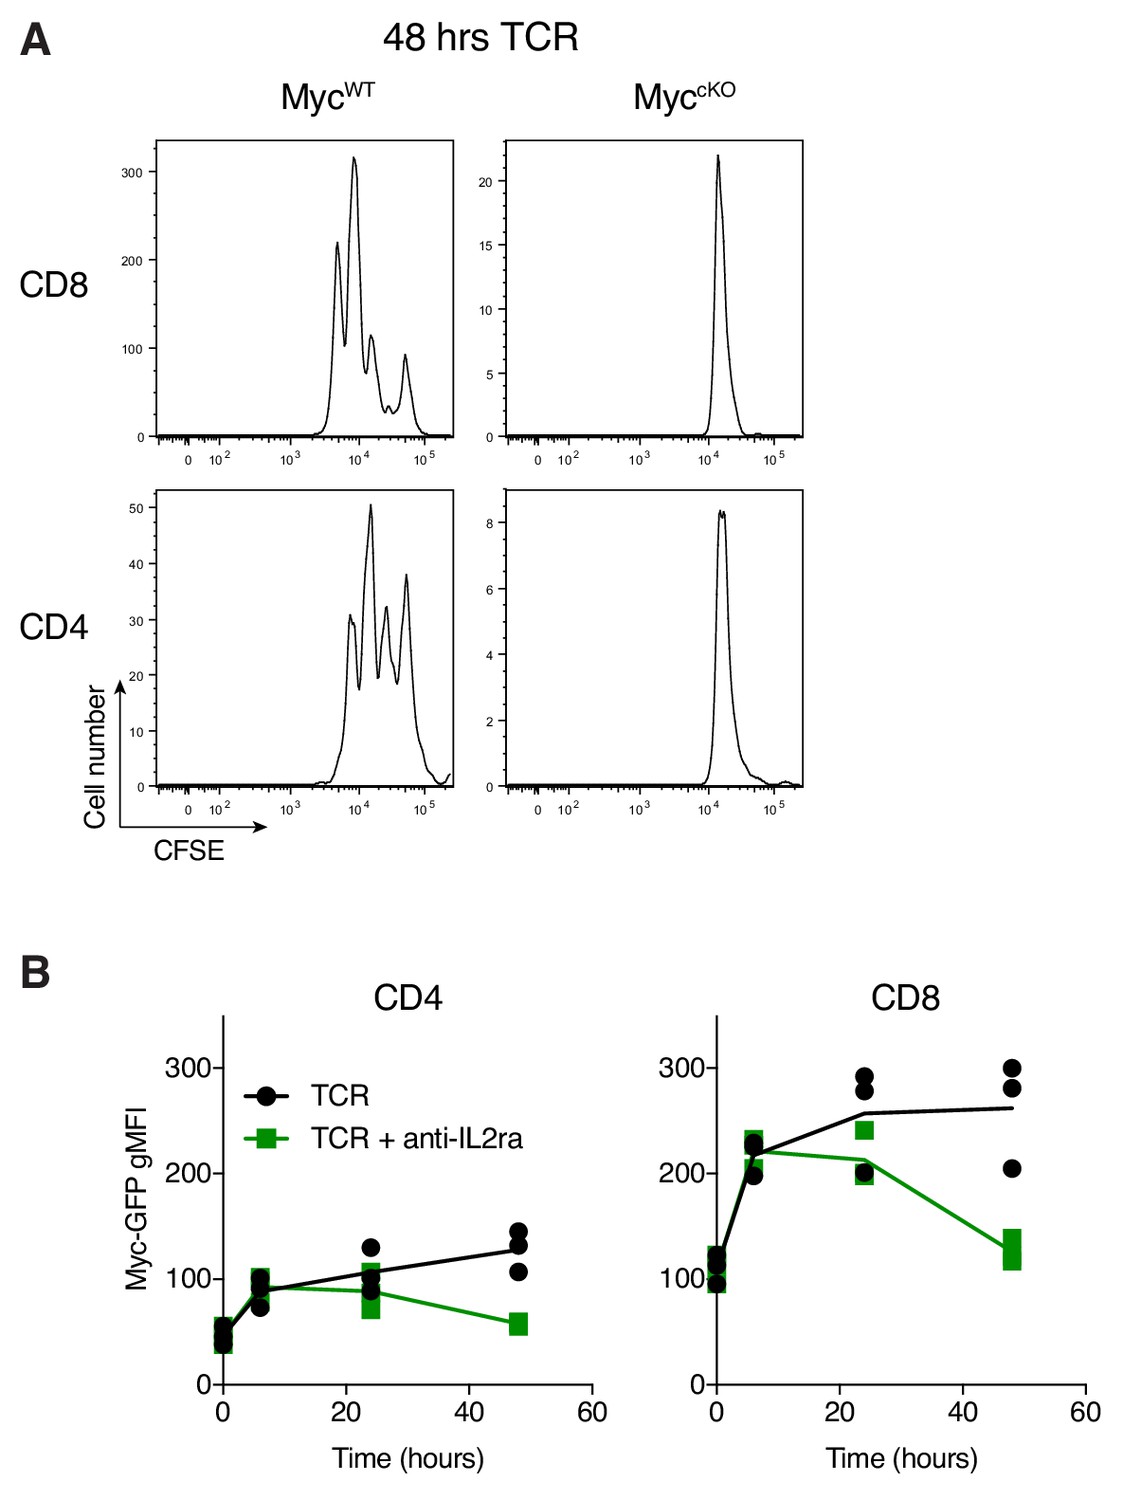
Immune activated Myc-deficient T cells fail to proliferate.
(A) CFSE labelled lymph node cells from Cd4Cre+ (MycWT) and Cd4Cre+ Mycfl/fl (MyccKO) mice were stimulated with anti-CD3 and anti-CD28 (both 0.5 µg/mL) for 48 hr and CFSE dilution was measured. Representative of technical duplicate plots. (B) Lymph node cells from GFP-MycKI mice were stimulated with anti-CD3 (1 µg/ml) and anti-CD28 (3 µg/ml) in the presence of IL-2 receptor-blocking antibody PC61 (2 µg/ml) or isotype control and GFP-Myc expression was measured over time. Symbols show biological replicates.
Figure 1—figure supplement 2
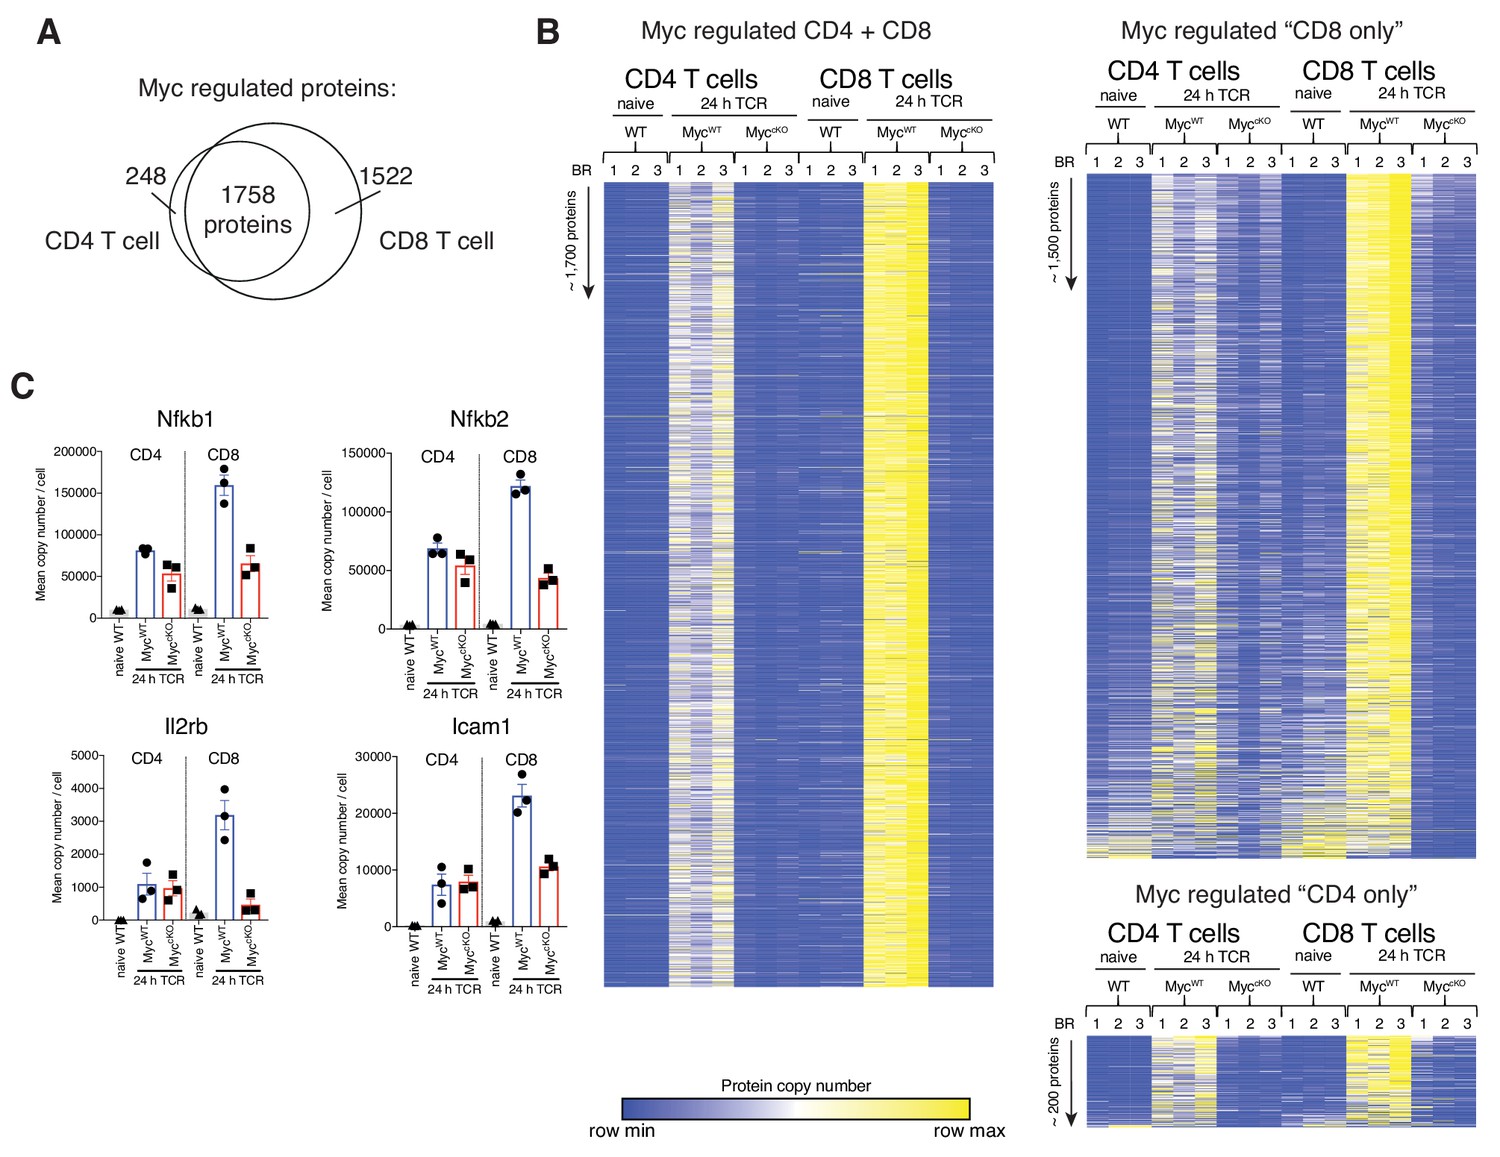
Myc-deficiency has a larger quantitative effect in CD8+ T cells.
Naïve WT and 24 hr TCR activated MycWT and MyccKO proteomic data was generated as described in Figure 1 and Materials and methods. (A) Venn diagram showing that there were a larger number of proteins that were classified as differentially regulated in CD8+ T cells compared to CD4+ T cells, where differentially regulated is defined as proteins that were more than 2-fold regulated and p<0.05 between MycWT vs MyccKO TCR activated conditions. (B) Heat maps of proteins that were Myc-regulated in CD4+ T cells only, both CD4+ and CD8+ T cells or CD8+ T cells only show similar qualitative effects of Myc-deficiency for most proteins. Relative protein abundance is graded from low (blue) to high (yellow) per row. (C) Mean copy number per cell for examples of proteins classified as Myc-regulated in CD8+ T cells only. Protein expression was much higher in MycWT CD8 T cells compared MycWT CD4+ T cells, whereas expression levels in MyccKO CD4+ and CD8+ T cells are reduced to a similar extent thus giving a larger quantitative effect of Myc-deficiency in CD8+ T cells. Examples include important transcription factors such as Nfkb1 and Nfkb2, the integrin Icam1 and cytokine receptor components such as Il2rb. Symbols show biological replicates. Mean ± S.E.M. Fold-change calculations and statistical testing comparing naïve WT vs TCR MycWT, naïve WT vs TCR MyccKO, and TCR MycWT vs TCR MyccKO protein copy number per cell is listed in Supplementary file 1.
Figure 2
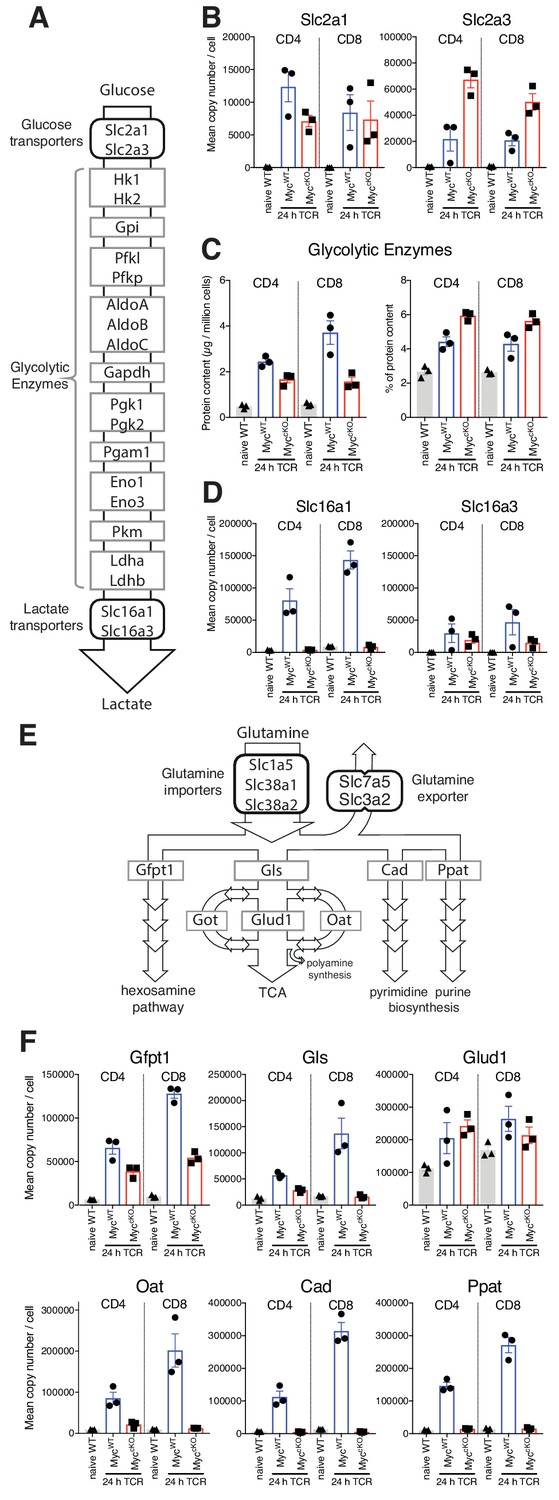
Myc control of T cell metabolism is selective.
Naïve WT and 24 hr TCR activated MycWT and MyccKO CD4+ and CD8+ T cell proteomic data was generated as described in Figure 1 and Materials and methods. (A) schematic of nutrient transporters and enzymes involved in glycolysis. (B) Mean copy number per cell for glucose transporters Slc2a1 and Slc2a3. (C) Total protein content (µg/million cells) (left panel) and % contribution to total cellular protein mass (right panel) of total glycolytic enzymes. (D) Mean protein copy number per cell for lactate transporters Slc16a1 and Slc16a3. (E) Schematic of transporters and enzymes involved in Glutamine transport and metabolism. (F) Mean copy number per cell for major enzymes involved in glutamine metabolism. Symbols on bar charts represent biological replicates from biological triplicate data, error bars show mean ± S.E.M. Fold-change calculations and statistical testing comparing naïve WT vs TCR MycWT, naïve WT vs TCR MyccKO, and TCR MycWT vs TCR MyccKO protein copy number per cell is listed in Supplementary file 1.
Figure 3 with 4 supplements
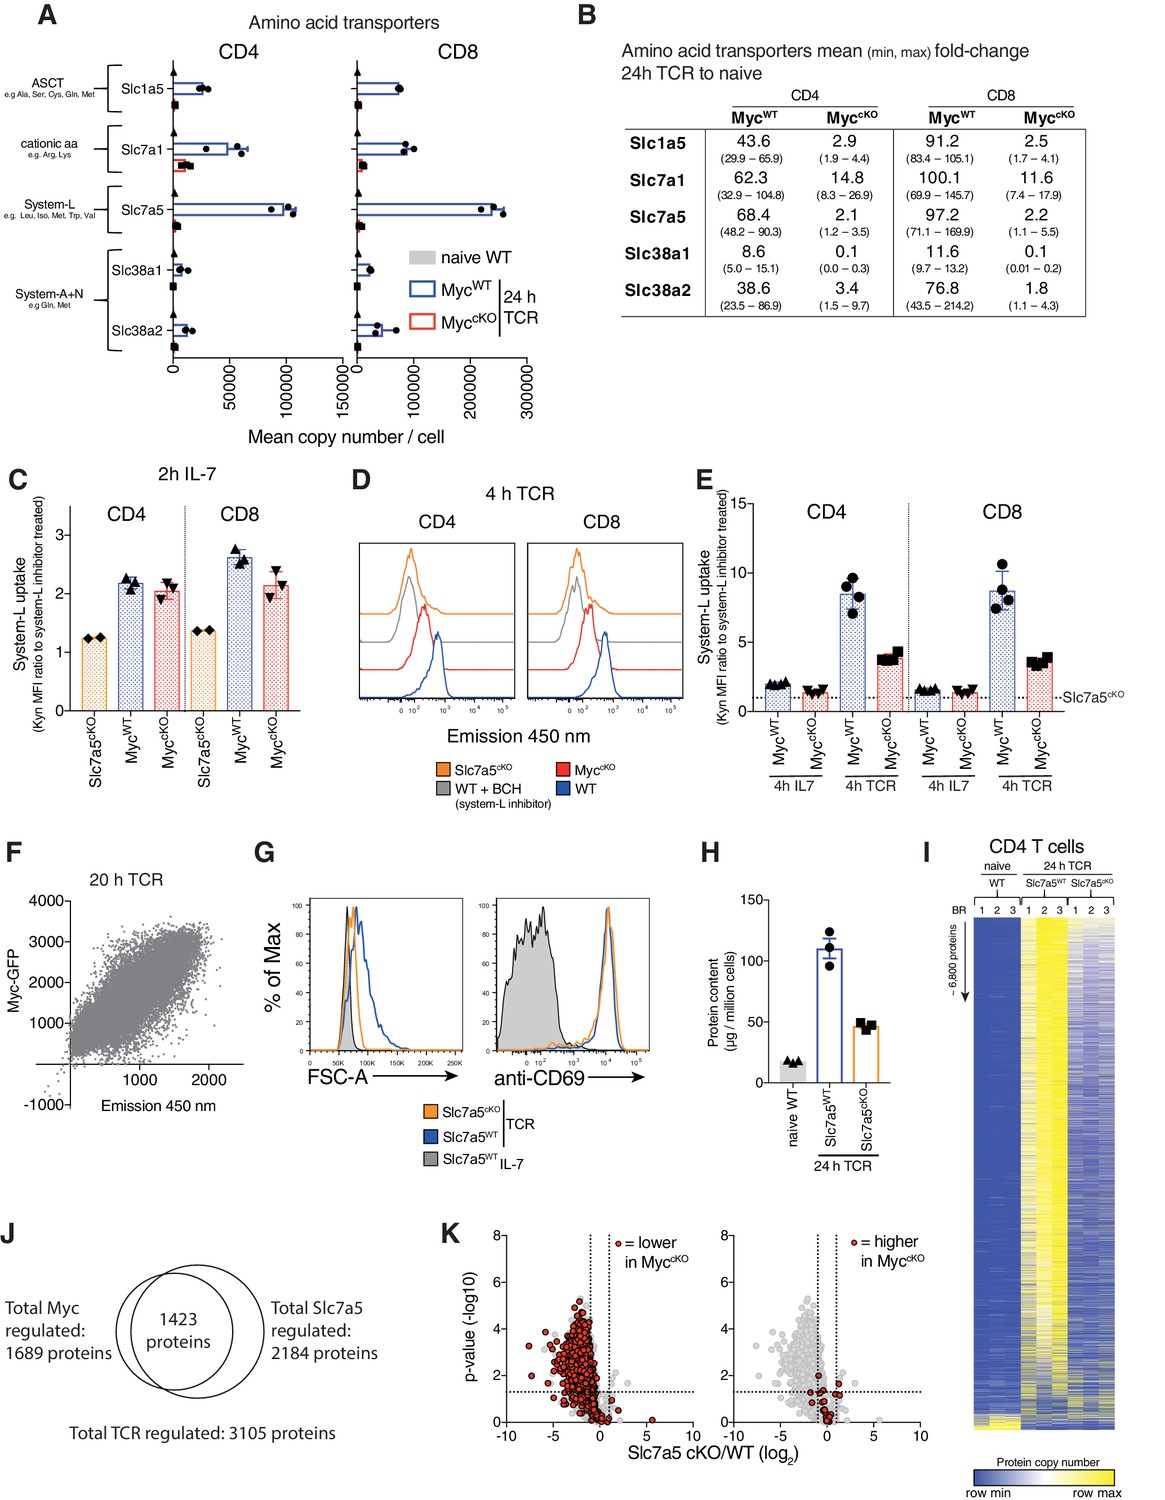
Myc induces amino acid transporter expression, a critical step for proteome remodelling.
Naïve WT and 24 hr TCR activated MycWT and MyccKO CD4+ and CD8+ T cell proteomic data was generated as described in Figure 1 and Materials and methods. (A) Mean copy number per cell of abundant amino acid transporters in T cells. (B) Fold-change in amino acid transporter protein copy number from naïve WT to 24 hr TCR activated MycWT and MyccKO, mean (min, max). Transport by system L amino acid transporters was measured by uptake of fluorescent (emission 450 nm when excited at 405 nm) Tryptophan metabolite, Kynurenine (Kyn) (Sinclair et al., 2018) in (C) 2 hr IL-7 maintained and (D-E) 4 hr IL-7 maintained or TCR activated splenic CD4+ and CD8+ WT, MyccKO and Slc7a5cKO T cells or (F) 20 hr TCR activated Myc-GFP reporter CD4+ T cells. In (C,E) system-L uptake is represented as the ratio of BCH (a system L inhibitor) untreated: treated T cells. In (E) dotted line indicates Slc7a5cKO uptake level. (G) Forward scatter and CD69 expression of IL-7 maintained or 24 hr TCR activated wild-type and Slc7a5cKO (Cd4Cre+ Slc7a5fl/fl) T cells. (H-K) Quantitative proteomics data of naïve WT and 24 hr TCR activated CD4+ and CD8+ T cells from Ly5.1 (Slc7a5WT) and Slc7a5cKO mice. Baseline naïve WT data is the same as used for the MyccKO dataset. (H) Total protein content (µg/million cells). (I) Heat map of naïve and TCR activated Slc7a5WT and Slc7a5cKO CD4+ T cell proteomes. Relative protein abundance is graded from low (blue) to high (yellow) per row. Input data for heatmaps is listed in Supplementary file 1. (J) Venn diagram showing the overlap in TCR regulated proteins that are more than 2-fold regulated and p<0.05 in MycWT vs MyccKO and Slc7a5WT vs Slc7a5cKO TCR activated CD4+ T cells. (K) Volcano plots of TCR regulated proteins comparing Slc7a5WT and Slc7a5cKO datatsets. Proteins > 2 fold different between MycWT and MyccKO TCR activated T cells are highlighted in red; proteins reduced in the MyccKO (left panel), proteins higher MyccKO (right panel). Symbols in bar charts represent biological replicates: error bars show mean ± S.E.M. Dot plot in (F) is representative of biological triplicate data. Quantitative proteomics was performed on biological triplicates. Fold-change calculations and statistical testing comparing naïve WT vs TCR MycWT, naïve WT vs TCR MyccKO, TCR MycWT vs TCR MyccKO, naïve WT vs TCR Slc7a5WT, naïve WT vs TCR Slc7a5cKO and TCR Slc7a5WT vs TCR Slc7a5cKO protein copy number per cell is listed in Supplementary file 1.
Figure 3—figure supplement 1
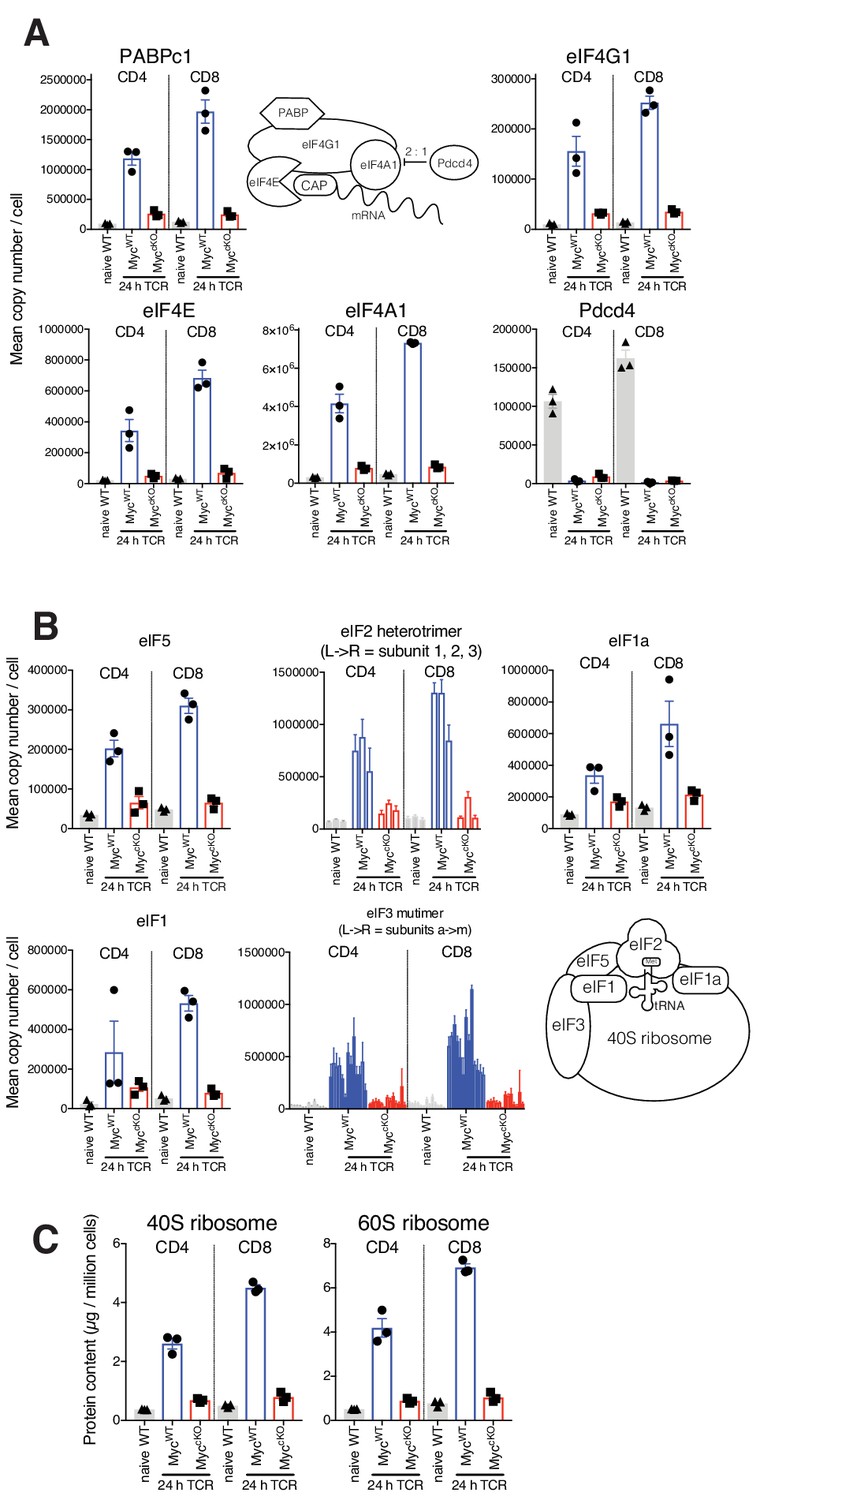
Myc-deficient T cells fail to induce protein translation machinery.
Naïve WT and 24 hr TCR activated MycWT and MyccKO proteomic data was generated as described in Figure 1 and Materials and methods. Diagram and mean copy number per cell of (A) translation initiation complex and (B) 43S preintiaition complex components. (C) Protein content of 40S and 60S ribosome (µg/million cells). Symbols show biological replicates. Mean ± S.E.M. Fold-change calculations and statistical testing comparing naïve WT vs TCR MycWT, naïve WT vs TCR MyccKO, and TCR MycWT vs TCR MyccKO protein copy number per cell is listed in Supplementary file 1.
Figure 3—figure supplement 2
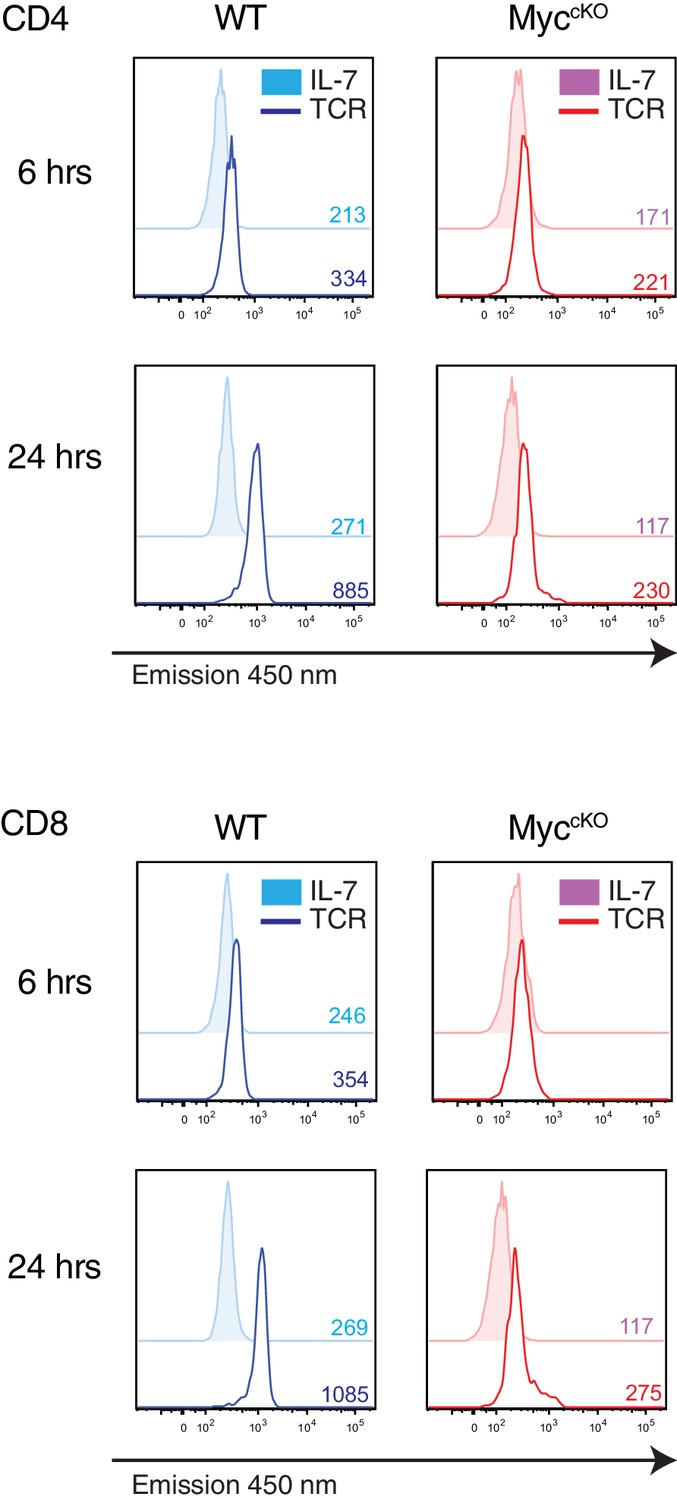
Amino acid transport capacity corresponds with transporter number.
Transport by system L amino acid transporters was measured by uptake of fluorescent (emission 450 nm when excited at 405 nm) Tryptophan metabolite, Kynurenine (Kyn) in 6 or 24 hr IL-7 maintained or anti-CD3/anti-CD28 (TCR) activated CD4+ and CD8+ WT and MyccKO T cells. Histograms are representative of at least three biological replicates.
Figure 3—figure supplement 3
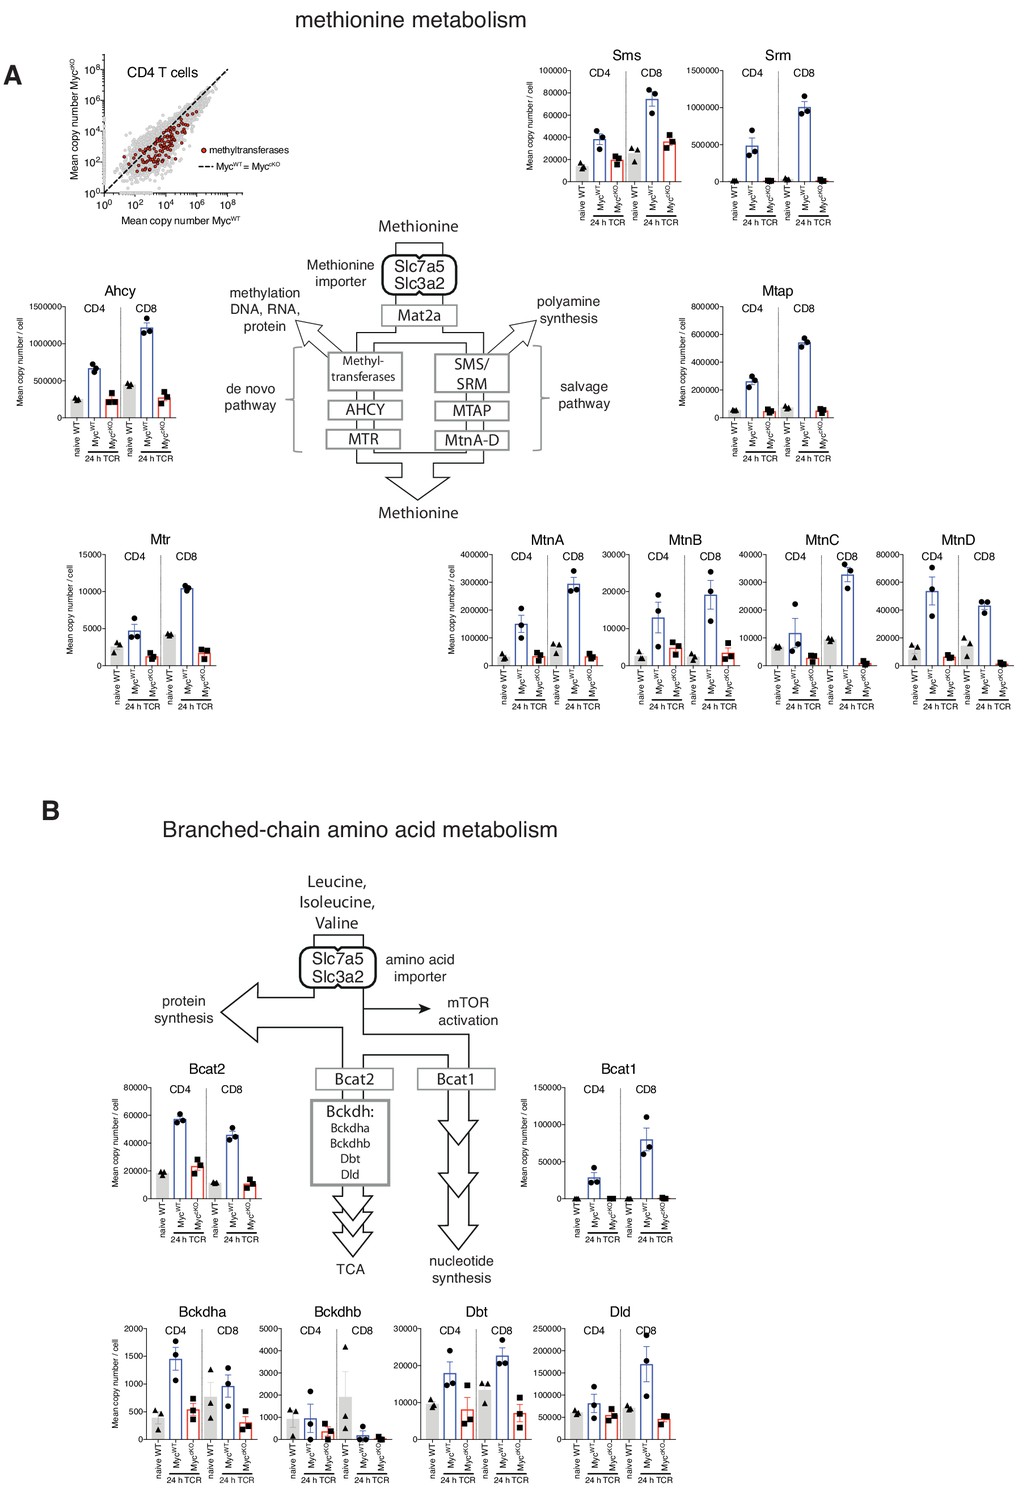
Myc-deficient T cells fail to induce Branched-chain amino acid and Methionine metabolism.
Naïve WT and 24 hr TCR activated MycWT and MyccKO proteomic data was generated as described in Figure 1 and Materials and methods. Diagram and mean copy number per cell of proteins involved in (A) Methionine metabolism and (B) Branched-chain amino acid metabolism. Symbols show biological replicates. Mean ± S.E.M. Fold-change calculations and statistical testing comparing naïve WT vs TCR MycWT, naïve WT vs TCR MyccKO, and TCR MycWT vs TCR MyccKO protein copy number per cell is listed in Supplementary file 1.
Figure 3—figure supplement 4
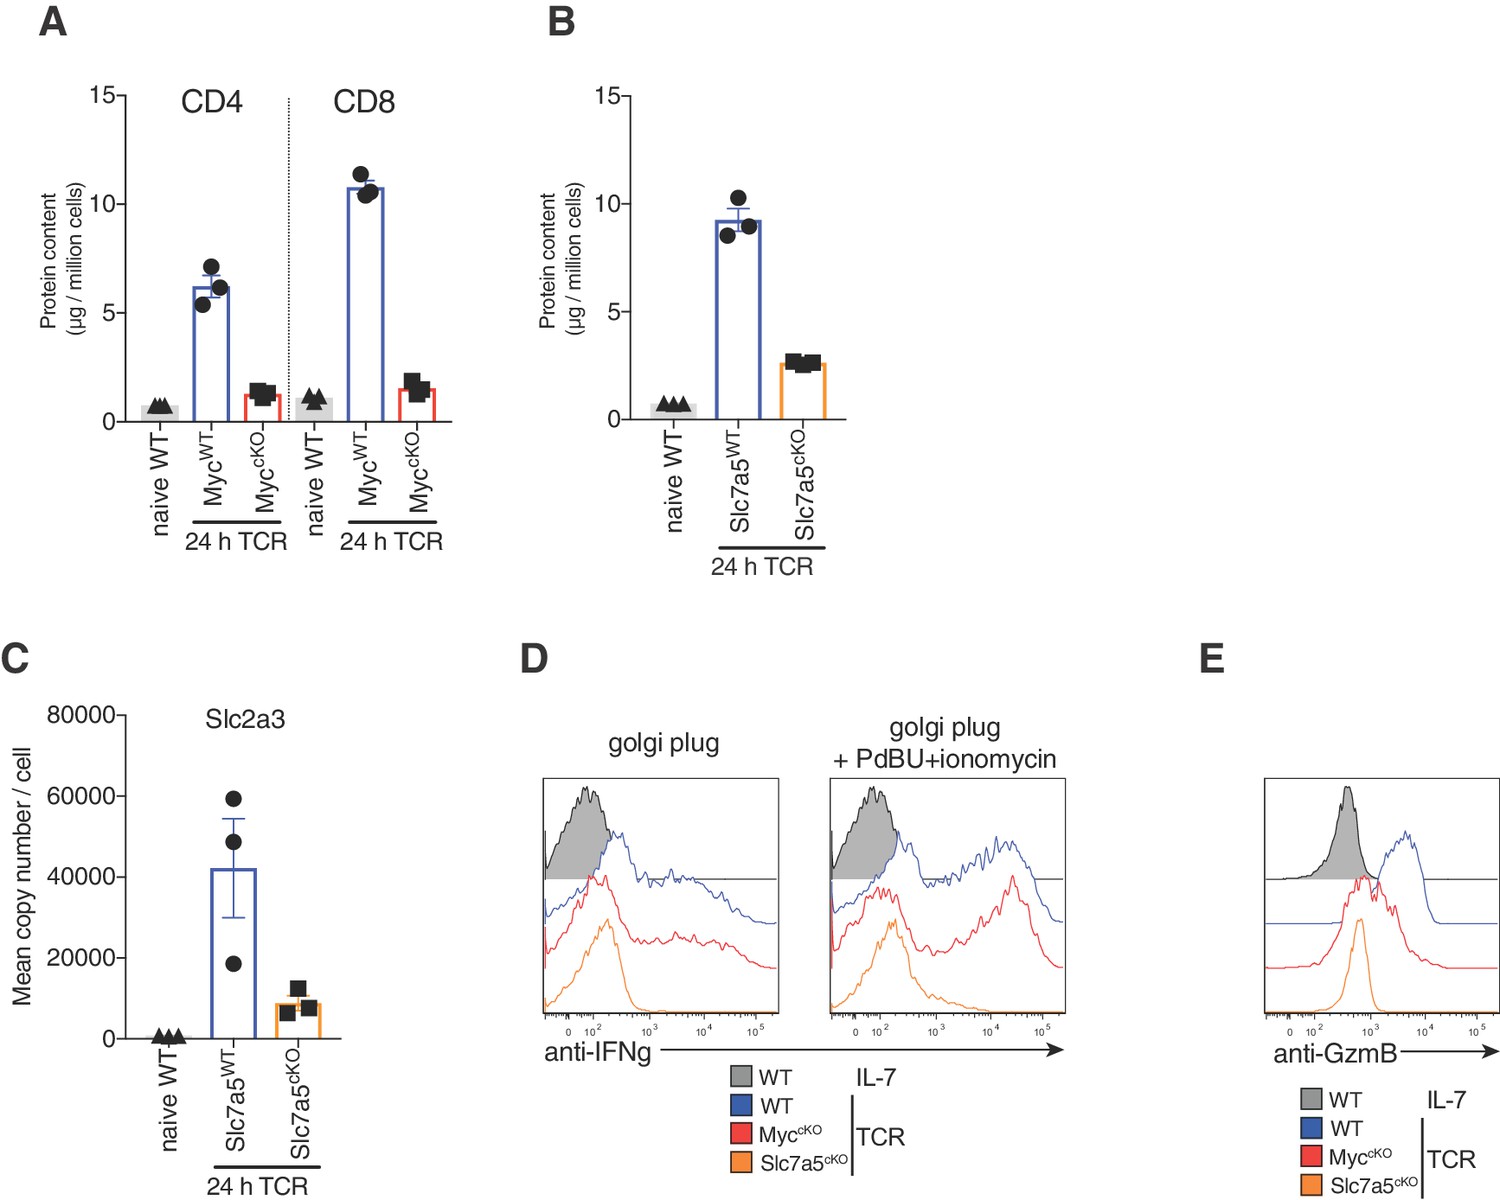
Ribosome expression is reduced in both Myc and Slc7a5 deficient T cells, but other proteins are differentially regulated between Myc and Slc7a5 deficient T cells.
(A) Protein content of ribosomes (excluding mitochondrial) from naïve WT and 24 hr TCR activated MycWT and MyccKO proteomics data (generated as described in Figure 1 and Materials and methods). (B) Protein content of ribosomes (excluding mitochondrial) and (C) Slc2a3 mean copy number per cell from naïve WT and 24 hr TCR activated Slc7a5WT and Slc7a5cKO proteomics data (generated as described in Figure 3 and Materials and methods). Symbols show biological replicates. Mean ± S.E.M. Fold-change calculations and statistical testing comparing naïve WT vs TCR MycWT, naïve WT vs TCR MyccKO, TCR MycWT vs TCR MyccKO, naïve WT vs TCR Slc7a5WT, naïve WT vs TCR Slc7a5cKO and TCR Slc7a5WT vs TCR Slc7a5cKO protein copy number per cell is listed in Supplementary file 1. Splenocytes from MycWT, MyccKO and Slc7a5cKO were stimulated with anti-CD3 and anti-CD28 for 24 hr and; (D) Golgi plug with or without PdBU and ionomycin was added to the cultures for the last 4 hr prior to harvest and IFNgamma expression was measured in CD8+ T cells by flow cytometry; or (E) Granzyme B was measured in CD8+ T cells by flow cytometry. Histograms are representative of at least three biological replicates.
Figure 4
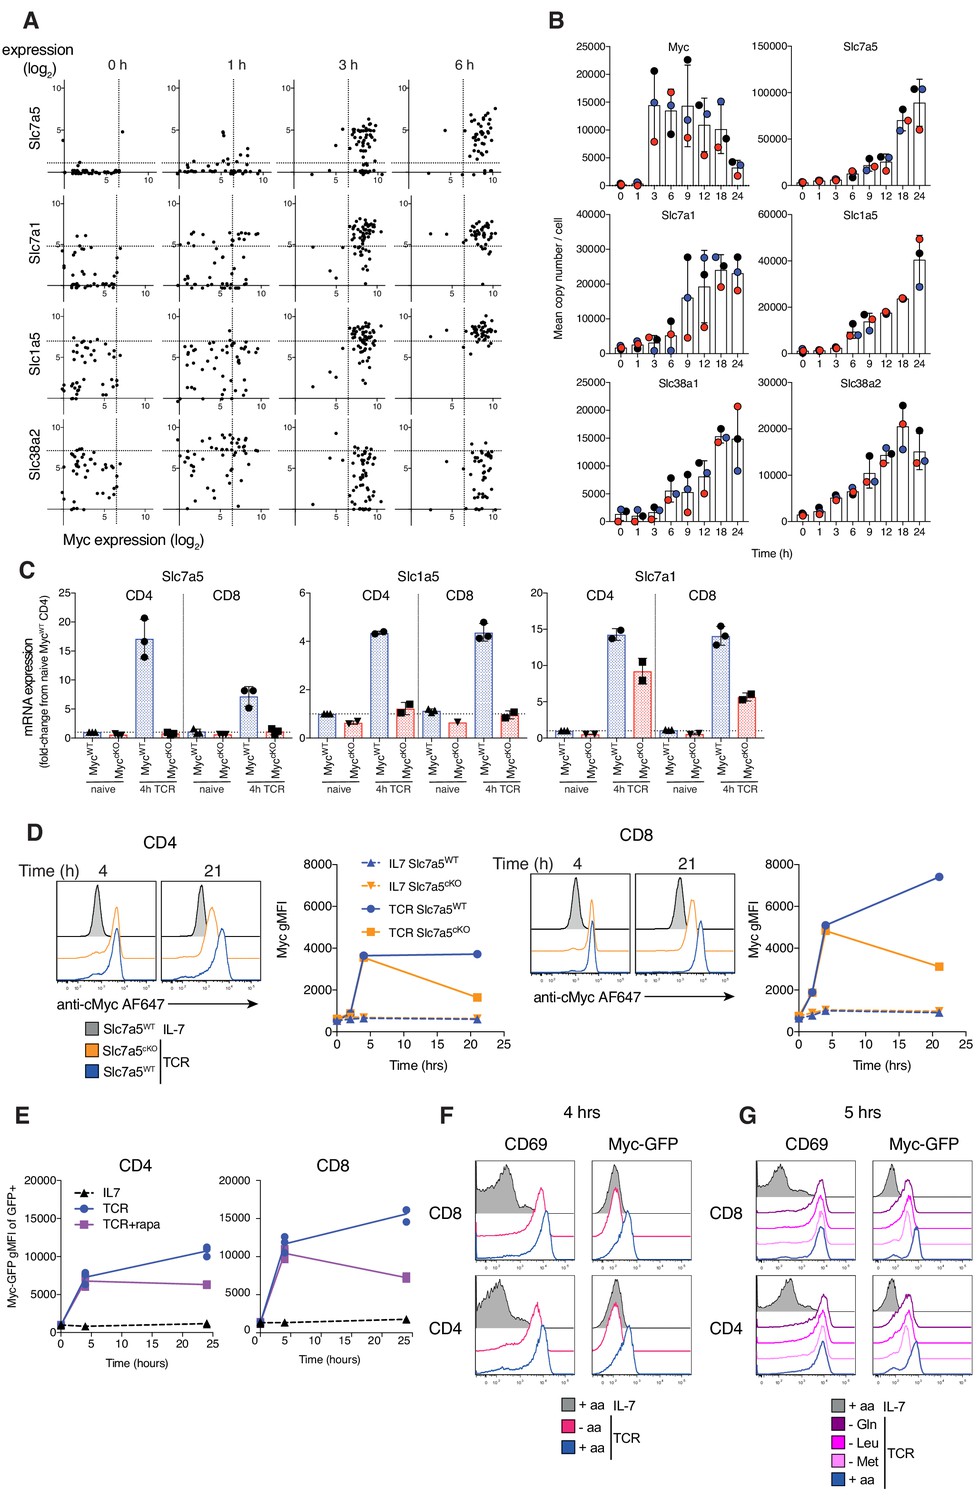
Myc induces amino acid transport early after TCR activation, triggering a feedforward loop maintaining its own expression.
(A) Expression levels of Slc7a5, Slc7a1, Slc1a5 and Slc38a2 vs Myc mRNA from published single cell RNAseq dataset of OT1 T cells stimulated with SIINFEKL (N4) peptide for the indicated times (Richard et al., 2018). Dotted lines represent 95th percentile of 0 hr gene expression. Symbols represent individual cells (B) Quantitative proteomics of OT-I CD8+ T cells activated with N4 peptide for the indicated time. Mean copy number per cell of the proteins Myc, Slc7a5, Slc7a1, Slc1a5, Slc38a1 and Slc38a2. (C) Slc7a5, Slc1a5 and Slc7a1 mRNA measured by qPCR from ex vivo naïve or 4 hr TCR activated lymph node CD4+ and CD8+ T cells. mRNA levels are relative to naïve CD4+ T cells. (D) Histograms and geometric mean fluorescence intensity (gMFI) vs time of Myc protein measured with antibody by flow cytometry in IL-7 maintained or TCR activated Slc7a5WT and Slc7a5cKO lymph node CD4+ and CD8+ T cells. Representative of 4 biological replicates. (E) Myc-GFP gMFI in IL-7 maintained or GFP+ TCR activated CD4+ and CD8+ T cells ± rapamycin from lymph nodes of Myc-GFP reporter mouse. Myc-GFP reporter expression in CD4+ and CD8+ T cells maintained in IL-7 or TCR activated in (F) amino-acid free media (-aa, HBSS), vs RPMI (+aa) or (G) media deficient in a single amino acid. Data representative of at least three biological replicates. Symbols unless otherwise stated represent biological replicates. Mean ± S.E.M. Quantitative proteomics was performed on biological triplicates.
Tables
Key resources table
| Reagent type (species) or resource | Designation | Source or reference | Identifiers | Additional information |
|---|---|---|---|---|
| Genetic reagent (M. musculus) | Cd4Cre | PMID: 27345256, PMID: 11728338 | ||
| Genetic reagent (M. musculus) | Cd4Cre+ Mycfl/fl | PMID: 19423665, PMID: 19342639, PMID: 11742404 | ||
| Genetic reagent (M. musculus) | Cd4Cre+ Slc7a5fl/fl | PMID: 23525088, PMID: 24586861 | ||
| Genetic reagent (M. musculus) | GFP-MycKI | PMID: 18196519, PMID: 26136212, PMID: 23021216 | ||
| Genetic reagent (M. musculus) | OT1 | PMID: 8287475 | maintained in house as an OT1 TCR transgene heterozygote on a CD45.1 (Ly5.1) background | |
| Antibody | Anti-CD3 (armenian hamster, monoclonal) | Thermo Fisher Scientific | Cat # 14-0031-82, RRID:AB_467049 | T cell activation: 0.5 or 1 μg/ml as indicated in Materials and methods |
| Antibody | Anti-CD28 (syrian hamster, monoclonal) | Thermo Fisher Scientific | Cat # 16-0281-82, RRID:AB_468921 | T cell activation: 0.5 or 3 μg/ml as indicated in Materials and methods |
| Antibody | Anti-CD4 (rat, monoclonal) | BD Biosciences | Cat # 553650, RRID:AB_394970; Cat# 552775, RRID:AB_394461; Cat# 553047, RRID:AB_394583 | cell surface staining 1:200 |
| Antibody | Anti-CD4 (rat, monoclonal) | Thermo Fisher Scientific | Cat# 47-0042-82, RRID:AB_1272183 | cell surface staining 1:200 |
| Antibody | Anti-CD8a (rat, monoclonal) | Biolegend | Cat# 100708, RRID:AB_312747; Cat# 100722, RRID:AB_312761 Cat# 100738, RRID:AB_11204079 | cell surface staining 1:200 |
| Antibody | Anti-CD8a (rat, monoclonal) | BD Biosciences | Cat# 551162, RRID:AB_394081 | cell surface staining 1:200 |
| Antibody | Anti-CD69 (armenian hamster, monoclonal) | ThermoFisher Scientific | Cat# 17-0691-82, RRID:AB_1210795 | cell surface staining 1:200 |
| Antibody | Anti-CD69 (armenian hamster, monoclonal) | Biolegend | Cat# 104514, RRID:AB_492843 | cell surface staining 1:200 |
| Antibody | Anti-CD69 (armenian hamster, monoclonal) | BD Biosciences | Cat# 553237, RRID:AB_394726 | cell surface staining 1:200 |
| Antibody | Anti-B220 (rat, monoclonal) | BD Biosciences | Cat# 553087, RRID:AB_394617 | cell surface staining 1:200 |
| Antibody | Anti-NK1.1 (mouse, monoclonal) | Biolegend | Cat# 108706, RRID:AB_313393 | cell surface staining 1:200 |
| Antibody | Anti-CD11b (rat, monoclonal) | Biolegend | Cat# 101206, RRID:AB_312789 | cell surface staining 1:200 |
| Antibody | Anti-CD25 (rat, monoclonal) | BD Biosciences | Cat# 553072, RRID:AB_394604 | cell surface staining 1:200 |
| Antibody | Anti-CD62L (rat, monoclonal) | Thermo Fisher Scientific | Cat# 12-0621-83, RRID:AB_465722 | cell surface staining 1:200 |
| Antibody | Anti-TCRb (armenian hamster, monoclonal) | Thermo Fisher Scientific | Cat# 45-5961-82, RRID:AB_925763 | cell surface staining 1:200 |
| Antibody | Anti-CD44 (rat, monoclonal) | BD Biosciences | Cat# 559250, RRID:AB_398661 | cell surface staining 1:200 |
| Antibody | Anti-Thy1.2 (rat, monoclonal) | BD Biosciences | Cat# 553006, RRID:AB_394545 | cell surface staining 1:200 |
| Antibody | Anti-CD45.1 (mouse, monoclonal) | Biolegend | Cat # 110714, RRID:AB_313503 | cell surface staining 1:200 |
| Antibody | Anti-CD45.2 (mouse, monoclonal) | Biolegend | Cat # 109816, RRID:AB_492868 | cell surface staining 1:200 |
| Antibody | Anti-mouse CD16/CD32 Fc Block, (rat, monoclonal) | BD Biosciences | Cat # 553141, RRID:AB_394656 | Fc block 1:100 |
| Antibody | c-Myc (D84C12) XP (rabbit, monoclonal) | Cell Signaling Technologies | Cat# 5605, RRID:AB_1903938 | intracellular staining 1:200 |
| Antibody | Anti-rabbit A647 (goat) | Cell Signaling Technologies | Cat # 4414, RRID:AB_10693544 | intracellular staining 1:1000 |
| Antibody | Anti-IFNg (rat, monoclonal) | Biolegend | Cat # 505810, RRID:AB_315404 | intracellular cytokine staining 1:100 |
| Antibody | Anti-Granzyme B | Thermo Fisher Scientific | Cat# 17-8898-82, RRID:AB_2688068 | intracellular cytokine staining 1:200 |
| Chemical compound, drug | DAPI | Thermo Fisher Scientific | D1306 | 1 µg/mL |
| Chemical compound, drug | Kynurenine | Sigma | Cat# K8625 | 200 µM |
| Chemical compound, drug | BCH | Sigma | Cat# A7902 | 10 mM |
| Chemical compound, drug | Rapamycin | Merck/Calbiochem | Cat# 553211 | 20 nM |
| Commercial assay or kit | Rneasy minikit | Qiagen | Cat # 74104 | |
| Commercial assay or kit | iScript cDNA Synthesis kit | Biorad | Cat#1708891 | |
| Commercial assay or kit | iTaq Universal SYBRGreen Supermix | Biorad | Cat# 1725121 | |
| Commercial assay or kit | EZQ protein quantitation kit | Thermo Fisher Scientific | R33200 | |
| Commercial assay or kit | Sera-Mag SpeedBead Carboxylate-modified magnetic particles (hydrophilic) | GE Lifesciences | cat# 45152105050250 | |
| Commercial assay or kit | Sera-Mag SpeedBead Carboxylate-modified magnetic particles (hydrophobic) | GE Lifesciences | cat# 65152105050250 | |
| Commercial assay or kit | CBQCA protein quantitation kit | Thermo Fisher Scientific | C6667 | |
| Commercial assay or kit | HiPPR Detergent Removal Spin Column Kit | Thermo Fisher Scientific | Cat# 88305 | |
| Commercial assay or kit | EasySep CD8 T cell isolation kit | STEMCELL Technologies, UK | Cat # 19853 | |
| Commercial assay or kit | Golgi Plug | BD Biosciences | Cat# 555029 | |
| Commercial assay or kit | eBioscience Intracellular Fixation and Permeabilization Buffer Set | Thermo Fisher Scientific | Cat# 88-8824-00 | |
| Commercial assay or kit | CFSE | Thermo Fisher Scientific/Invitrogen | Cat# C34554 | 5 µM |
| Peptide, recombinant protein | IL7 | Peprotech | Cat# 217–17 | 5 ng/mL |
| Peptide, recombinant protein | IL2 | Novartis, UK | Proleukin | 20 ng/ml |
| Peptide, recombinant protein | IL12 | Peprotech | Cat#210–12 | 2 ng/ml |
| Sequence based reagent | Slc7a5 forward primer | AAG GCT GCG ACC CGT GTG | ||
| Sequence based reagent | Slc7a5 reverse primer | ATC ACC TTG TCC CAT GTC CTT CC | ||
| Sequence based reagent | Slc7a1 forward primer | GGA GCT TTG GC CTT CAT CAC T | ||
| Sequence based reagent | Slc7a1 reverse primer | CAG CAC CCC AGG AGC ATT CA | ||
| Sequence based reagent | Slc1a5 forward primer | GCC ATC ACC TCC ATC AAC GAC T | ||
| Sequence based reagent | Slc1a5 reverse primer | AGA GCG GAA GGC AGC AGA CAC | ||
| Sequence based reagent | TBP forward primer | GTG AAT CTT GGC TGT AAA CTT GAC CT | ||
| Sequence based reagent | TBP reverse primer | CGC AGT TGT CCG TGG CTC T | ||
| Software, algorithm | FlowJo software | Treestar | versions 9 and 10 | |
| Software, algorithm | Maxquant | https://www.maxquant.org, PMID: 19029910 | version 1.6.2.6 | |
| Software, algorithm | Perseus | https://www.maxquant.org/perseus, PMID: 27348712 | version 1.6.6.0 | |
| Other | RPMI 1640 | Thermo Fisher Scientific/GIBCO | Cat# 21875–034 | |
| Other | RPMI - glutamine | Thermo Fisher Scientific/GIBCO | Cat# 42401–018 | |
| Other | RPMI - methionine | DC Biosciences Ltd | custom made RPMI without methionine and arginine - supplemented back the arginine (0.2 g/L) to RPMI levels | |
| Other | RPMI - leucine | Sigma | Cat# R1780 SAFC | supplemented back arginine (0.2 g/L) and lysine (0.04 g/L)to RPMI levels |
| Other | HBSS | Thermo Fisher Scientific/GIBCO | Cat# 14025–050 | used this as amino acid-free media |
| Other | FBS | Thermo Fisher Scientific/GIBCO | Cat # 10270106 | |
| Other | FBS, dialyzed | Thermo Fisher Scientific/GIBCO | Cat# 26400044 | |
| Other | Arginine | Sigma | Cat# A5006 | |
| Other | Lysine | Sigma | Cat# L5501 |
Additional files
-
Supplementary file 1
Copy number, protein content, fold-change calculations, statistical tests and heatmap input from proteomics data.
- https://cdn.elifesciences.org/articles/53725/elife-53725-supp1-v2.xlsx
-
Transparent reporting form
- https://cdn.elifesciences.org/articles/53725/elife-53725-transrepform-v2.docx
Download links
A two-part list of links to download the article, or parts of the article, in various formats.
Downloads (link to download the article as PDF)
Open citations (links to open the citations from this article in various online reference manager services)
Cite this article (links to download the citations from this article in formats compatible with various reference manager tools)
Quantitative analysis of how Myc controls T cell proteomes and metabolic pathways during T cell activation
eLife 9:e53725.
https://doi.org/10.7554/eLife.53725


