The skin microbiome facilitates adaptive tetrodotoxin production in poisonous newts
- Department of Integrative Biology, Michigan State University, United States
- BEACON Center for the Study of Evolution in Action, Michigan State University, United States
- Department of Biochemistry, Microbiology, and Immunology, Wayne State University, United States
- Department of Animal and Veterinary Science, University of Idaho, United States
- Institute for Bioinformatics and Evolutionary Studies, University of Idaho, United States
- Department of Biology, Stanford University, United States
- Department of Biological Sciences, University of Idaho, United States
Figures
Figure 1 with 2 supplements
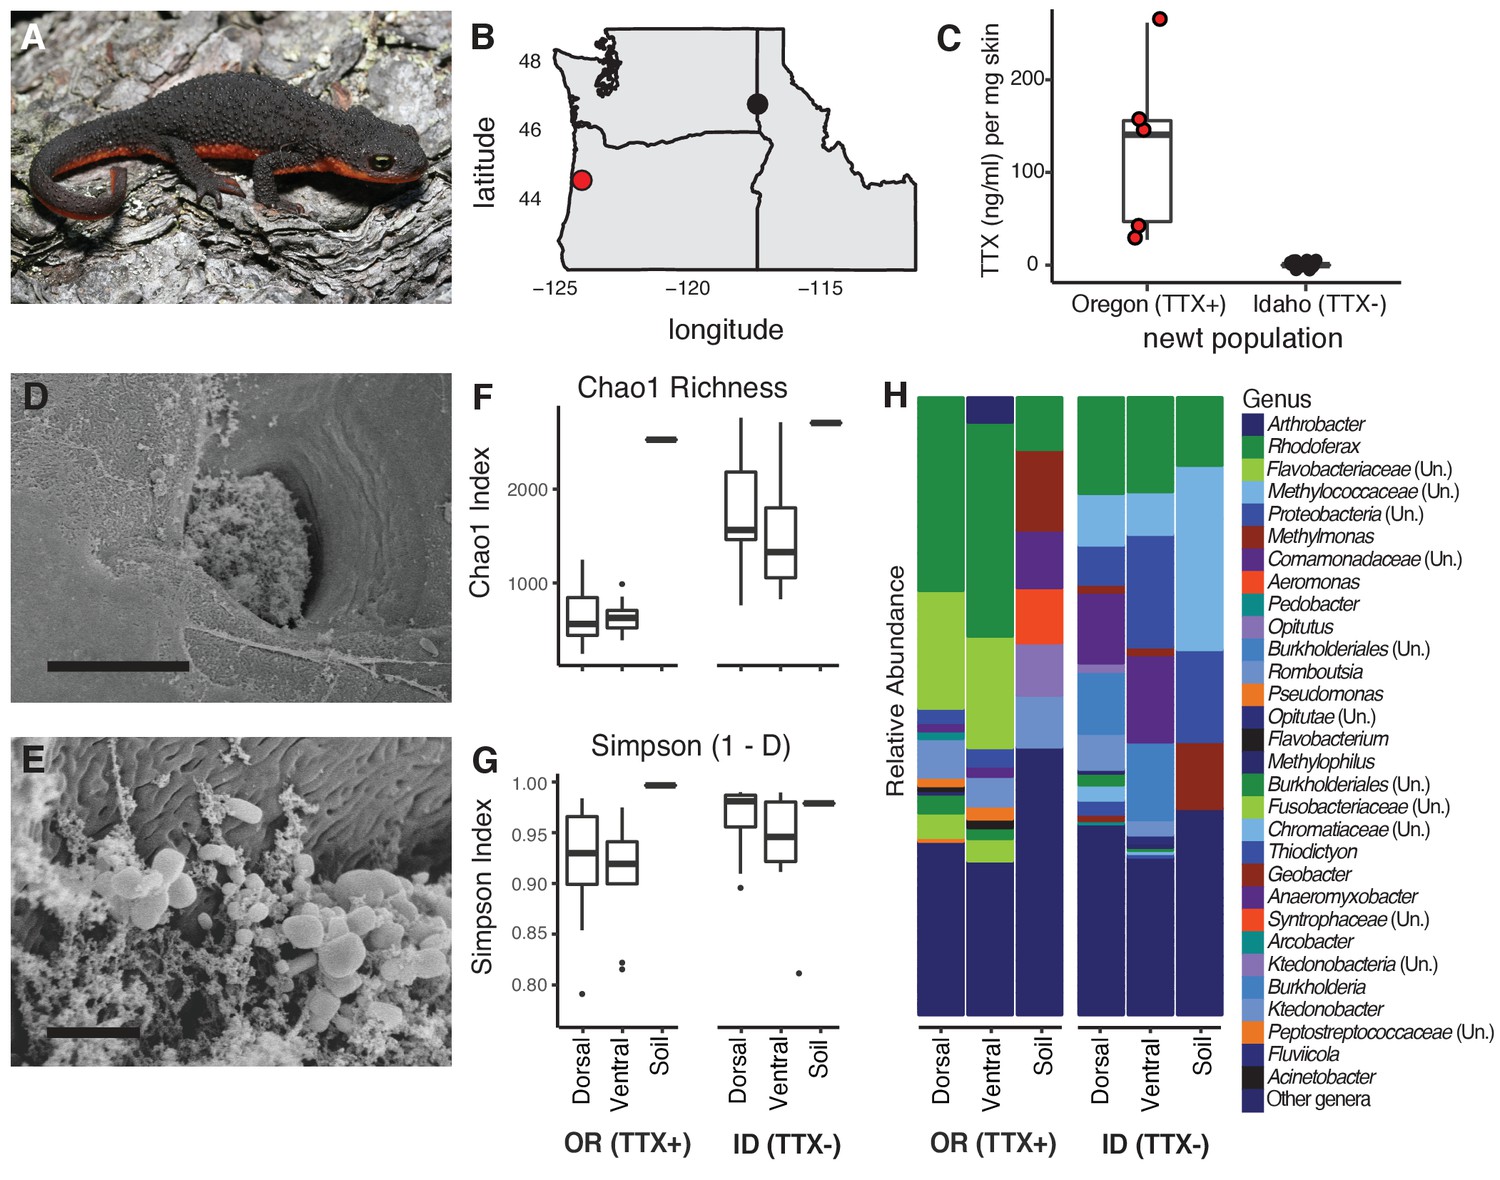
Characterization of the skin-associated microbiota of rough-skinned newts.
(A) Rough-skinned newt (Taricha granulosa); photo by Gary Nafis (CC by ND NC 3.0). (B) Two populations of T. granulosa previously reported to possess either high concentrations of TTX (Lincoln Co, OR; red) or no TTX (Latah Co, ID; black) were compared in our study. (C) TTX measured from dorsal skin biopsies: newts from Oregon possessed 126.5 ± 42.1 ng mL−1 TTX (n = 5) while Idaho newts possessed no detectable TTX (n = 17). (D–E) Scanning electron micrographs of host-associated bacterial communities upon the dorsal skin surface and within the ducts of TTX-sequestering granular glands. Scale bars 10 µm and 1 µm for D and E, respectively. (F–G) Comparison of bacterial community richness and diversity between these two populations, along with soil samples collected contemporaneously from the ponds in which the newts were caught. Non-toxic Idaho newts possessed higher OTU richness (Chao1 index, t unequal var. = 7.90, p<0.0001) and diversity (Simpson [1-D] index, t unequal var. = 4.11, p<0.0001) than toxic Oregon newts. (H) Mean relative abundance of bacterial OTUs present in dorsal or ventral skin of each population, as well as local soil samples. Sample sizes for panels F-H were n = 12 for Oregon (TTX+) and n = 16 for Idaho (TTX-) newts.
-
Figure 1—source data 1
Raw data for newt skin toxicity measurements by LC-MS/MS.
Estimated TTX concentrations (ng mL−1) were calculated relative to a calibration curve of pure TTX standards.
- https://cdn.elifesciences.org/articles/53898/elife-53898-fig1-data1-v1.docx
-
Figure 1—source data 2
The top 20 most abundant bacterial OTUs found among toxic (Oregon) and non-toxic (Idaho) newts.
The relative abundance of each bacterial OTU within a sample was calculated and averaged across all samples for each population; these data are shown below as percentages. Taxonomy was assigned using the Ribosomal Database Project (Cole et al., 2014) and a confidence threshold of 80%. OTUs shared between the two populations are in bold.
- https://cdn.elifesciences.org/articles/53898/elife-53898-fig1-data2-v1.docx
-
Figure 1—source data 3
Variation in alpha diversity between newt populations and sampling sites across the bodies of individual newts.
Each value is shown as mean ± SEM.
- https://cdn.elifesciences.org/articles/53898/elife-53898-fig1-data3-v1.docx
Figure 1—figure supplement 1
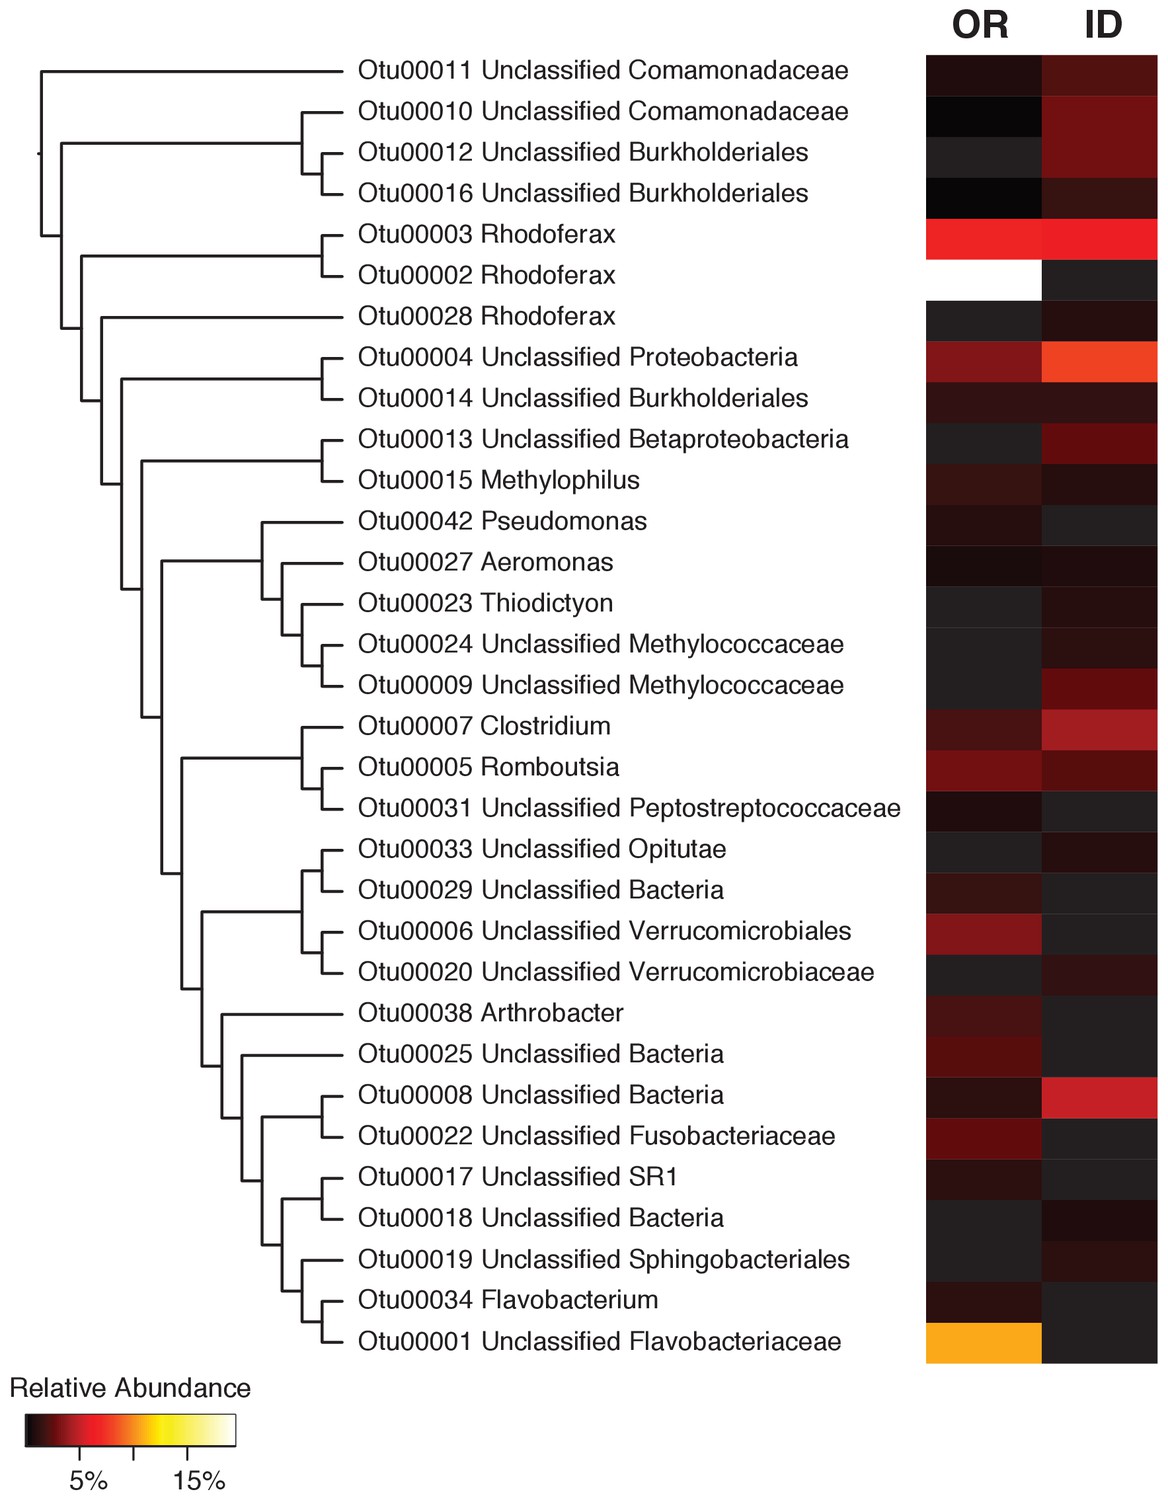
The top 20 most abundant OTUs in the newt microbiome.
A clearcut neighbor-joining phylogenetic tree of the top 20 most relatively abundant OTUs with a heatmap displaying the mean relative abundance of each OTU in Oregon and Idaho newts. 12 of these OTUs are unique to one population, while 8 OTUs are shared between both populations.
Figure 1—figure supplement 2

Relative abundance of newt-associated bacteria at the phylum level.
Newt skin communities are diverse, with bacterial OTUs from 12 distinct phyla present at >3% relative abundance.
Figure 2 with 2 supplements
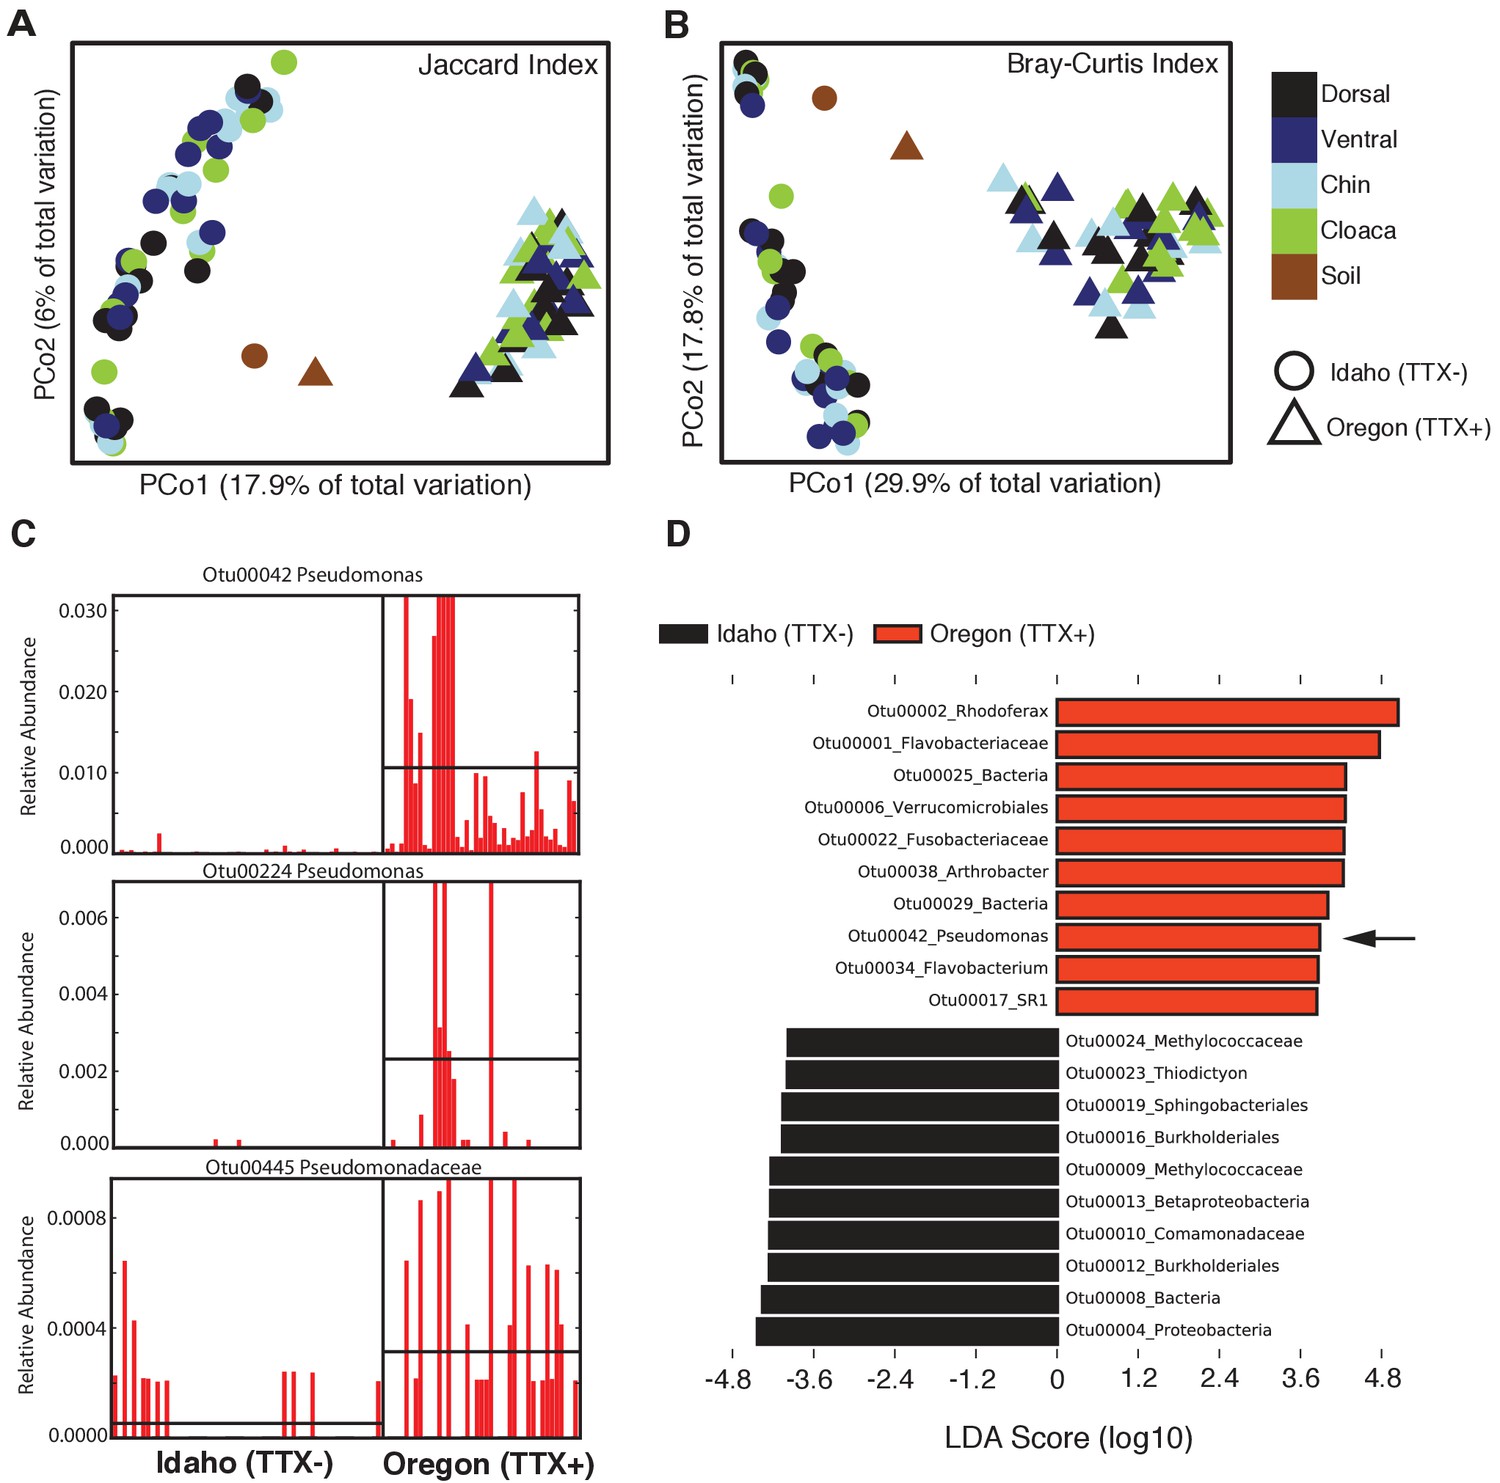
Comparison of skin microbiota from toxic and non-toxic newt populations reveal distinct host-associated bacterial communities and enrichment of TTX-producing bacteria.
(A–B) Principal coordinates analysis of bacterial community composition (OTU presence/absence; Jaccard index) and community structure (OTU relative abundance; Bray-Curtis index) of skin microbiota across four body sites from toxic Oregon and non-toxic Idaho newts reveal distinct clustering of bacterial communities within each population. Non-parametric multivariate analysis of variance (PERMANOVA) test indicates a significant effect of location on both the composition (F = 18.12, p<0.0001) and structure (F = 40.40, p<0.0001) of skin-associated bacterial communities. Newt-associated communities also cluster separately from soil communities sampled from each location. (C) Representative comparison of highly abundant OTUs from individual toxic Oregon and non-toxic Idaho newt microbiota samples (on x-axis) reveals increased relative abundance of Pseudomonas OTUs in toxic newts. (D) Linear discriminant analysis effect size (LEfSE) comparing the top 10 differentially abundant OTUs between toxic and non-toxic newt microbiota indicates that Pseudomonas OTU00042 is highly enriched in toxic newt microbiota (black arrow). Pseudomonas isolated from newt skin produced TTX (Figure 3). Sample sizes were n = 12 and n = 16 for Oregon and Idaho newts, respectively.
Figure 2—figure supplement 1
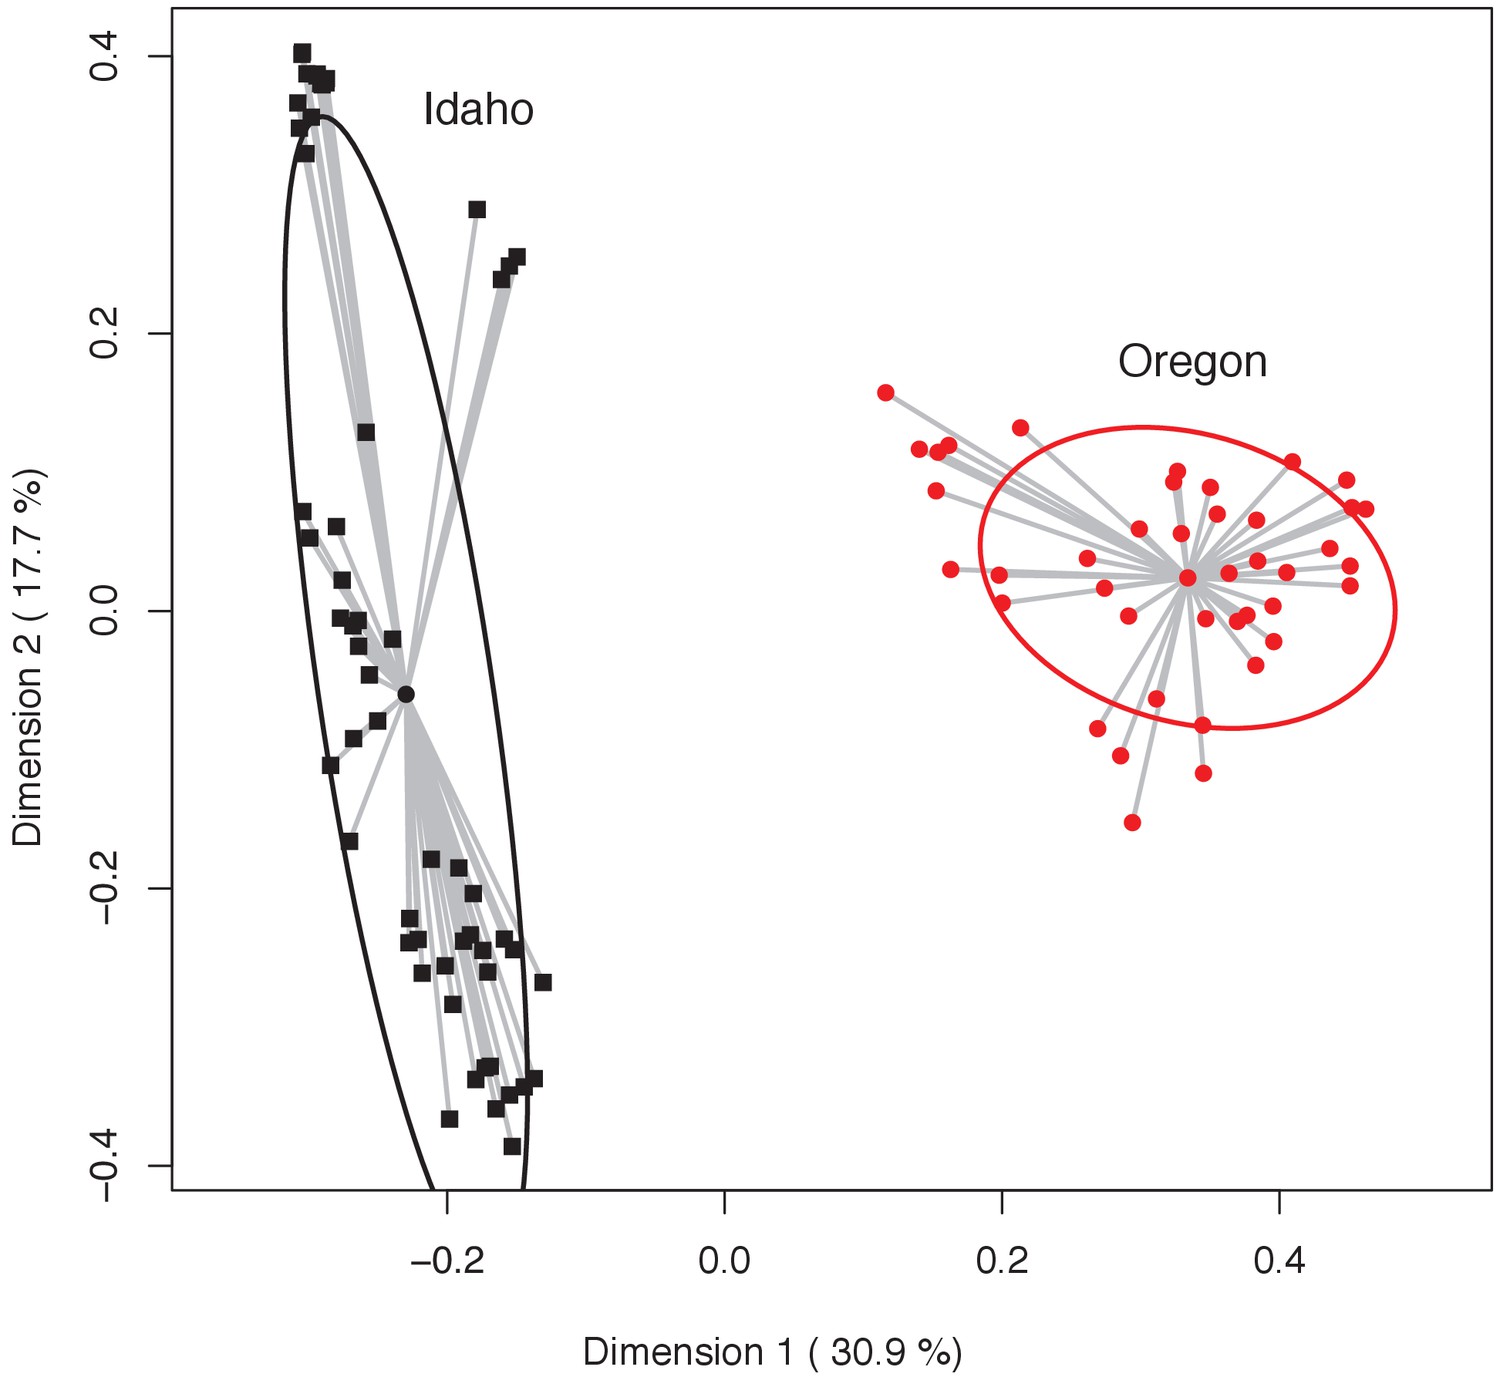
Principal coordinates analysis highlighting variation in bacterial community structure (Bray-Curtis index) of Oregon (red circles) and Idaho (black squares) newt skin microbiota.
Dispersion (i.e. variance) of individual samples are shown as gray lines from the mean centroid, and 95% confidence ellipses are shown for each group. Permutation test of multivariate homogeneity of group dispersion (PERMDISP) indicates a significant difference between the two populations (p=0.0053).
Figure 2—figure supplement 2
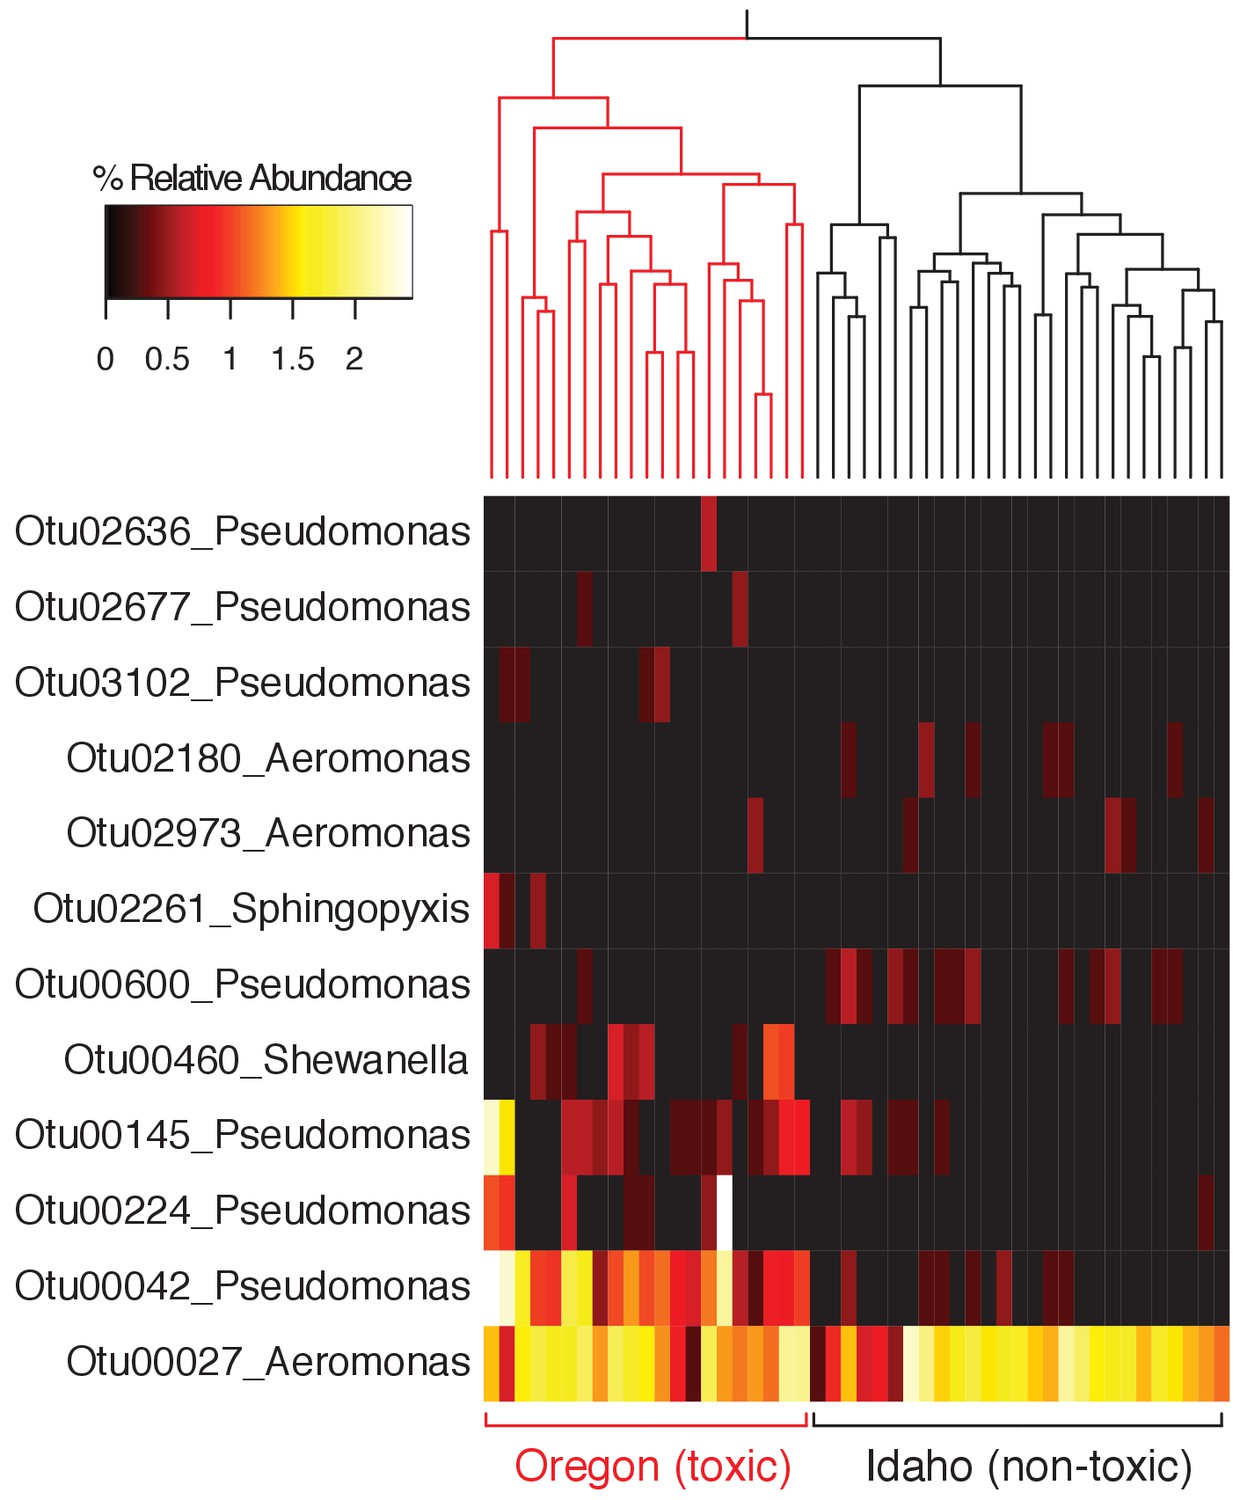
Relative abundance of all OTUs classified to the same genera as TTX-producing bacteria identified in this study (Aeromonas, Pseudomonas, Shewanella, and Sphingopyxis).
Skin microbiota samples (dorsal and ventral) are clustered based on Bray-Curtis dissimilarity (Oregon n = 21; Idaho n = 27).
Figure 3 with 2 supplements
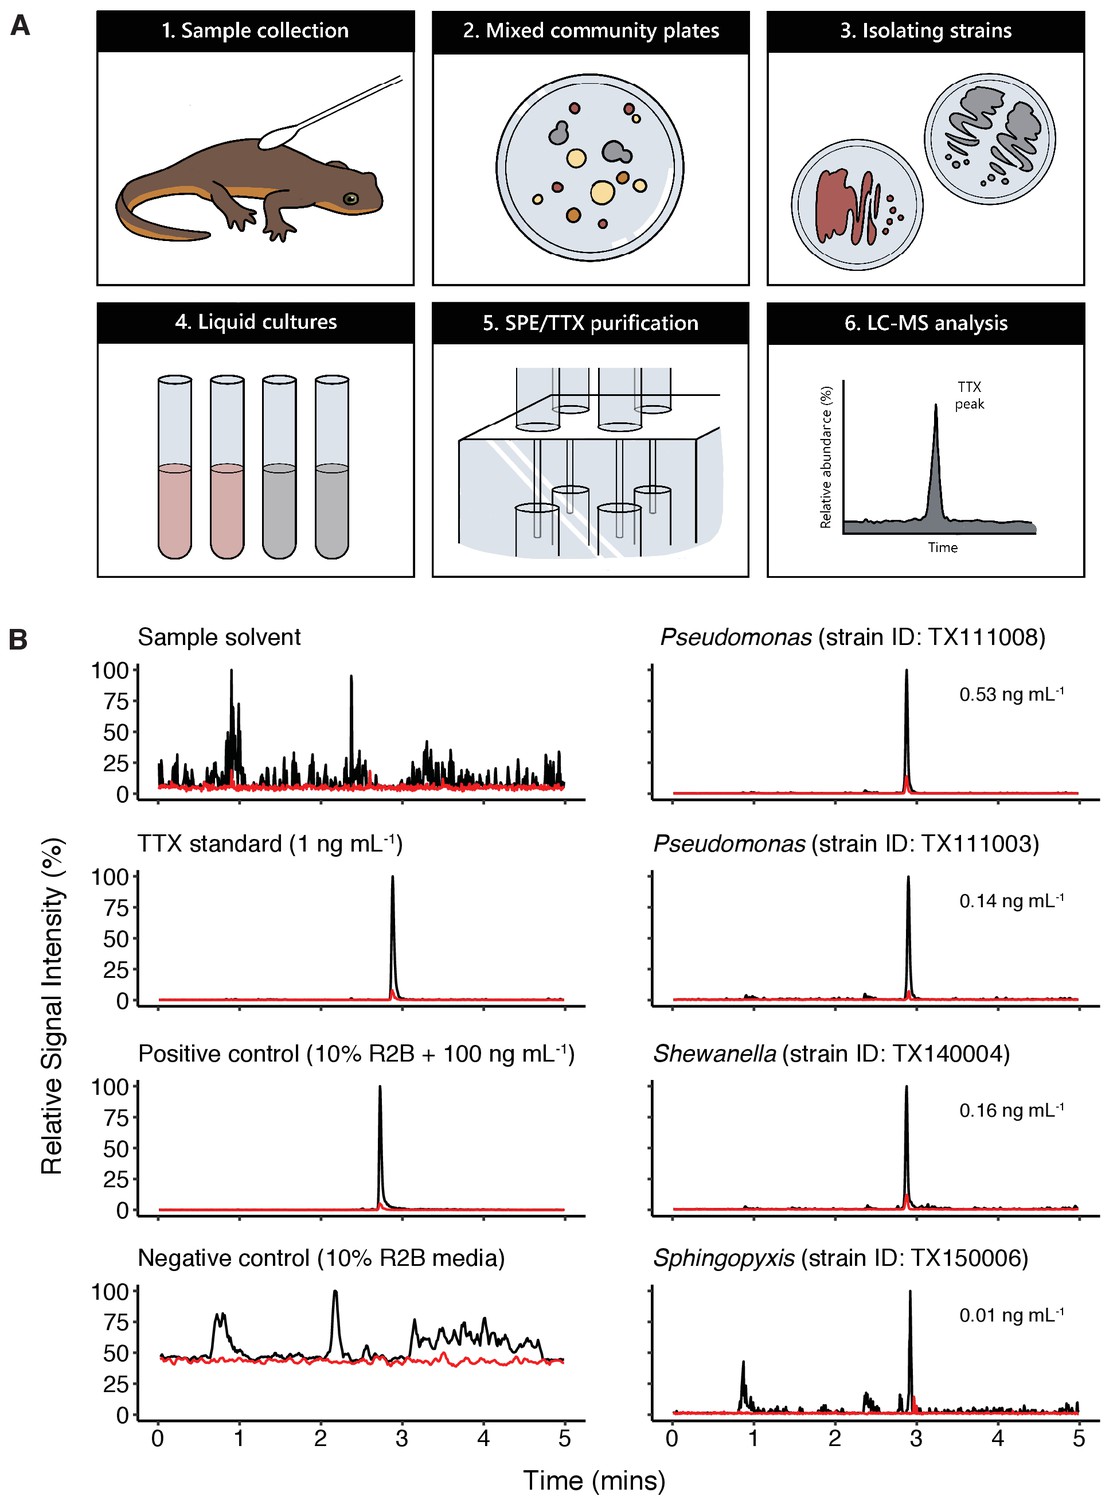
Bacterial isolates cultured from newt skin produce TTX in vitro.
(A) Schematic overview of procedure for isolating and screening newt bacteria for TTX production. Bacterial samples were collected from dorsal skin of toxic newts, taxonomically identified by 16S rRNA gene sequencing, grown in liquid culture for 2 weeks, centrifuged, and the supernatant was purified by solid-phase extraction (SPE). Extracts were screened against TTX analytical standards by LC-MS/MS. (B) Representative extracted ion chromatographs showing peaks corresponding to major product ion transitions 320.1 to 162.1 m/z (black) and 320.1 to 302.1 m/z (red) for TTX in cultures from four bacterial isolates. The retention time for each peak was 2.9 min and matched that of both authentic TTX standards and culture media supplemented with 100 ng mL−1 TTX. Peaks were absent in untreated culture media. Estimated TTX concentrations in bacterial cultures are shown next to each peak. Multiple strains of Pseudomonas spp. were found to produce TTX and three additional TTX-producing genera were identified: Aeromonas, Shewanella, and Sphingopyxis.
Figure 3—figure supplement 1
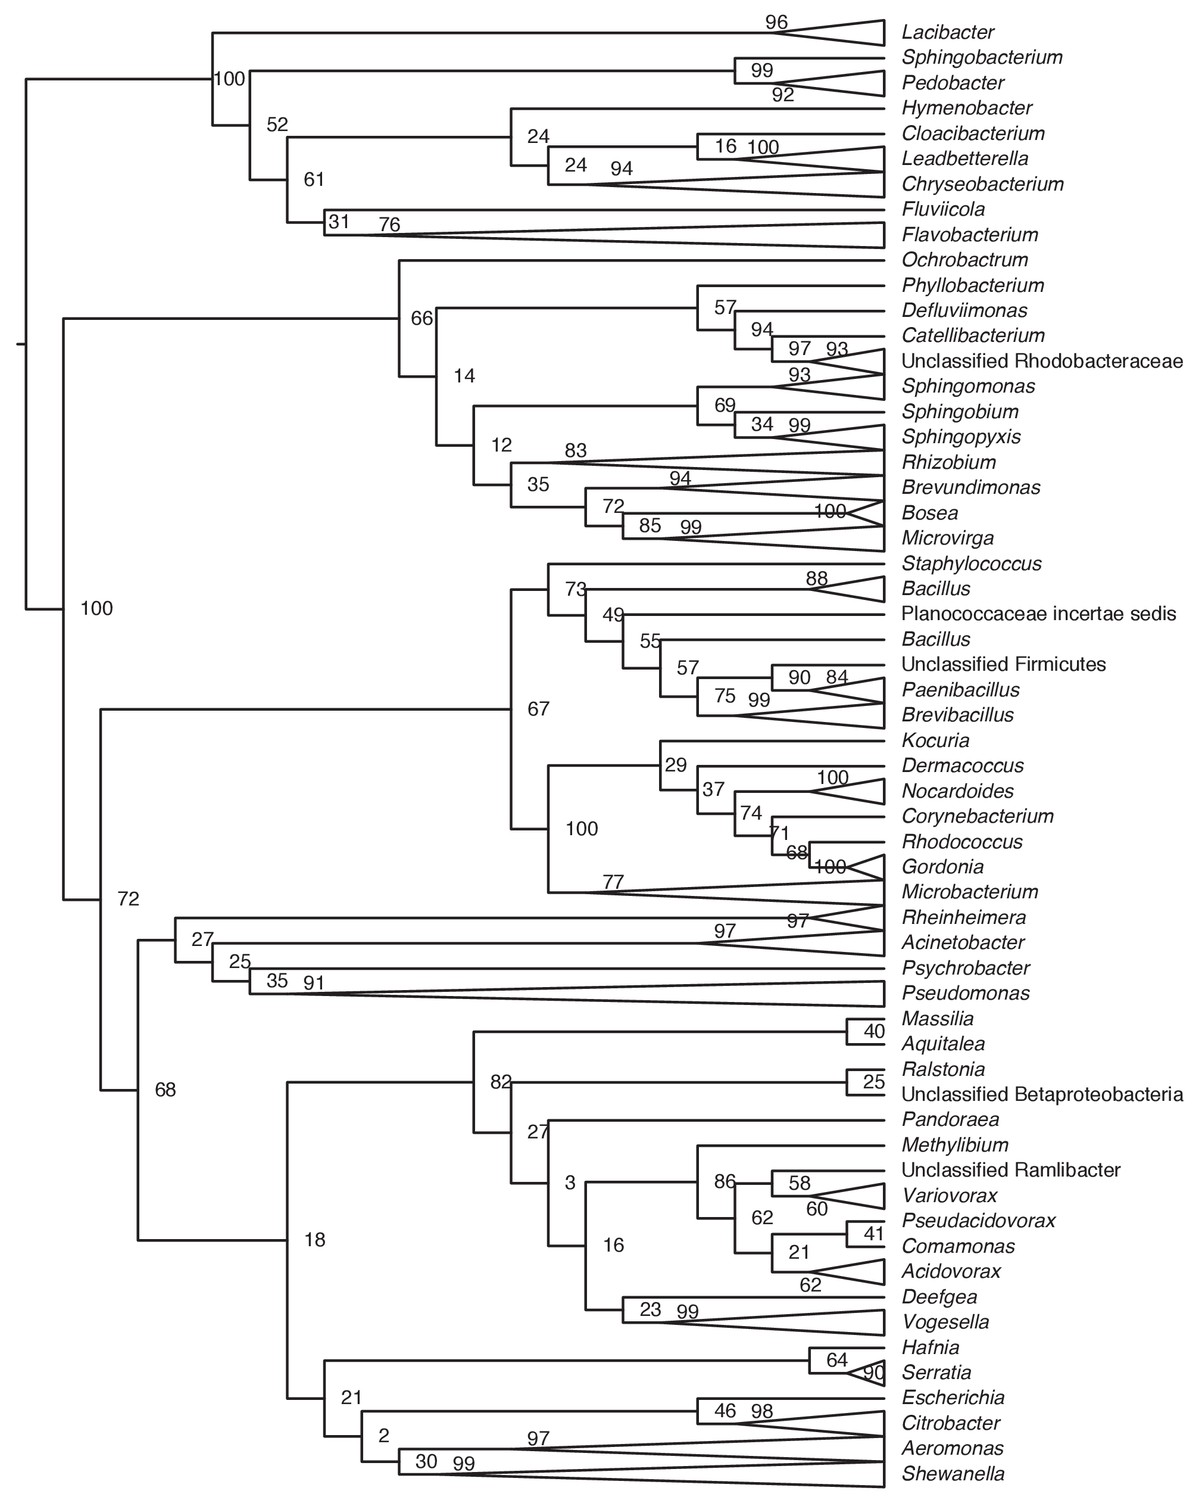
Phylogenetic tree of bacteria cultivated from the skin of toxic rough-skinned newts.
Evolutionary relationships were determined by aligning newt bacterial 16S rRNA gene sequences to the SILVA Ribosomal RNA database (Quast et al., 2013) using mothur v1.40.3 (Schloss et al., 2009). Trees were constructed using randomized axelerated maximum likelihood (RAxML) with 1000 bootstrap replicates (Stamatakis, 2014) in Geneious v11.0.5 (Kearse et al., 2012). Clades with multiple bacterial isolates are represented with triangles. Bootstrap support is shown on each node.
Figure 3—figure supplement 2
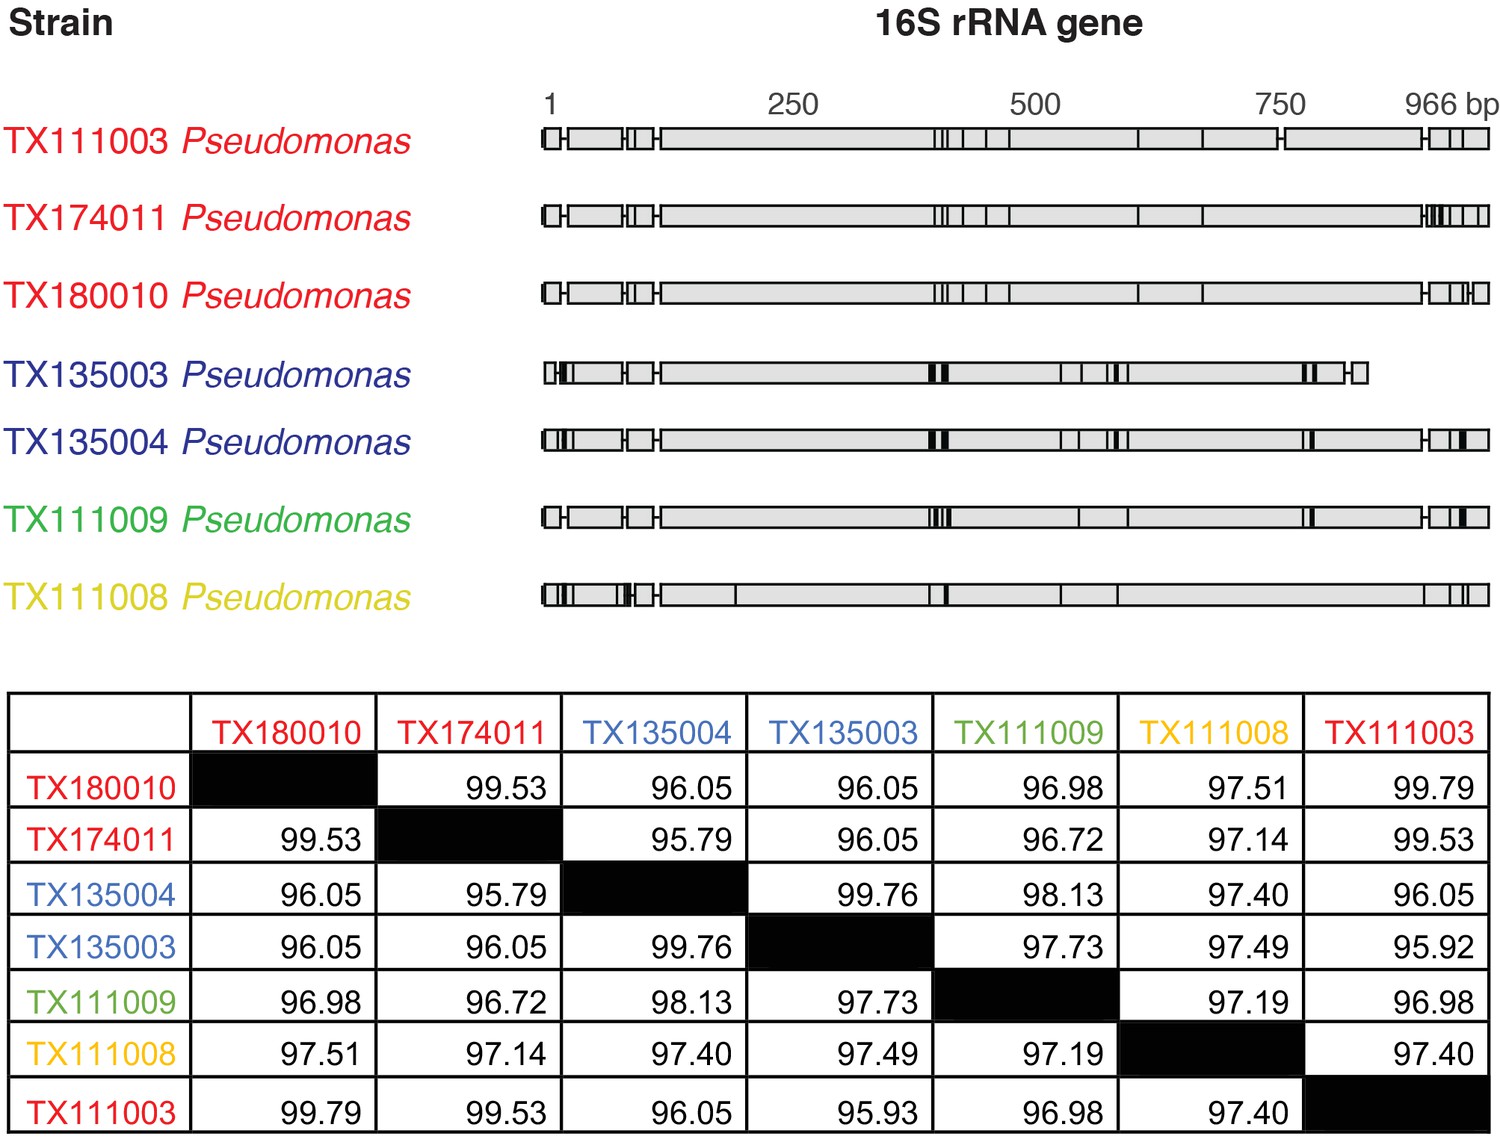
Pairwise comparison of 16S rRNA sequences between TTX-producing strains of Pseudomonas spp. identified in this study.
Gray regions represent invariable sites, while black bars show mutations. Strains TX111003, TX174011, and TX180010 and strains TX135003 and TX135004 each share >99% pairwise nucleotide identities, but the two groups appear to be distinct from each other. Sequences TX111009 and TX111008 share around 96–97% nucleotide identities with the other two groups, but each possesses unique mutations indicating that they are distinct strains of Pseudomonas. Nucleotide identities are shown as percentages (%) for each pairwise sequence comparison. Sequence groups with >99% nucleotide identities are indicated through color coding and were considered replicate isolates of the same bacterial strains.
Figure 4 with 1 supplement

Protein alignment of Nav channels across representative vertebrates.
Sequence alignment of S5-S6 P-loops from newts and other vertebrates showing amino acid substitutions relative to the P-loop consensus sequence for each Nav channel shown here. Putative TTX resistance mutations are highlighted in orange; mutations that are not highlighted are either synapomorphic in a gene clade or are present in TTX sensitive channels. Data are missing for DI and DII of Nav1.1 in newts, which we did not recover in our sequencing efforts. The approximate locations of newt mutations are shown as orange circles, and the amino acid site of each mutation is numbered based on Nav1.6 from Mus musculus.
-
Figure 4—source data 1
GenBank accession numbers of vertebrate Nav channel protein sequences used in multiple sequence alignments and analysis.
- https://cdn.elifesciences.org/articles/53898/elife-53898-fig4-data1-v1.docx
Figure 4—figure supplement 1

Parallel evolution of DIII and DIV P-loop substitutions in Nav1.6 of toxic newts and TTX resistant garter snakes.
Structure of the Nav channel and multiple sequence alignment of Nav1.6 across representative vertebrate taxa. The consensus sequence is shown above the alignment, and orange labels indicate taxa that either possess TTX or consume TTX-laden prey. Identical amino acid substitutions were observed between rough-skinned newts (Taricha granulosa) and garter snakes (Thamnophis sirtalis) from Benton Co. OR, where T. granulosa populations are highly toxic. Furthermore, some of these mutations were also identified in the less toxic eastern newt (Notophthalmus viridescens) and the non-toxic axolotl (Ambystoma mexicanum). These observations suggest that the last common ancestor of Ambystomids and Salamandrids possessed replacements in DIII and DIV. Our physiological data indicate that these replacements provide low levels of resistance, and may have thus allowed low level exposure to TTX, possibility facilitating the evolution of TTX toxicity in some Salamandrid species. Phylogenetic relationships are based on full-length Nav1.6 assessed by RAxML with 1000 bootstrap replicates. Support values are shown on each node, and the scale bar reflects the mean number of nucleotide substitutions per site.
Figure 5 with 1 supplement
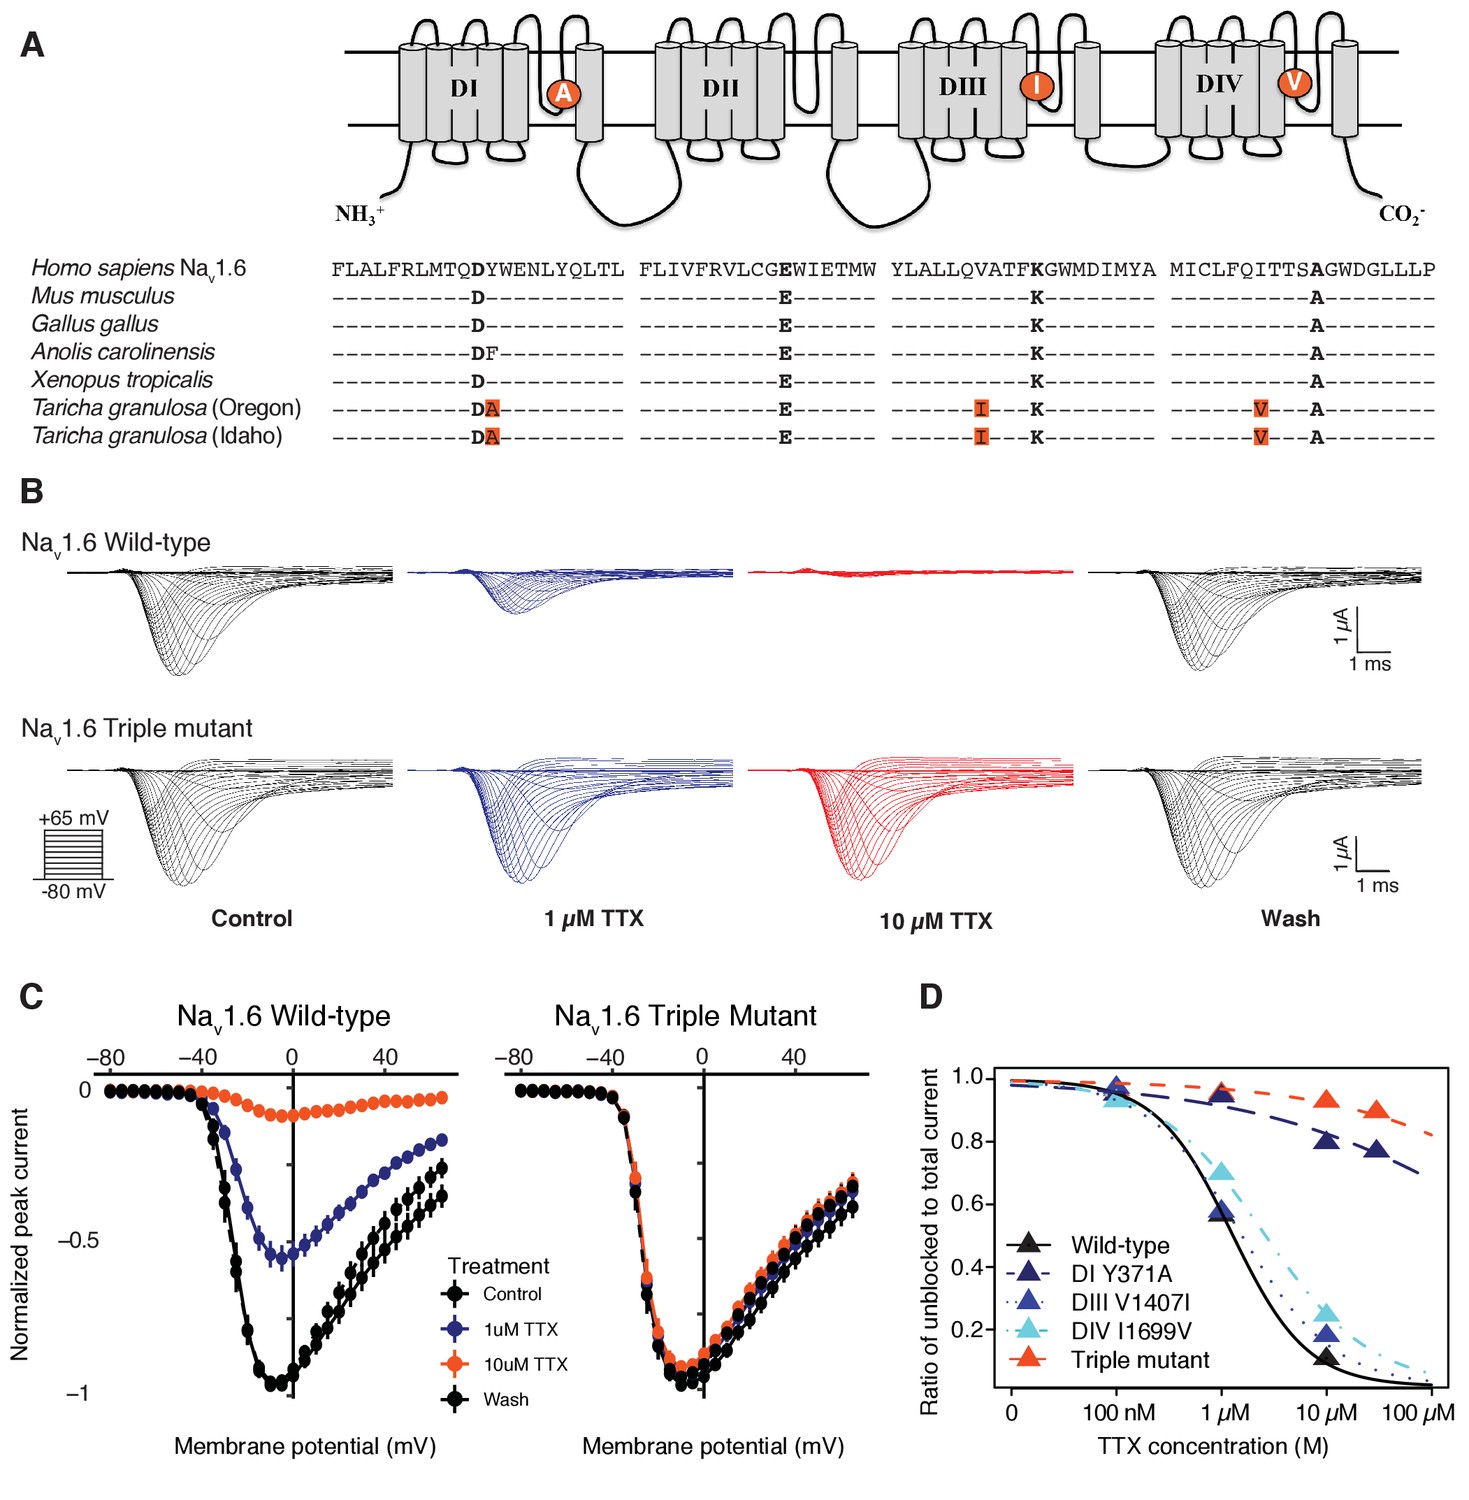
Newts possess Nav channel mutations that confer physiological resistance to TTX.
(A) Predicted topology of Nav1.6 with mutations in domains I, III, and IV. Sequence alignment of Nav1.6 pore-loop motifs revealed three amino acid differences in newts from Oregon or Idaho populations. (B) Representative currents from wild-type mouse Nav1.6 or Nav1.6 with newt substitutions Y371A, V1407I, and I1699V treated with 1 µM (blue) or 10 µM (orange) TTX. (C) Current-voltage (I–V) relationships showing normalized currents for wild-type (n = 21) and mutant Nav1.6 (n = 20) channels. Wild-type Nav1.6 was blocked by TTX (Tukey’s multiple comparisons test with Bonferroni correction: control vs. 1 µM, p<0.0001; control vs. 10 µM, p<0.0001), while mutated Nav1.6 was unaffected (repeated measures ANOVA, p=0.879). (D) Dose-response curves showing the proportion of Na+ current elicited during a step depolarization from −100 to −20 mV for wild-type, individual mutants, and triple-mutant Nav1.6 channels exposed to increasing concentrations of TTX. Sample sizes are provided in Table 2. Data were fit with a Hill equation to estimate IC50 values.
Figure 5—figure supplement 1
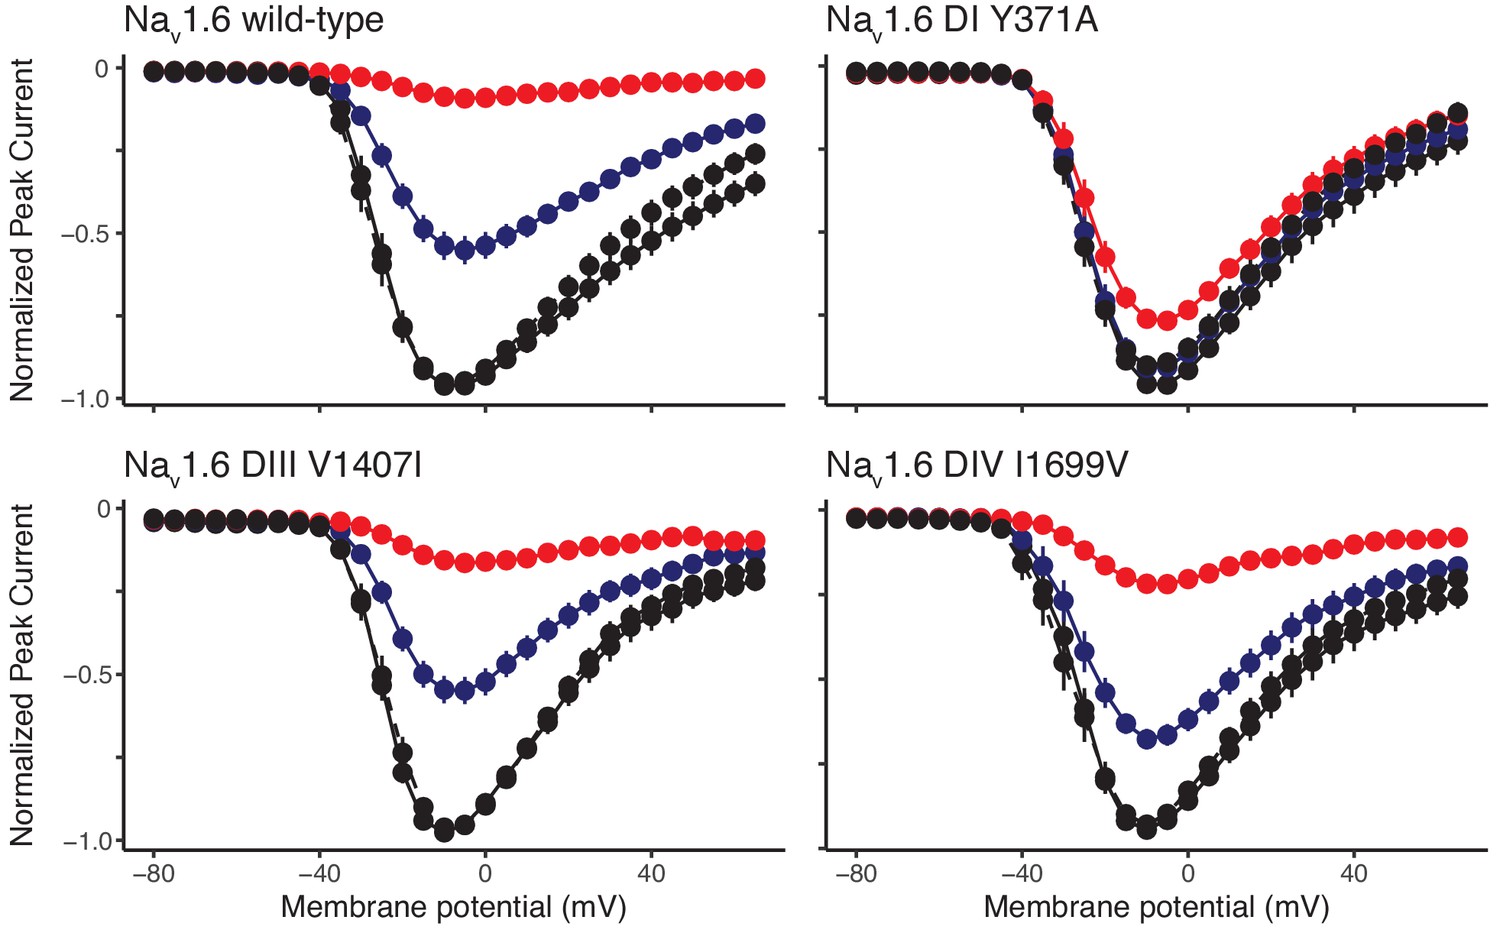
Newt Nav1.6 mutations increase TTX resistance in the orthologous mouse Nav1.6.
Current-voltage curves showing normalized peak Na+ currents measured for wild-type mouse Nav1.6 and mutant constructs DI Y371A, DIII V1407I, and DIV I1699V containing one of three mutations in the presence of the control and wash solutions (black), 1 µM TTX (blue), and 10 µM TTX (red). Each construct was coexpressed with rat β1 and β2 subunits. Data are shown as peak currents normalized to the maximum peak current recorded for each oocyte. Dotted lines indicate current after washing TTX from the oocyte. The construct containing the DI mutation was largely unaffected by TTX at 1 or 10 µM (n = 17); those containing the DIII (n = 13) and DIV (n = 15) mutations were more sensitive, but each channel shows reduced sensitivity relative to the wild-type channel (n = 21).
Tables
Table 1
Summary of TTX-producing bacteria isolated from rough-skinned newts.
Genus-level identification of each TTX-producing isolate was determined by 16S rRNA gene sequencing and taxonomic classification by the Ribosomal Database Project classifier tool at 80% similarity cut-off (Cole et al., 2014). TTX production was determined by screening 1 mL culture media using LC-MS/MS. Overall, we cultured 11 TTX-producing isolates, though 16S gene sequence alignments suggest that some isolates may represent the same bacterial strain (see text). In most cases, TTX was detected in replicate cultures above the limit of detection (LOD), but not always above the lower limit of quantification (LLOQ). Mean TTX production ± standard error (SEM) is shown for samples above the LLOQ. Some of these bacterial genera contain TTX-producing strains that have previously been identified in other toxic animals (reviewed in Chau et al., 2011).
| Genus | Isolation media | TTX-producing isolates | Replicates above LOD | Replicates above LLOQ | TTX (ng mL−1)± SEM | TTX symbiont in other animals |
|---|---|---|---|---|---|---|
| Aeromonas | Blood agar | 1 | 1 | 1 | 0.12 | Pufferfishes, sea snails |
| Pseudomonas | R2A or blood agar | 7 | 23 | 9 | 0.19 ± 0.07 | Pufferfishes, Blue-ringed octopus, sea snails |
| Shewanella | R2A or blood agar | 2 | 4 | 3 | 0.49 ± 0.36 | Pufferfishes |
| Sphingopyxis | R2A | 1 | 2 | 1 | 0.01 | None |
Table 2
Estimated half-maximal inhibitory concentrations (IC50) of TTX for each Nav1.6 construct.
IC50 values are shown as the concentration (mean ± SEM) of TTX (µM) that blocked half of the channels, estimated from the dose-response curve. The IC50 ratio was taken as the fold increase in TTX resistance.
| Construct | N | IC50 | IC50 Ratio |
|---|---|---|---|
| Mouse Nav1.6 | 21 | 1.25 ± 0.09 | 1 |
| DI (Y371A) | 17 | 763.7 ± 284 | 609 |
| DIII (V1407I) | 13 | 2.34 ± 0.23 | 1.2 |
| DIV (I1699V) | 15 | 4.73 ± 0.42 | 2.0 |
| Triple mutant | 20 | 3551 ± 469 | 2832.4 |
Key resources table
| Reagent type (species) or resource | Designation | Source or reference | Identifiers | Additional information |
|---|---|---|---|---|
| Strain, strain background (Escherichia coli) | STBL2 competent cells | ThermoFisher Scientific | 10268019 | |
| Recombinant DNA reagent | mSCN8A (Mus musculus) | DOI: 10.1523/JNEUROSCI.18-16-06093.1998 | Construct kindly provided by Dr. Al Goldin, UC Irvine | |
| Biological sample (Xenopus laevis) | Oocytes | xenopus1.com | ||
| Sequence-based reagent | 16S_rRNA_8F | Integrated DNA Technologies | 51-01-19-06 | AGAGTTTGATCCTGGCTCAG |
| Sequence-based reagent | 16S_rRNA_515F | DOI:10.1128/AEM.01043–13 | PCR primer | GTGCCAGCMGCCGCGGTAA |
| Sequence-based reagent | 16S_rRNA_806R | DOI: 10.1128/AEM.01043-13 | PCR primer | TGGACTACHVGGGTWTCTAAT |
| Sequence-based reagent | 16S_rRNA_1492R | Integrated DNA Technologies | 51-01-19-07 | CGGTTACCTTGTTACGACTT |
| Commercial assay or kit | Q5 Site-directed mutagenesis kit | New England Biolabs | E0554S | |
| Commercial assay or kit | T7 mMessage mMachine kit | ThermoFisher Scientific | AM1344 | |
| Chemical compound, drug | Tetrodotoxin | Alomone Labs | T-550 | |
| Software, algorithm | Clampfit v10.7 | Molecular Devices | ||
| Software, algorithm | Geneious v11.0.5 | geneious.com | ||
| Software, algorithm | mothur v1.39.5 | mothur.org | ||
| Software, algorithm | RStudio (v3.6.1) | rstudio.com | ||
| Other | Oasis MCX cartridge | Waters | 186000252 | |
| Other | Acquity UPLC BEH amide column | Waters | 186004801 |
Additional files
Download links
A two-part list of links to download the article, or parts of the article, in various formats.
Downloads (link to download the article as PDF)
Open citations (links to open the citations from this article in various online reference manager services)
Cite this article (links to download the citations from this article in formats compatible with various reference manager tools)
The skin microbiome facilitates adaptive tetrodotoxin production in poisonous newts
eLife 9:e53898.
https://doi.org/10.7554/eLife.53898


