Distinct neural contributions to metacognition for detecting, but not discriminating visual stimuli
- Wellcome Centre for Human Neuroimaging, University College London, United Kingdom
- Max Planck UCL Centre for Computational Psychiatry and Aging Research, University College London, United Kingdom
- Department of Experimental Psychology, University College London, United Kingdom
Figures
Figure 1
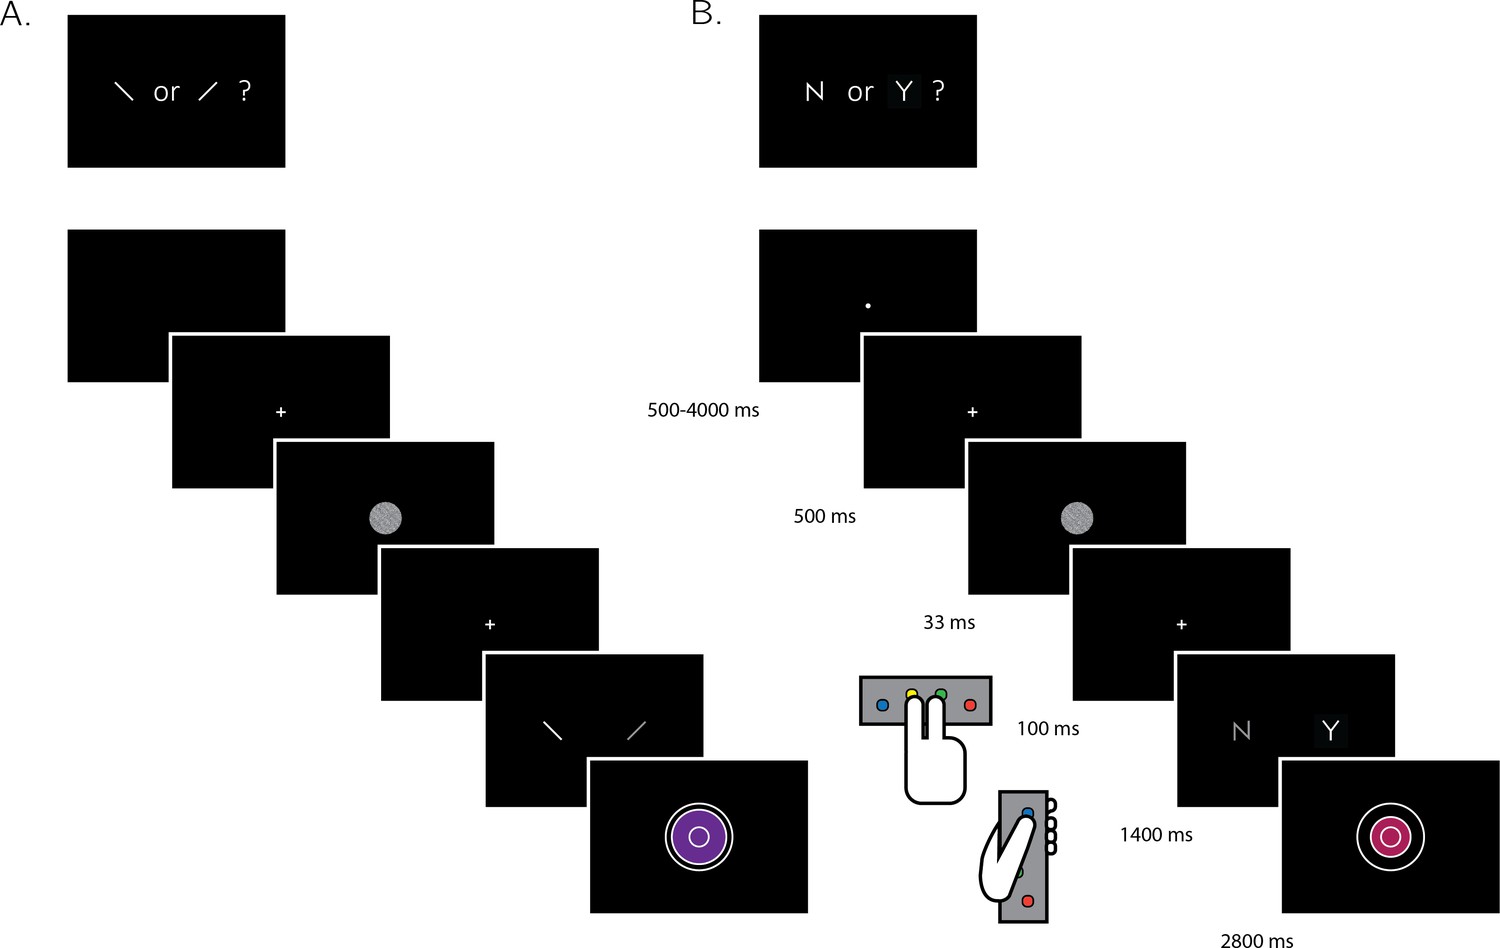
Experimental design for discrimination and detection trials.
Perceptual decisions were reported using the right index and middle fingers, and confidence ratings were reported using the left thumb. (A) In discrimination blocks, participants indicated the orientation of a visual grating (clockwise or anticlockwise). (B) In detection blocks, participants indicated whether a grating was embedded in the random noise, or not (yes or no). Confidence ratings were made by varying the size and color of a circle, with 6 options ranging from small and red to big and blue. For half of the subjects, high confidence was mapped to a small, red circle. For the other half, high confidence was mapped to a big, blue circle. The initial size and color of the circle was determined randomly at the beginning of the confidence rating phase. Participants performed 10 interleaved 40-trial detection and discrimination blocks inside a 3T MRI scanner.
Figure 2
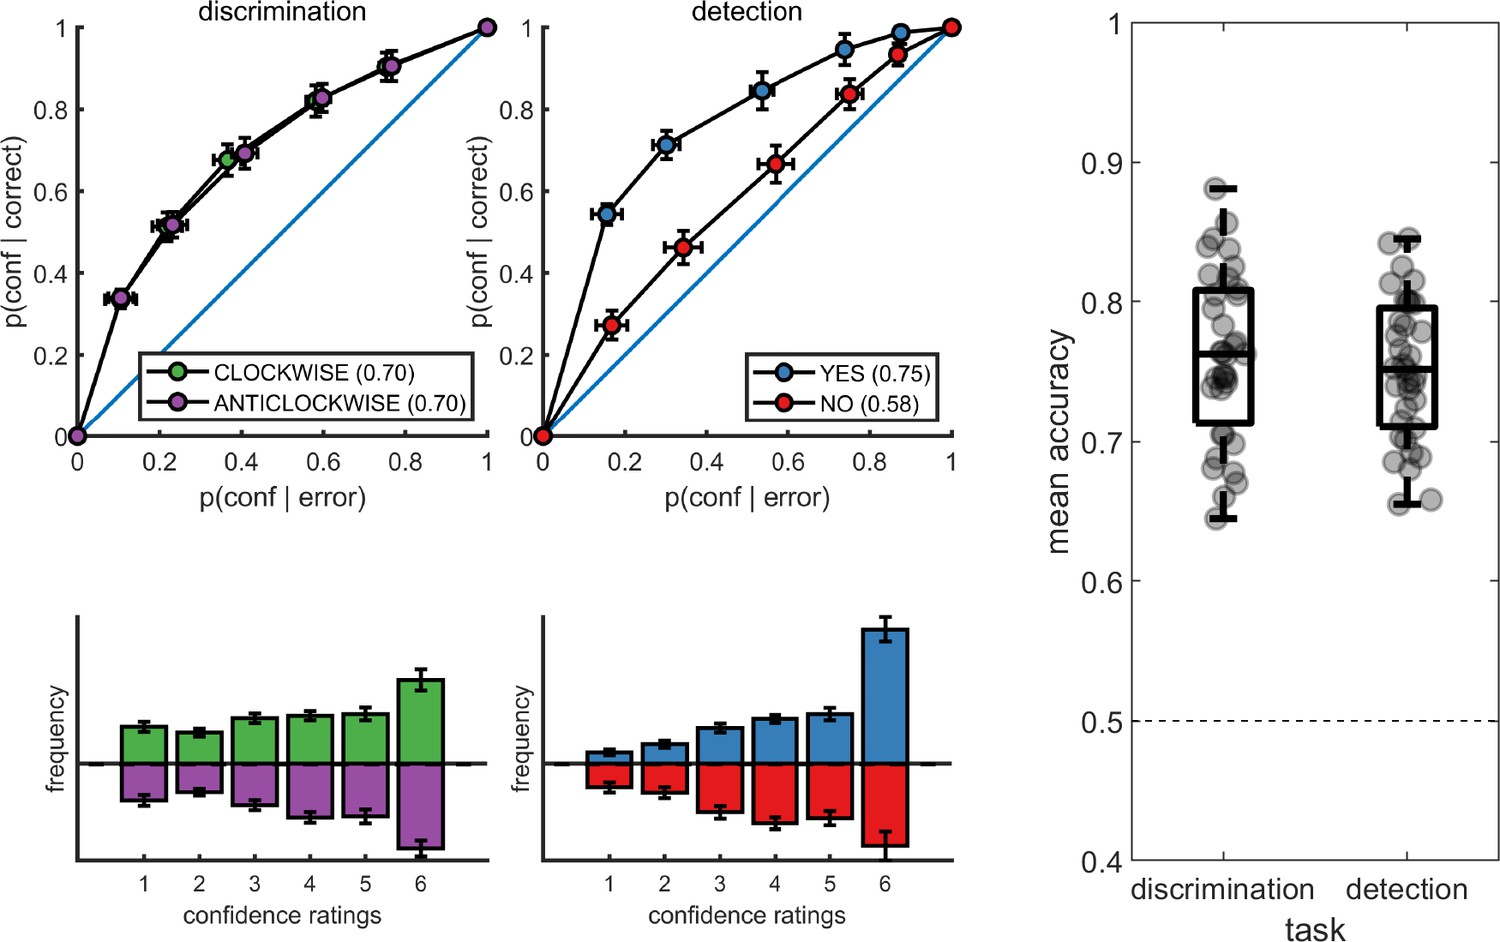
Upper panels: response conditional type-2 ROC curves.
In parentheses: the mean area under the curve. Lower panels: distribution of confidence ratings for the two tasks and four responses. Right panel: Mean accuracy for both tasks. Error bars represent the standard error of the mean.
Figure 3
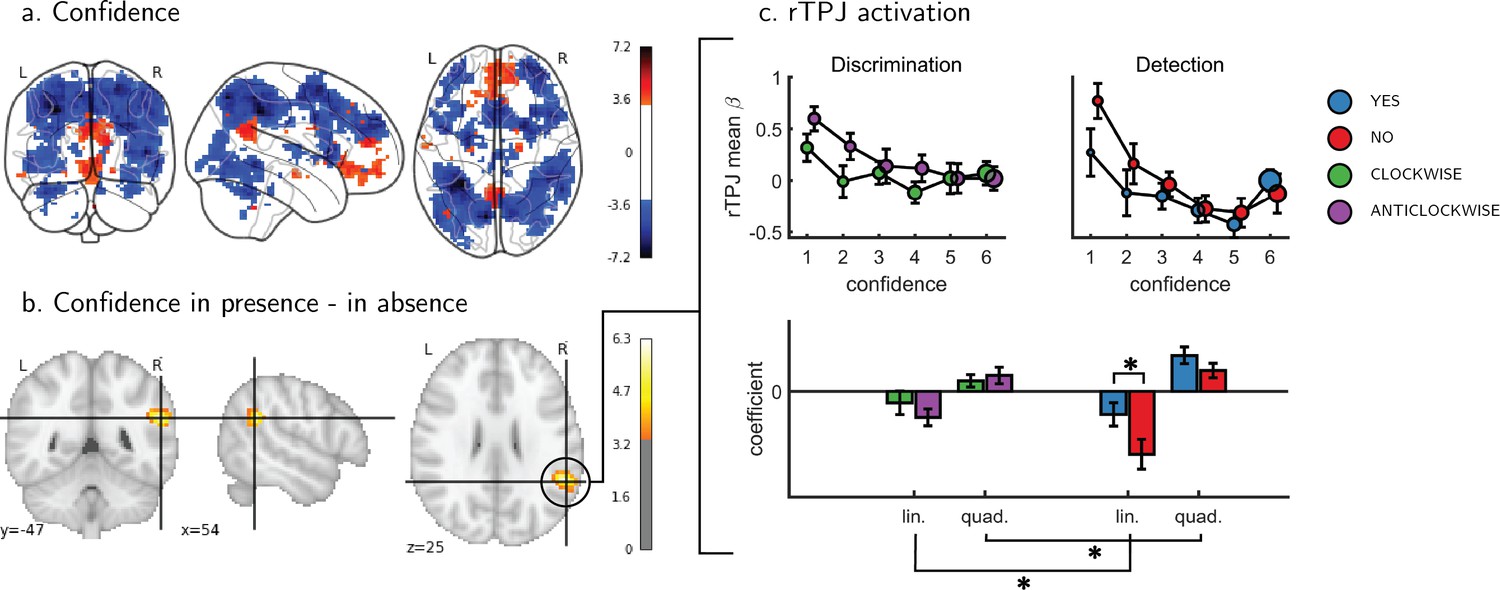
Univariate parametric effect of confidence.
(a) Glass brain visualization of global effect of confidence, thresholded at the single voxel level for visualization (p<0.001, uncorrected). Negative confidence effect appears in blue, and positive effect in red. (b) Whole brain contrast between confidence in ‘target present’ (yes) and ‘target absent’ (no) detection responses, corrected for family-wise error rate at the cluster level (p<0.05) with a cluster defining threshold of p<0.001, uncorrected. (c) Upper panel: BOLD signal in the rTPJ cluster from panel b as a function of response and confidence. lower panel: mean coefficients of response- and subject-specific multiple linear regression models, predicting rTPJ activation as a linear and quadratic function of confidence. * - p<0.05; uncorrected for multiple comparisons across the four tests. Comparison lines above and below the x axis indicate main effect of response and task, respectively.
Figure 4
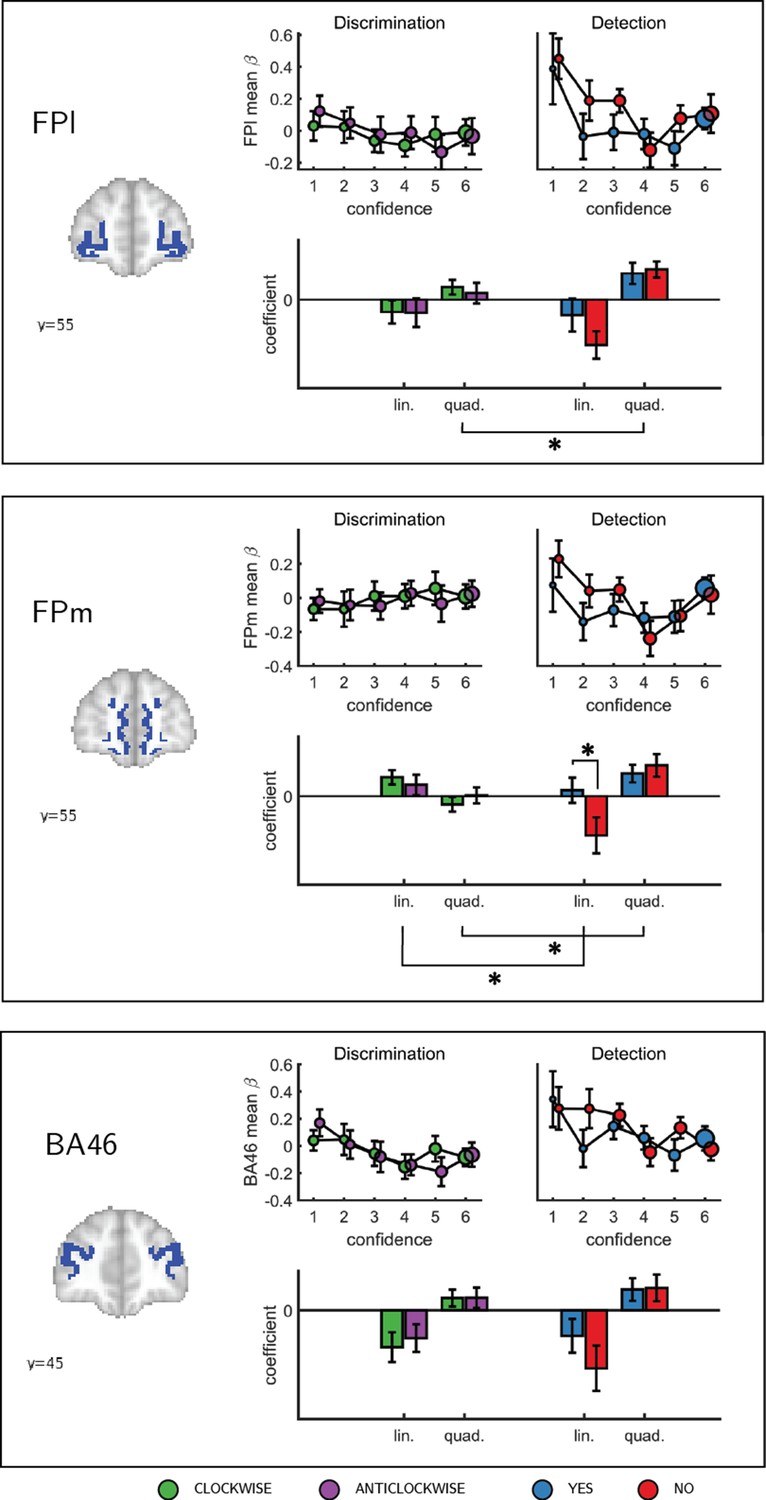
Confidence effect as a function of response in the frontopolar cortex separated into its three anatomical subcomponents: FPm, FPl, and BA 46.
Same conventions as in Figure 3c. * - p<0.05; uncorrected for multiple comparisons. Comparison lines above and below the x axis indicate main effect of response and task, respectively.
Figure 5
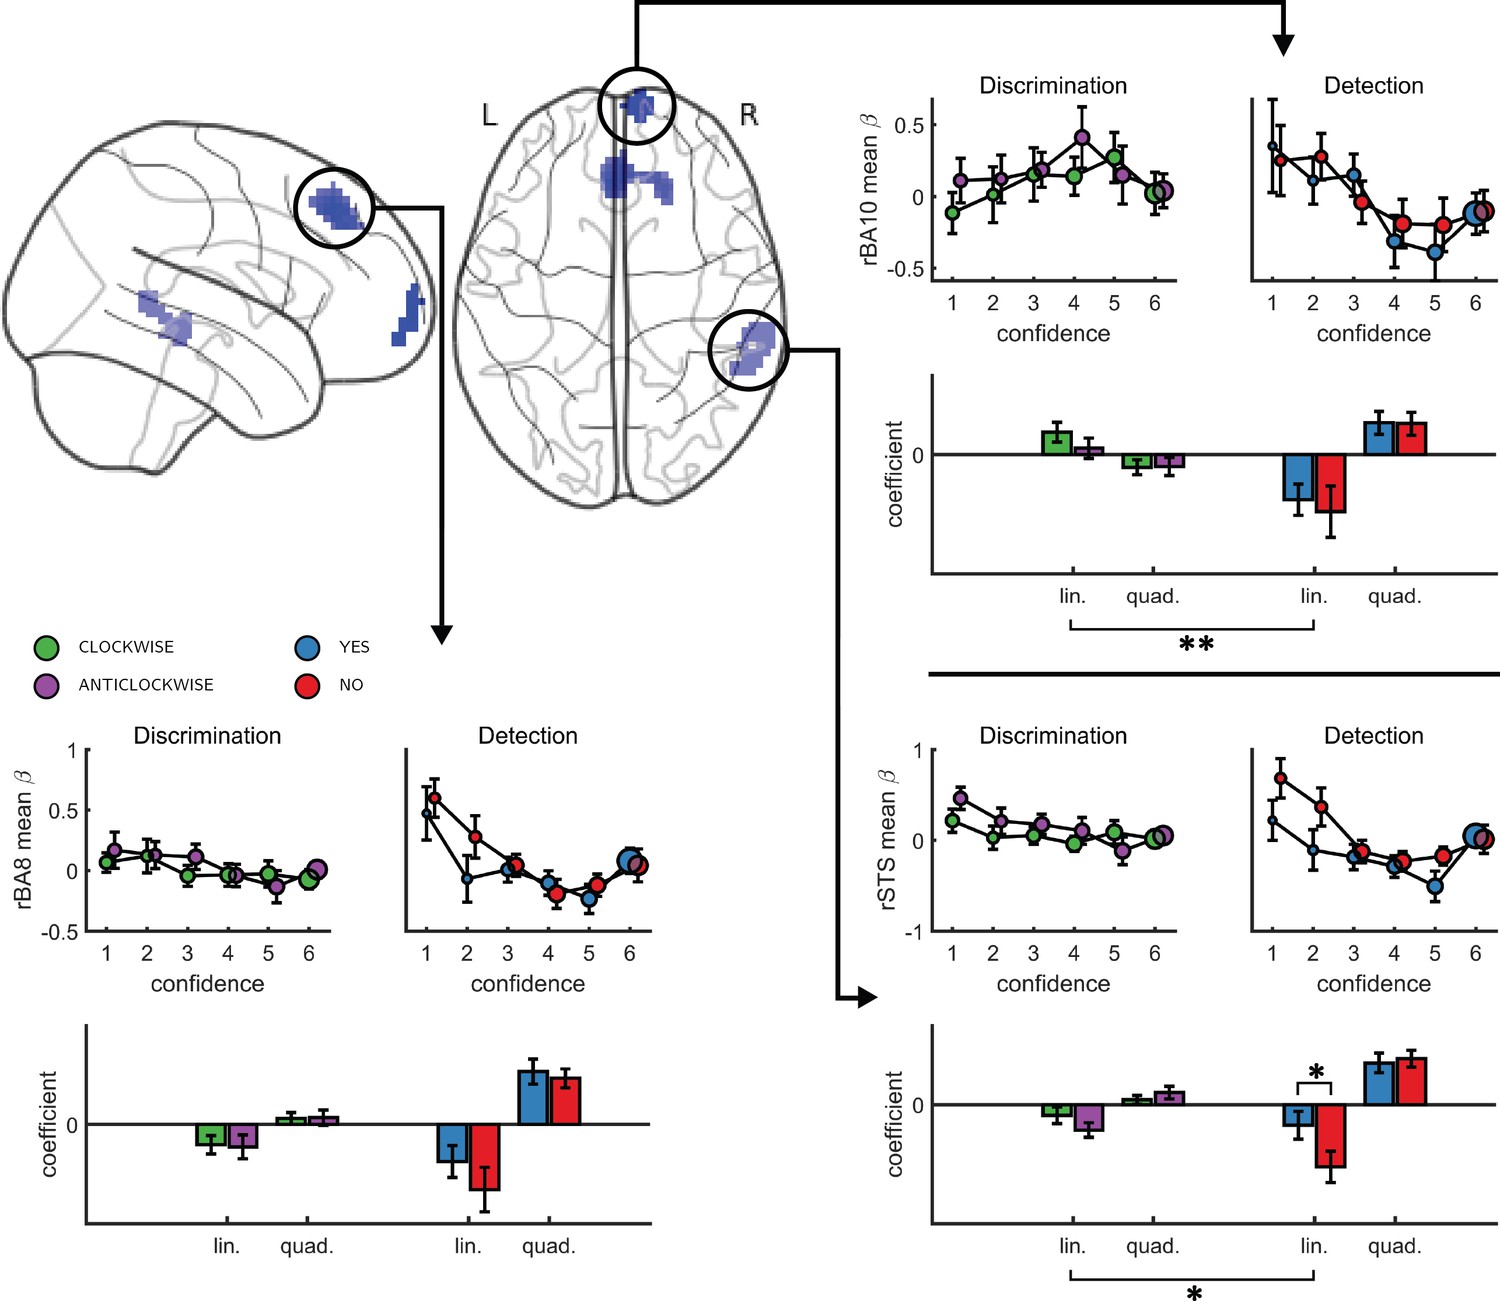
Left, top panel: a glass-brain representation of a contrast between the quadratic effects of confidence in detection and in discrimination, whole-brain corrected for family-wise error rate at the cluster-level (p<0.05) with a cluster-defining threshold of p<0.001, uncorrected.
Remaining panels: mean betas from the categorical model for each of the four responses and six confidence ratings, for the three indicated clusters. The second-order polynomial coefficients for these estimates are presented below each plot. Significance is only indicated for the linear effects, which are orthogonal to the quadratic contrast used to select the clusters. * - p<0.05; ** - p<0.01. Comparison lines above and below the x axis indicate main effect of response and task, respectively.
Figure 6
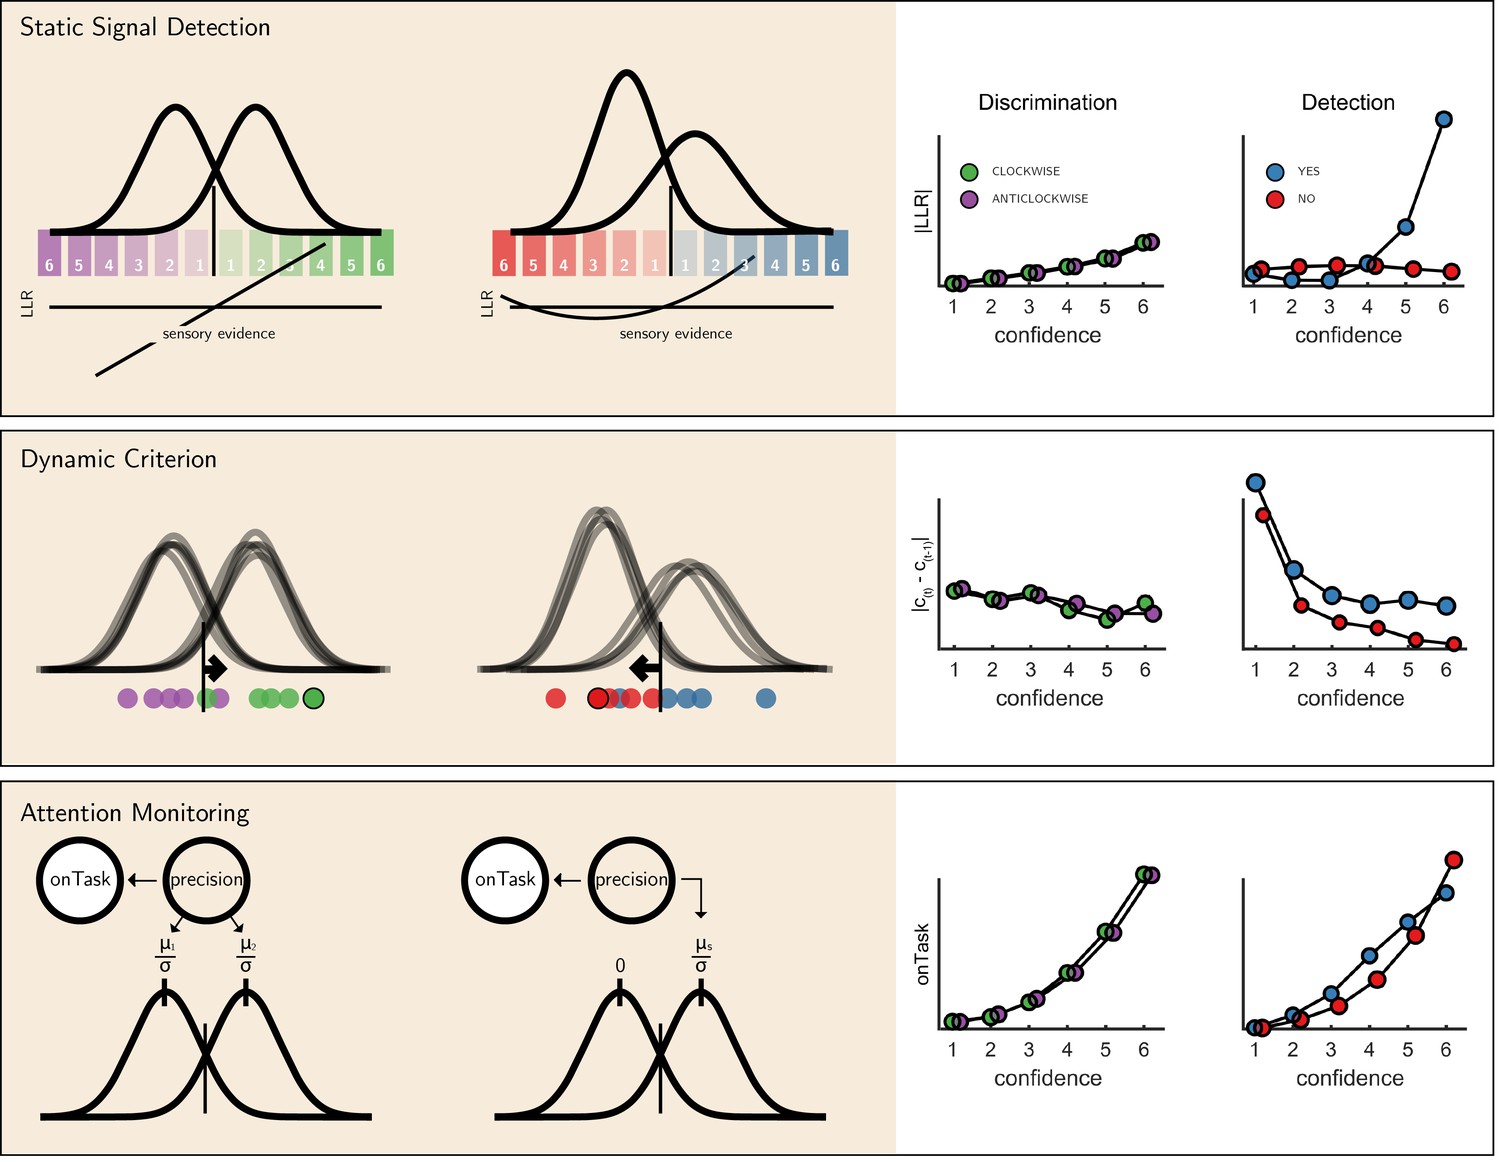
The three models (left) and their prediction for confidence effects (right).
Top panel: In Signal Detection Theory, perceptual decisions and confidence ratings are generated by comparing the sensory evidence to a fixed set of criteria. In detection the ’signal’ distribution is assumed to have higher variance. Plotting the absolute value of the log likelihood ratio as a function of decision and confidence results in a linear curve for discrimination, and a pronounced quadratic effect for yes responses in detection, an effect that is specific to unequal-variance SDT. Middle panel: In a Dynamic Criterion model beliefs about the mean and variance of the perceptual distributions are updated as a function of incoming samples (plotted as circles) and the decision criterion is shifted accordingly. Plotting the absolute change in criterion placement as a function of decision and confidence results in a quadratic effect of confidence for detection responses only. Bottom: In the Attention Monitoring model, beliefs about overall attentiveness (’onTask’ node) probabilistically reflect sensory precision. Plotting beliefs about overall attentiveness as a function of decision and confidence results in an overall quadratic effect of confidence, and an interaction between yes and no responses in detection. For a detailed specification of all three models see appendix sections 9, 10 and 11.
Appendix 1—figure 1
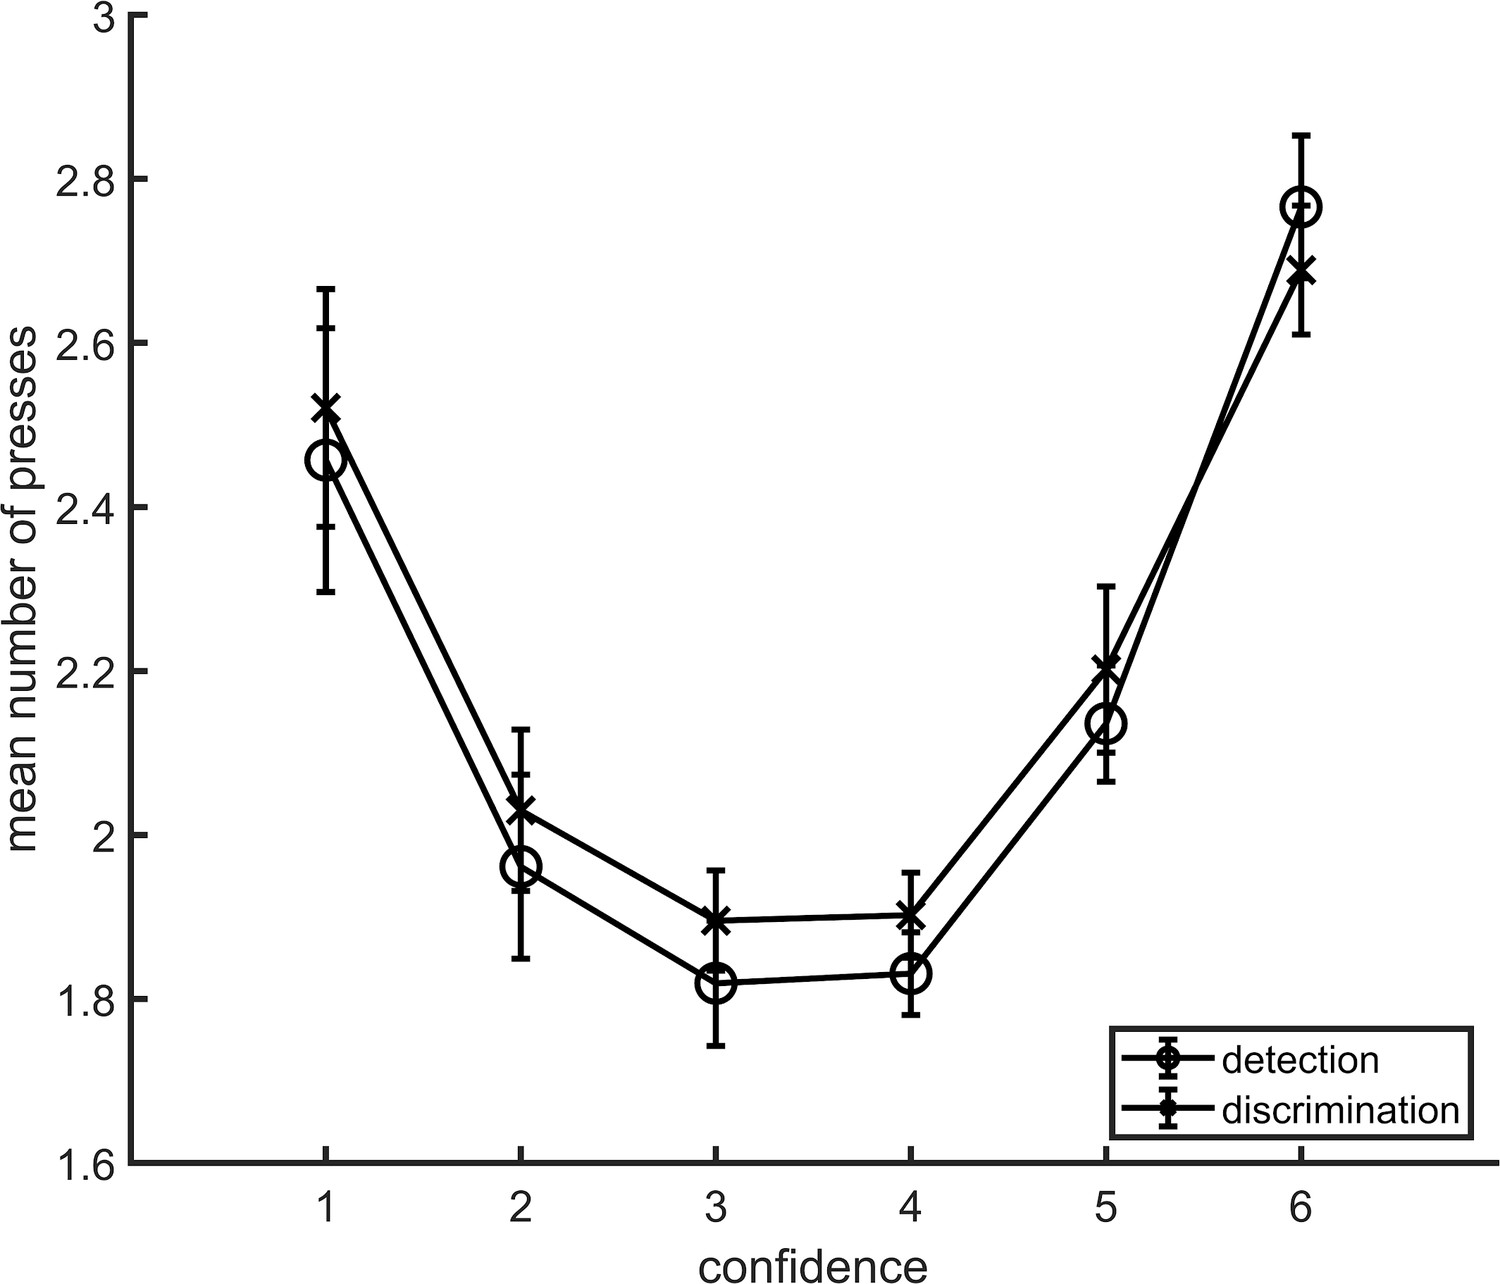
Average number of button presses for each confidence level, as a function of task.
More button presses were needed on average to reach the extreme confidence ratings, hence the quadratic shape. No difference between the two tasks was observed in the mean number of button presses for any of the confidence levels. Error bars represent the standard error of the mean.
Appendix 2—figure 1
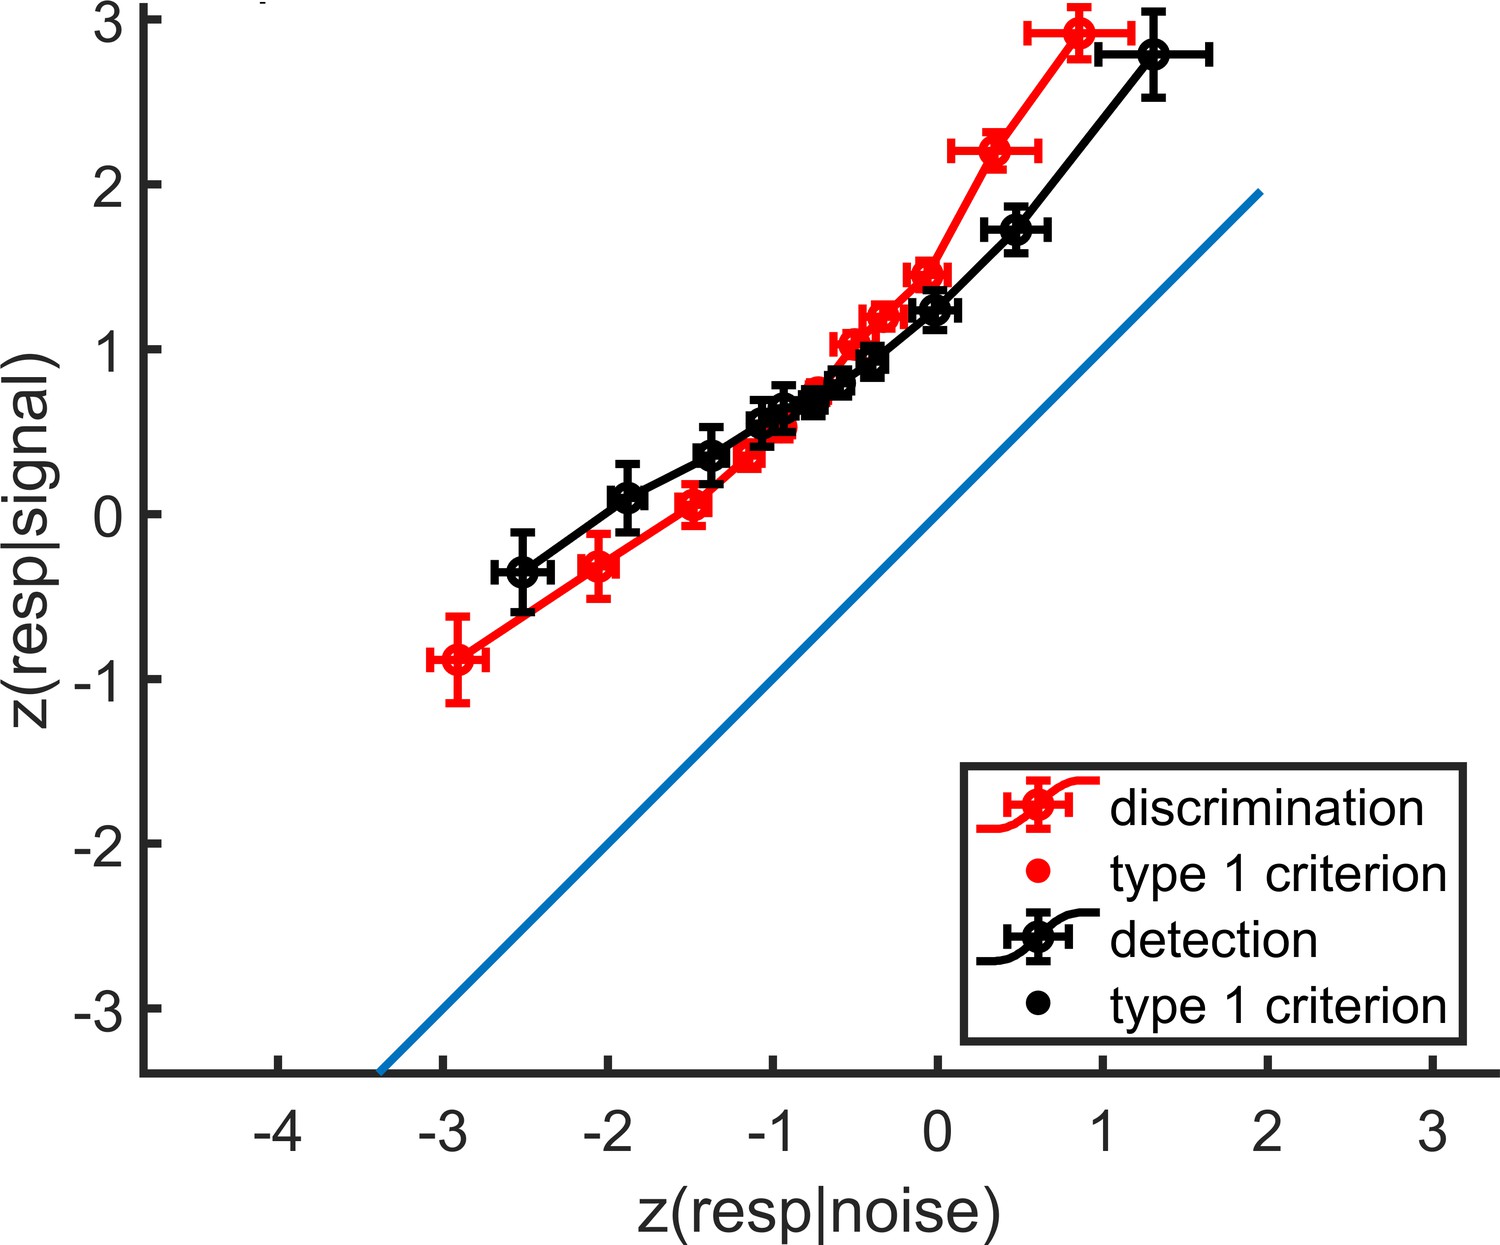
mean zROC curves for the discrimination and detection tasks.
As expected in a uv-SDT setting, the discrimination curve is approximately linear with a slope of 1, and the detection curve is approximately linear with a shallower slope. Error bars represent the standard error of the mean.
Appendix 3—figure 1
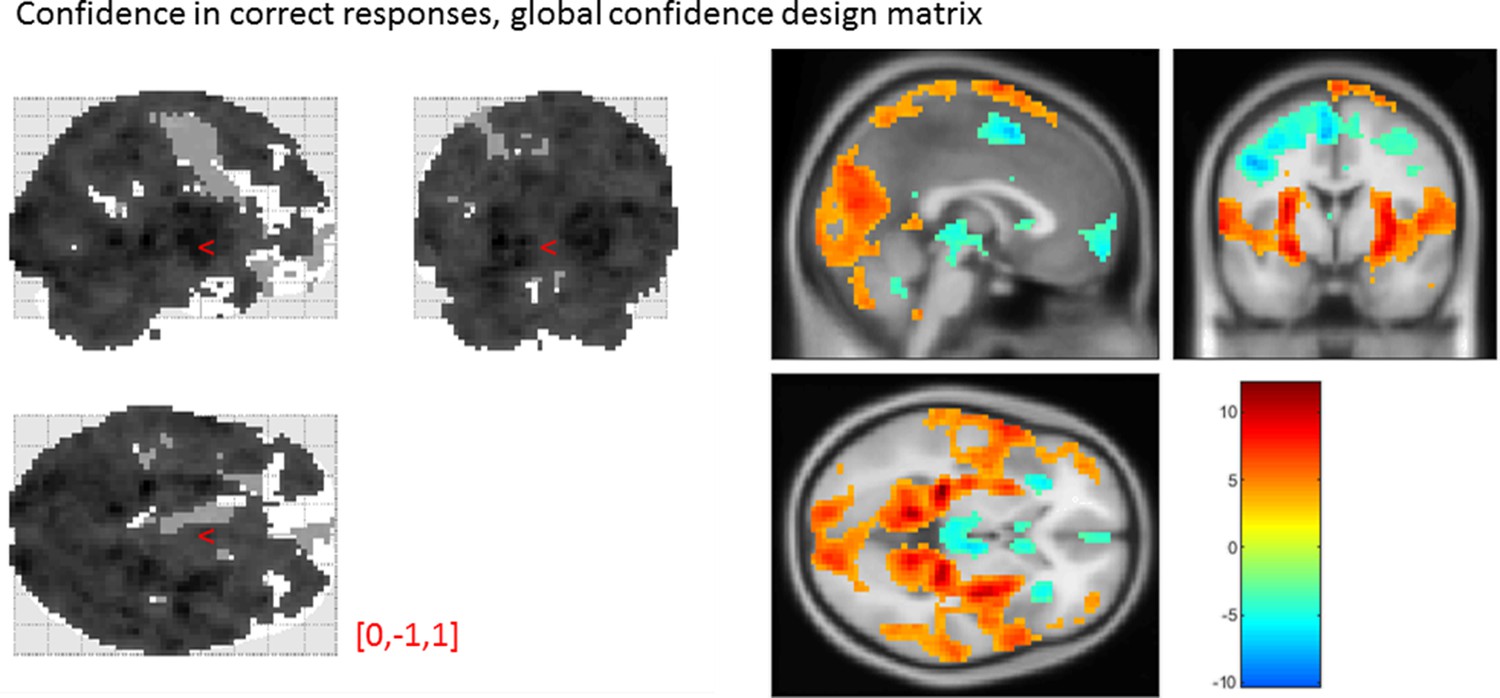
Effect of confidence in correct responses, from the global-confidence design matrix.
Uncorrected, thresholded at p<0.001. Left: glass brain visualization of the whole brain contrast. Right: yellow-red represent a positive correlation with subjective confidence ratings, and green-blue represent a negative correlation.
Appendix 4—figure 1
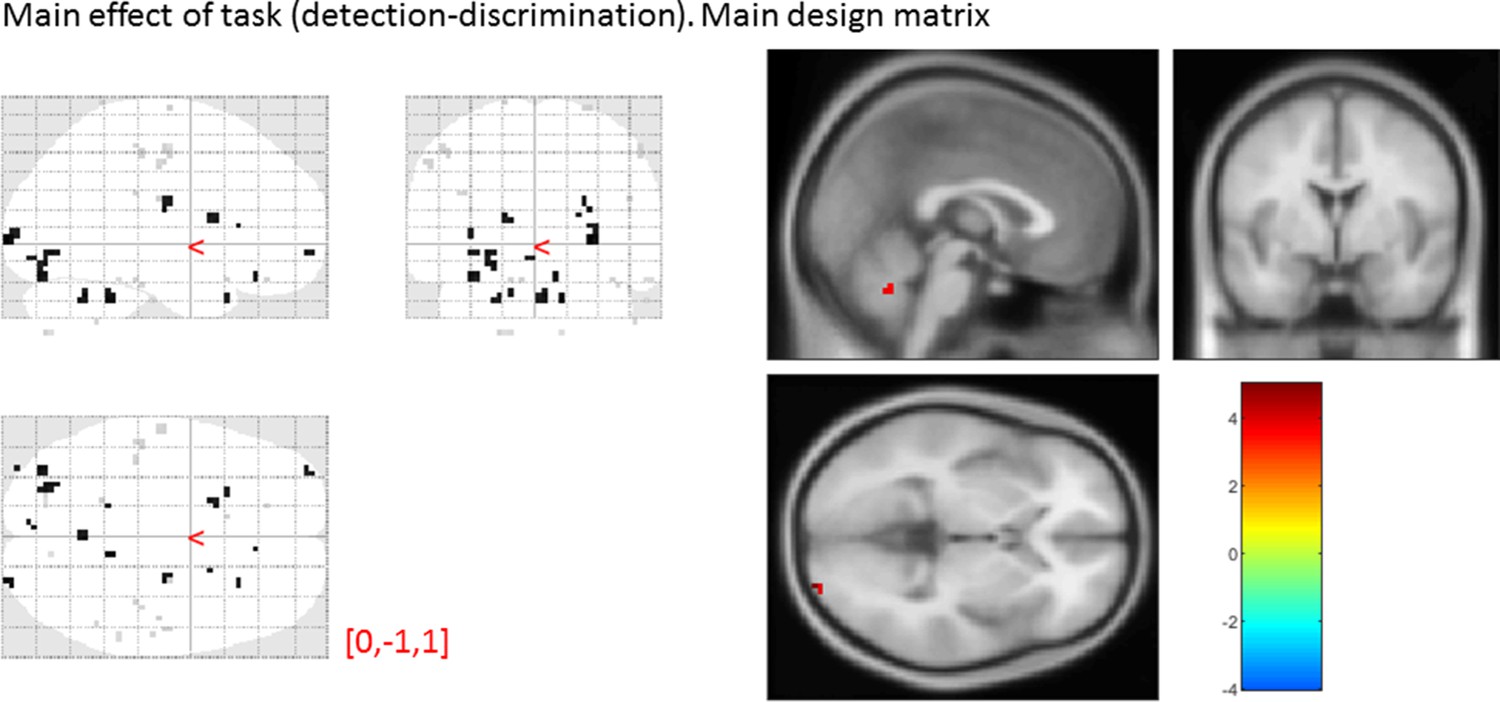
main effect of task, from the main design matrix.
Uncorrected, thresholded at p<0.001. Left: glass brain visualization of the whole brain contrast. Right: yellow-red represent stronger activations in detection, and green-blue in discrimination. None of our ROIs showed a main effect of task (detection vs. discrimination).
Appendix 5—figure 1

Effect of confidence in all 4 ROIs, as a function of task and response, as extracted from the categorical design matrix.
No significant interaction between the linear or quadratic effects and task or response was observed in any of the ROIs.
Appendix 6—figure 1
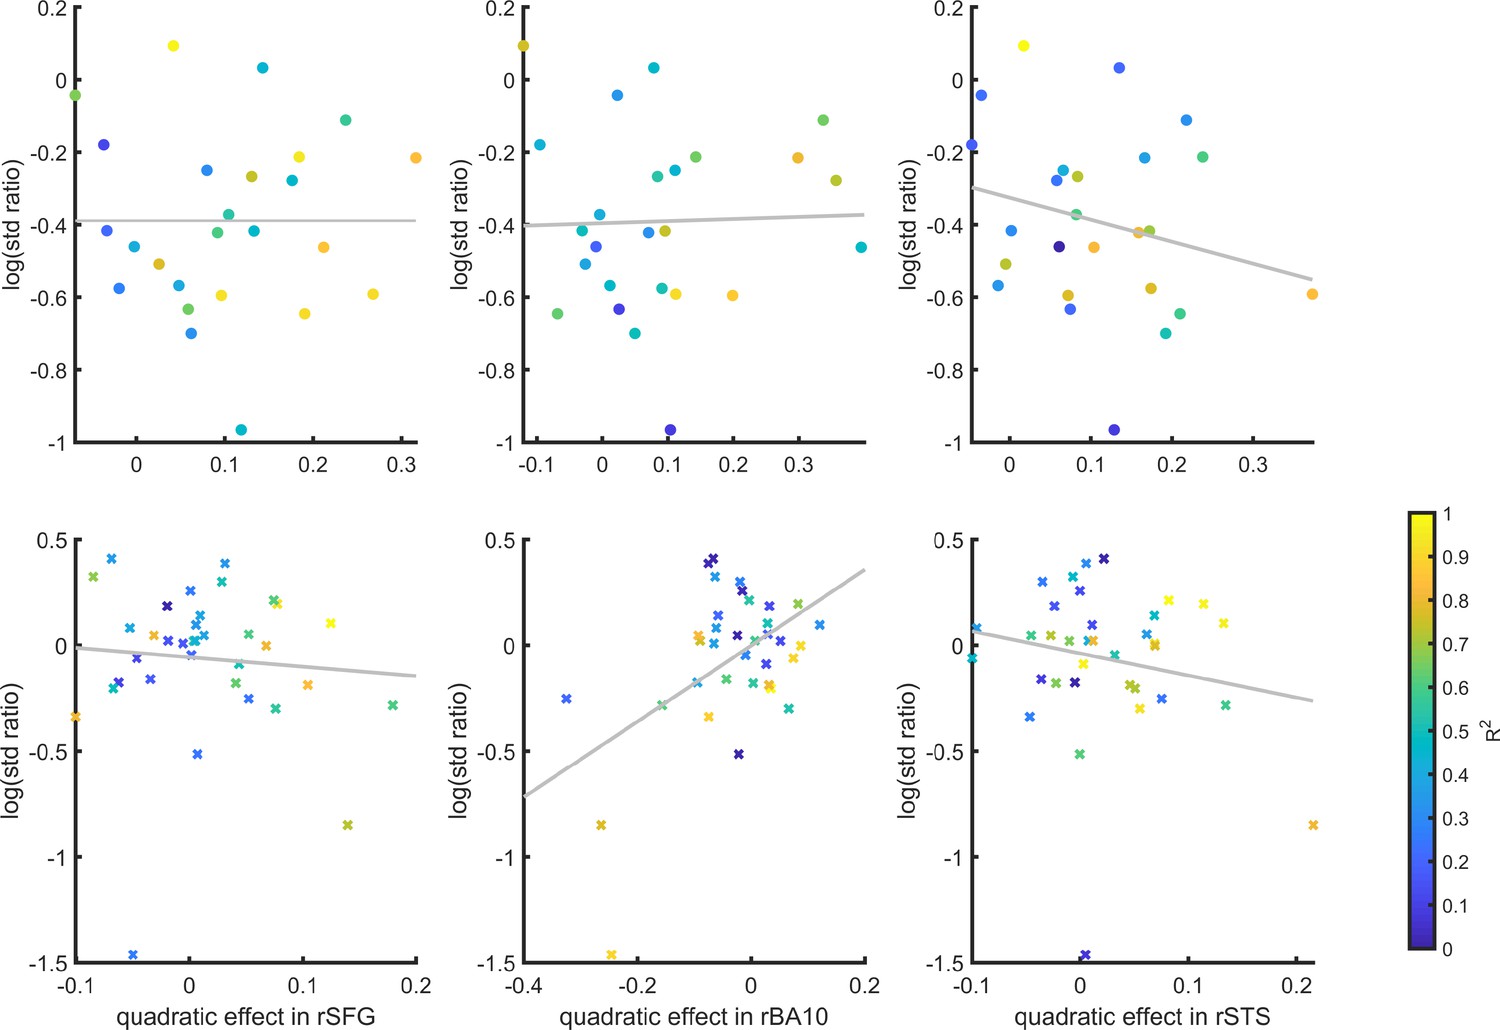
Inter-subject correlation between the quadratic effect in the right hemisphere clusters and the ratio between the detection (top panel) and discrimination (lower panel) distribution variances, as estimated from the zROC curve slopes in the two tasks.
Marker color indicates the goodness of fit of the second-order polynomial model to the BOLD data. All Spearman correlation coefficients are <0.25.
Appendix 7—figure 1
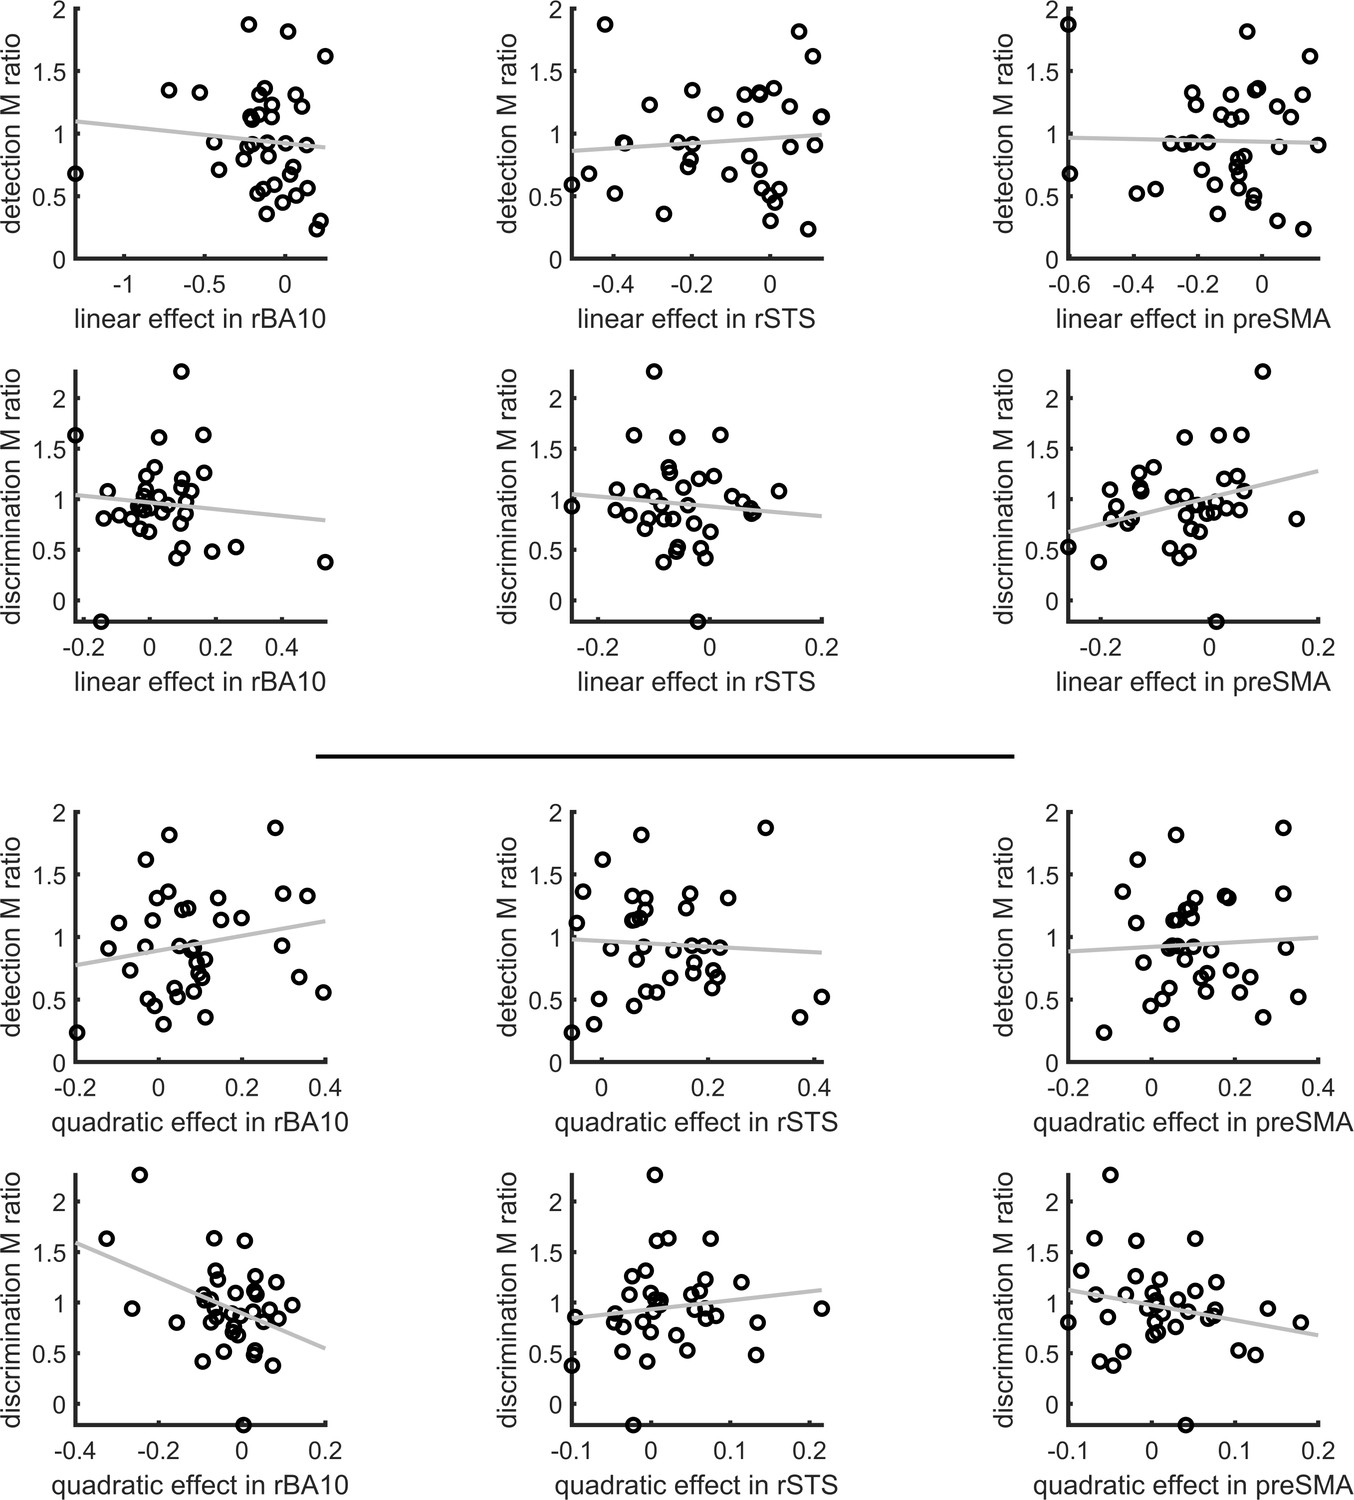
Inter-subject correlation between the linear (upper panel) and quadratic (lower panel) effects in the right hemisphere clusters and the metacognitive efficiency scores (measured as M ratio = meta-d'/d', Maniscalco and Lau, 2012).
Appendix 8—figure 1
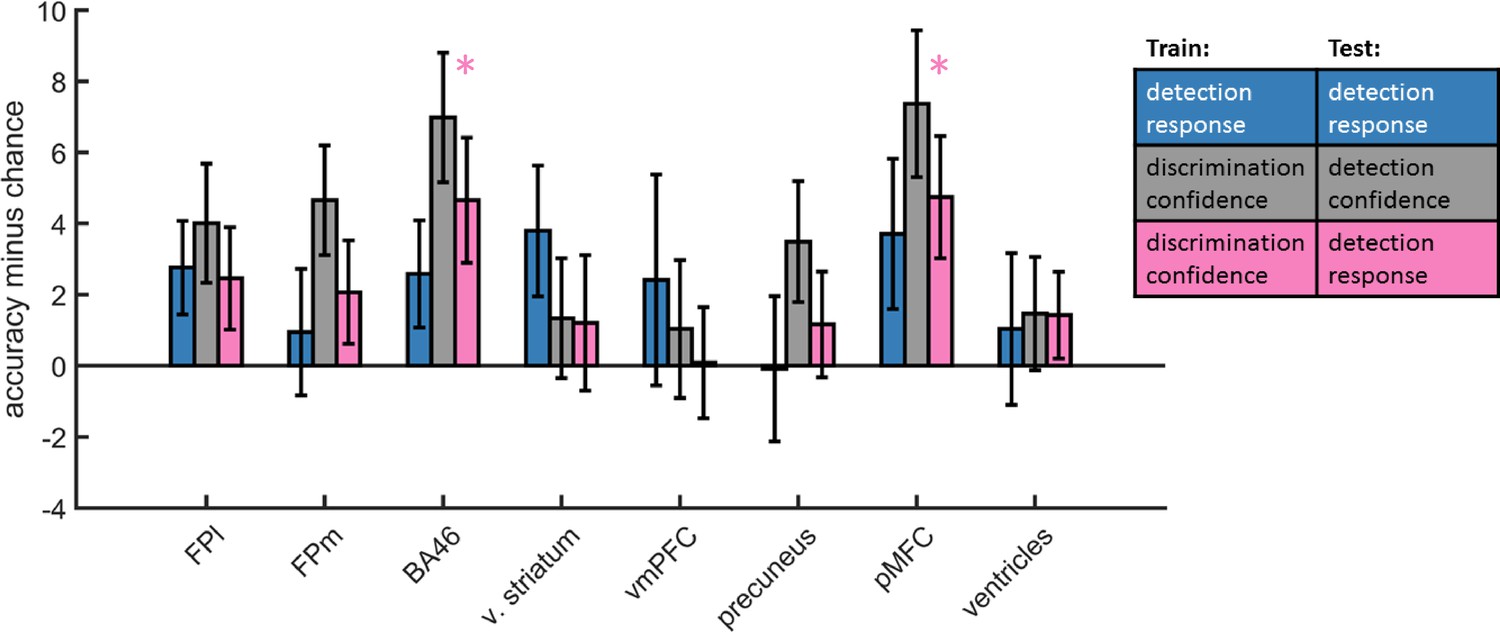
Accuracy minus chance for classification of response in detection (yes vs. no; blue), and from a cross-classification between tasks: confidence in detection and confidence in discrimination (gray), and confidence in discrimination and decision in detection (pink).
In order to dissociate between brain regions that encode stimulus visibility and brain regions that encode decision confidence, we performed a multivariate cross-classification analysis. We trained a linear classifier on detection decisions (yes and no), and tested it on discrimination confidence (high and low), and vice versa. Shared information content between detection responses and confidence in discrimination is expected in brain regions that encode stimulus visibility, rather than accuracy estimation. In detection, yes responses are associated with higher stimulus visibility compared to no responses (regardless of decision confidence), and in discrimination high confidence trials are associated with higher visibility than low confidence trials (regardless of subjective confidence).
Presented cross classification scores are the mean of cross classification accuracies in both directions. Detection-response and discrimination-confidence cross-classification was significantly above chance in in the pMFC (t(29)=2.76, p<0.05, corrected for family-wise error across the four ROIs), and in the BA46 anatomical subregion of the frontopolar ROI (t(29)=2.64, p<0.05, corrected).
Tables
Table 1
List of regressors in the main design matrix (DM-1).
| Task | Stimulus | Response | ||
|---|---|---|---|---|
| 1 | CW_CW | Discrimination | Clockwise | Clockwise |
| 2 | CW_CW_conf | |||
| 3 | CW_ACW | Discrimination | Clockwise | Anticlockwise |
| 4 | CW_ACW_conf | |||
| 5 | ACW_CW | Discrimination | Anticlockwise | Clockwise |
| 6 | ACW_CW_conf | |||
| 7 | ACW_ACW | Discrimination | Anticlockwise | Anticlockwise |
| 8 | ACW_ACW_conf | |||
| 9 | P_P | Detection | Present | Present |
| 10 | P_P_conf | |||
| 11 | P_A | Detection | Present | Absent |
| 12 | P_A_conf | |||
| 13 | A_P | Detection | Absent | Present |
| 14 | A_P_conf | |||
| 15 | A_A | Detection | Absent | Absent |
| 16 | A_A_conf |
Additional files
Download links
A two-part list of links to download the article, or parts of the article, in various formats.
Downloads (link to download the article as PDF)
Open citations (links to open the citations from this article in various online reference manager services)
Cite this article (links to download the citations from this article in formats compatible with various reference manager tools)
Distinct neural contributions to metacognition for detecting, but not discriminating visual stimuli
eLife 9:e53900.
https://doi.org/10.7554/eLife.53900


