Structure of the human BBSome core complex
- Max Planck Institute of Molecular Physiology, Germany
Figures
Figure 1 with 6 supplements
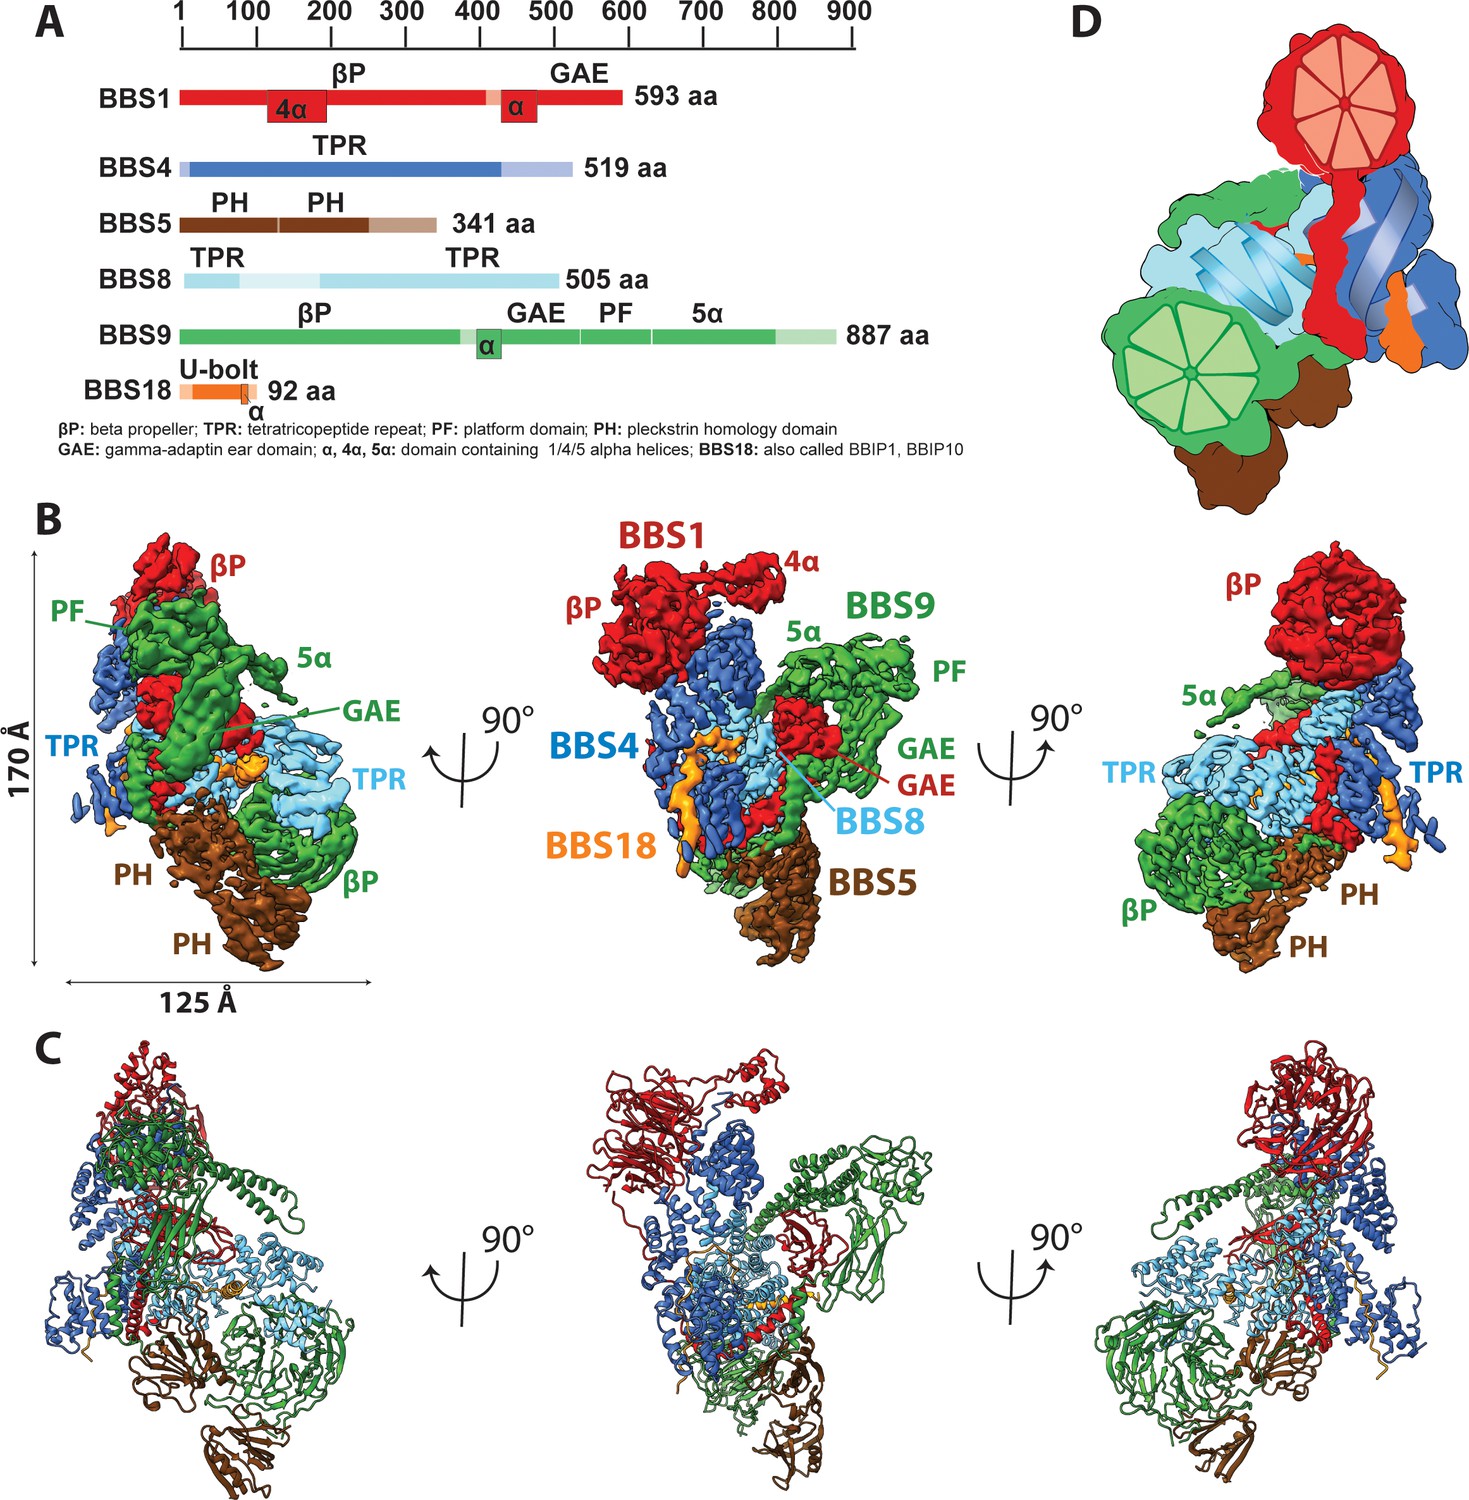
Architecture of the BBSome.
(A) Domain architecture of the protomers forming the BBSome core complex. The parts of the primary structure that could be assigned in the density is shown in full colors, while non-modeled regions are represented in opaque colors. (B) Composite cryo-EM density map of the BBSome core complex in different orientations. Each protomer is colored differently and the thresholds of the segmented densities of the individual domains were adjusted to visualize each domain at an optimal signal intensity. BBS5 is poorly visible at the signal level of the other subunits and required a reconstruction from a subset of particles, which was obtained by 3D-sorting (Figure 1—figure supplement 1). (C) The final model of the core BBSome. (D): Schematic representation of the complex, highlighting the two β-propeller domains of BBS1 and BBS9 as red and green segmented wheels, and the super helical arrangements of the TPR repeats of BBS4 and BBS8 as blue and cyan helices.
Figure 1—figure supplement 1

Positioning of BBS5 in the BBSome core complex.
(A) Pairs of exemplary 2D class averages of BBSome core complexes with and without BBS5 in different views (scale bar 5 nm) (B) Comparison of the reconstructions from all available data and the best obtained cluster after 3D sorting which contains BBS5. (C) The same view of the final, combined density map; (D) FSC curves of the full dataset compared to the best cluster containing BBS5; (E) fit of PH domains of BBS5 into density from Cluster1.
Figure 1—figure supplement 2
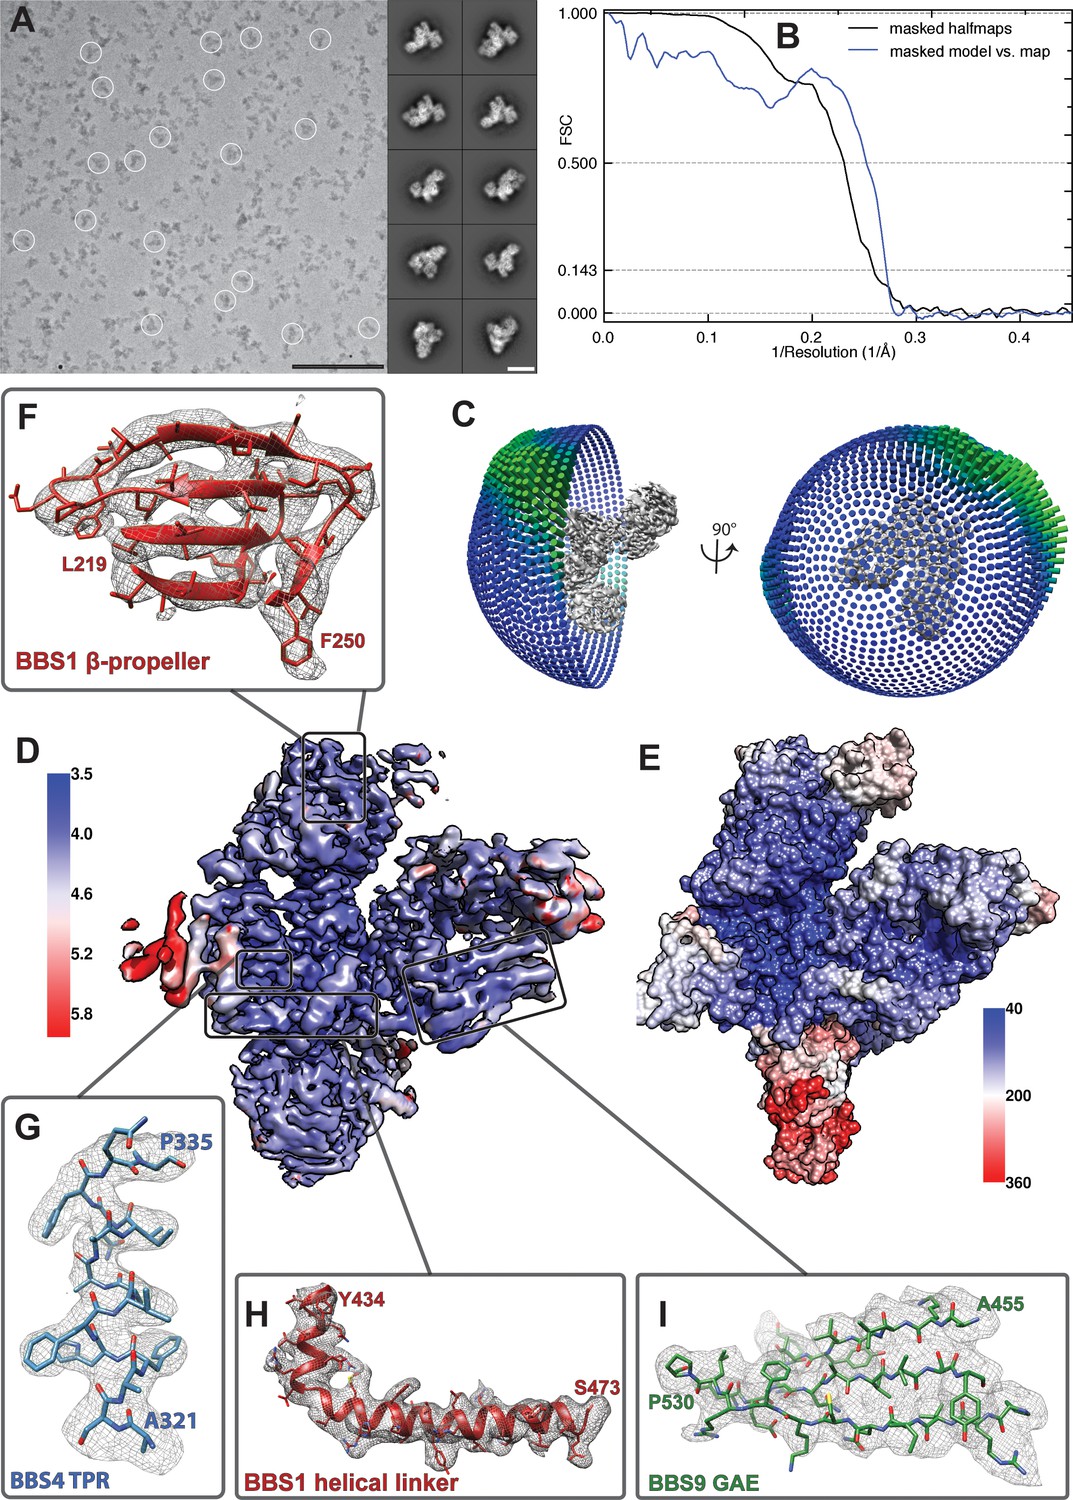
Quality of the model of the BBSome core complex.
(A) Cryo-EM micrograph and representative class averages of the core BBSome. Scale bars, 100 nm (micrograph) and 10 nm (class averages). (B) FSC of two independently refined half data sets (black line), as well as the FSC between the volume calculated from all particles and the molecular model of the core BBSome (blue line). (C) Angular distribution of particles that were used for the final reconstruction. (D) Cryo-EM density map of the full dataset colored according to local resolution. (E) Distribution of temperature factor (B-Factor) in the final model, including BBS5. The relative position and B-Factor distribution of BBS5 was derived from a reconstruction of a subset of particles (see Figure 1—figure supplement 1). (F–I) Examples of the molecular model and the corresponding electron density map from different regions of the structure.
Figure 1—figure supplement 3
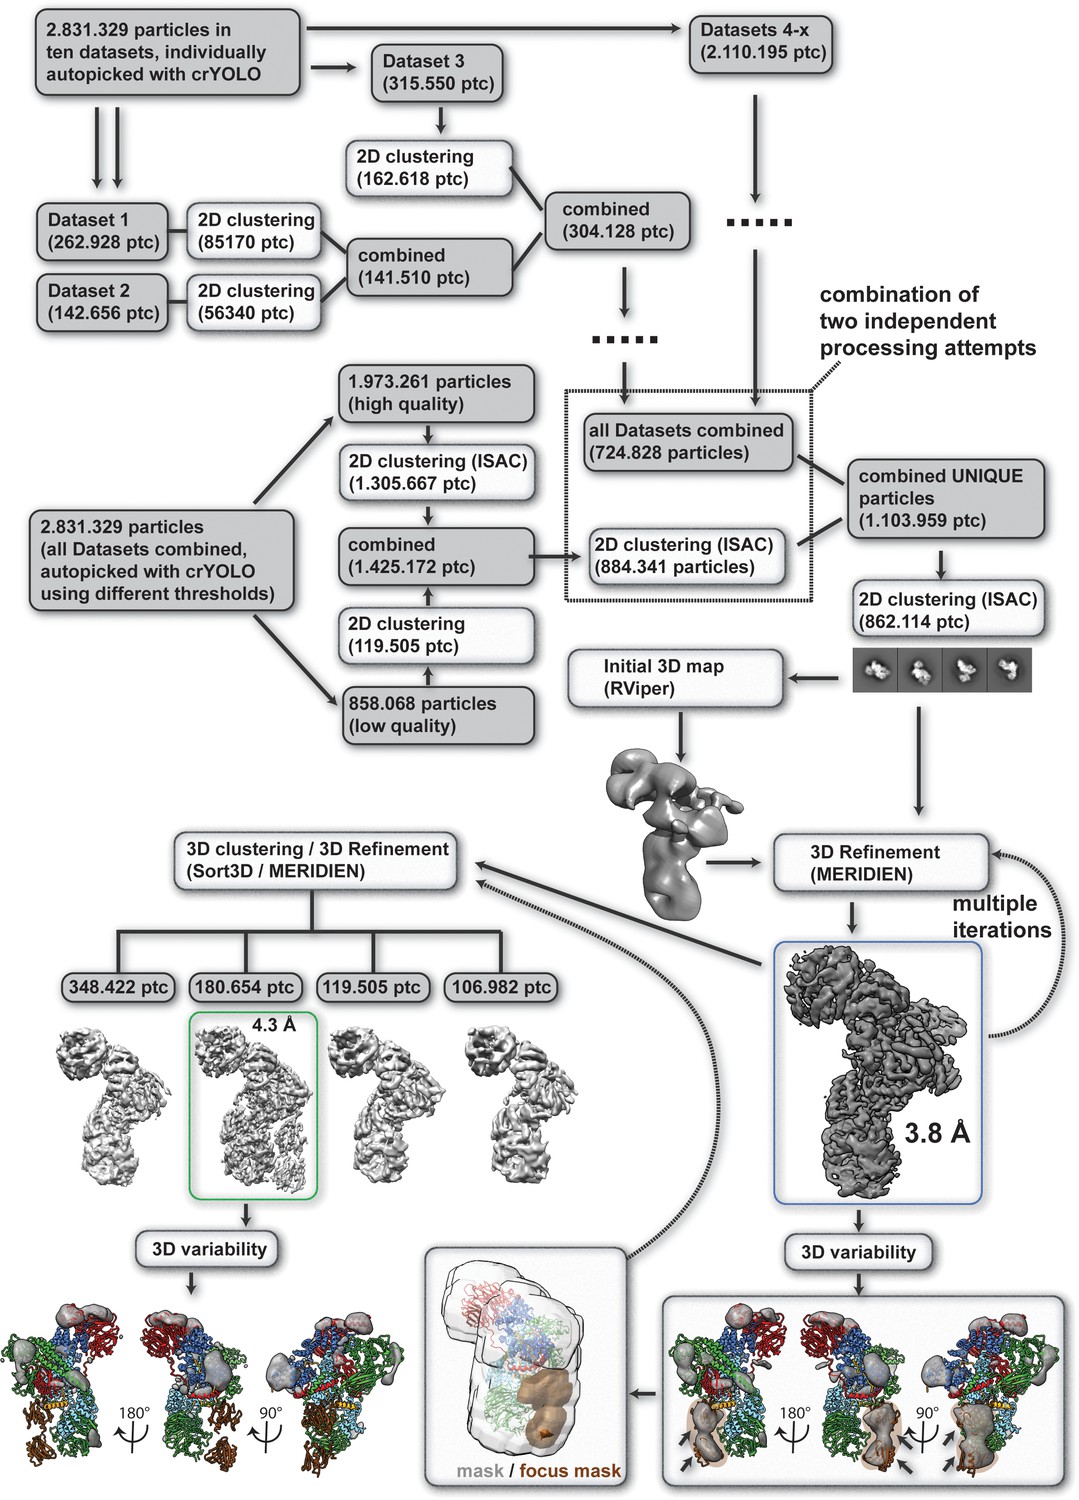
Single particle processing workflow for structure determination of the human core BBSome.
The map that was used for modelling BBSome subunits 1,4,8,9 and 18 is marked with a blue box, and the map that was used for BBS5 is marked with a green box.
Figure 1—figure supplement 4
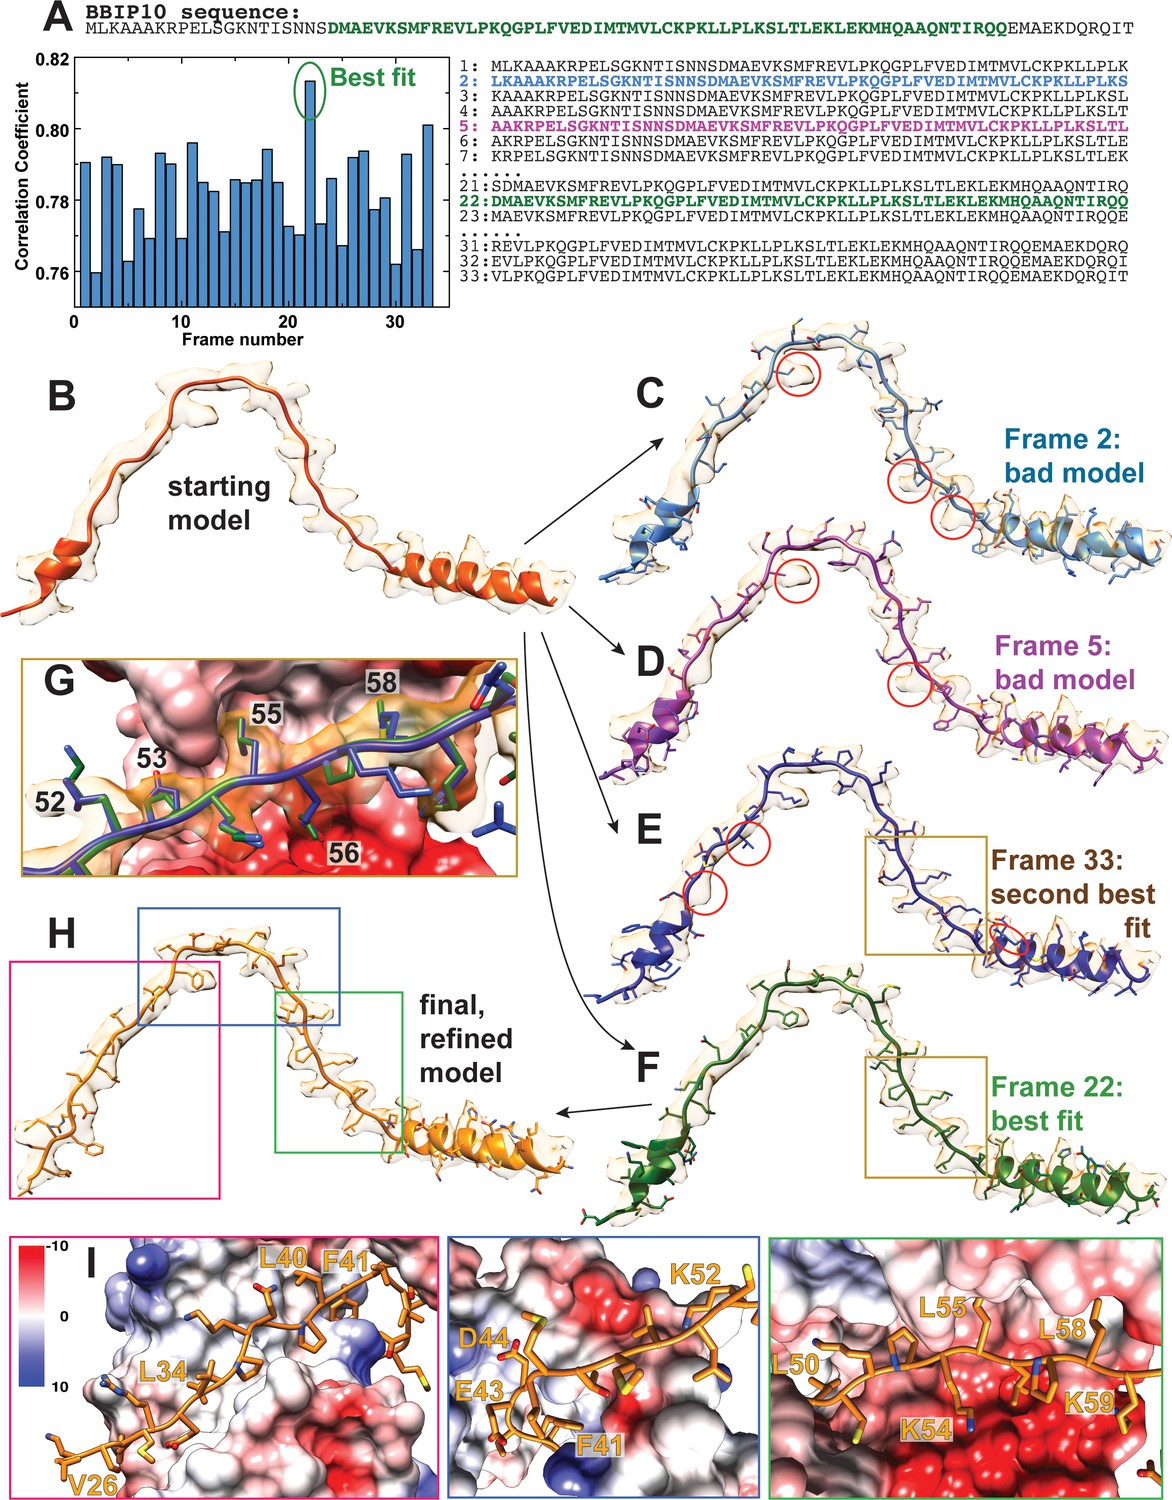
Sequence assignment of BBS18.
(A) Only about two third of the 92 residues of BBS18 are visible in the calculated electron density, and besides a short helical region the protomer contains no defined secondary structure, which complicates an assignment of the correct sequence frame. To unambiguously find the correct frame, we first built a poly-alanine model into the density (B). With only 92 residues of BBS18, there were 33 potential BBS18 sequence frames that could be assigned to the model. We generated all these 33 models, and further refined each of them using Phenix real-space refinement (Adams et al., 2010) (C–F). The correlation of the map to the refined model showed a clear best fit for frame 22 (F). Indeed, model #22 agreed best to the observed density. In contrast, the other models showed significant deviations from map to model that cannot be explained by noise, imperfect modelling or a lack of resolution (e.g. obvious side chain density for a residue that should not produce such density; C,D). The second best fit (model #33) also presented obvious discrepancies with the map, and more importantly, several charged residues (e.g. D53 and E56 in model #33) are positioned in a highly unfavorable chemical environment (G). In contrast, the interactions with other subunits are favorable for frame #22 (G,I). We used model 22 for further manual refinement to obtain the final BBS18 model (H).
Figure 1—figure supplement 5
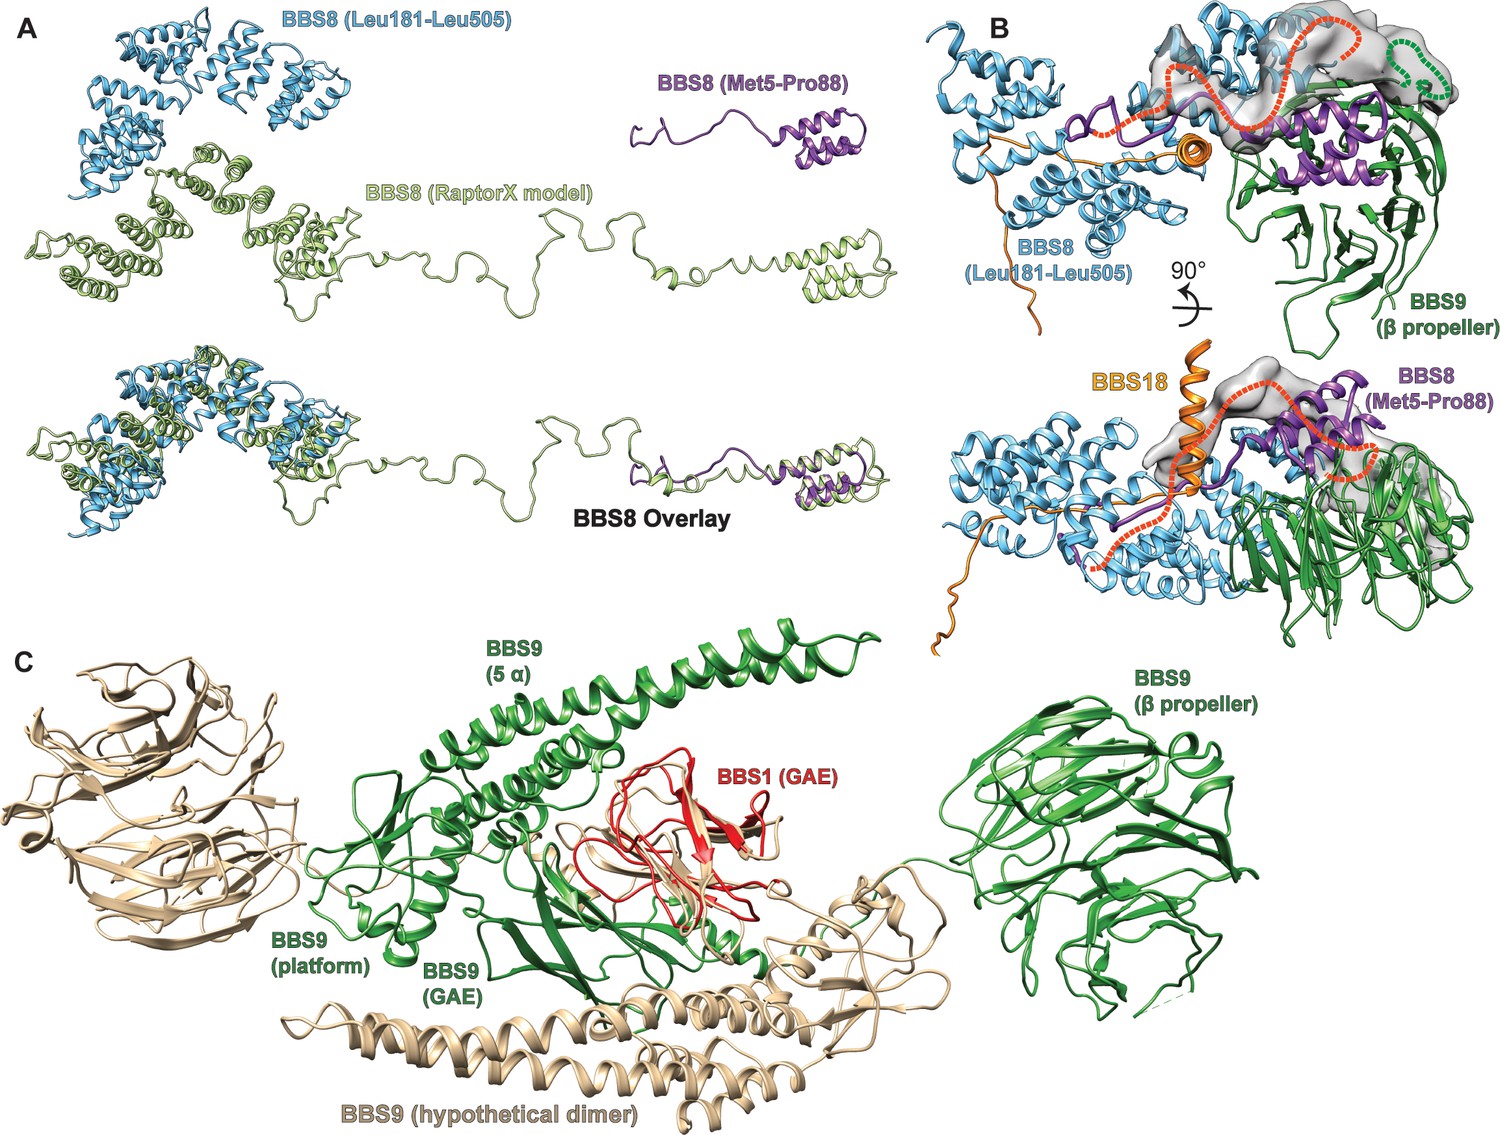
Partially structured insert in BBS8, and hypothetical model for BBS9 dimerization.
(A) A de novo structure prediction of human BBS8 as generated by Raptor X (Wang et al., 2018; Wang et al., 2016; Wang et al., 2017a; Wang et al., 2017b) indicates an unstructured region between a short N-terminal and a larger C-terminal TPR domain. This prediction is consistent with the final atomic model of BBS8 within the core BBSome structure, which contains both the N-and C-terminal TPR parts, but could only partially resolve the unstructured insert. (B) The N-terminus of BBS8 (purple ribbon) descends into an unstructured region that could partially be traced to loop through the center of the core BBSome complex, forming interactions with BBS8 and the U-bolt region of BBS18. Extra density indicates how the loop approximately winds back to connect to the C-terminal part of BBS8, which is also indicated by a red dashed line. The loop seems to interact with an unresolved insert within the BBS9 β-propeller that also contributes to the unexplained density (green dashed line). (C) Model for the dimerization of isolated BBS9 via its C-terminal GAE, platform and α-helical domains. A copy of BBS9 was superimposed with BBS1 via their homologous GAE domains, which provides a hypothetical dimerization interface of BBS9 that could explain why isolated BBS9 dimerizes via its C-terminus, while in the BBSome complex it does not dimerize (Klink et al., 2017).
Figure 1—figure supplement 6
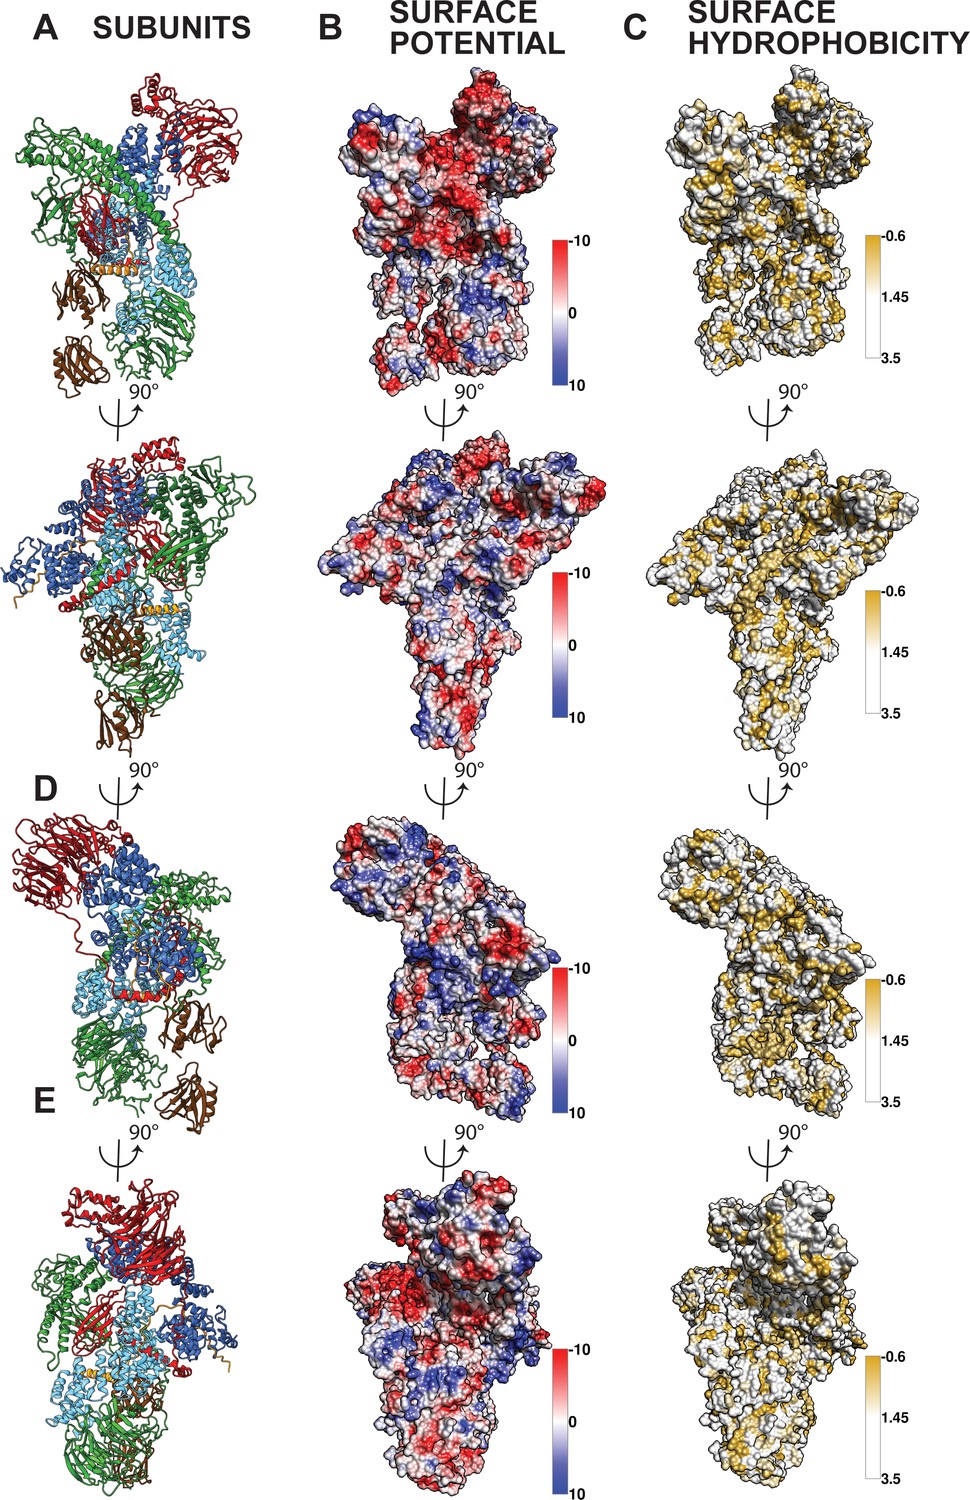
Surface potential and surface hydrophobicity of the core BBSome.
Figure 2

Arrangement of subunits and domains within the BBSome core.
(A–E) The described order of addition of subunits has been chosen for visual clarity and does not reflect the sequential assembly in vivo. BBS4 and BBS8 are shown in two different views to visualize the superhelical arrangement of the TPR repeats. Likewise, domains of BBS1 and BBS9 are also shown individually in two views.
Figure 3
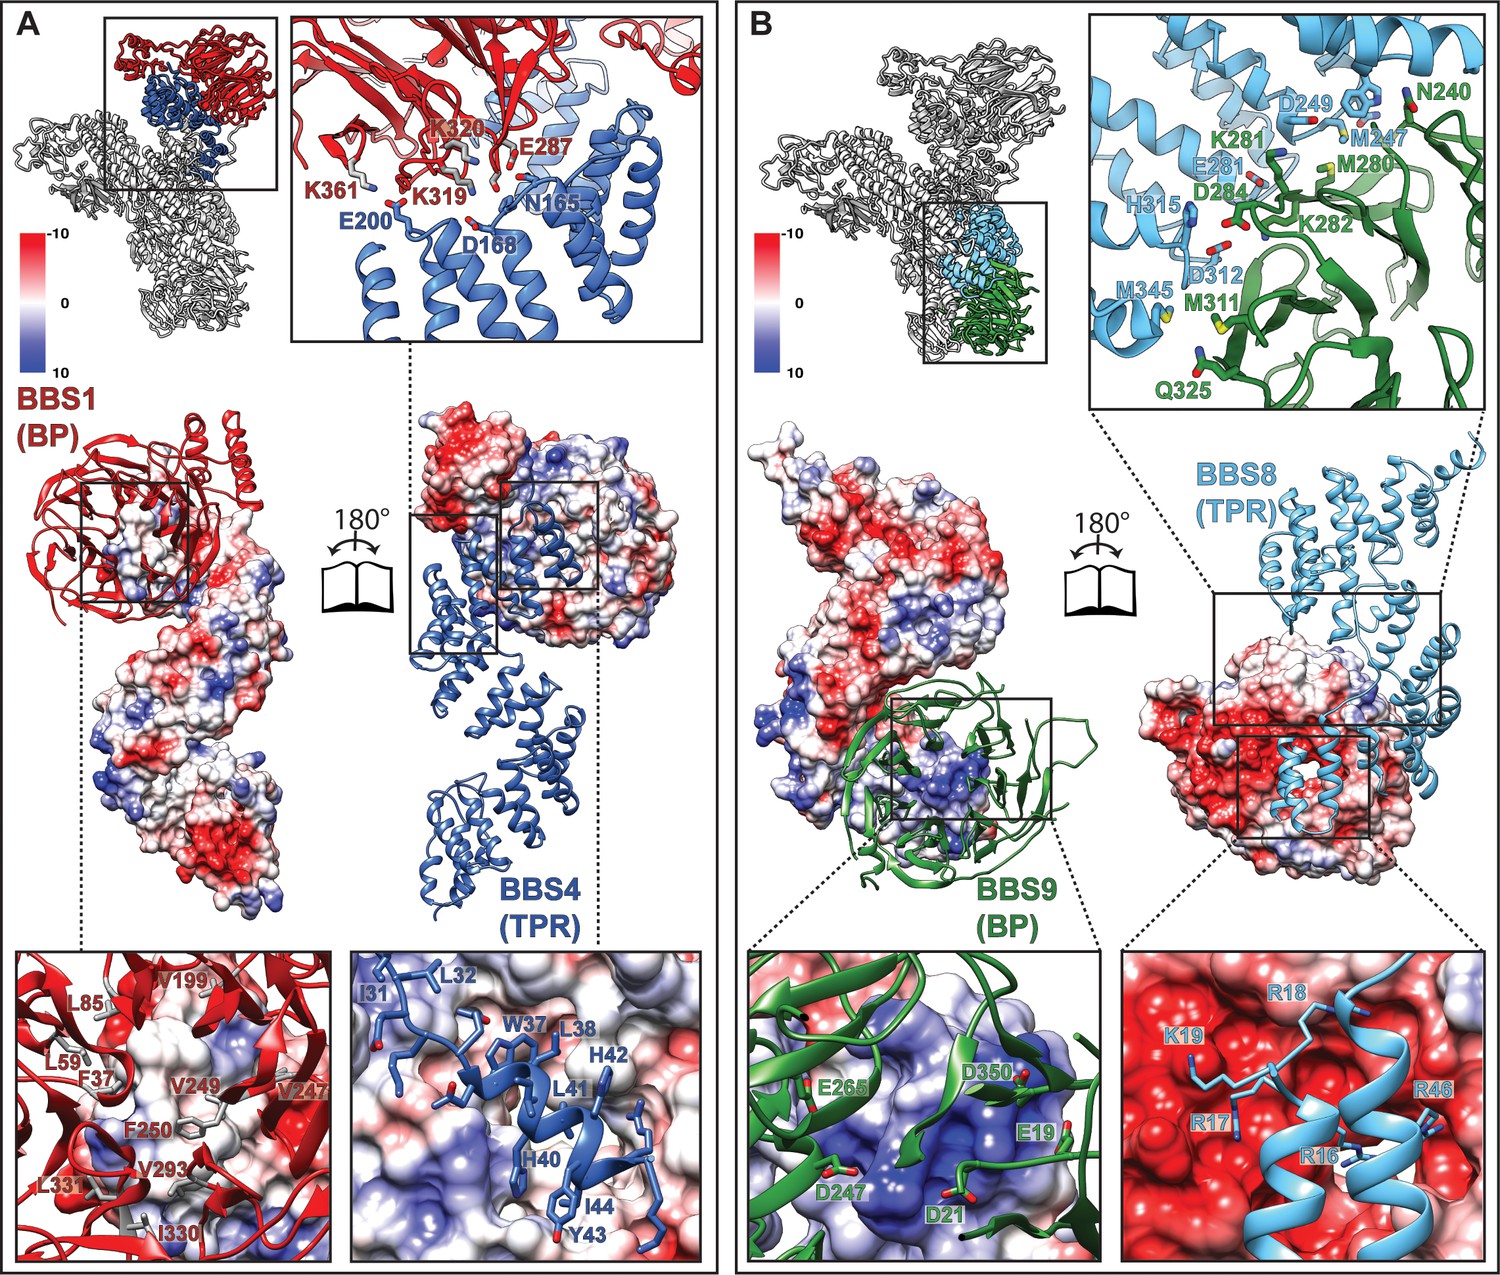
Interactions of the TPR repeat proteins BBS4 and BBS8 with β-propellers of BBS1 and BBS9, respectively.
(A) Open book representation of the interaction surface of BBS4 with the β-propeller (BP) of BBS1. The interacting subunits are shown in ribbon and surface representations, respectively. Close-up views show relevant residues of the interaction surface. (B) Analogous open book representation of the interaction surface of BBS8 with the β-propeller (BP) of BBS9.
Figure 4
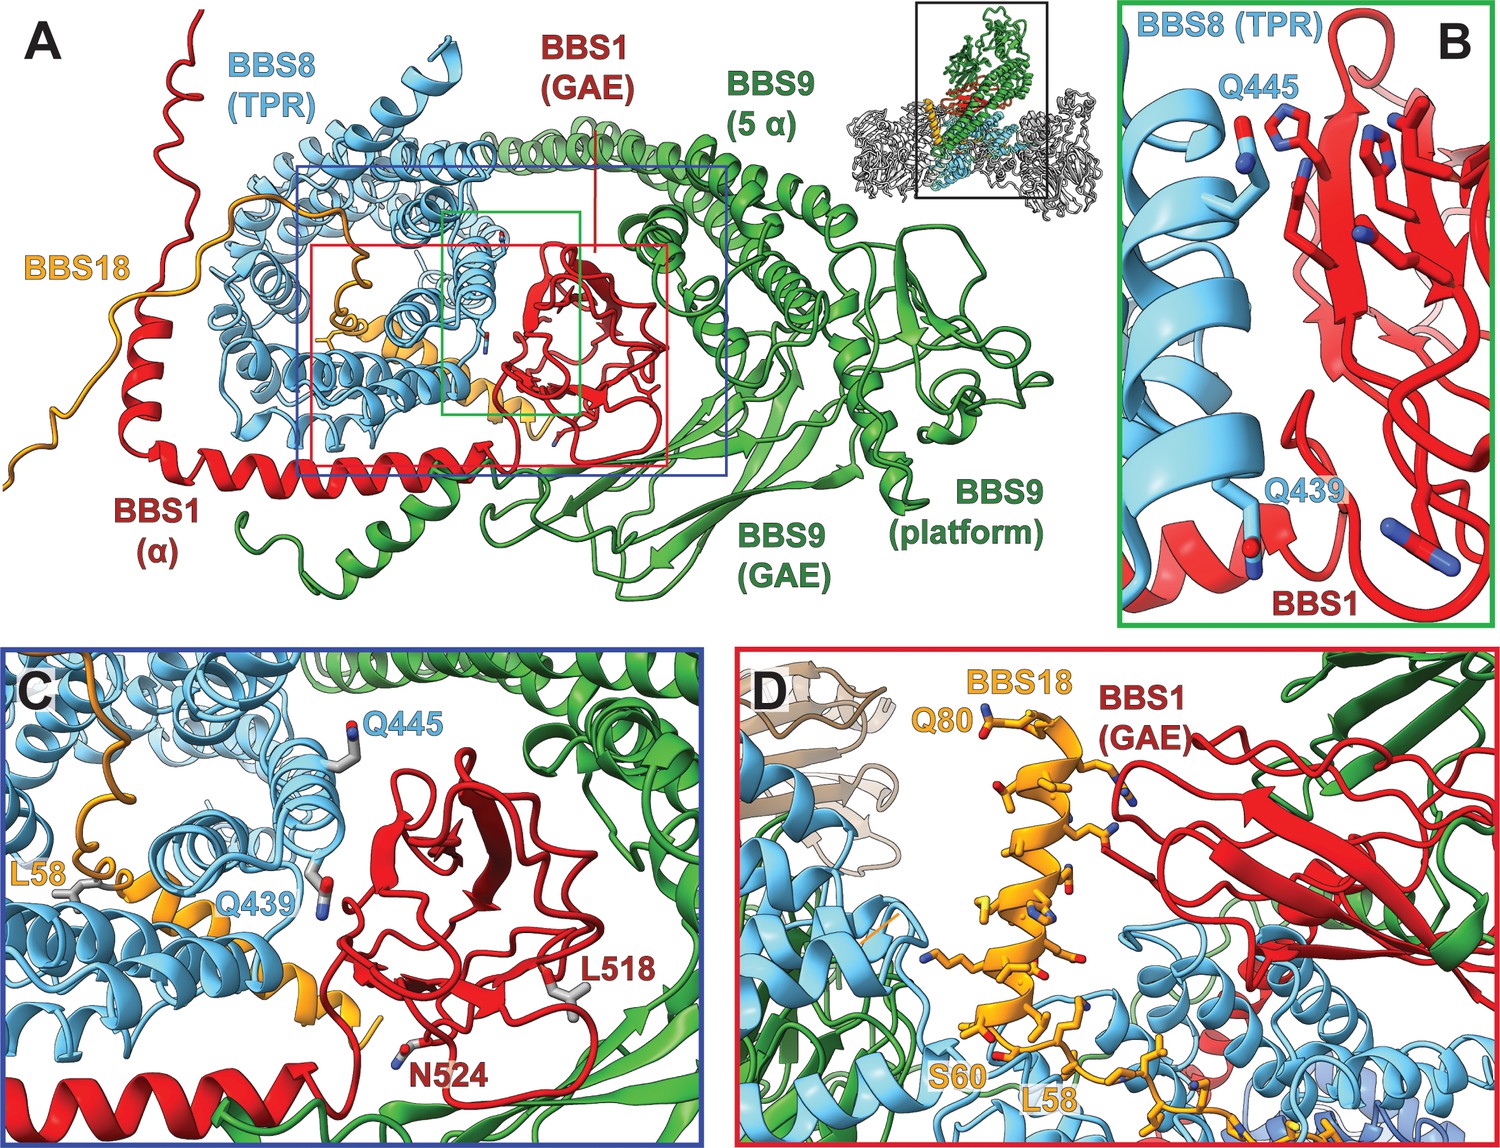
Pathogenic patient mutations within the interaction surface of BBS8 with BBS18 and with the C-termini of BBS1 and BBS9.
(A) The GAE domain of BBS1 binds to BBS8 and is embraced by the C-terminus of BBS9. (B,C) Pathogenic patient mutations Q439H and Q445K on BBS8 and L518P and N524Δ on BBS1 disturb this interface. (D) In contrast, the C-terminal BBS18 helix (Ser60-Gln80) only interacts weakly with the complex, and is held in place by interactions with the GAE domain of BBS1. The pathogenic patient mutation L58* eliminates this helix.
Figure 5
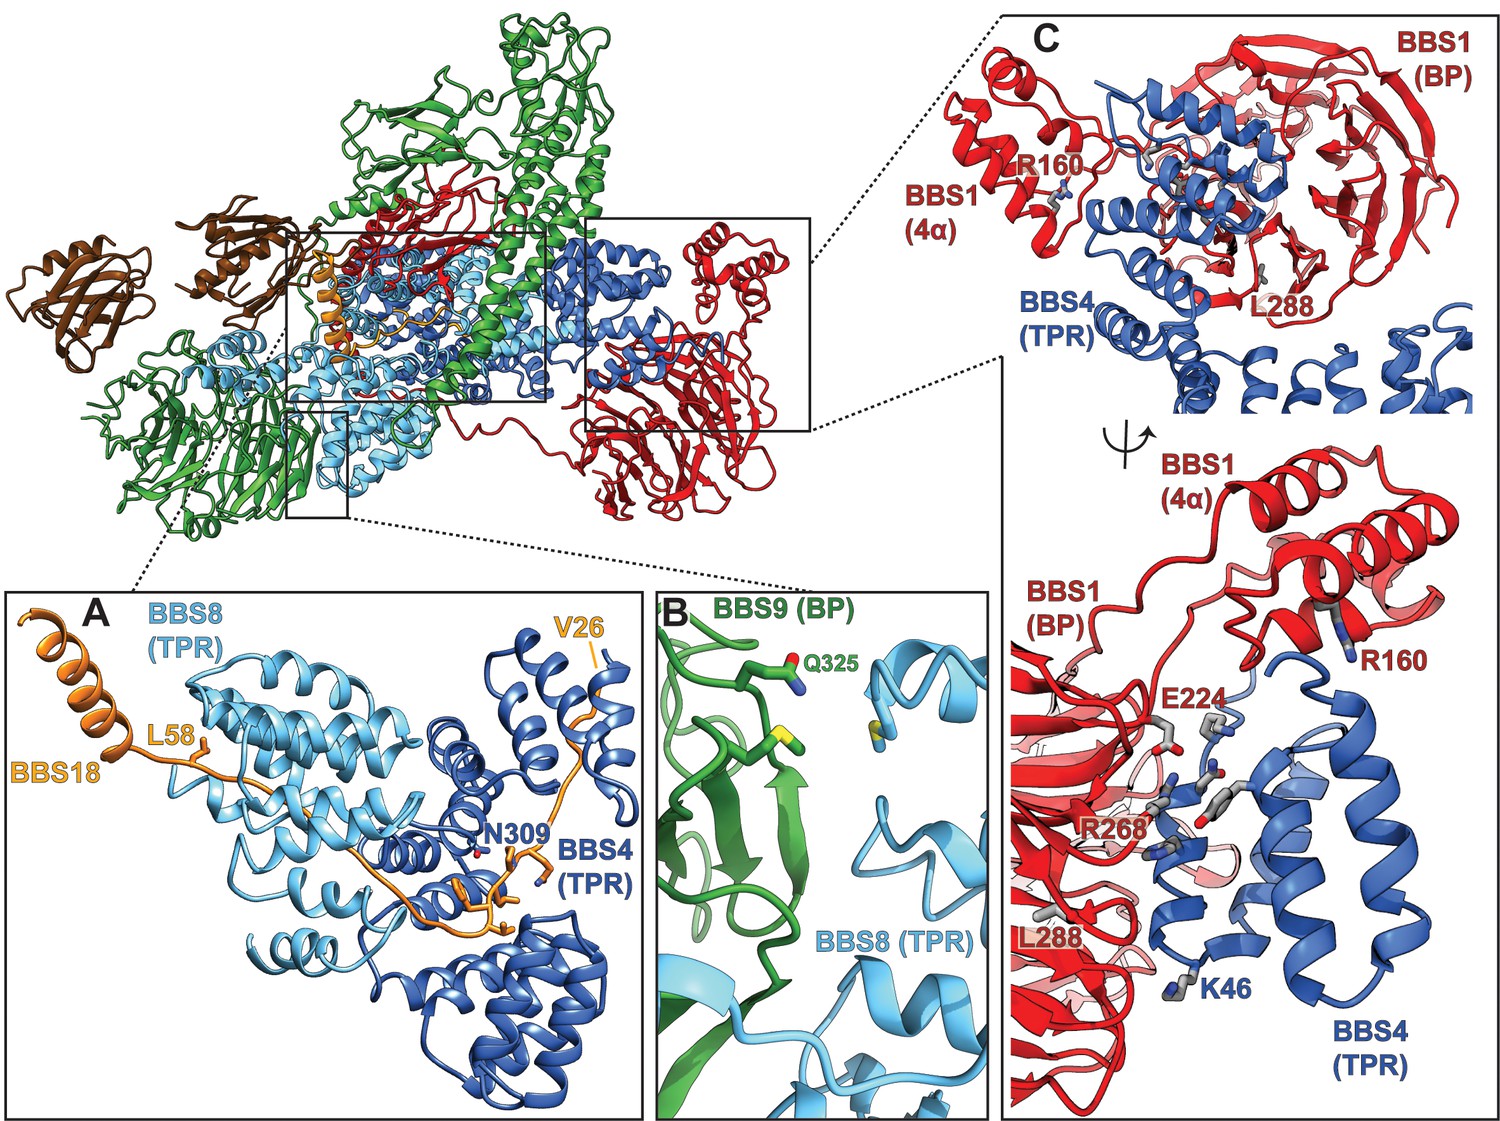
Pathogenic patient mutations within the core BBSome complex with the potential to disturb subunit interactions.
(A) Interactions of BBS4 and BBS8 with the BBS18 ‘U-bolt’ region (Val26-Lys59) stabilize the central spine of the complex. The mutation N309K disturbs a tight interaction of BBS4 with the main-chain of BBS18 in the U-bolt. The pathogenic patient mutation L58* eliminates the C-terminal helix of BBS18 but leaves the ‘U-bolt’ region that clamps together BBS4 and BBS8 intact. (B) The pathogenic mutation Q325R in BBS9 is located at the interface of the BBS9 β-propeller with BBS8. (C) Several pathogenic patient mutations are located at the interface of the BBS1 β-propeller and its helical insertion with the N-terminus of BBS4 (R160Q, E224K, R268P, L288R), underlining the importance of this interface.
Figure 6

Highly negatively charged regions in the central cleft of the BBSome.
(A): An open cleft within the center of the core BBSome contains multiple highly negatively charged regions that might be involved in cargo binding. The Arl6 binding site, as deduced from the crystal structure of the β-propeller of BBS1/Arl6 (Mourão et al., 2014), is shown as purple ribbon. (B,D,F): Surface charges in three hotspots of negative charge within the central cleft. (C,E,G): Positions of negatively charged residues.
Figure 7 with 1 supplement
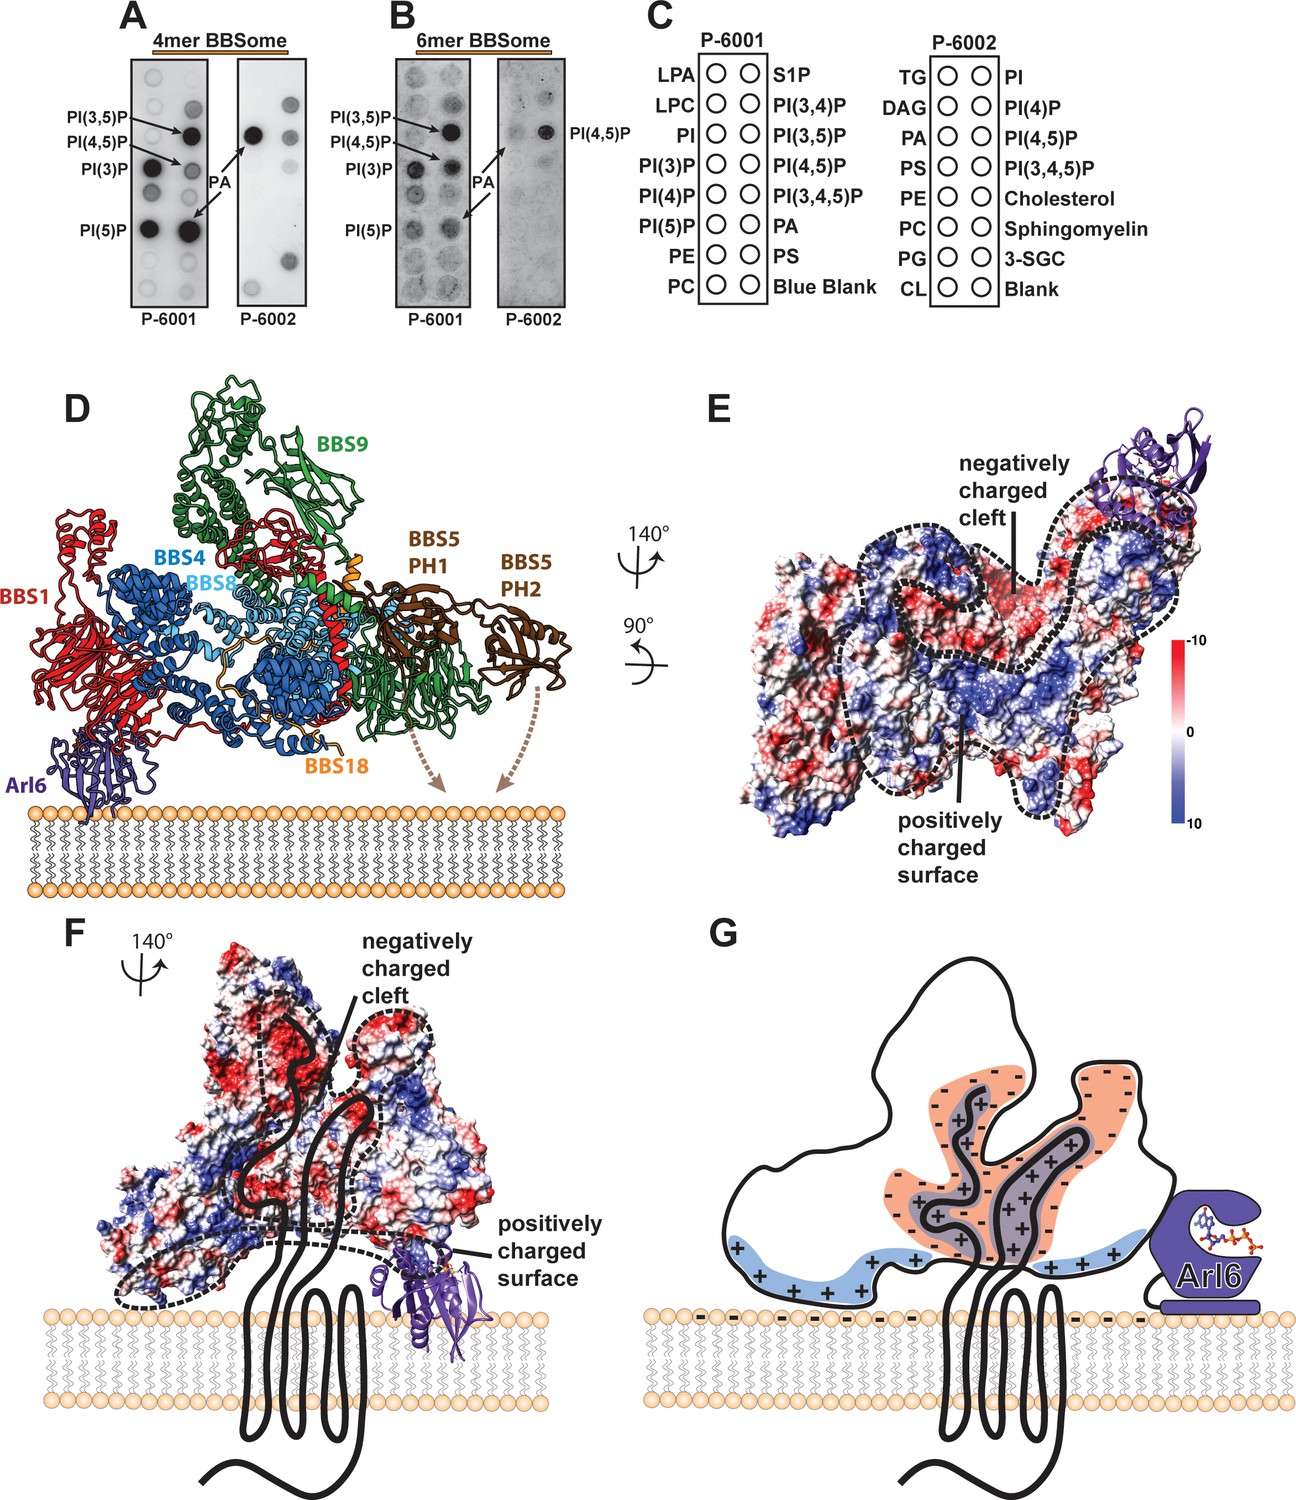
Interaction of the core BBSome with membranes.
(A–C) The affinity of the 4mer BBSome complex containing BBS4, 8, 9 and 18 (A) and of the core BBSome complex containing BBS1, 4, 5, 8, 9, 18 (B) to different lipids were probed in a protein-lipid overlay assay. For this, hydrophobic membranes with immobilized lipids as depicted in (C) (so-called ‘PIP-strips’, Echelon) were blocked with TBS-T + 3% fatty acid–free BSA and then incubated with 7.5 µg/ml complex for one hour at room temperature. After washing three times with TBS-T + 3% fatty acid–free BSA, immobilized complexes were detected by Western blot against the Flag-tag on BBS8. The PIP strip experiments indicate that BBSome subcomplexes interact specifically with PIPs even in the absence of both the Arl6-binding subunit BBS1 and the previously described PIP-binding subunit BBS5 (40). (D): Potential orientation of the BBSome core complex towards the membrane. The orientation of Arl6 towards the BBSome was deduced from the crystal structure of the β-propeller of BBS1/Arl6 (Mourão et al., 2014), which was overlaid with the BBS1 β-propeller from the BBSome core complex. In such an arrangement, a positively charged surface of the core complex would be oriented towards the membrane (E,G) and a negatively charged cleft in the vicinity of BBS1 is favorably positioned to accept BBSome-binding regions from cargo proteins like GPCRs (E–G), which were found to be mostly positively charged (Klink et al., 2017). A model how GPCRs might be recognized by the BBSome is depicted in (G).
Figure 7—figure supplement 1
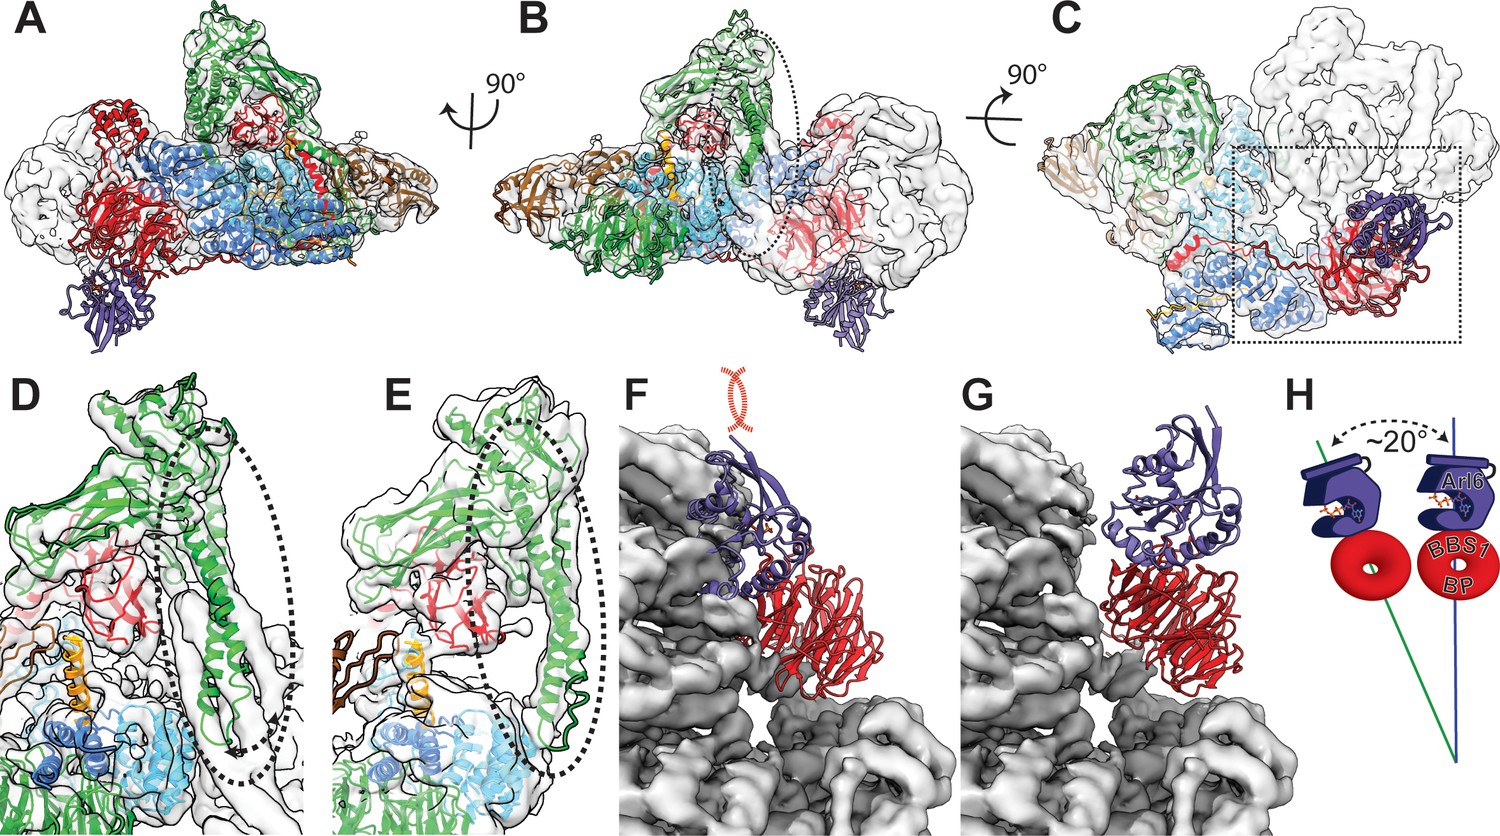
Comparison of bovine BBSome with human core BBSome.
(A–C) A rigid body fit of the human core BBSome structure into the bovine BBSome density (Chou et al., 2019) shows a similar overall arrangement, but distinct differences in the orientation of the α-hairpin of BBS9 in the C-terminal domain (dashed circle), and no clashes of the Arl6 binding site (purple domain). (D–E) Closeup views of the α-hairpin of BBS9 in the densities of bovine BBSome (D) and human core BBSome (E) show that the hairpin reorients towards BBS8 in the absence of BBS2 and BBS7. (F) Fitting the crystal structure of the BBS1 β-propeller in complex with Arl6 (Mourão et al., 2014) into the corresponding density of the BBS1 β-propeller in bovine BBSome indicates a clash of the Arl6 binding site with BBS2 and BBS7 (25). (G) An overlay of the orientation of the BBS1 β-propeller in human core BBSome with the density of the bovine BBSome shows a ~ 20° change in orientation (H), which is sufficient to avoid the clash of the Arl6 binding site with BBS2 and BBS7.
Tables
Table 1
EM data collection and refinement statistics of the core BBSome.
The BBS subunits 1,4,8,9 and 18 were modeled into the reconstruction from all particles that remained after ISAC 2D sorting (see blue box in Figure 1—figure supplement 3), while the subunit BBS5 was modeled into a map derived by 3D clustering from 180.654 out of 862.114 particles (see green box in Figure 1—figure supplement 3).
| Data collection | |
|---|---|
| Microscope | Titan Krios (Volta Phase plate, XFEG) |
| Voltage (kV) | 300 |
| Camera | K2 summit (Gatan) |
| Pixel size (Å) | 1.07 |
| Number of frames | 50 |
| Total electron dose (e-/Å2) | 67 |
| Number of particles | 2,831,329 |
| Defocus range (µm) | −0.3 – −1.0 |
| Phase Shift (degree) | 30–120 |
| Atomic model composition | BBS 1,4,8,9,18 [+BBS5] |
| Non-hydrogen atoms | 16,924 [+1175] |
| Protein atoms | 16,924 [+1175] |
| particle substack | 862,114 [180,654] |
| Ligand atoms | - |
| Refinement (Phenix) | |
| RMSD bond | 0.005 |
| RMSD angle | 0.993 |
| Model to map fit, CC mask | 0.79 |
| Resolution (FSC@0.143, Å) | 3.8 [4.3] |
| B-factor (Å2) | 145.45 |
| Validation | |
| Clashscore | 6.34 |
| Ramachandran outliers (%) | 0.09 |
| Ramachandran favoured (%) | 90.45 |
| Molprobity score | 1.89 |
| EMRinger score | 1.53 |
Table 2
Interfaces between core BBSome subunits.
The mutual subunit interaction surfaces within the core BBSome with highest relevance for complex stability (i.e. with solvation free energies (ΔiG)<−2.5 kcal/mol and with interface areas > 400 Å2), as analyzed by the Pisa server (Krissinel and Henrick, 2007).
| BBSome subunit A | BBSome subunit B | Interface area (A-B) [Å2] | ΔiG (A-B) [kcal/mol] |
|---|---|---|---|
| BBS18 | BBS8 | 1621.0 | −28.1 |
| BBS18 | BBS4 | 1411.0 | −25.4 |
| BBS9 | BBS1 | 1946.2 | −23.0 |
| BBS9 | BBS8 | 2148.3 | −22.7 |
| BBS8 | BBS1 | 1785.8 | −20.5 |
| BBS4 | BBS1 | 2429.1 | −18.0 |
| BBS8 | BBS4 | 1469.4 | −13.1 |
Table 3
Disease-causing variants at the interface between BBSome subunits.
Only mutations that sit at the interface between BBSome subunits and likely have an influence on the stability of the complex have been analyzed.
| BBS gene | mutation | phenotype | Reference |
|---|---|---|---|
| BBS1 | L518P | BBS | Mykytyn et al., 2003 |
| N524Δ | BBS | Deveault et al., 2011 | |
| R160Q | BBS, RP | Sharon and Banin, 2015; Deveault et al., 2011 | |
| E224K | BBS | Redin et al., 2012 | |
| R268P | BBS | Estrada-Cuzcano et al., 2012 | |
| L288R | BBS | Muller et al., 2010 | |
| BBS4 | N309K | BBS | Muller et al., 2010 |
| BBS8 | Q439H | BBS, RP | Ullah et al., 2017; Goyal et al., 2016 |
| Q445K | RP | van Huet et al., 2015 | |
| BBS9 | Q325R | BBS | Chou et al., 2019 |
| BBS18 | L58* | BBS | Scheidecker et al., 2014 |
Key resources table
| Reagent type (species) or resource | Designation | Source or reference | Identifiers | Additional information |
|---|---|---|---|---|
| Gene (Homo sapiens) | BBS1 | N/A | NCBI reference sequence: NM_024649.4 | |
| Gene (Homo sapiens) | BBS4 | N/A | NCBI reference sequence: NM_033028.3 | |
| Gene (Homo sapiens) | BBS5 | N/A | NCBI reference sequence: NM_152384.2 | |
| Gene (Homo sapiens) | BBS8 | N/A | NCBI reference sequence: NM_198309.2 | |
| Gene (Homo sapiens) | BBS9 | N/A | NCBI reference sequence: NM_198428.2 | |
| Gene (Homo sapiens) | BBS18 | N/A | NCBI reference sequence: NM_001195306.1 | |
| Cell line (S. frugiperda) | SF9 | Thermo Fisher (Germany) | RRID:CVCL_0549 | |
| Cell line (Trichoplusia ni) | Hi5 | Thermo Fisher (Germany) | RRID:CVCL_C190 | |
| Antibody | Mouse monoclonal anti-Flag antibody | Thermo Fisher (Germany) | Cat.No. MA1-91878 | dilution 1:5000 |
| Other | ACEMBL | Vijayachandran et al., 2011 PMID: 21419851 | Recombinant expression system for multiprotein complexes | |
| Software, algorithm | SPHIRE software package | Moriya et al., 2017 PMID: 28570515 | ||
| Software, algorithm | CrYOLO | Wagner et al., 2019 PMID: 31925080 | ||
| Software, algorithm | Chimera | Pettersen et al., 2004 PMID: 15264254 | ||
| Software, algorithm | Coot | Emsley et al., 2010 PMID: 20383002 | ||
| Software, algorithm | Phenix | Adams et al., 2010 PMID: 20124702 | ||
| Software, algorithm | RaptorX | Wang et al., 2018 PMID: 28845538 | ||
| Software, algorithm | HHpred | Söding et al., 2005 PMID: 15980461 | ||
| Software, algorithm | iMODFIT | Lopéz-Blanco and Chacón, 2013 PMID: 23999189 |
Additional files
Download links
A two-part list of links to download the article, or parts of the article, in various formats.
Downloads (link to download the article as PDF)
Open citations (links to open the citations from this article in various online reference manager services)
Cite this article (links to download the citations from this article in formats compatible with various reference manager tools)
Structure of the human BBSome core complex
eLife 9:e53910.
https://doi.org/10.7554/eLife.53910


