Different dendritic domains of the GnRH neuron underlie the pulse and surge modes of GnRH secretion in female mice
- Department of Assisted Reproduction, Shanghai Ninth People’s Hospital, Shanghai JiaoTong University School of Medicine, China
- Centre for Neuroendocrinology, Department of Physiology, University of Otago, New Zealand
- Department of Physiology, Development and Neuroscience, University of Cambridge, United Kingdom
- School of Basic Medical Sciences, Institutes of Brain Science, Fudan University, China
Figures
Figure 1 with 1 supplement
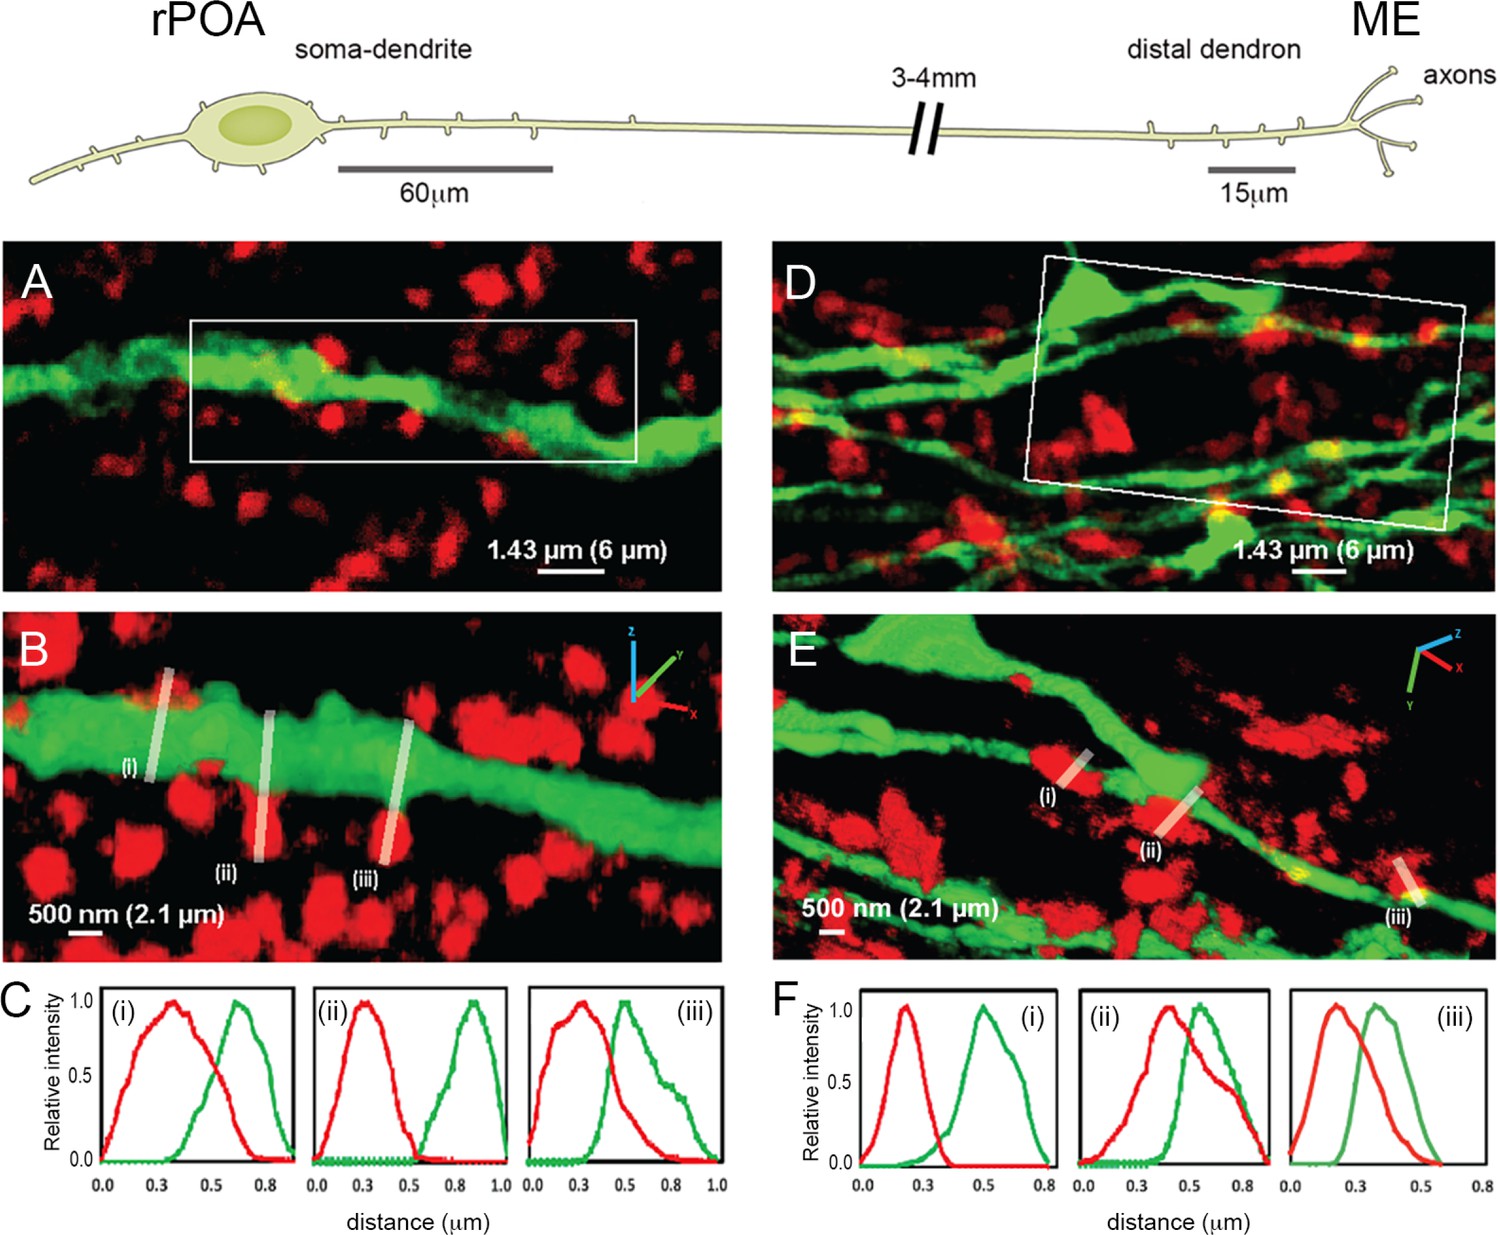
Expansion microscopy views of synaptic appositions at the GnRH neuron proximal dendrite and distal dendron.
Schematic showing the morphology of a hypophysiotropic GnRH neuron with its soma-proximal dendrites located in the rostral preoptic area (rPOA) and the distal dendron and short axon branches in the median eminence (ME). Synaptic density analysis was undertaken on 60 μm-lengths of proximal dendrite and 15 μm-lengths of distal dendron. (A) Expansion microscopy view of a proximal dendrite (green) with surrounding synaptophysin puncta (red). (B) shows rotated 3D reconstruction with white lines indicating three appositions that were examined. (C) The side-on relative fluorescence intensity profiles are shown for the three appositions. (i) and (iii) represent synaptic appositions whereas (ii) indicates apposing profiles with no overlap that do not represent a synapse. (D) Expansion microscopy view of distal dendrons (green) with surrounding red synaptophysin puncta. (E) shows rotated 3D reconstruction with white lines indicating three appositions that were examined. (F) The relative fluorescence intensity profiles are shown for the three appositions. (ii) and (iii) represent synaptic appositions, whereas (i) indicates apposing profiles with no overlap that do not represent a synapse. Scale bars show pre-expansion values with expanded size in brackets. X-axis plots show pre- expansion values.
Figure 1—figure supplement 1
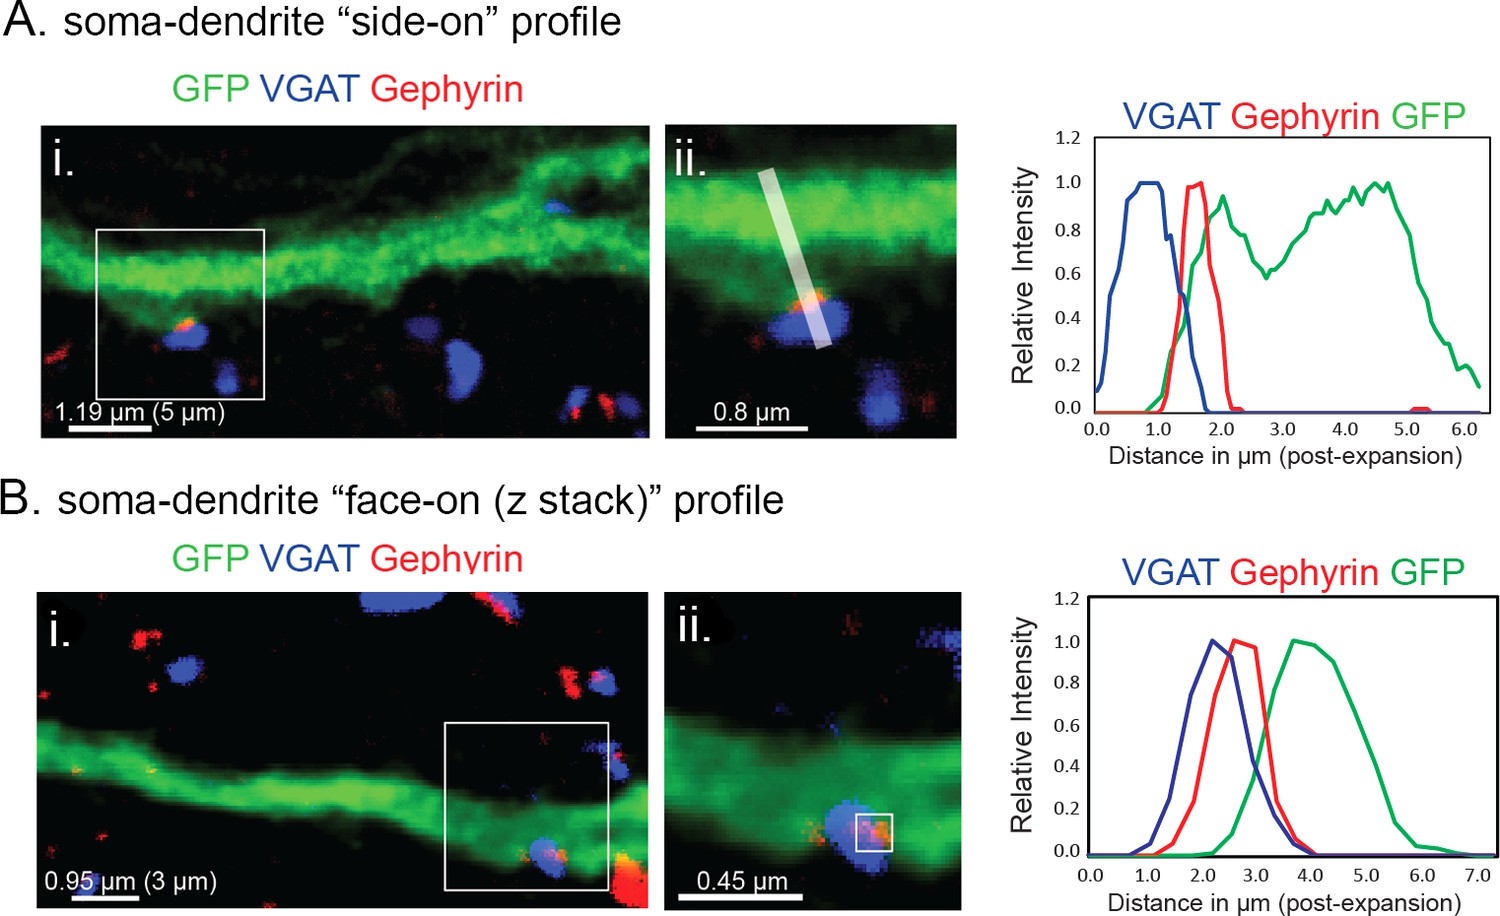
Definition of GABAA receptor synapses on GnRH neurons using ExM.
(A) Example of a ‘side-on’ view of a GABAergic synapse on a GnRH proximal dendrite. Insert, magnified image from boxed region showing the plane of analysis used to generate the fluorescence intensity profiles of each channel - GFP (GnRH proximal dendrites; green), Alexa568 (gephyrin; red) and ATTO647 (VGAT, blue). Analysis of intensity profiles from 25 ‘side-on’ synapses demonstrated that the overlap in signals between the pre-synaptic marker and GnRH neuron was always >0.95 µm (0.23 µm pre-expansion). (B) Example of a ‘face-on’ view of a GABAergic synapse on a GnRH proximal dendrite. Insert, magnified image from boxed region showing the z-plane of analysis used to generate the fluorescence intensity profiles of each channel - GFP (GnRH proximal dendrites; green), Alexa568 (gephyrin; red) and ATTO647 (VGAT, blue). Analysis of intensity profiles from 12 ‘face-on’ synapses demonstrated that the z-axis overlap in signals between the pre-synaptic marker VGAT and GFP of the GnRH neuron was >1.75 µm (0.42 µm pre-expansion) for all synapses.
Figure 2 with 2 supplements
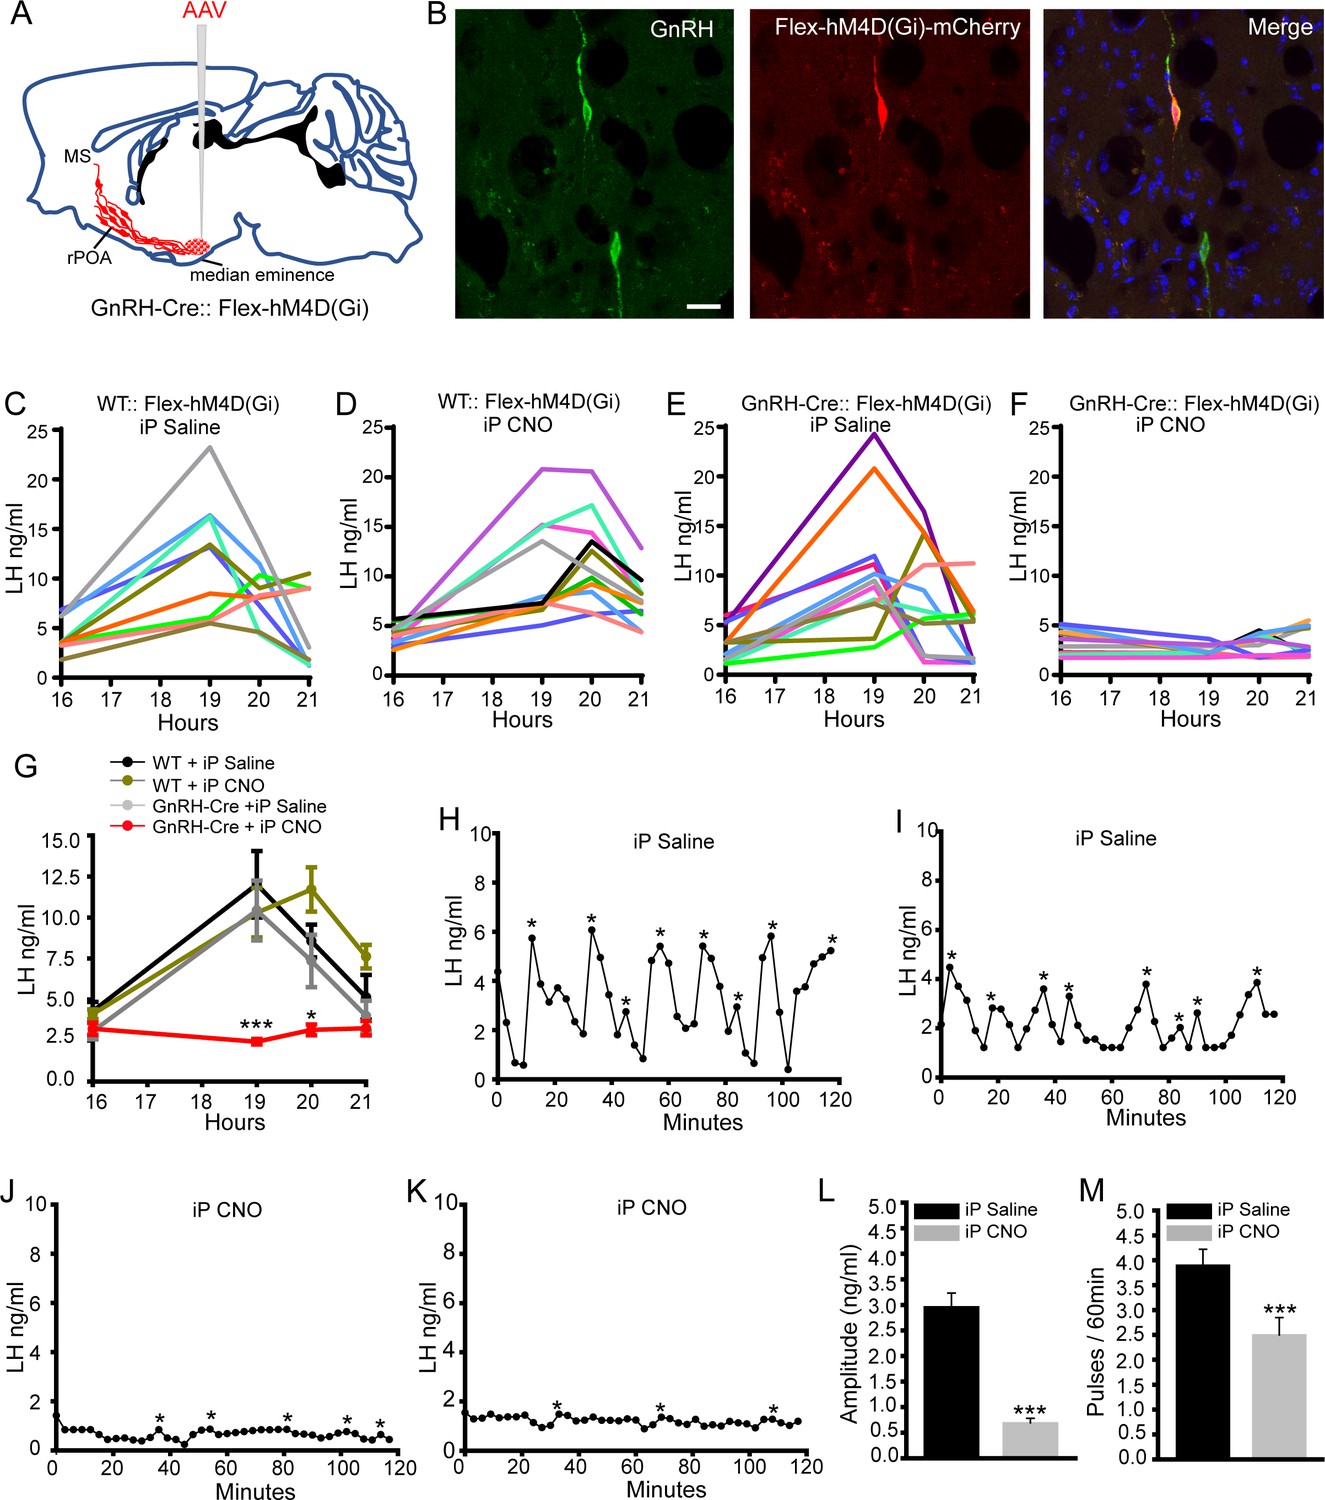
Chemogenetic inhibition of GnRH neurons by intraperitoneal (iP) injection of CNO suppresses both the surge and pulse profiles of LH secretion.
(A) Schematic showing experimental protocol with GnRH-Cre mice injected with Cre-dependent Flex-hM4D(Gi)-mCherry AAVs bilaterally into the region of the median eminence and CNO given by IP injection. MS, medial septum. CNO, Clozapine N-oxide. (B) Fluorescence images of GnRH neurons expressing GnRH (green) and mCherry (red) in GnRH::Flex-hM4D(Gi)-mCherry mice. Scale bar, 20 μm. (C,D) LH profiles for all of the wild-type (WT) OVX+E+P mice given saline control (C, n = 9) or CNO (D, n = 11). (E,F) LH profiles for all of the GnRH-Cre OVX+E+P mice given saline control (E, n = 12) or CNO (F, n = 11). (G) Mean (± SEM) LH levels for the four experimental groups. *p<0.05, ***p<0.001, two-way repeated measures ANOVA with Holm-Sidak test. (H-M) Representative examples of pulsatile LH secretion in OVX GnRH-Cre mice given IP saline (H,I) or CNO (J,K). LH pulses are indicated by asterisks. (L,M) Mean (± SEM) amplitude and frequency of LH pulses in saline (n = 6) and CNO (n = 6). ***p<0.001 Mann-Whitney U-tests.
Figure 2—figure supplement 1
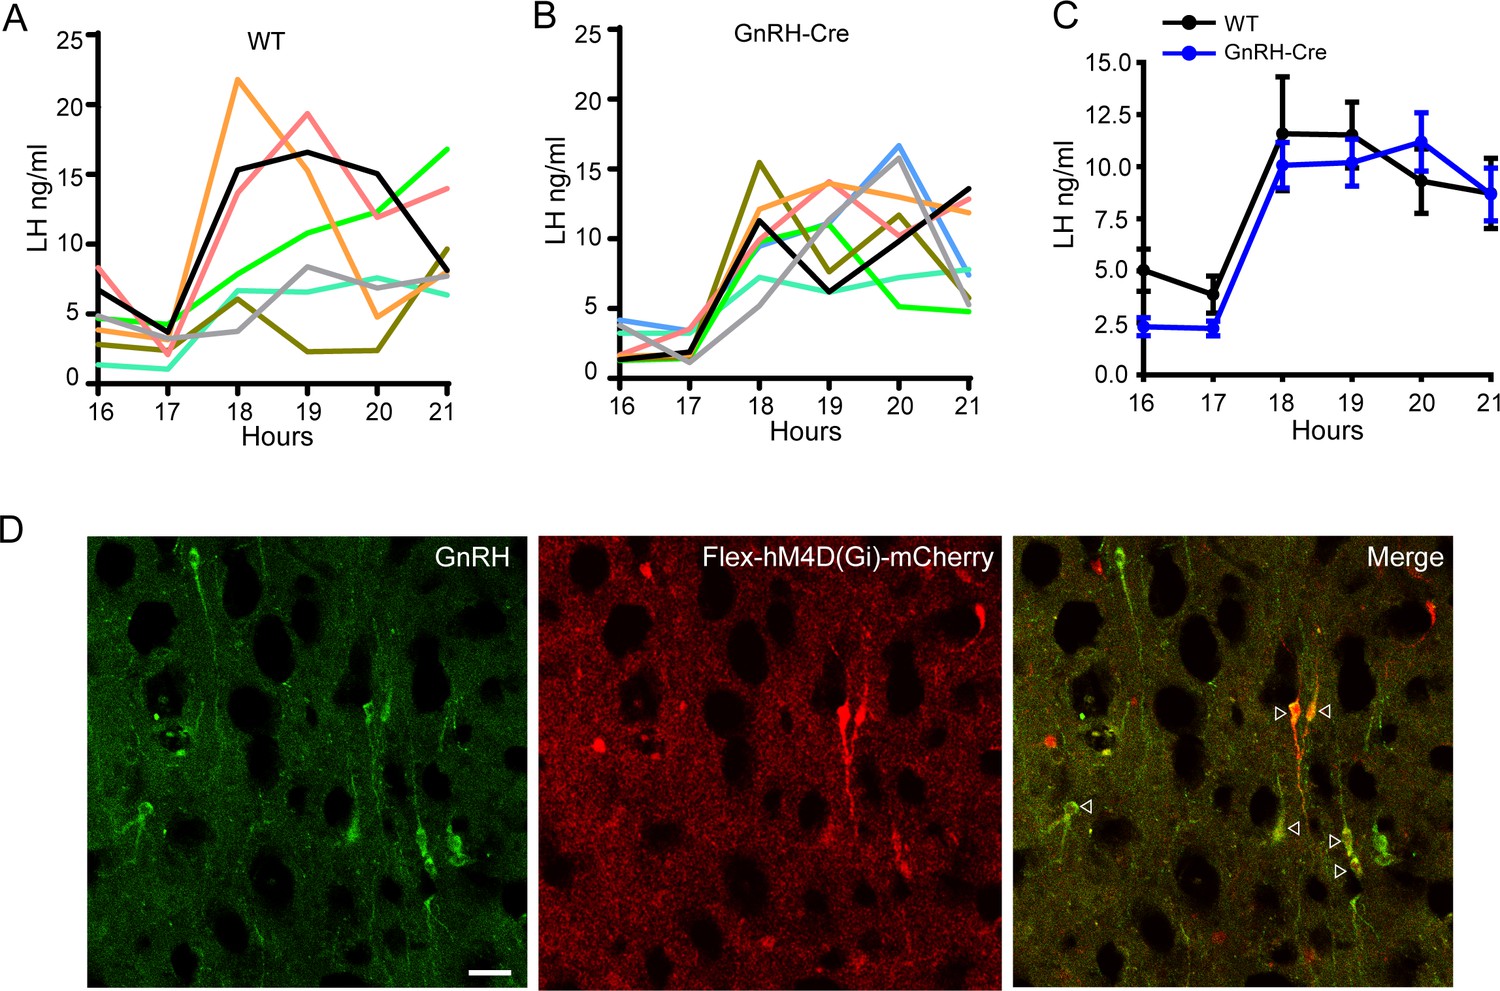
LH surge profiles of wild-type and un-injected GnRH-Cre mice and expression of hM4D(Gi)-mCherry in GnRH neurons.
LH surge profiles in all individual wild-type (A, n = 7) and GnRH-cre (B, n = 8) OVX+E+P female mice over 6 hr, with tail-tip blood sampling every hour. (C) Mean (± SEM) LH levels in wild-type and GnRH-Cre OVX+E+P female mice with tail-tip blood sampling every hour. Lights off is at 18:00 for all experiments. (D) Photomicrographs showing GnRH immunoreactivity (green), mCherry (red), and overlay in GnRH-Cre mice bilaterally injected with Cre-dependent Flex-hM4D(Gi)-mCherry AAVs into the region of the median eminence. White triangles indicate GnRH neurons expressing mCherry. Scale bar, 50 μm.
Figure 2—figure supplement 2

Inhibition of GnRH neurons expressing hM4D(Gi) by CNO.
(A) Schematic of the acute brain slice and representative cell-attached recording showing the effect of 5 mM clozapine-N-oxide (CNO) on the firing rate of a GnRH neuron expressing hM4D(Gi)-mCherry. (B) Mean firing rate of six GnRH neurons (from 3 mice) before and after applying 5 mM CNO. ** p<0.01, paired t-test.
Figure 3 with 1 supplement

Chemogenetic inhibition of GnRH neuron distal dendron activity suppresses both the surge and pulse profiles of LH secretion.
(A) Schematic showing experimental protocol with GnRH-Cre mice injected with Cre-dependent Flex-hM4D(Gi)-mCherry AAVs bilaterally into the region of the median eminence and CNO given into the same region. MS, medial septum. CNO, Clozapine N-oxide. (B) Fluorescence images of GnRH neuron projections in the vicinity of the median eminence expressing GnRH (green) and mCherry (red) in GnRH::Flex-hM4D(Gi)-mCherry mice. Scale bar, 20 μm. (C,D) LH surge profiles in all GnRH-Cre OVX+E+P female mice following MBH injection of saline (C, n = 12) or CNO (D, n = 12). (E) Mean (± SEM) LH levels. ***p<0.001, two-way repeated measures ANOVA with Holm-Sidak test. F-J. Representative examples of pulsatile LH secretion in OVX GnRH-Cre mice given saline (F,G) or CNO (I,J). LH pulses are indicated by asterisks. Mean (± SEM) amplitude (H) and frequency (K) of LH pulses in saline (n = 8) and CNO (n = 7). ***p<0.001,*p<0.05 Mann-Whitney U-tests.
Figure 3—figure supplement 1
Photomicrographs showing location of cannula and mean (± SEM) LH levels in GnRH-Cre OVX mice with saline and CNO.
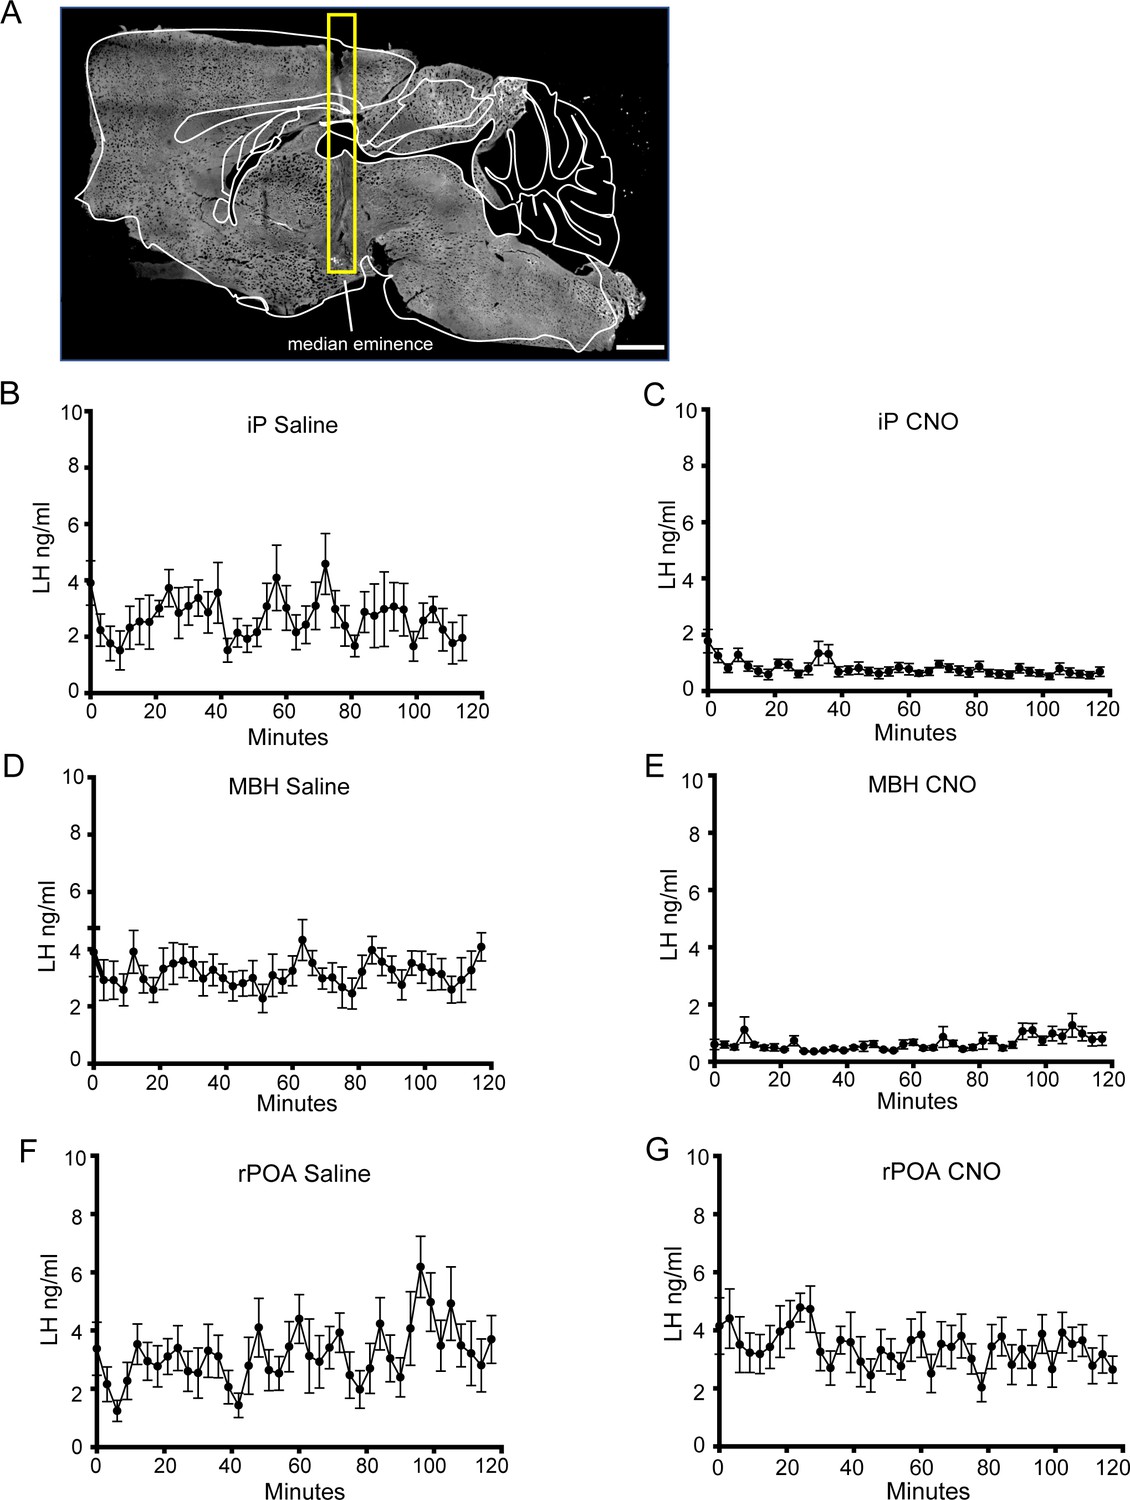
(A) Photomicrograph showing location of cannula implanted into the MBH of GnRH::Flex-hM4D(Gi)-mCherry mice. Scale bar, 100 μm. Mean (± SEM) LH levels in AAV-injected GnRH-Cre OVX mice with IP injection of saline (B, n = 6) or CNO (C, n = 6). Mean (± SEM) LH levels in AAV-injected GnRH-Cre OVX mice with MBH injection of saline (D, n = 8) or CNO (E, n = 7). Mean (± SEM) LH levels in AAV-injected GnRH-Cre OVX mice with rPOA injection of saline (F, n = 8) and CNO (G, n = 9).
Figure 4

Chemogenetic inhibition of GnRH neuron soma-proximal dendrite activity suppresses only the LH surge.
(A) Schematic showing experimental protocol in which GnRH-Cre mice are injected with Cre-dependent Flex-hM4D(Gi)-mCherry AAVs bilaterally into the region of the median eminence and, later, CNO injected into the rostral preoptic area (rPOA). MS, medial septum. CNO, Clozapine N-oxide. (B,C) LH surge profiles in all GnRH-Cre OVX+E+P female mice following rPOA injection of saline (C, n = 9) or CNO (D, n = 10). (D) Mean (± SEM) LH levels. **p<0.01, ***p<0.001, two-way repeated measures ANOVA with Holm-Sidak test. (E-H), Representative profiles of LH pulsatile secretion in GnRH-Cre OVX female mice with rPOA injection of saline (E, F) or CNO (G, H). LH pulses are indicated by asterisks. Mean (± SEM) LH pulse amplitude (I) and frequency (J) in GnRH-cre OVX mice with rPOA injection of saline (n = 8) and CNO (n = 9).
Figure 5 with 2 supplements
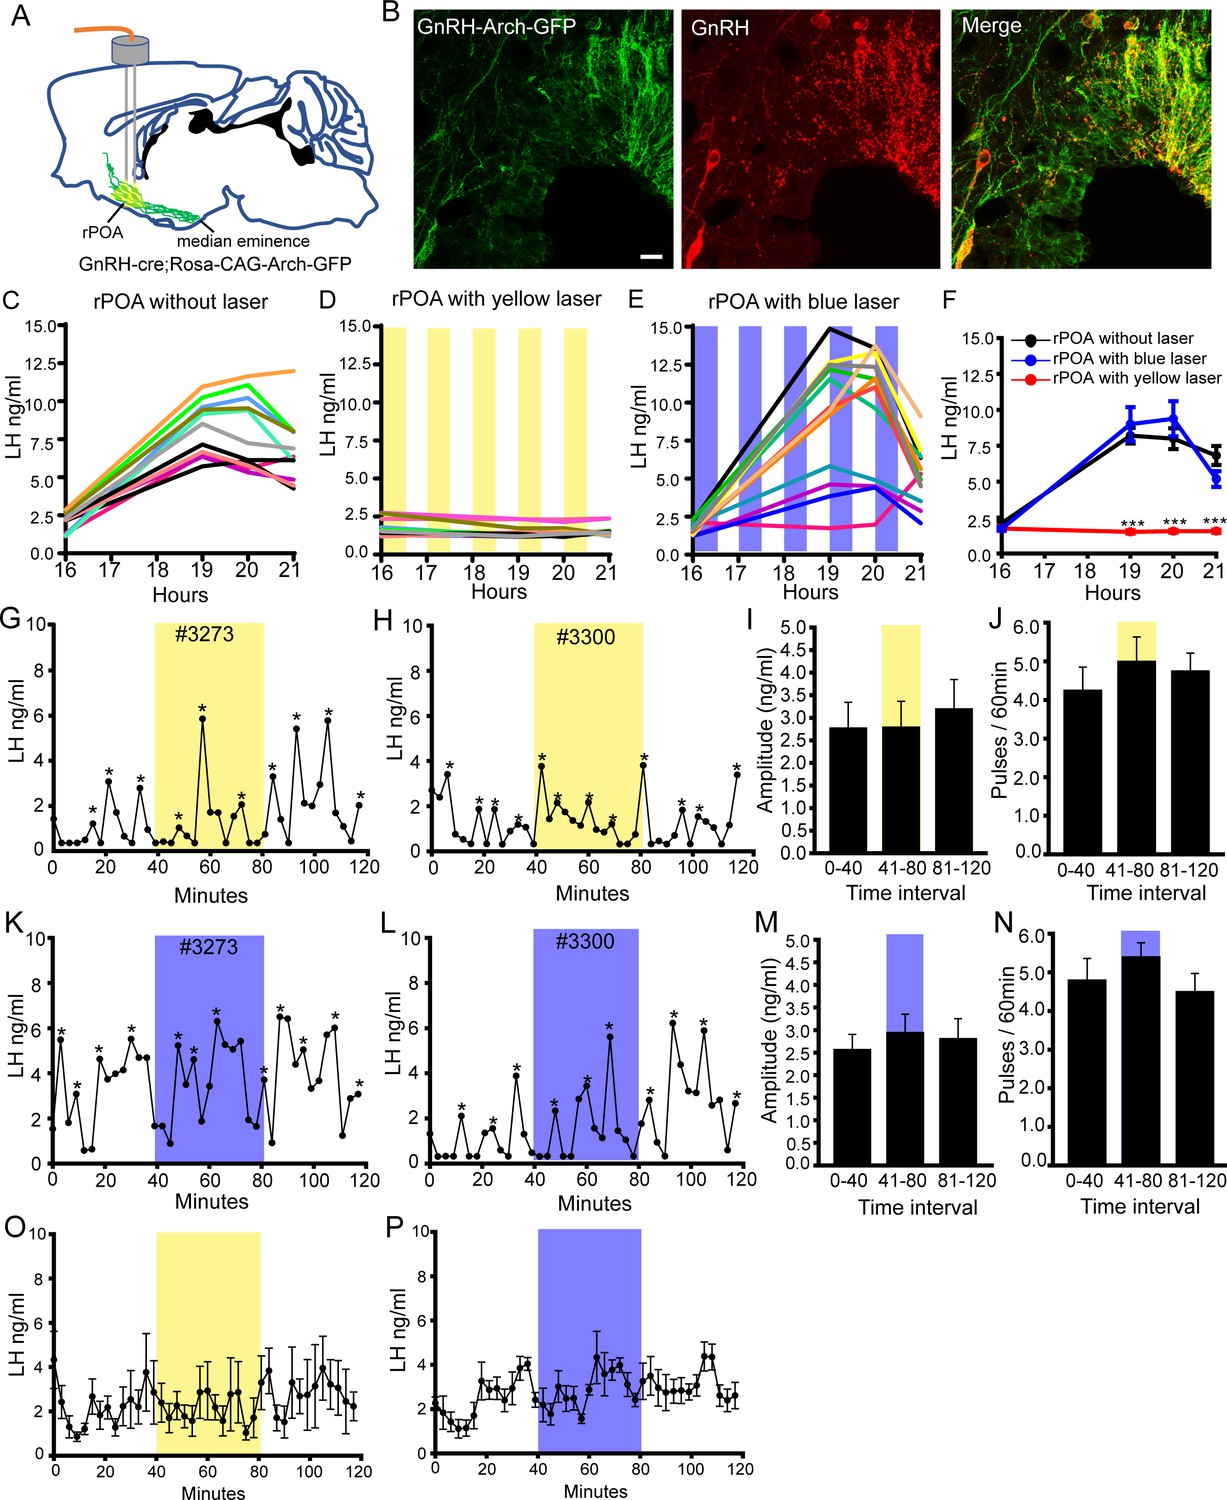
Bilateral optogenetic inhibition of GnRH neuron soma-proximal dendrite activity suppresses only the LH surge.
(A) Schematic showing experimental protocol with GnRH-cre+/-;Rosa-CAG-Arch-GFP+/+ mice with bilateral optic fiber placement in the rostral preoptic area (rPOA). (B) Fluorescence images of GnRH neurons expressing Archaerhodopsin (GFP reporter) and GnRH (red) in GnRH-cre+/-;Rosa-CAG-Arch3-GFP+/+ mice. Scale bar, 20 μm. (C-E) LH surge profiles in all control GnRH-cre+/-;Rosa-CAG-Arch-GFP+/+ OVX+E+P female mice (C, n = 11) and those given intermittent (yellow shaded areas) bilateral rPOA 593 nm illumination at 10 Hz (D, n = 12) or, as a control, 473 nm (E, n = 12). (F) Mean (± SEM) LH levels. ***p<0.001, two-way repeated measures ANOVA with Holm-Sidak test. (G-N) Representative profiles of pulsatile LH secretion in GnRH-cre+/-;Rosa-CAG-Arch3-GFP+/+ OVX female mice given 40 min (shaded areas) bilateral rPOA illumination at 593 nm (G, H) or, as a control, 473 nm (K, L). LH pulses are indicated by asterisks. Mean (± SEM) LH pulse amplitude and frequency are given for yellow (I,J, n = 7) and blue (M,N, n = 6) light illumination. (O,P) Mean (± SEM) LH levels in GnRH-cre+/-;Rosa-CAG-Arch-GFP+/+ OVX mice with bilateral rPOA laser illumination at 593 nm (O, n = 7) or 473 nm (P, n = 6).
Figure 5—figure supplement 1
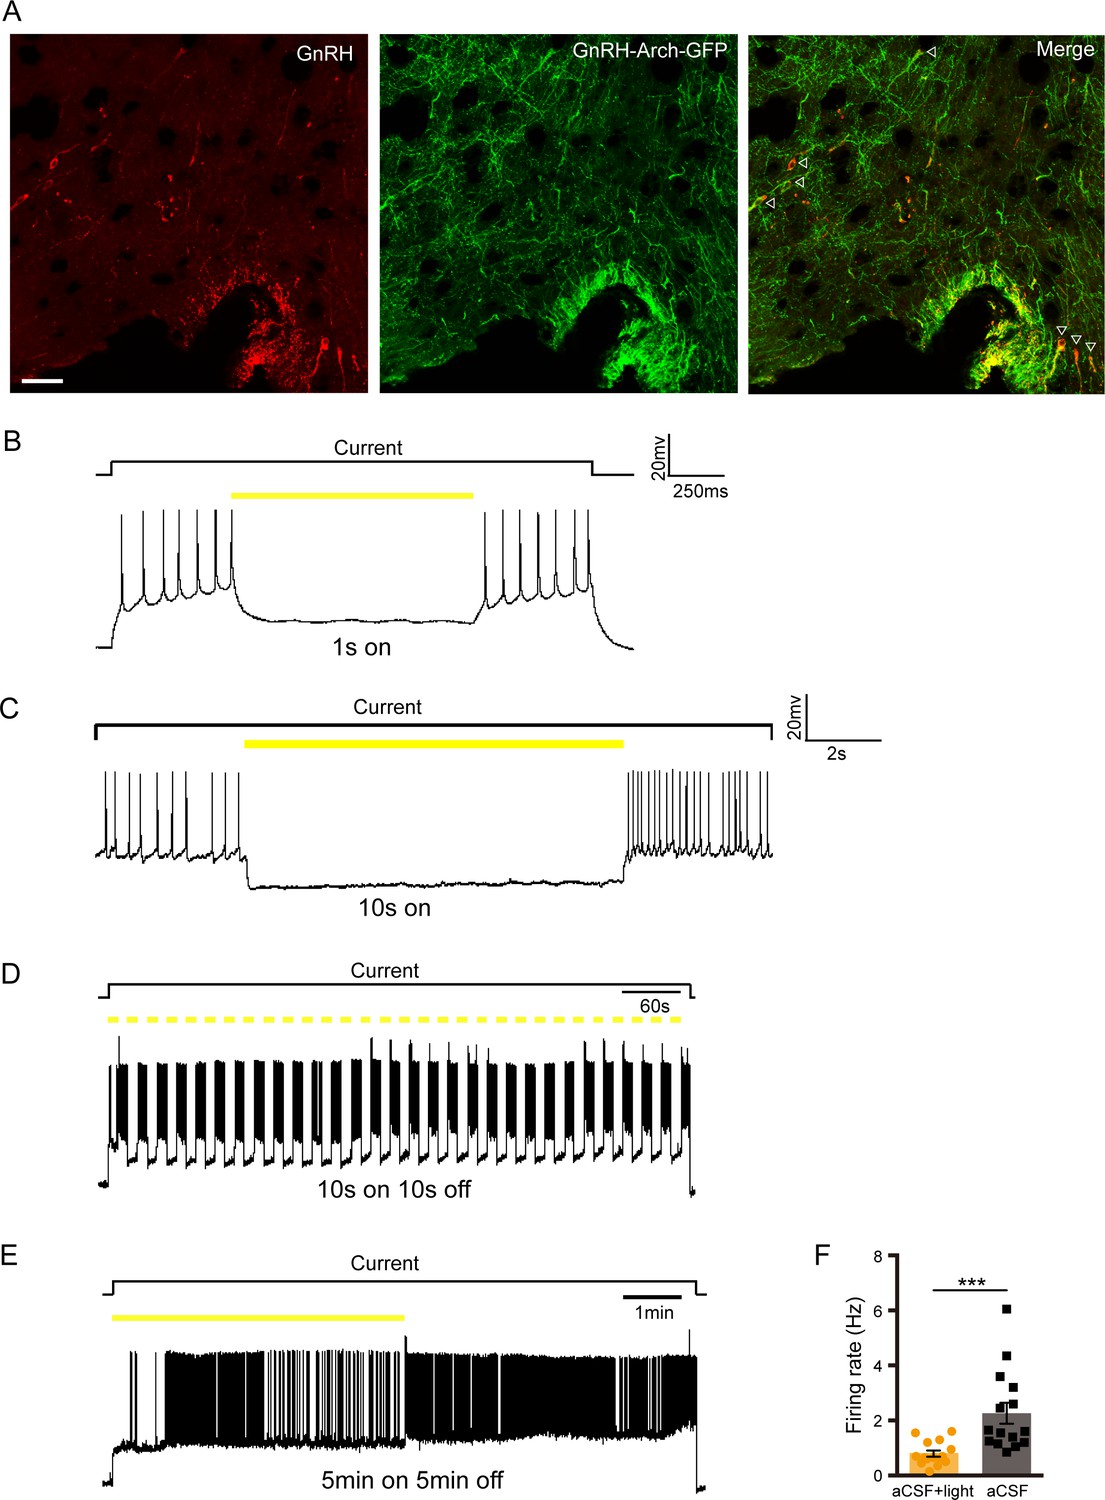
Archaerhodopsin expression in GnRH neurons and effects of yellow light on GnRH neuron firing.
(A) Photomicrographs showing Archaerhodopsin (GFP reporter), GnRH (red), and overlay in the GnRH-cre+/-;Rosa-CAG-Arch3-GFP+/+ mice. Scale bar, 50 µm. Whole cell current clamp recordings of Archaerhodopsin-expressing rPOA GnRH neurons showing their response to 1 s (B) and 10 s (C) yellow-light. (D) Example traces illustrating the response of an rPOA GnRH neuron to a 10-min yellow light stimulation train at 10 s on 10 s off. (E) Example traces illustrating the response of an rPOA GnRH neuron to a 10 min yellow light stimulation at 5 min on 5 min off. (F) The mean firing rate of an rPOA GnRH neuron with or without 5 min continuous yellow light. **p<0.001, repeated measures ANOVA.
Figure 5—figure supplement 2
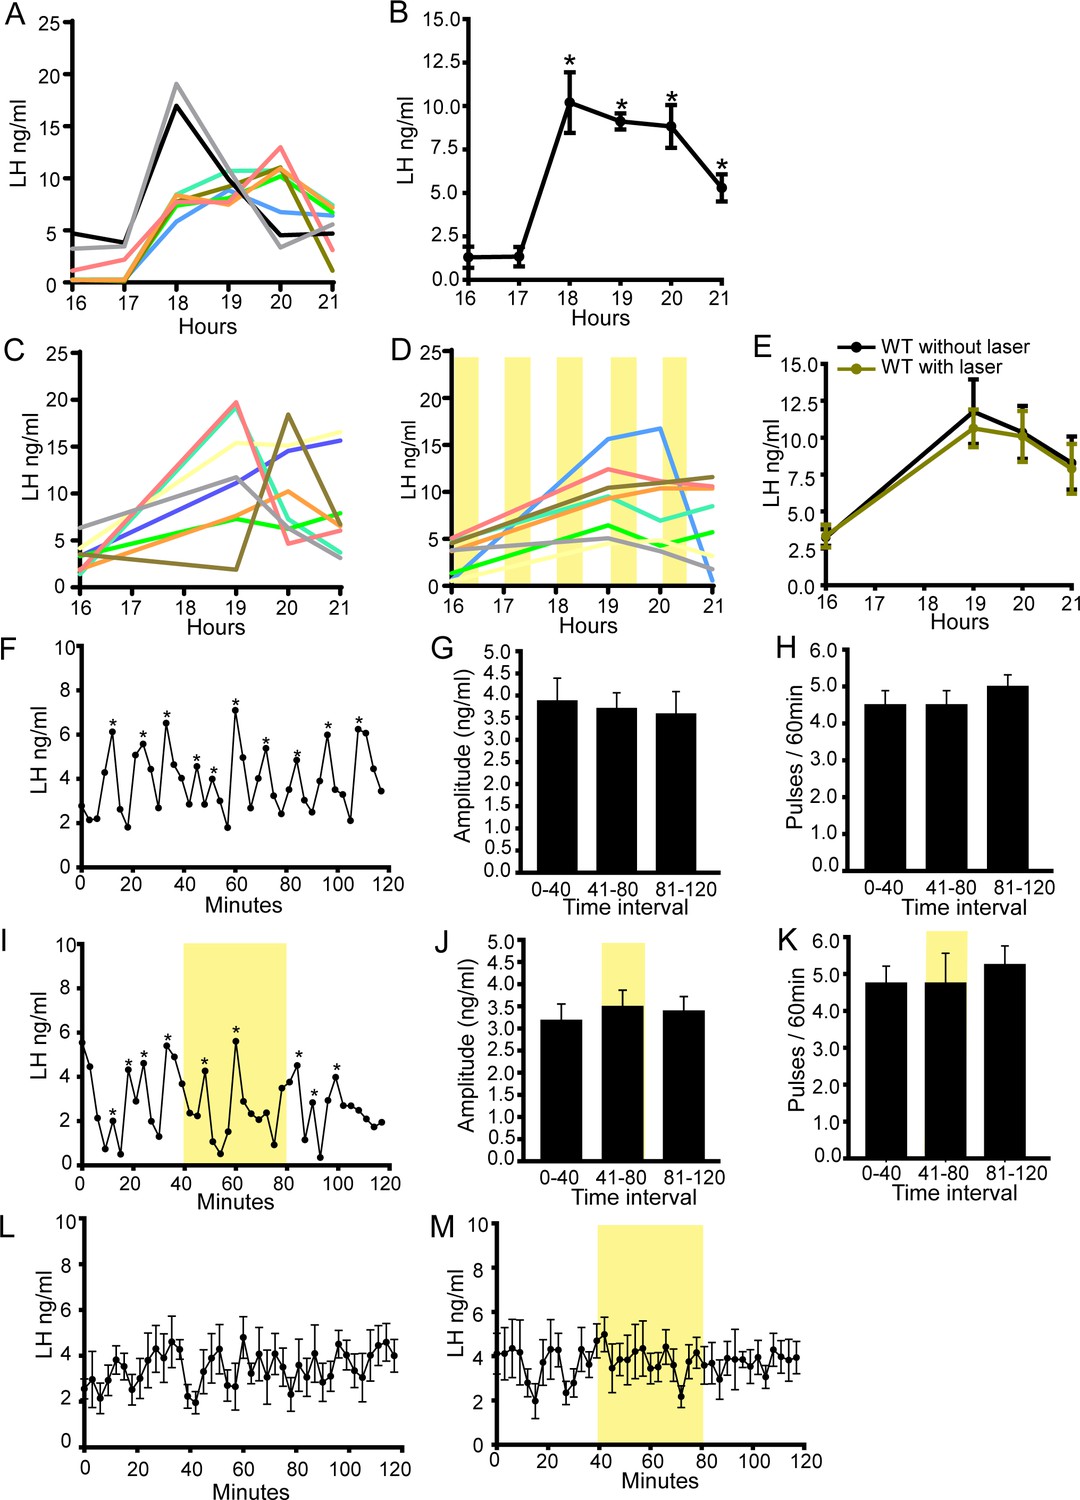
LH surge in GnRH-Arch mice and optogenetic control experiments showing effects of yellow light on the LH surge and pulses in wild-type mice.
(A) LH surge profiles in individual GnRH-Cre+/-;Rosa-CAG-Arch-GFP+/+ OVX+E+P female mice over 6 hr, with tail-tip blood sampling every hour. (B) Mean (± SEM) LH surge profile. Values significantly different from basal LH concentrations are indicated by an asterisk (p<0.05, repeated measures ANOVA). (C-D) LH surge profiles without (C, n = 8) or with (D, n = 8) unilateral 593 nm laser illumination in MBH of wild-type OVX+E+P female mice. (E) Mean LH levels. (F-M), Representative profiles of pulsatile LH secretion in wild-type OVX female mice without (F) or with (I, shaded areas) bilateral rPOA illumination at 593 nm for 40 min. LH pulses are indicated by asterisks. Mean (± SEM) LH pulse amplitude and frequency are given without (G,H, n = 6) or with (J,K, n = 6) bilateral rPOA 593 nm laser illumination. (L,M) Mean (± SEM) LH levels in wild-type OVX female mice without (L, n = 6) or with (M, n = 6) bilateral rPOA 593 nm laser illumination.
Author response image 1
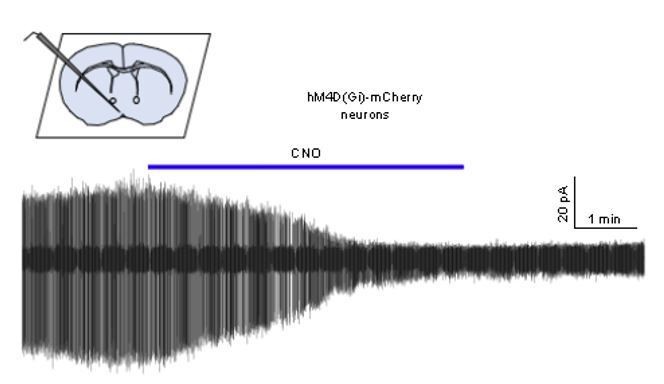
Cell-attached recording of a GnRH neuron from an AAV-injected mouse showing the effect of 1 μM CNO on firing.
Tables
Table 1
Quantitative analysis of synaptic appositions on the proximal and distal dendrites of GnRH neurons in diestrus female mice (N = 4).
For proximal dendrites, 60 µm of dendrite was measure in each case, whereas 15 µm lengths were examined for distal dendrites.
| GnRH proximal dendrites | |
|---|---|
| No. of dendrites counted | 38 |
| Percentage of dendrites with synaptophysin contact | 95% |
| No. of synaptophysin contacts with GnRH dendrite | 183 |
| Synaptic density per 10 µm | 0.8 ± 0.3 |
| GnRH Distal Dendrites | |
| No. of dendrites counted | 211 |
| Percentage of dendrites with synaptophysin contact | 53% |
| No. of synaptophysin contacts with GnRH dendrite | 330 |
| Synaptic density per 10 µm | 2.0 ± 0.2 |
Key resources table
| Reagent type (species) or resource | Designation | Source or reference | Identifiers | Additional information |
|---|---|---|---|---|
| Genetic reagent (M. musculus) | STOCK Tg(Gnrh1-cre)1Dlc/J | Jackson Laboratory | Stock #: 021207 RRID:IMSR_JAX:021207 | |
| Genetic reagent (M. musculus) | B6;129S-Gt(ROSA)26Sortm35.1(CAG-AOP3/GFP)Hze/J | Jackson Laboratory | Stock #: 012735 RRID:IMSR_JAX:012735 | |
| Genetic reagent (M. musculus) | B6.DBA-Tg(Gnrh1-EGFP)1Phs | Spergel et al., 1999 | MGI:6158458 | |
| Transfected construct (M. musculus) | AAV2-Retro-hSyn-DIO-hM4D(Gi)-mCherry | OBiO Technology (Shanghai) Corp., Ltd | RRID:Addgene_44362 | |
| Antibody | polyclonal guinea pig anti-GnRH antisera | gift G. Anderson, University of Otago | Cat #GA02 RRID:AB_2721118 | (1: 5000) |
| Antibody | polyclonal rabbit anti-GnRH antisera | gift G. Anderson, University of Otago | Cat #GA01 RRID:AB_2721114 | (1: 5000) |
| Antibody | Alexa Fluor 488-AffiniPure Donkey Anti-Guinea Pig IgG (H+L) | Jackson ImmunoResearch Labs | Cat# 706-545-148, RRID:AB_2340472 | (1:500) |
| Antibody | Alexa Fluor 594 donkey anti-rabbit antibody | Jackson ImmunoResearch Labs | Cat# 711-585-152, RRID:AB_2340621 | (1:500) |
| Antibody | DAPI (4',6-Diamidino-2-Phenylindole, Dilactate) antibody | Thermo Fisher Scientific | Cat# D3571, RRID:AB_2307445 | 300 nM |
| Antibody | Anti-GFP (chicken polyclonal) | Abcam | Cat# AB13970 RRID:AB_300798 | (1:8000) |
| Antibody | Anti-Synaptophysin 1 (guinea pig polyclonal) | Synaptic Systems | Cat#101004 RRID:AB_1210382 | (1:800) |
| Antibody | Anti-Vesicular GABA Transporter (rabbit polyclonal) | Synaptic Systems | Cat#131003 RRID:AB_887869 | (1:800) |
| Antibody | Anti- Gephyrin (guinea pig polyclonal) | Synaptic Systems | Cat#147318 RRID:AB_2661777 | (1:800) |
| Antibody | Goat anti-chicken (goat polyclonal, Alexa488-conjugate) | Thermo Fisher Scientific | Cat# A-11039 RRID:AB_2534096 | (1:200) |
| Antibody | Goat anti-guinea pig (goat polyclonal, biotin-conjugated) | Vector Laboratories | Cat# BA-7000 RRID:AB_2336132 | (1:200) |
| Antibody | Goat anti-rabbit (goat polyclonal, ATTO647N-conjugated) | Sigma-Aldrich | Cat# 40839 RRID:AB_1137669 | (1:200) |
| Chemical compound, drug | Beta-Estradiol 3-benzoate | Sigma Aldrich | E8515 | |
| Chemical compound, drug | Beta estradiol | Sigma Aldrich | E8875 | |
| Chemical compound, drug | progesterone | Sigma Aldrich | P0130 | |
| Chemical compound, drug | clozapine-N- oxide | Sigma Aldrich | C0832 | |
| Software, algorithm | GraphPad Prism software | GraphPad Prism | RRID:SCR_002798 | Version 6.01 |
| Software, algorithm | ImageJ image analysis software | ImageJ (https://imagej.net/) | RRID:SCR_003070 | |
| Software, algorithm | Vaa3D data visualization software | Vaa3D (http://www.vaa3d.org) | RRID:SCR_002609 |
Additional files
Download links
A two-part list of links to download the article, or parts of the article, in various formats.
Downloads (link to download the article as PDF)
Open citations (links to open the citations from this article in various online reference manager services)
Cite this article (links to download the citations from this article in formats compatible with various reference manager tools)
Different dendritic domains of the GnRH neuron underlie the pulse and surge modes of GnRH secretion in female mice
eLife 9:e53945.
https://doi.org/10.7554/eLife.53945


