Talin-activated vinculin interacts with branched actin networks to initiate bundles
- Department of Biochemistry, University of Zurich, Switzerland
- Université Grenoble Alpes, France
- Department of Immunology, Weizmann Institute of Science, Israel
Figures
Figure 1 with 1 supplement
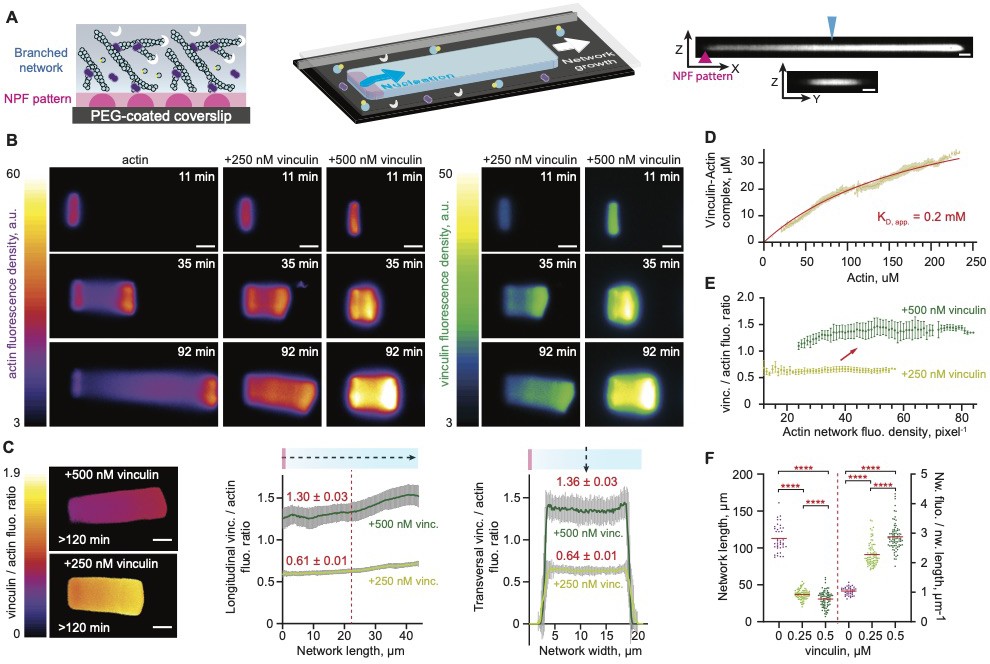
Vinculin alters the dynamics and the organization of lamellipodium-like branched actin networks.
(A) A schematic illustration of dendritic network growth from a WASP pWA-micropattern on a two-dimensional glass coverslip (left) in the presence of profilin–actin (in blue-yellow), CP (in white), and Arp2/3 (in purple). The three-dimensionally constrained growth of lamellipodium-like branched actin network is forced by the geometry (middle scheme). Median, orthogonal ZY and ZX views from confocal imaging of a representative network is shown on the right. The blue arrowhead indicates the position of the orthogonal ZX section. The purple arrowhead indicates the position of the Nucleation promoting factor (NPF) pattern. Scale bars, 4 µm. (B) Wide-field epifluorescence images of the growth of different actin networks on 3 × 15 μm2 GST-WASP pWA-coated patterned bar. Actin polymerized in a 10 µm high chamber in the presence of 4 μM G-actin Alexa-568 labeled, 8 μM Profilin, 120 nM Arp2/3 complex, 16 nM CP and talin VBS1-vinculin as indicated. (C) Analyses of longitudinal and transversal vinculin to actin fluorescence ratio along and across 25 networks, assembled as in B. Fluorescence intensities were measured along the line-scans (doted arrows) shown in the schematics. Plateau means are indicated. (D) Steady state saturation curve was fitted assuming mass-action binding at equilibrium. (E) Fluorescence quantification of the networks showed a stable vinculin to actin fluorescence ratio over the actin density. (C, D, E) Error bars represent the standard deviation from 25 networks per condition. (F) Dependence of networks length and actin fluorescence density on vinculin concentration. Statistical comparisons using Holm-Šídák test and a one-way analysis of variance (ANOVA) showed significant variations from 39, 83, 89 values for 0, 0.25, 0.5 µM vinculin, respectively, with p values < 0.0001. (B, C) Scale bars, 10 µm.
-
Figure 1—source data 1
Vinculin alters the dynamics and the organization of lamellipodium-like branched actin networks.
- https://cdn.elifesciences.org/articles/53990/elife-53990-fig1-data1-v2.xlsx
Figure 1—video 1
Vinculin slows down the dynamics of lamellipodium-like dendritic actin networks.
Network growth from WASP pWA-2D micropatterns with 4 μM G-actin Alexa-568 labeled, 8 μM Profilin, 120 nM Arp2/3 complex, 16 nM CP without (top) or with 250 nM VBS1-activated vinculin Alexa-488 labeled (bottom). Related to Figure 1.
Figure 2 with 6 supplements

The affinity of vinculin to actin in variety of network organizations.
(A) An example of patterned dots used to reconstitute actin networks (upper left corner). Schematic view shows the organization of actin filaments on two adjacent patterned dots. An Arp 2/3 complex-mediated branched actin network organization assembled on the WASP pWA-coated micropatterns (in gray) with 0.8 µM actin, 2.4 µM profilin, and 130 nM Arp2/3 complex. The Arp2/3 complex is activated by pWA and actin branches grow with their barbed end oriented outwards. (B) Representative steady state fluorescence images of reconstituted networks showing actin and the corresponding vinculin to actin fluorescence ratio. The image set illustrates the analysis in D. Conditions as in A but supplemented with VBS1-activated vinculin. (C) Dotted and continuous patterned rings indicating the line-scans used for quantifications of actin and vinculin fluorescence intensities across mixed polarity (green), uniform polarity (blue) and branched networks (purple). Conditions as in B. (D) Vinculin to actin fluorescence intensity ratio as a function of actin network fluorescence density. Conditions as in B. Inset, Steady state saturation curve was fitted assuming mass-action binding at equilibrium. In all cases, the concentration of vinculin was much lower than the KD and that of actin was much higher. Apparent dissociation equilibrium constant had a confidence interval of 31 to 38 for uniform polarity, 35 to 39 for mixed polarity, and 31 to 36 for the branched networks. (D) Inset. Error bars represent standard deviation from 529, 348, 181 patterns, as indicated (details in Materials and methods section). Scale bars, 20 µm.
Figure 2—figure supplement 1
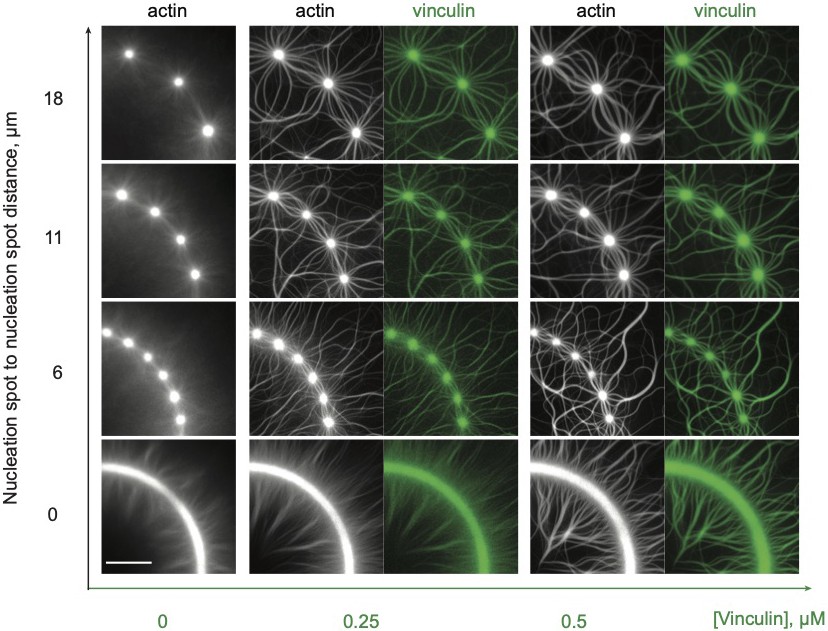
Overview of tested conditions.
Dual-color epifluorescence images of actin polymerized from continuous or dotted patterned rings, with variable dot-to-dot distances, with 0.8 µM actin, 2.4 µM profilin, and 130 nM Arp2/3 complex and VBS1-activated vinculin as indicated. We analyzed >500 patterns, and used them for quantitative measurements. Varying dot-to-dot distances allowed the assembly of mixed-polarity networks of variable flexibility. Actin, in gray; vinculin, in green. Scale bar, 20 µm.
Figure 2—figure supplement 2
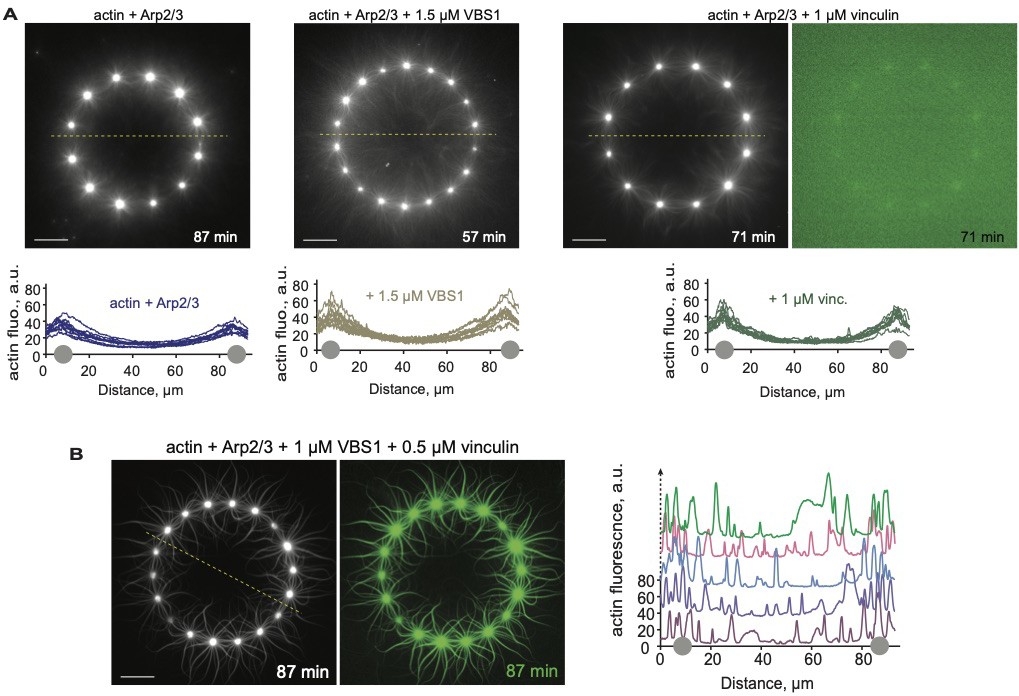
Control experiments for activated vinculin binding to higher-order actin structures.
Dual-color epifluorescence images of actin polymerized from dotted patterned rings with 0.8 µM actin, 2.4 µM profilin, and 130 nM Arp2/3 complex, with or without VBS1 and vinculin at the indicated concentrations. Actin, in gray; vinculin, in green. Scale bars, 20 µm. Graphs show actin fluorescence intensity along indicated line scans for 5–10 patterned structures. Gray dots on the x-axis indicate where the line scan crossed the ring perimeter. See Figure 2—videos 1 and 2.
Figure 2—figure supplement 3
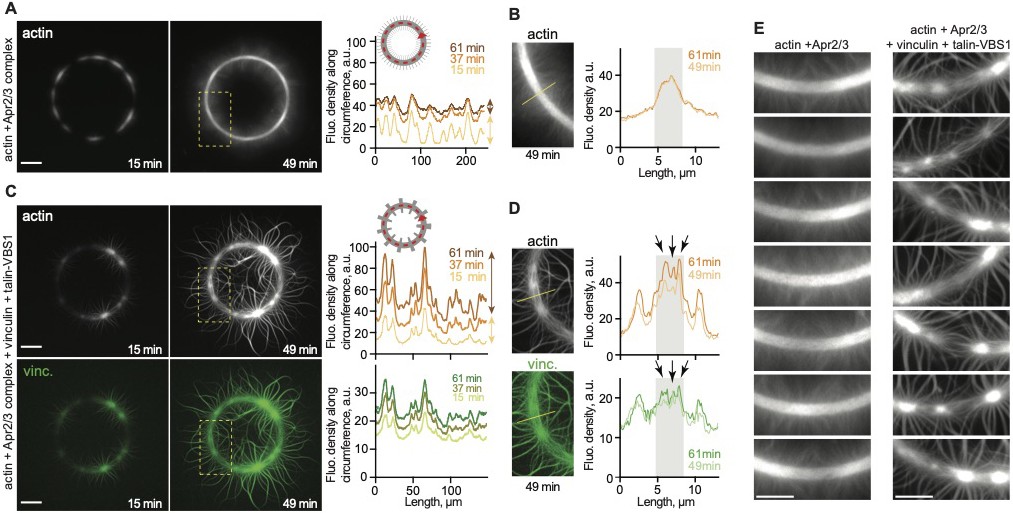
Vinculin compacts branched and intermeshed networks.
Dual-color epifluorescence images of actin polymerized from dotted patterned rings with 0.8 µM actin, 2.4 µM profilin, and 100 nM Arp2/3 complex (A,B), with 0.5 µM Alexa488 vinculin and 1 µM Talin VBS1 (C,D). Actin, in gray; vinculin, in green. Scale bars, 20 µm. (B,D) Zoom-in views of the indicated yellow, boxed areas in A and C. Graphs show actin fluorescence intensity along (A,C) or across (B,C) the circumference of the patterns. Arrows point to prominent indentations indicating the reorganization of the branched network into bundles. (E) Zoom-in views from seven different patterned structures for each condition highlight the reproducibility of the results in A and C. Scale bars, 10 µm. Figure 2—video 3.
Figure 2—video 1
Assembly of vinculin-free actin networks on patterns.
A representative actin network polymerized on a full or dotted patterned ring with 0.8 µM actin Alexa-538 labeled, 100 nM (full ring) or 130 (dotted ring) Arp2/3 complex, 2.4 µM profilin. Note the diffuse filament organization away from the patterned surfaces. Related to Figure 2.
Figure 2—video 2
Vinculin initiates bundles from uniform- and mixed-polarity actin networks.
A representative patterned actin network polymerized on a dotted ring with 0.8 µM actin Alexa-538 labeled, 130 nM Arp2/3 complex, 2.5 µM profilin, 500 nM VBS1-activated Alexa-488 labeled. Related to Figure 2.
Figure 2—video 3
Vinculin initiates bundles from branched and intermeshed actin networks.
A representative patterned actin network polymerized on a full ring with 0.8 µM actin Alexa-538 labeled, 100 nM Arp2/3 complex, 2.4 µM profilin, 500 µM VBS1-activated Alexa-488 labeled. Related to Figure 2.
Figure 3 with 9 supplements
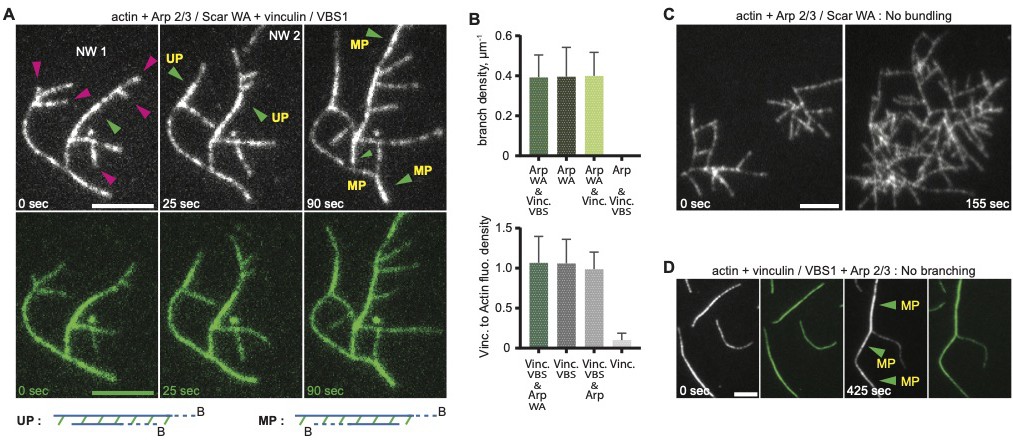
Vinculin induced uniform and mixed polarity filaments bundles.
(A) Actin polymerization and bundling by 0.3 µM full-length vinculin at, in the presence of 0.9 µM actin, 12 nM Arp2/3 complex, 80 nM WAVE WA fragment, and 1.4 µM talin VBS1. Crosslinking within and between independent networks are followed over time, NW1 and NW2. Dynamic actin branches (purple arrowheads), uniform polarity (UP, green arrowheads) and mixed polarity (MP) bundles are indicated. Schemes defining UP and MP with a pair of actin filaments crosslinked by vinculin (in green) are drawn below; barbed ends (B) are indicated. (B) Quantifications of branch density or vinculin to actin fluorescence ratio of networks polymerized with the mentioned proteins at concentrations indicated in A, are shown as histograms. Error bars represent the standard deviation from 15 to 20 values per condition. (C, D) Controls assays with the mentioned proteins at concentrations indicated in A. Scale bars, 5 µm.
Figure 3—figure supplement 1
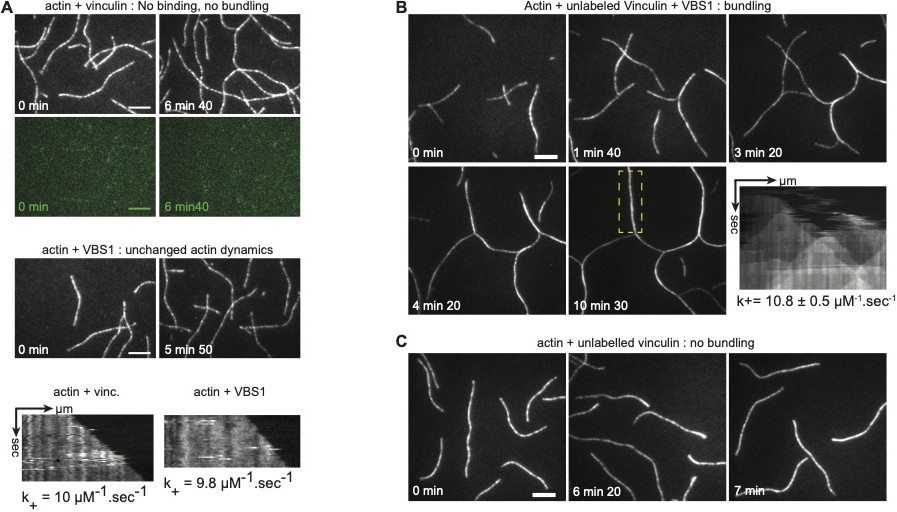
Controls for bundling and vinculin integrity after chemical labelling.
Polymerization of 0.6 µM Alexa-647 labelled actin with 0.6 µM Alexa-488 labelled vinculin or with 1.8 µM VBS1 (A), or with 0.1 µM unlabeled vinculin and 1.4 µM VBS1 (B), or with 0.1 µM unlabeled vinculin (C), as revealed by TIRFM. Kymographs and on-rate constant of actin polymerization are shown. Scale bars, 5 µm.
Figure 3—figure supplement 2
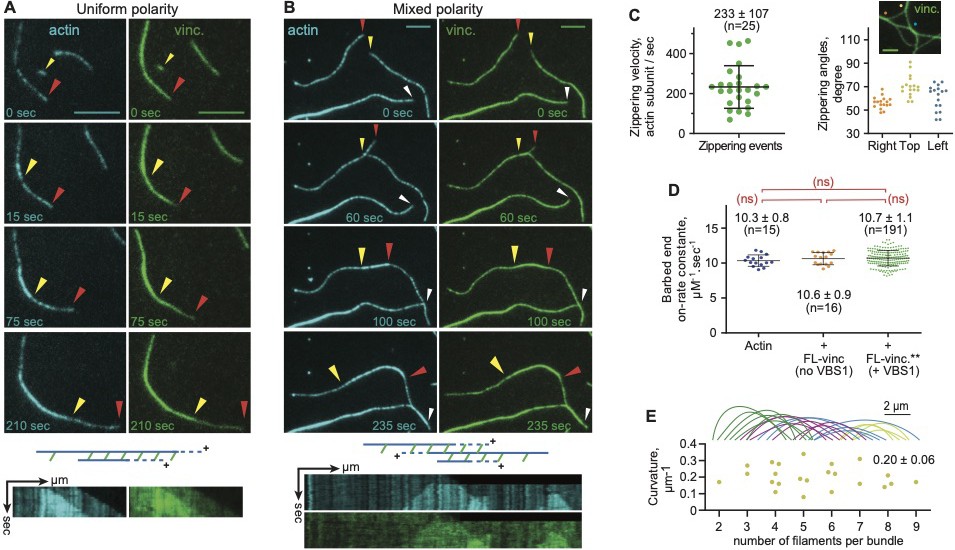
Vinculin-mediated fast zippering does not affect actin filament dynamics.
(A, B) Polymerization of 0.6 µM Alexa-647 labelled actin and bundling induced by 0.6 µM (A) or 0.3 µM (B) talin VBS1-activated vinculin, as revealed by two-color TIRFM. Arrowheads indicate the barbed end growth of two filaments. Vinculin induces both uniform- and mixed-polarity crosslinking of a parallel pair of actin filaments. Scale bars, 5 µm. Kymographs were generated along the actin filament. Schematic views of kymographs where ‘+’ indicates barbed end of filaments. (C) Zippering velocity and angles of actin with VBS1-activated vinculin. Zippering angles plot shows variations from 14 values per group. (D) Barbed end growth calculated from actin kymographs. Comparison of the on-rate constant by the Holm-Šídák test and a one-way analysis of variance (ANOVA). (C, D) Error bars represent standard deviation. (E) Traces of curved vinculin-induced bundles observed by TIRFM. The curvature (an actin filament exhibits a radius, typically ≥9 µm) is drawn as a function of the number of actin filaments per bundle, calculated based on single filament average fluorescence density.
Figure 3—figure supplement 3
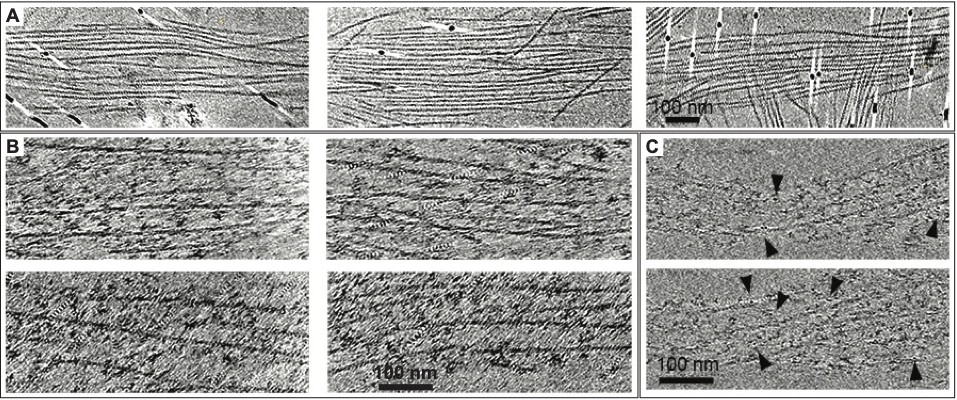
Actin bundling induced by Vt and full-length vinculin as revealed by cryo-ET.
(A) X-Y slices, 3 nm in thickness, through cryo-ET of Vinculin tail (Vt) induced actin bundles reveals tight actin bundles with a 10 nm inter-filament spacing (Janssen et al., 2006). (B) X-Y slices, 19 nm in thickness, through cryo-ET actin bundles that were induced by GFP-VBS1-activated Vinculin reveals irregular densities between the filaments, with a 29 nm inter-filament spacing. (C) The localization of vinculin in the vitrified samples was further confirmed using 2.3 nm gold-VBS1 conjugates (arrowheads, 10% of the VBS1 protein). 5 nm thick sections are shown. (A–C) To favor their random orientation in the solution, preassembled filaments with 0.7 µm median length (where actin:CP was 200:1) were incubated with VBS1-activated vinculin or vinculin tail fragment, applied to EM grids, subjected to vitrification, and imaged in their near-native state by cryo-ET (Weber et al., 2019).
Figure 3—figure supplement 4
Structural characterization of in vitro vinculin-actin bundles.
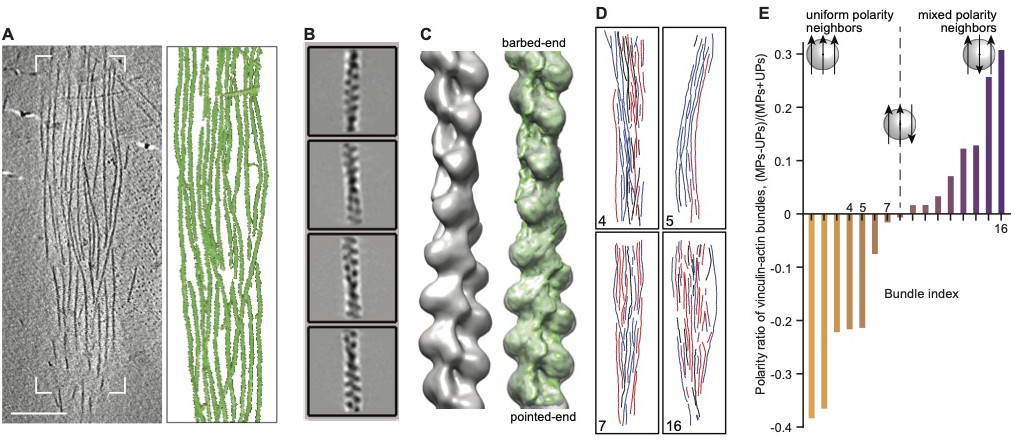
Resolving the polarity of individual actin filaments within bundles by cryo-ET and image processing analysis (A) An x-y slice, 1.4 nm in thickness, through a representative tomogram of a vinculin-induced bundle and its respective surface-rendered view (white frame) displays a detailed view of individual filaments. To favor their random orientation in the solution, preassembled filaments with 0.7 µm median length (where actin:CP was 200:1) were incubated with VBS1-activated vinculin, applied on EM grids, subjected to vitrification, and imaged in their near-native state by cryo-ET (Weber et al., 2019). Scale bar, 100 nm. (B) 2D structural classes were derived from ~30,000 actin segments extracted from 16 tomograms of bundles. (C) Helical reconstruction (Behrmann et al., 2012; He and Scheres, 2017) reveals filament structure and polarity. The helical reconstruction algorithm, as embedded in RELION (He and Scheres, 2017) was employed to generate a 14 Angstrom-resolved structure, in which the filament’s barbed end and pointed end were identified by docking the canonical F-actin structure EMD-6179 (Galkin et al., 2015), with a cross-correlation coefficient of 0.84. (D), Directionality maps of four representative bundles. Using the reconstruction parameters of our structure, actin segments were traced back to their original positions in the 3D tomograms and reconnected to form the original filaments, resolving the directionality of individual actin filaments within the bundles (red and blue, barbed end up and down, respectively). Filaments depicted in black are compromised by a low confidence in the directional assignment (majority score <2/3, see Materials and methods section, Martins et al., 2020). Numbers refer to the bundle’s index in E. (E) Determination of the overall polarity of each bundle as defined by the score (MPs-UPs)/(MPs+UPs). For each segment of a bundle, the degree of uniform polarity (UP) and mixed polarity (MP) describes the orientation of its close neighbors (as detailed in Materials and methods section). Then, for all segments of a bundle, UP and MP values were summed and processed. Bundles with a higher density of uniform-polarity packing (UPs > MPs) have a negative score, while bundles with a higher density of mixed-polarity packing (MPs > UPs) have a positive score. In this analysis, we considered neighbors on either side of the filament.
Figure 3—figure supplement 5
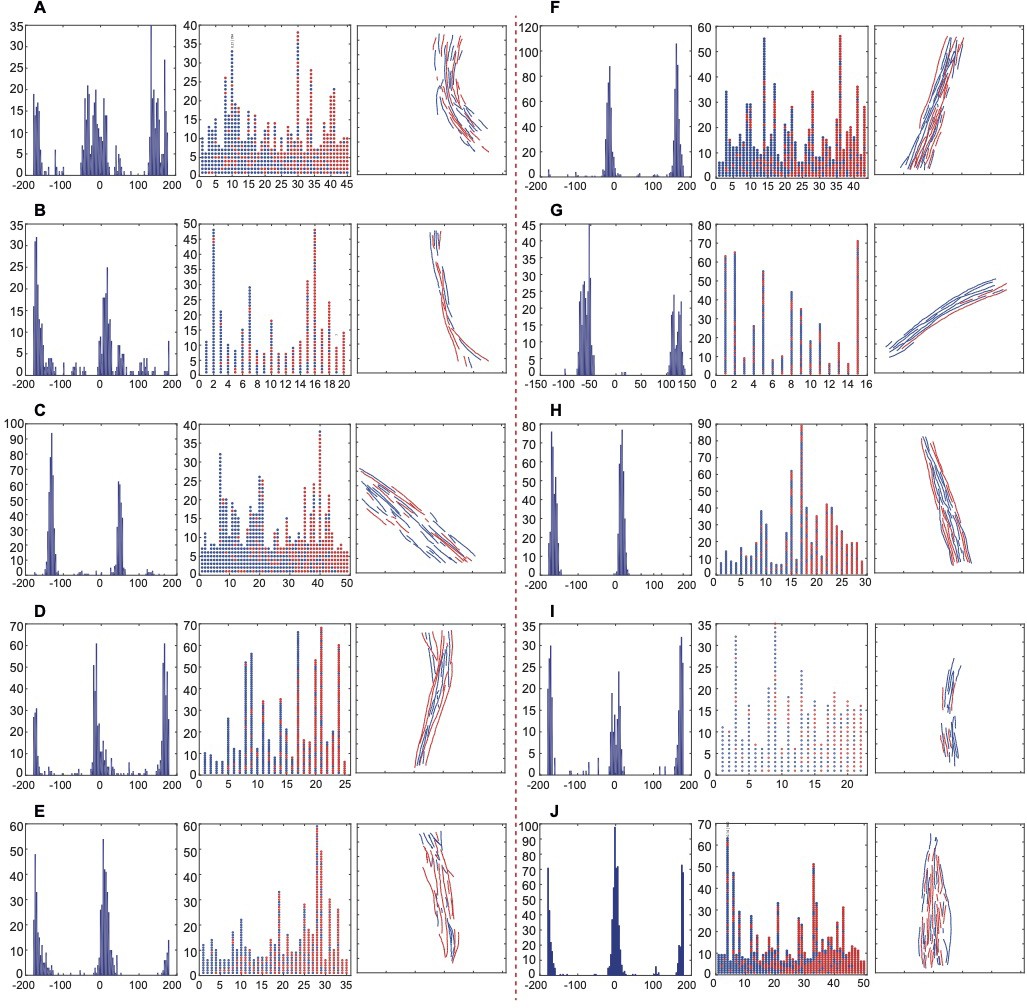
Directionality analysis of actin filaments.
(A–J) The bimodal histograms of psi angles (left) show the directionality of actin segments within a bundle, the circle-column plots (middle) indicate the directions of actin segments within individual filaments, and the bundles with assigned filament directions (the direction of segments majority determined the filament direction) are shown.
Figure 3—figure supplement 6

Confidence and neighborhood analyses of actin filaments.
(A) The majority confidence score. The dashed line indicates the majority confidence score used as a threshold for determining polarity of a filament. Around 20% of the 610 filaments were excluded due to low confidence. (B) The filament mean ‘3D CCC’ score measures the mean cross-correlation of all 3D segments of a filament with the averaged structure. While the 3D CCC is affected by the missing wedge, the confidence score is not negatively affected by the filament orientation with respect to the tomographic tilt axis. It shows that our approach is not biased by the missing wedge-induced anisotropy. (C) The directionality of neighboring actin filaments was determined by analyzing the direction of segments within a sphere with radius of 40 nm. The diagram illustrates the different types of possible neighborhoods and their degrees of uniform and mixed polarity.
Figure 3—video 1
Assembly of branched actin networks without vinculin.
Actin polymerization and branching in the presence of 0.9 µM actin Alexa-647 labeled, 12 nM Arp2/3 complex, and 80 nM WAVE WA fragment, followed by TIRFM. Note the branch entanglement and the absence of bundle formation. Related Figure 3.
Figure 3—video 2
Vinculin initiates actin bundles from Arp2/3 complex-branched arrays.
Actin polymerization in the presence of 0.9 µM actin Alexa-647 labeled, 300 nM VBS1-activated vinculin Alexa-488 labeled, 12 nM Arp2/3 complex, and 80 nM WAVE WA fragment, followed by TIRFM. Note the early vinculin decoration of branched networks and the stable vinculin-induced bundling intra- and internetwork. Related to Figure 3.
Figure 3—video 3
Vinculin-mediated crosslinking can induce bent actin filament breakage.
Actin polymerization and vinculin-mediated crosslinking from 0.8 µM actin Alexa-647 labeled, 300 nM VBS1-activated vinculin Alexa-488 labeled, followed by TIRFM. Red and green arrows indicate barbed and pointed ends, respectively. Blue arrows indicate loop closure until filament breakage and the release of a dynamic barbed end (yellow arrow). Related to Figure 3.
Figure 4 with 6 supplements
Vinculin activated by surface immobilized VBS1 initiate actin bundles only at coated spots.
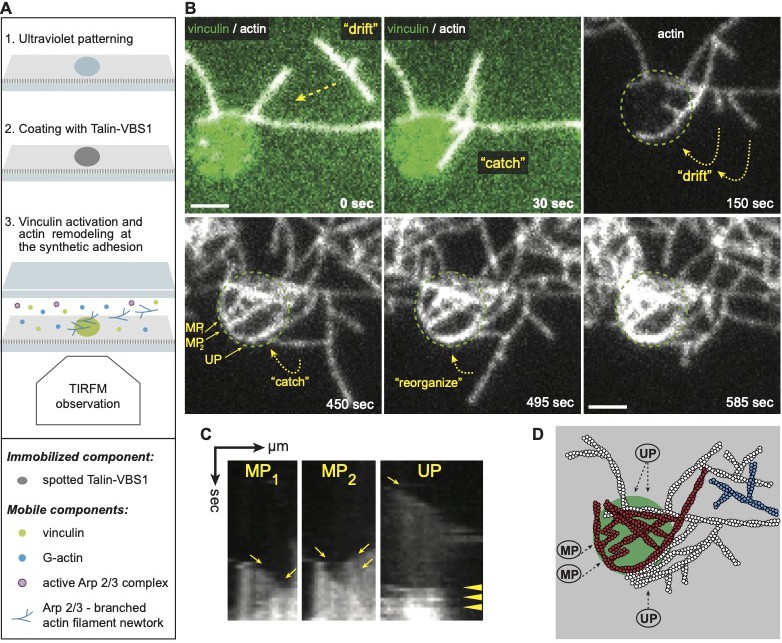
(A) Scheme of the experimental setup shows that the passivated coverslip is patterned (1) and coated with talin-VBS1 (2). Next the patterned surface was mounted into a flow chamber in which a mix of 300 nM inactive full-length vinculin, 0.3 µM actin monomer, 18 nM Arp2/3 and its activator, 80 nM WAVE WA, was delivered (3). (B) Bundling of Arp2/3-branched actin networks by vinculin was observed only at the sites of patterned VBS1. Dotted arrows indicate the direction of movement of the branched networks, which are bundled. Dotted circle shows the position of the VBS1-coated pattern decorated by vinculin (green in the upper panel). Mixed polarity (MP) and uniform polarity (UP) bundles formed on the pattern. Scale bar, 2 µm. (C) Kymographs along the three bundles, shown in B, confirm the crosslinking of Arp2/3 complex-mediated branches into MP (highlighted by arrows) and UP (arrowheads highlight the fusion of 4 branches to a secondary network). (D) The schematic view depicts the bundles initiated from the two branched networks, colored in white and in red and imaged in B.
Figure 4—figure supplement 1

Control assay for the specific recruitment and activation of vinculin by surface-bound Talin-VBS1.
A passivated coverslip is patterned, then coated with bovine serum bovine protein (BSA), and used to assemble a flow chamber in which a mix of 0.3 µM actin monomer, 300 nM vinculin, 18 nM Arp2/3 and its activator 80 nM WAVE WA is delivered. The reaction is monitored using TIRFM. Time-lapse of the assembly of two Arp2/3 complex-branched actin networks and their interaction with BSA-coated patterns. 51 × 51 µm2 full-field TIRFM image at t = 0 reveals a limited, non-specific recruitment of actin to the hexagonal pattern of 3 µm in diameter dots, that were initially printed on the passivated coverslip, and here encircled in white. Yellow and red squares are zoomed, and associated time-lapse images are displayed. Note that even if the Arp2/3 complex-branched network growing over or in proximity to the BSA-coated patterns showed some transient interactions with the surface, they were not seen to stably interact with it, nor undergo any reorganization into bundles. Dotted circle in the time-lapses shows the position of the BSA-coated patterns. Images in green show the non-specific recruitment of vinculin to the BSA-coated patterns where the image contrast is set similarly to that in Figure 4. The plot compares vinculin fluorescence density associated to BSA-coated spots to GST-VBS1-coated spots. Numbers are the mean ± standard deviation from 16 sample values. Intensities were measured at the onset of each experiment in order to avoid any bias due to the photobleaching of bound vinculin. See Figure 4—video 2.
Figure 4—figure supplement 2
VBS1-activated Vinculin anchored to actin bundles can engage and bundle undecorated flowing filaments.
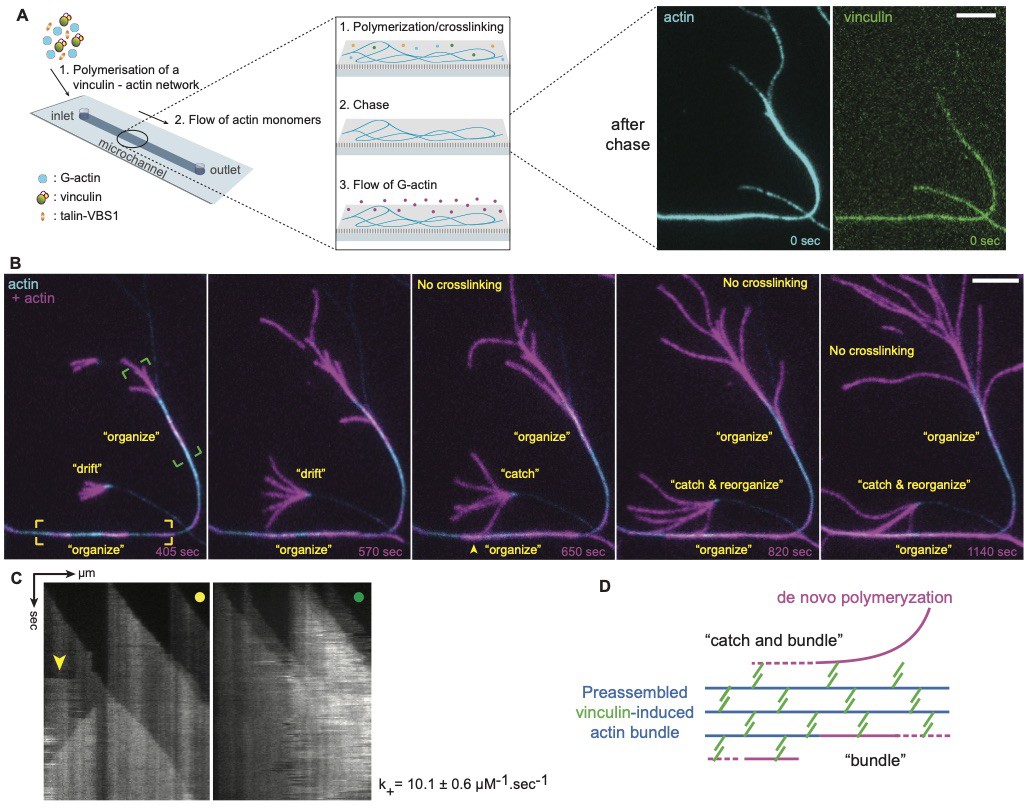
(A) Illustration of the microfluidic delivery of actin monomers to a stable network of vinculin-actin bundles. In a typical experiment, (1) actin monomers, vinculin and VBS1 are supplied in a polymerization buffer from the inlet. (2) At the steady state of actin assembly, all soluble components are chased and replaced by (3) a solution of actin monomers that is delivered with a microfluidic flow to preassembled vinculin-decorated actin bundles (images after chase). The reaction is monitored using TIRFM. (B) Two-color TIRFM images of de novo polymerization of actin filament (in purple) from preassembled filament-containing bundles (in blue). Newly polymerized, naked actin filaments are mobile. They collided but were not seen to fuse together into bundles. In contrast, when they come in proximity to a pre-existing vinculin-decorated bundle, they were ‘trapped’ and fused to the bundle. (C) Kymographs along preassembled vinculin-actin bundles, as delimited by boxed areas in B. They show de novo actin assembly from pre-existing bundles. Boxes in B and dots on the kymographs share the same color code. The arrowhead points to a sudden gain in actin intensity due to the recruitment by the bundle of a mobile, freshly assembled actin filament. Deducted on-rate constants averaged at 10.1 ± 0.6 µM−1.sec−1, in agreement with an unperturbed barbed end elongation along the preassembled bundle. (D) Diagram for the ‘catch and reorganize’ process suggesting that vinculin-decorated bundles contain a fraction of immobilized active vinculin that is able to engage naked and mobile actin filaments. Scale bars, 5 µm. See Figure 4—video 3.
Figure 4—figure supplement 3
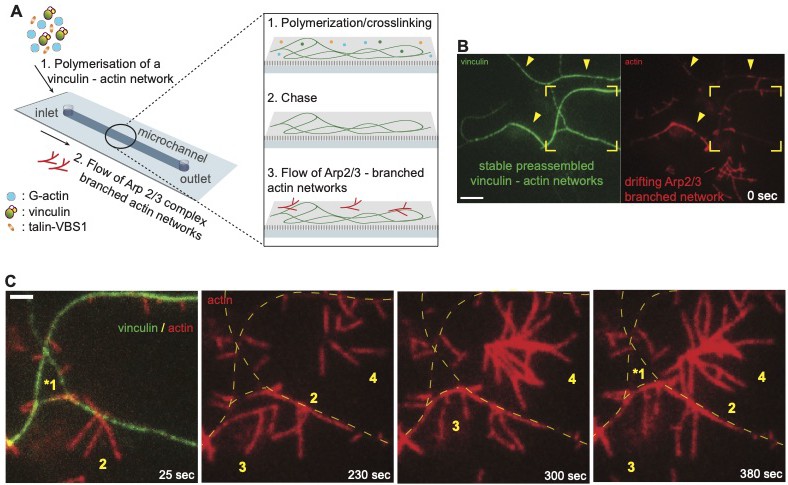
VBS1-activated Vinculin anchored to actin bundles can engage and bundle undecorated flowing branched networks.
(A) Schematic illustration of the microfluidic mixing channel used to flow pre-polymerized Arp2/3 complex-branched actin networks over immobile vinculin-actin bundles. (1) Actin monomers, vinculin and VBS1 are supplied in a polymerization buffer from the inlet. (2) At the steady state of actin assembly, all soluble components are replaced by (3) a solution of a pre-assembled branched actin networks. The reaction was monitored by TIRFM. (B,C) Two-color TIRFM of the vinculin-decorated actin bundles that captured drifting Arp2/3 complex-branched actin networks. (B) Field-of-view image showing a network of vinculin-actin bundles (vinculin in green) and freshly injected Arp2/3 complex-branched networks (actin in red). Arrowheads indicate the fusion of the injected Arp2/3 complex-branched networks with vinculin-actin bundles. The framed area is zoomed in C. (C) Four independent mobile branched actin networks ‘trapped’, fused, and stabilized onto the same vinculin-actin bundle, are shown. Arrow indicates the network mobility and arrowheads the fusion events; numbers indicate the sequential fusion of the four networks; dotted lines show the positions of vinculin-actin bundles. Scale bars, 5 µm (B), or 2 µm (C).
Figure 4—video 1
Recruited by VBS1-coated spot, vinculin initiates actin bundles from mobile branched networks.
Reorganization dynamics of mobile, branched actin networks by substrate-bound, talin-activated vinculin, followed by TIRFM. 2D micropatterns were coated with GST-VBS1. Actin polymerization was in the presence of 0.3 µM actin Alexa-647 labeled, 300 nM inactive vinculin Alexa-488 labeled, 18 nM Arp2/3 complex, and 80 nM WAVE WA fragment. Related to Figure 4.
Figure 4—video 2
Interaction of a mobile branched actin network with BSA-coated spot.
Dynamics was followed by TIRFM. 2D micropatterns were coated with BSA. Actin polymerization was in the presence of 0.3 µM actin Alexa-647 labeled, 300 nM inactive vinculin Alexa-488 labeled, 18 nM Arp2/3 complex, and 80 nM WAVE WA fragment. Related to Figure 4.
Figure 4—video 3
Immobilized on actin bundles, vinculin can bind mobile actin filaments.
Reorganization dynamics of branched actin networks delivered with a microfluidic flow to preassembled vinculin-decorated actin bundles, followed by TIRFM. Bundles were assembled from 0.8 µM actin Alexa568-labeled monomers, 1 µM VBS1-activated vinculin Alexa488-labeled. At steady state of actin assembly, all soluble components were washed away with five channel volumes. Without delay, a solution of 0.5 µM actin Alexa647-labeled monomers was injected at 25 µL per min. Images were then recorded every 15 s. Related to Figure 4.
Figure 5
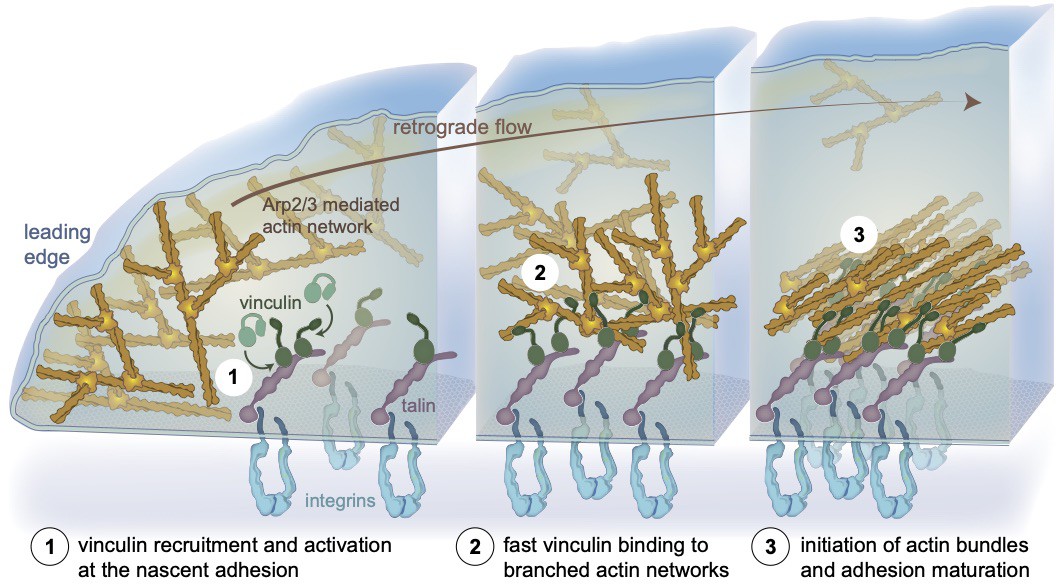
A model depicting the initiation of actin bundles from branched networks by membrane bound talin-activated vinculin at nascent adhesions, independent of myosin-mediated force.
Schematic representation of a nascent integrin-based adhesion site, localized in proximity to the leading edge of a cell (left). (1) The Arp2/3 branched actin network treadmills and flows centripetally. Vinculin is activated by interacting with talin (Atherton et al., 2020; Kelley et al., 2020). (2) At nascent adhesion sites, talin-activated vinculin stably binds and bundles mobile branched networks likely affecting actin dynamics. (3) Actin retrograde flow generates tension that further activates talin and vinculin, reinforcing the link to integrins. Adhesion-anchored vinculin interacting with the flowing, branched actin networks initiates bundles at the nascent adhesion site. Vinculin engages the actin retrograde flow, applying tension to the mechanoresponsive components of the adhesion, enabling adhesion self-sustained assembly dynamics and recruitment of additional FA components such as myosin II, α-actinin, and zyxin (Case et al., 2015; Choi et al., 2008; Thievessen et al., 2013).
Tables
Key resources table
| Reagent type (species) or resource | Designation | Source or reference | Identifiers | Additional information |
|---|---|---|---|---|
| Gene (Homo sapiens) | VCL | Human Genome Nomenclature Database | HGNC:12665 | |
| Cell line used for cloning (human skin) | Human A431 | Sigma-Aldrich | Cat# 85090402 | Cell line for cloning VCL |
| Strain, strain background (S. frugiperda) | SF9 cells | ThermoFisher Scientific | Cat# 12659017 | Cell line for baculovirus generation and protein expression |
| Strain, strain background (E. coli) | DH5α | ThermoFisher Scientific | Cat# 18265017 | Chemically competent cells |
| Strain, strain background (E. coli) | DB3.1 | Gift from Raymond Dutzler | Chemically competent cells | |
| Strain, strain background (E. coli) | BL21(DE3)pLysS | Sigma-Aldrich | Cat# 69451 | Chemically competent cells |
| Recombinant DNA reagent | pFBXC3GH-VCL | This paper, Subcloned in vector gifted by R. Dutzler | For recombinant baculovirus generation and full-length human VCL expression in SF9 cells | |
| Recombinant DNA reagent | pBXNHG3-TLN1-VBS1 | This paper, Subcloned from gift from Christophe LeClainche, in vector gifted by R. Dutzler | Human Talin1-VBS1 (482–636) | |
| Recombinant DNA reagent | pBXNHG3-VCL-Tail | This paper, Subcloned from pFBXC3GH-VCL | Human vinculin tail (879–1066) | |
| Commercial assay, kit | Bac-to-Bac Vector Kit | ThermoFisher Scientific | Cat# 10359016 | For cloning |
| Commercial assay, kit | RNeasy mini Kit | Qiagen | Cat# 74104 | For cloning |
| Commercial assay, kit | AffinityScript qPCR cDNA Synthesis Kit | Agilent | Cat# 600559 | For cloning |
| Chemical compound, drug | Alexa Fluor 488 C5 Maleimide | ThermoFisher Scientific | Cat# A10254 | For protein labeling |
| Chemical compound, drug | Alexa Fluor 647 C2 Maleimide | ThermoFisher Scientific | Cat# A20347 | For protein labeling |
| Chemical compound, drug | Alexa Fluor 568 C5 Maleimide | ThermoFisher Scientific | Cat# A20341 | For protein labeling |
| Chemical compound, drug | mPEG-Silane, MW 5 k | Creative PEGWorks | Cat# PLS-2011 | Surface passivation |
| Chemical compound, drug | PLL(20)-g(3.5)-PEG(2) | SuSoS AG | Surface passivation | |
| Chemical compound, drug | Methyl Cellulose | Sigma-Aldrich | Cat# M0387 | Reconstitution assays |
| Peptide, recombinant protein | Glucose Oxidase Type II | Sigma-Aldrich | Cat# G6125 | Reconstitution assays |
| Peptide, recombinant protein | Catalase | Sigma-Aldrich | Cat# C9322 | Reconstitution assays |
| Other | Adhesive Tape | Nitto | Cat# 5601 | Microscopy chamber assembly |
| Other | sticky-Slide VI 0.4 | Ibidi | Cat# 80608 | Reconstitution assays |
| Software, algorithm | FIJI | https://imagej.net/Fiji/Downloads | For data analysis | |
| Software, algorithm | Prism | GraphPad | https://www.graphpad.com/scientific-software/prism/ | For data analysis |
| Software, algorithm | MATLAB | MathWorks | https://www.mathworks.com/products/matlab.html | For data analysis |
| Software, algorithm | SerialEM | University of Colorado Open source under an MIT license | https://bio3d.colorado.edu/SerialEM/download.html | For data acquisition |
| Software, algorithm | UCSF Chimera | University of California | https://www.cgl.ucsf.edu/chimera/download.html | For structure visualization |
Additional files
Download links
A two-part list of links to download the article, or parts of the article, in various formats.
Downloads (link to download the article as PDF)
Open citations (links to open the citations from this article in various online reference manager services)
Cite this article (links to download the citations from this article in formats compatible with various reference manager tools)
Talin-activated vinculin interacts with branched actin networks to initiate bundles
eLife 9:e53990.
https://doi.org/10.7554/eLife.53990


