Pupil-linked phasic arousal predicts a reduction of choice bias across species and decision domains
- Department of Neurophysiology and Pathophysiology, University Medical Center Hamburg-Eppendorf, Germany
- Department of Psychology, University of Amsterdam, Netherlands
- Department of Neuroscience, Baylor College of Medicine, United States
- Jan and Dan Duncan Neurological Research Institute, Texas Children’s Hospital, United States
- Department of Cognitive Psychology, Institute of Psychology, Universität Hamburg, Germany
- Cold Spring Harbor Laboratory, United States
- Institute of Neuroscience, University of Oregon, United States
- Department of Neuroscience, Yale University, United States
- Amsterdam Brain and Cognition, University of Amsterdam, Netherlands
Figures
Figure 1 with 1 supplement
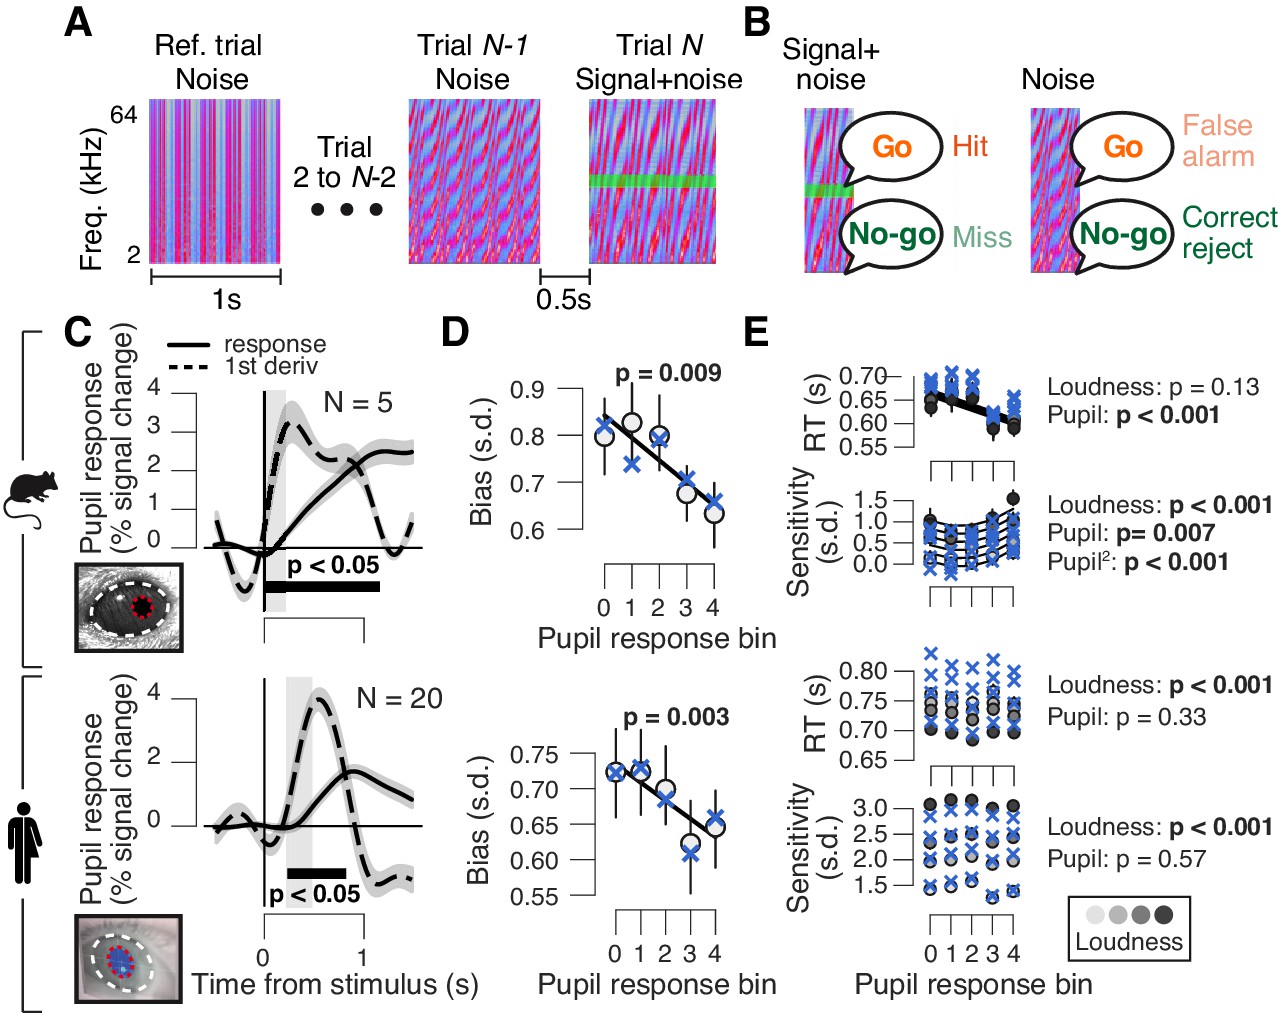
High phasic arousal is associated with reduced perceptual choice bias.
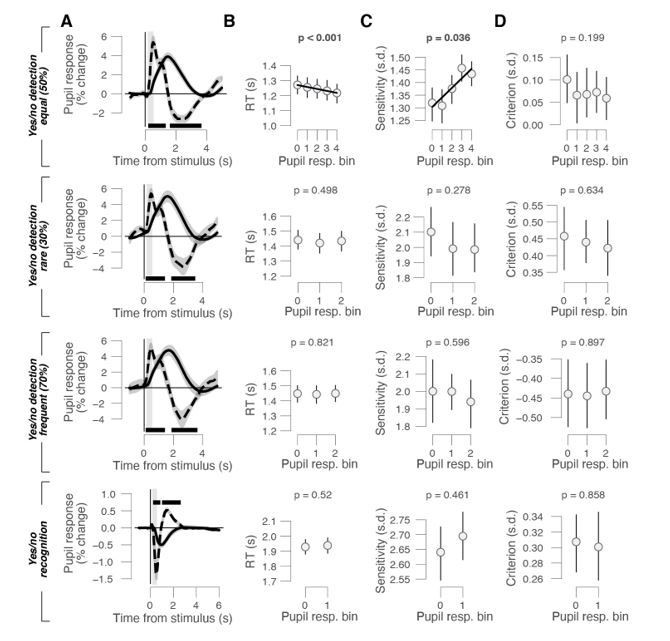
(A) Auditory go/no-go detection task. Schematic sequence of discrete trials in a mini block (see 'Materials and methods'). Subjects responded to a weak signal (stable pure tone) in fluctuating noise and withheld a response for noise-only trials. (B) Combination of stimulus (signal+noise vs. noise) and choice (go vs. no-go) yielded the four categories of signal detection theory. (C) Change in pupil diameter (solid line) and its temporal derivative (dashed) in mice (top) and humans (bottom). Gray window, interval for extracting task-evoked pupil responses (see 'Materials and methods'); black bar, significant pupil derivative (p<0.05, cluster-corrected one-sample t-test). (D) Relationship between pupil response (equal size bins, see 'Materials and Methods') and choice bias in mice (top) and humans (bottom). We assumed that subjects set a single decision criterion (see also Figure 1—figure supplement 1B,H). (E) As panel (D), but for mean reaction time (RT) and sensitivity (d′). For panels (C–E): group average (N = 5; N = 20); shading or error bars, s.e.m. Solid lines, linear or quadratic fits to binned data (linear fits are shown where first-order fit was superior to constant fit, quadratic fits are shown where second-order fit was superior to first-order fit). Blue ‘X’s, predictions from the best fitting drift diffusion model (see Figure 4 and associated text); p-values, mixed linear modeling (predictors are ‘loudness' = signal loudness and ‘pupil’ = pupil bin).
Figure 1—figure supplement 1
Additional analyses of data from auditory go/no-go detection task.
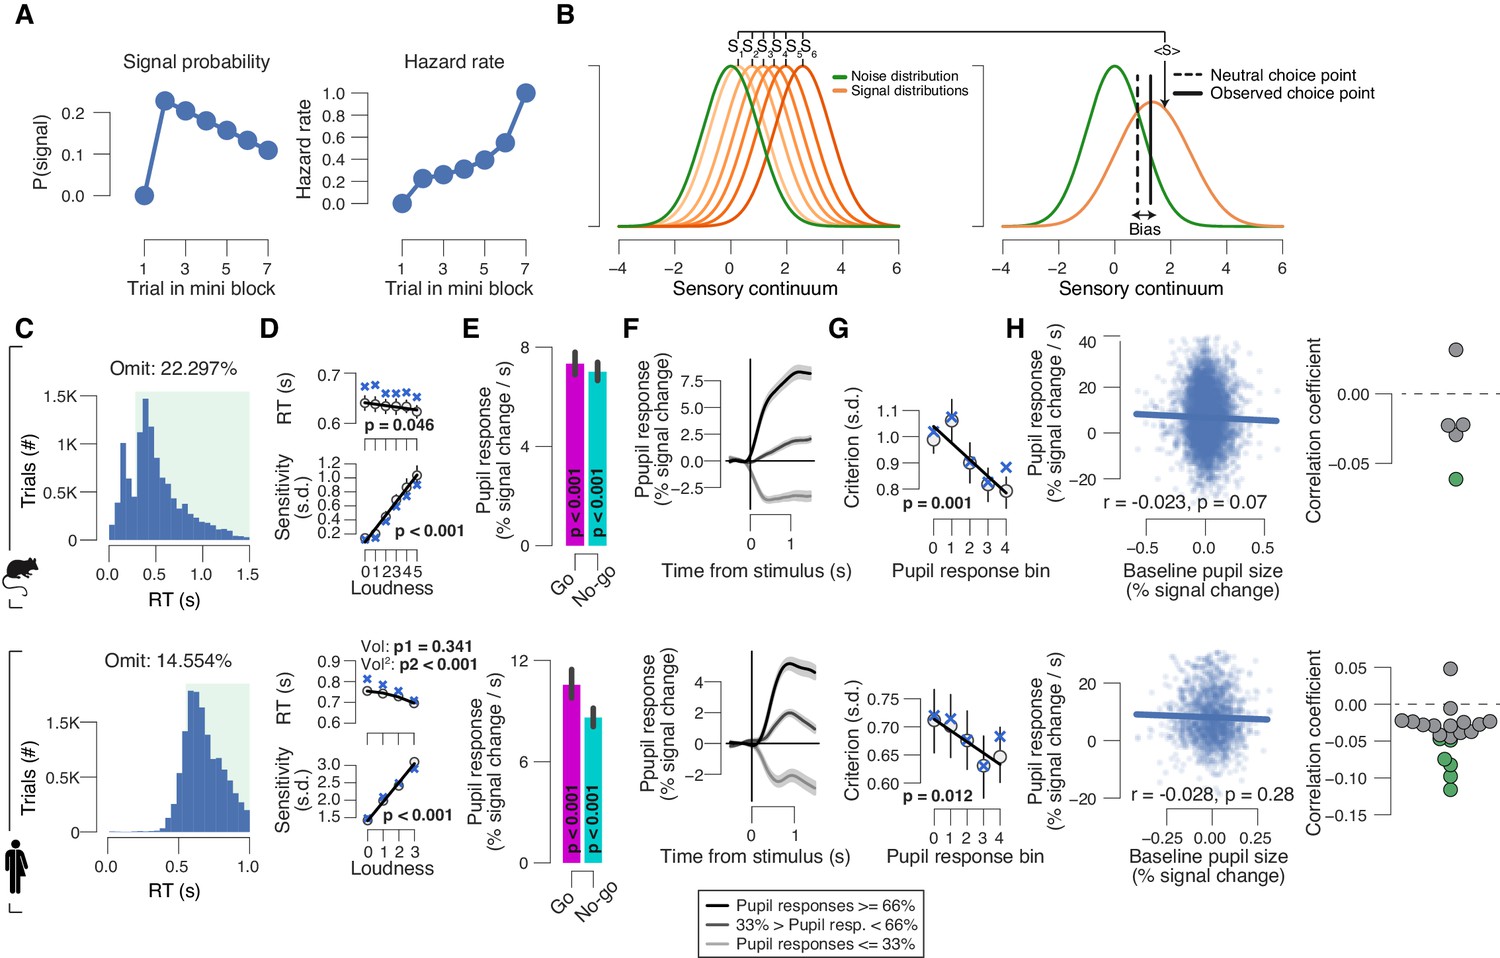
(A) Left: probability of target signal across the sequence of 1–7 trials within a mini block. Right: as left, but for hazard rate (probability of signal, given that it has not yet occurred). Although the hazard rate of signal probability increased within a mini block, pupil responses did not systematically vary with trial number within a mini block (see Fig. R2 in reply to reviewers). (B) Schematic of overall perceptual choice bias measure (see 'Materials and methods'). For pupil bin, we modeled one overall noise distribution (green; normally distributed with mean = 0, sigma = 1), and one ‘composite’ signal distribution. This composite signal distribution was computed as the average across a number of signal distributions separately modeled for each signal loudness (orange; each normally distributed with mean = empirical d′ for that signal loudness, sigma = 1). We defined the ‘zero-bias point’ (Z) as the value for which the noise and composite signal distributions cross. The subject’s empirical ‘choice point’ was computed on the basis of the empirical d′ and a criterion for a given signal loudness (see 'Materials and methods'). The overall bias measure was then taken as the distance between the subject’s choice point and the zero-bias point. (C) RT distribution of the mouse (top) and human (bottom) go/no-go data sets. Green window, included RTs. The lower threshold was based on the group average latency of the peak in pupil slope timeseries plus a 50-ms buffer, which was used as a cut-off to exclude trials in order to control for a potential motor confound in our task-evoked pupil response measures (see 'Materials and methods'). (D) Relationship between mean RT or sensitivity (d′) and signal loudness in mice (top) and humans (bottom). ‘X’ symbols are predictions from the best-fitting variant of the drift diffusion model (see 'Materials and methods'); stats are from mixed linear modeling (see 'Materials and methods'). (E) Task-evoked pupil responses in mice (top) and humans (bottom) sorted into go and no-go choices (pooled across signal loudness). Difference was assessed using the paired-samples t-test. (F) Pupil response time courses in mice for three pupil-derivative-defined bins (pooled across signal loudness). (G) Relationship between perceptual choice bias (see 'Materials and methods') and task-evoked pupil response in mice (top) and humans (bottom). Here, choice bias was first computed as separate criteria for each signal loudness, and then averaged across loudness. ‘X’ markers are predictions from the best-fitting variant of the drift diffusion model (see 'Materials and methods'). (H) Left: trial-by-trail relationship between task-evoked pupil response and pre-trial baseline pupil size for one example mouse subject (top) and one example human (bottom) subject. Data points represent single trials. Right: correlation coefficient of the same relationship separately for each subject. Data points are single subjects; green dots represent significant correlations (p<0.05). All panels: group average (N = 5; N = 20); error bars or shading represent s.e.m.
Figure 2 with 1 supplement
Phasic arousal reduces both conservative and liberal choice biases.
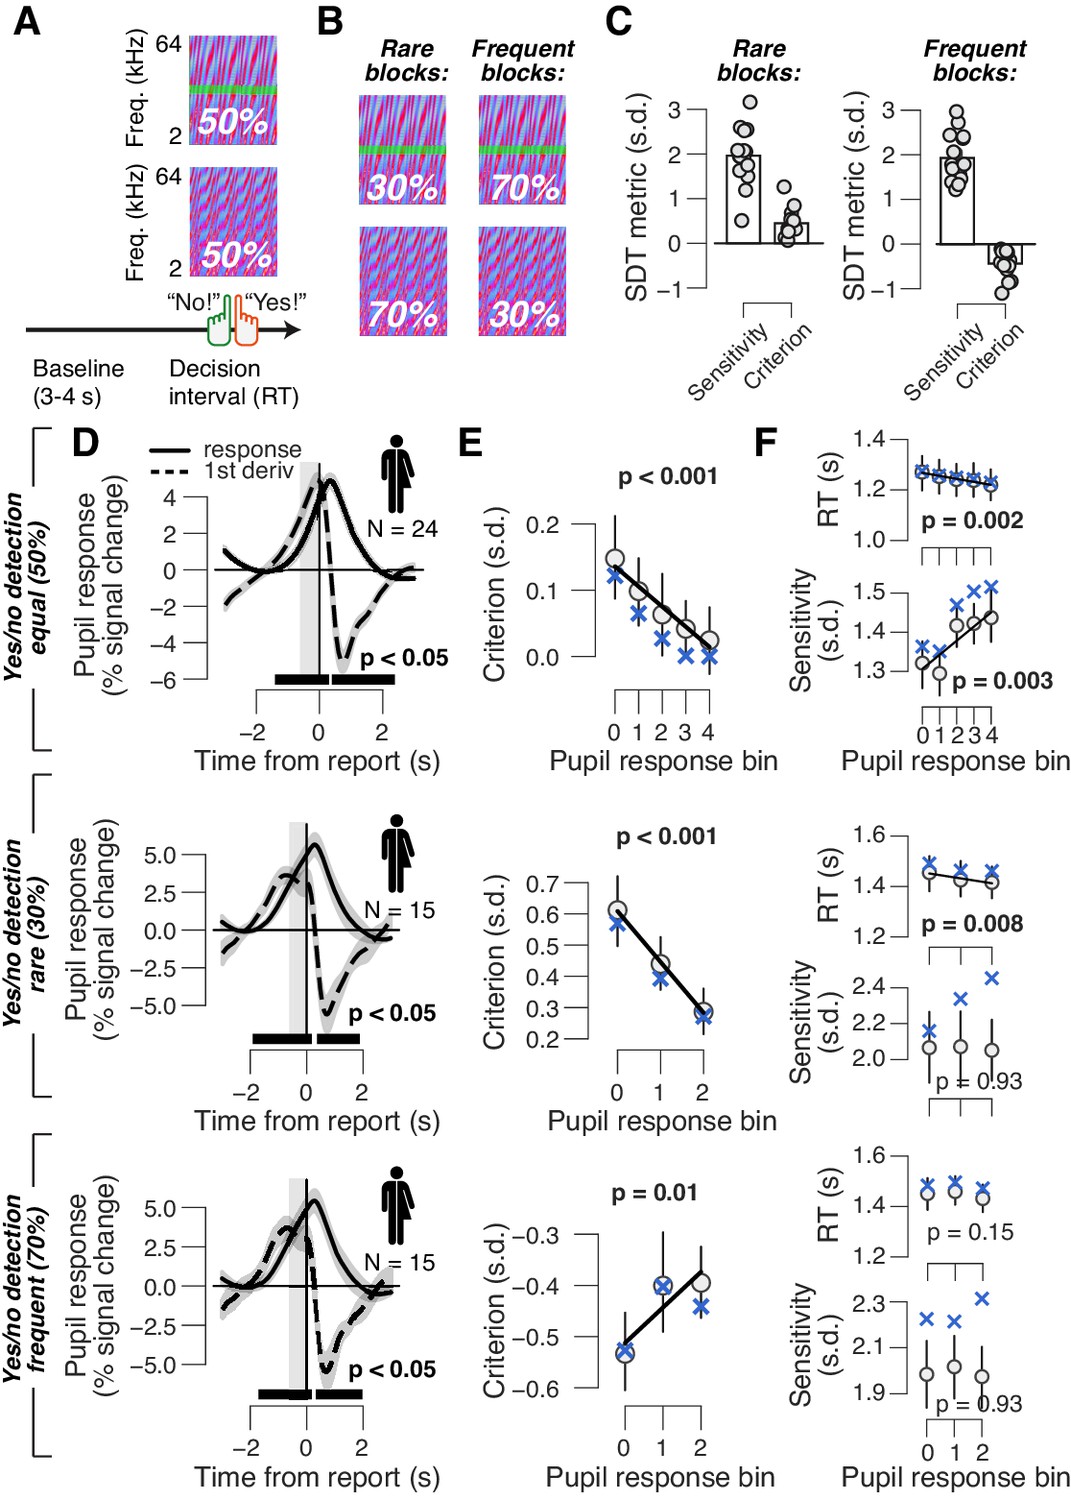
(A) Auditory yes/no (forced choice) tone-in-noise detection task. Schematic sequence of events during a trial. Subjects reported the presence or absence of a faint signal (pure tone; green band) embedded in noise (see 'Materials and methods'). (B) A separate batch of subjects performed the same task, but the signal now occurred in 30% of trials (‘rare’ condition) or in 70% trials (‘frequent’ condition). (C) Overall sensitivity and bias in rare and frequent conditions. (D) Task-evoked pupil response (solid line) and its derivative (dashed) in the equal (top), rare (middle) and frequent (bottom) signal occurrence conditions. Gray window, interval for extracting task-evoked pupil response measures; black bar, significant pupil derivative (p<0.05, cluster-corrected one-sample t-test). (E) Relationship between pupil response and choice bias in the equal (top), rare (middle) and frequent (bottom) signal occurrence conditions. For the biased signal occurrence conditions, we used three pupil-defined bins because there were fewer trials per individual (less than 500) than in the previous data sets (more than 500; see 'Materials and methods'). (F) As panel (E), but for mean RT and perceptual sensitivity. (D–F) Group average (N = 24; N = 15; N = 15); shading or error bars = s.e.m. Solid lines show linear or quadratic fits to binned data (linear fits are shown where first-order fit was superior to constant fit; quadratic fits are shown where second-order fit was superior to first-order fit). Blue ‘X’s, predictions from the ‘full’ drift diffusion model (see Figure 4 and associated text); p-values, mixed linear modeling.
Figure 2—figure supplement 1
Additional analyses of data from auditory yes/no detection tasks.
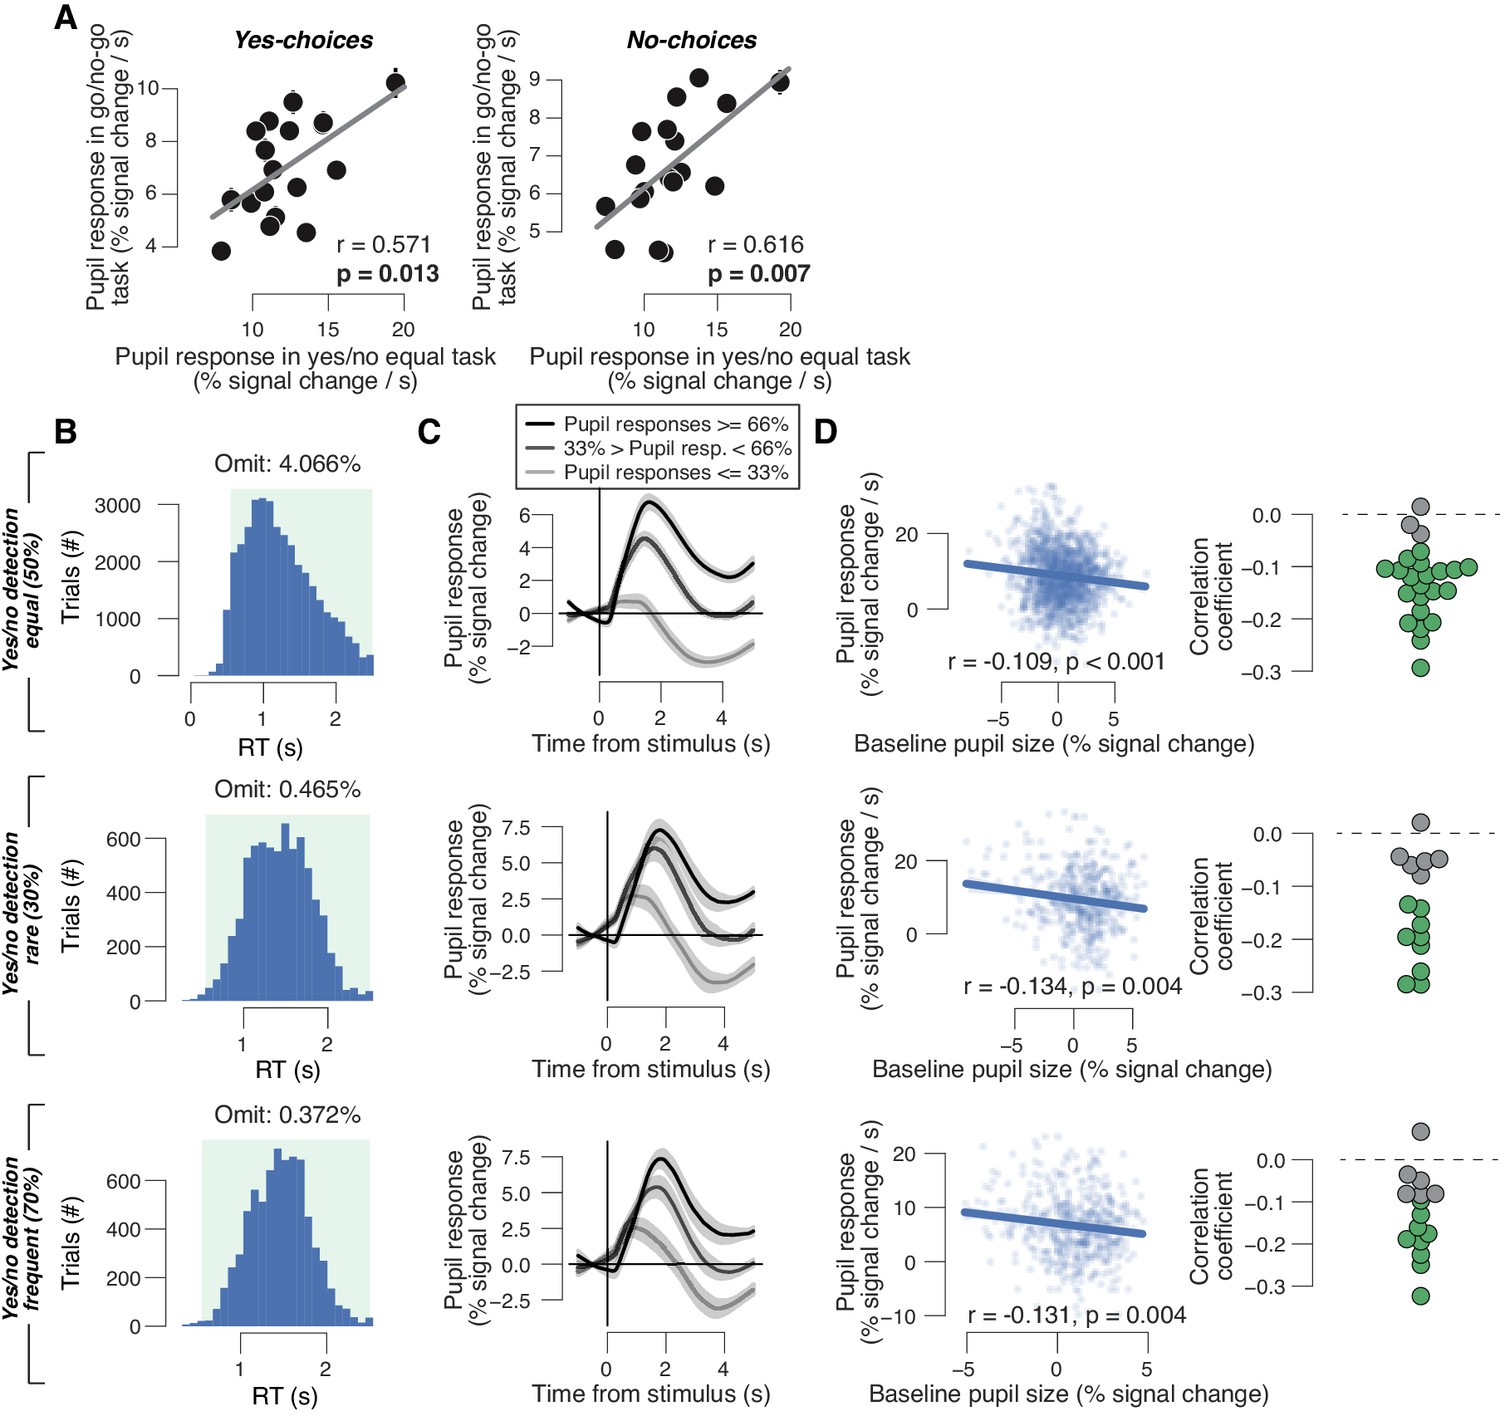
(A) Left: individual task-evoked pupil response for yes choices in the go/no-go task, plotted against individual pupil response for yes choices in the yes/no (forced choice) task. Data points are from individual subjects. Right: as left, but for no choices. Correlation was assessed by Pearson’s correlation coefficient. A leverage analysis verified that the reported correlations are not driven by outliers. (B) RT distributions in the equal (top), rare (middle) and frequent (bottom) signal occurrence conditions. Green window, included RTs (range, 0.5–2.5 s). (C) Pupil response time for three pupil-derivative-defined bins in the equal (top), rare (middle) and frequent (bottom) signal occurrence conditions. Group average (N = 24; N = 15; N = 15); shading shows s.e.m. (D) Left: trial-by-trail relationship between task-evoked pupil response and pre-trial baseline pupil size for example subjects in the equal (top), rare (middle) and frequent (bottom) signal occurrence conditions. Data points represent single trials. Right: correlation coefficient of the same relationship separately for each subject. Data points are single subjects; green dots highlight significant correlations (p<0.05).
Figure 3 with 1 supplement
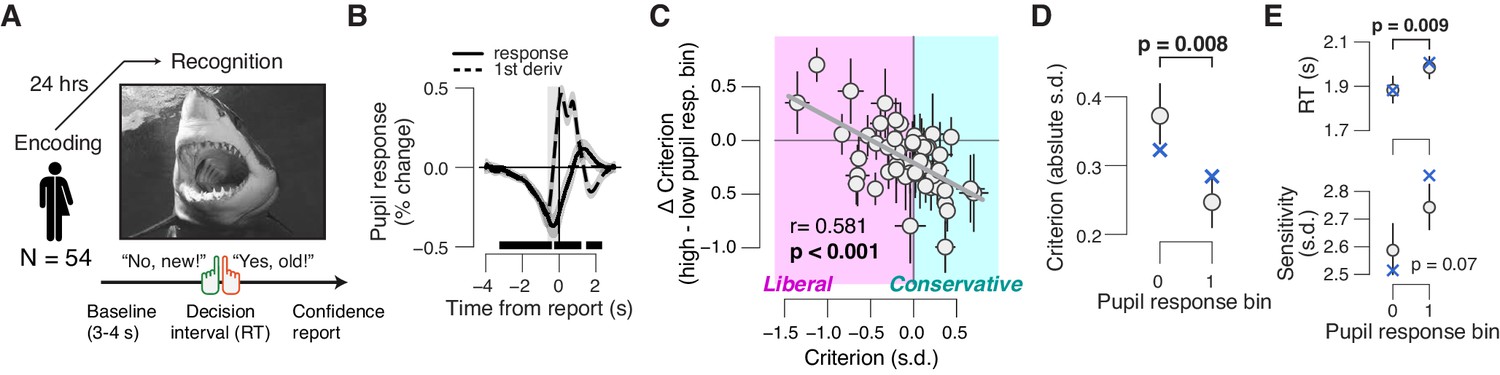
Phasic arousal tracks a reduction of memory biases.
(A) A yes/no (forced choice) picture recognition task. Schematic sequence of events during a trial. Subjects judged whether they had seen pictures 24 h previously during an encoding task (see 'Materials and methods'). (B) Task-evoked pupil response (solid line) and response derivative (dashed line). The gray window shows the interval for extracting task-evoked pupil response measures; the black bars indicate a significant pupil derivative (p<0.05, cluster-corrected one-sample t-test). (C) Individual pupil-linked shift in choice bias, plotted against individual’s overall choice bias. Data points are individual subjects. Correlation was assessed statistically by Pearson’s correlation coefficient. Error bars represent 60% confidence intervals (bootstrap). (D) Relationship between magnitude of choice bias (absolute value) and task-evoked pupil response. Difference was assessed using paired-samples t-test. (E) As panel (D), but for mean RT and perceptual sensitivity. In (B,D,E), data are shown as group averages (N = 54); shading or error bars represent the s.e.m. Blue ‘X’s show predictions from the ‘full’ drift diffusion model (see Figure 4 and associated text).
Figure 3—figure supplement 1
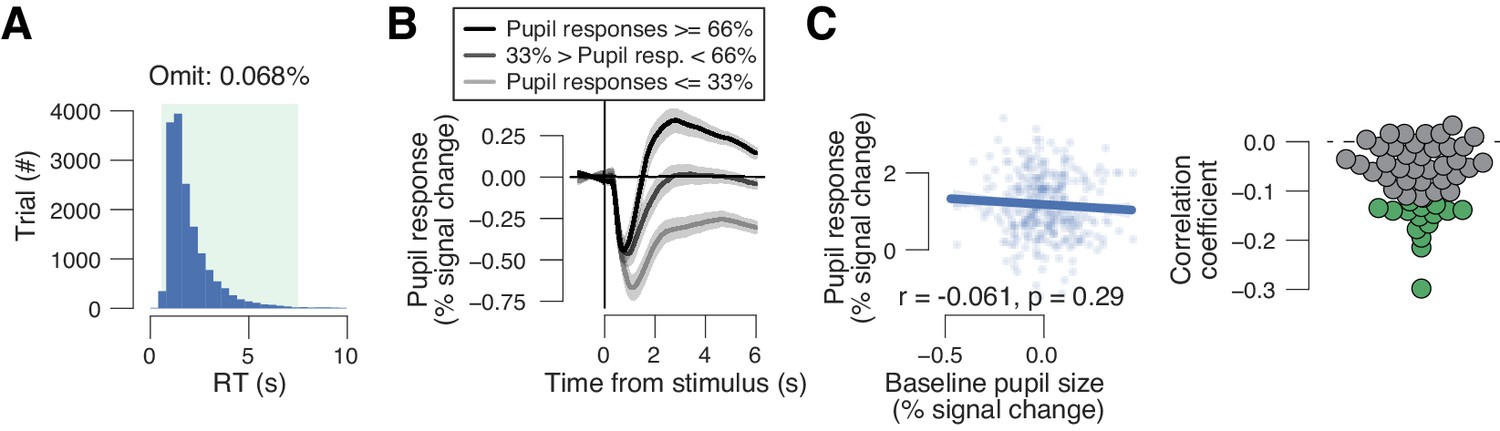
Additional analyses of data from yes/no picture recognition task.
(A) Group-wise RT distribution in the yes/no picture recognition experiment. Green window, included RTs (range, 0.5–7.5 s). (B) Pupil response time for three pupil derivative defined bins. Group average (N = 54); shading, s.e.m. (C) Left: trial-by-trail relationship between task-evoked pupil response and pre-trial baseline pupil size for one example subject. Data points represent single trials. Right: correlation coefficient of the same relationship separately for each subject. Data points are single subjects; green dots, significant correlations (p<0.05).
Figure 4 with 3 supplements
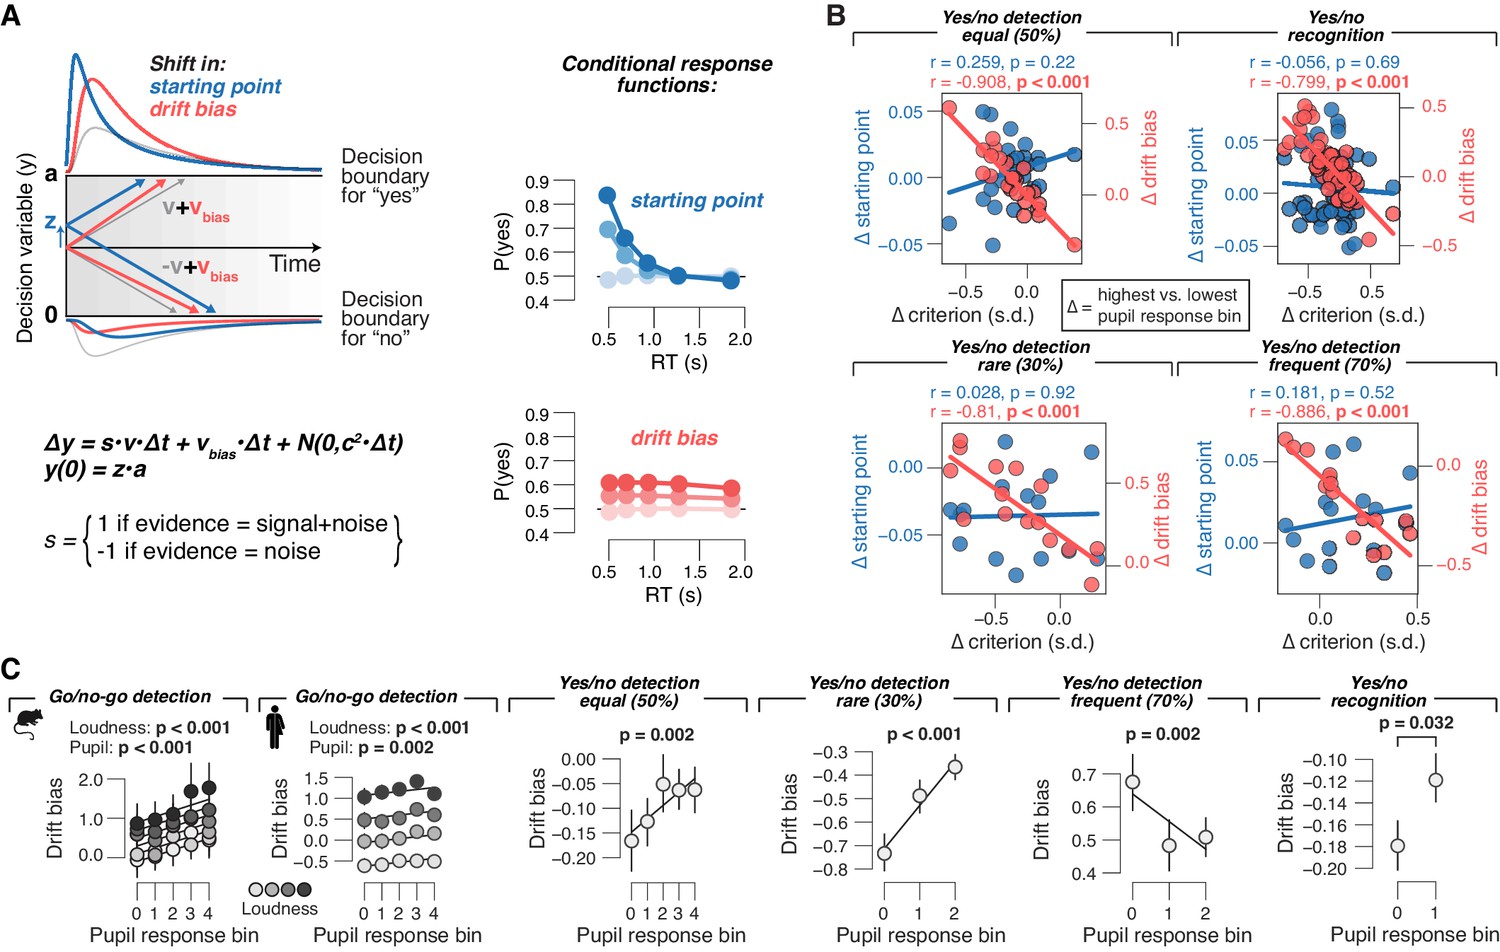
Phasic arousal tracks changes in evidence accumulation bias.
(A) Schematic of drift diffusion model accounting for choices, and their associated RTs. In the equation, v is the drift rate. Red and blue curves on the left show expected RT distributions under shifts in either the ‘starting point’ (z; blue) or ‘drift bias’ model (vbias; red). Conditional response functions (right) were generated by dividing synthetic RT distributions (see 'Materials and methods') into five quantiles and computing the fraction of yes choices (upper boundary choices) in each quantile. (B) Individual pupil-linked shift in starting point (blue) or drift bias (red), plotted against individual’s pupil-linked shift in choice bias. Data points are individual subjects. Pearson’s correlation coefficients are shown. (C) Relationship between drift bias and task-evoked pupil response, separately for each data set (left to right). In the picture recognition data set, drift bias estimates were sign-flipped for overall liberal subjects. Solid lines, linear or quadratic fits to binned data (linear fits are shown where first-order fit was superior to constant fit; quadratic fits are shown where second-order fit was superior to first-order fit; p-values were calculated using mixed linear modeling (predictors ‘loudness’ [signal loudness] and ‘pupil’ [pupil bin]), or paired-sample t-tests for the picture recognition data set. Group average (N = 5, N = 20, N = 24, N = 15, N = 15 and N = 54, respectively); error bars represent s.e.m.
Figure 4—figure supplement 1
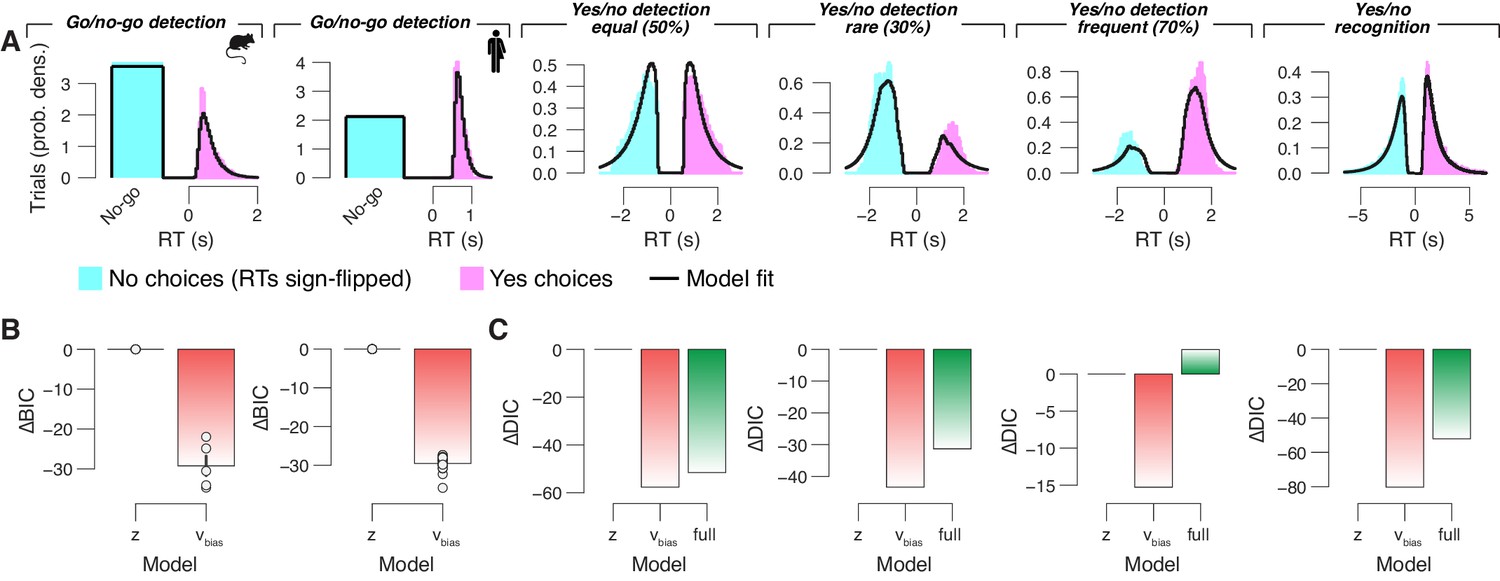
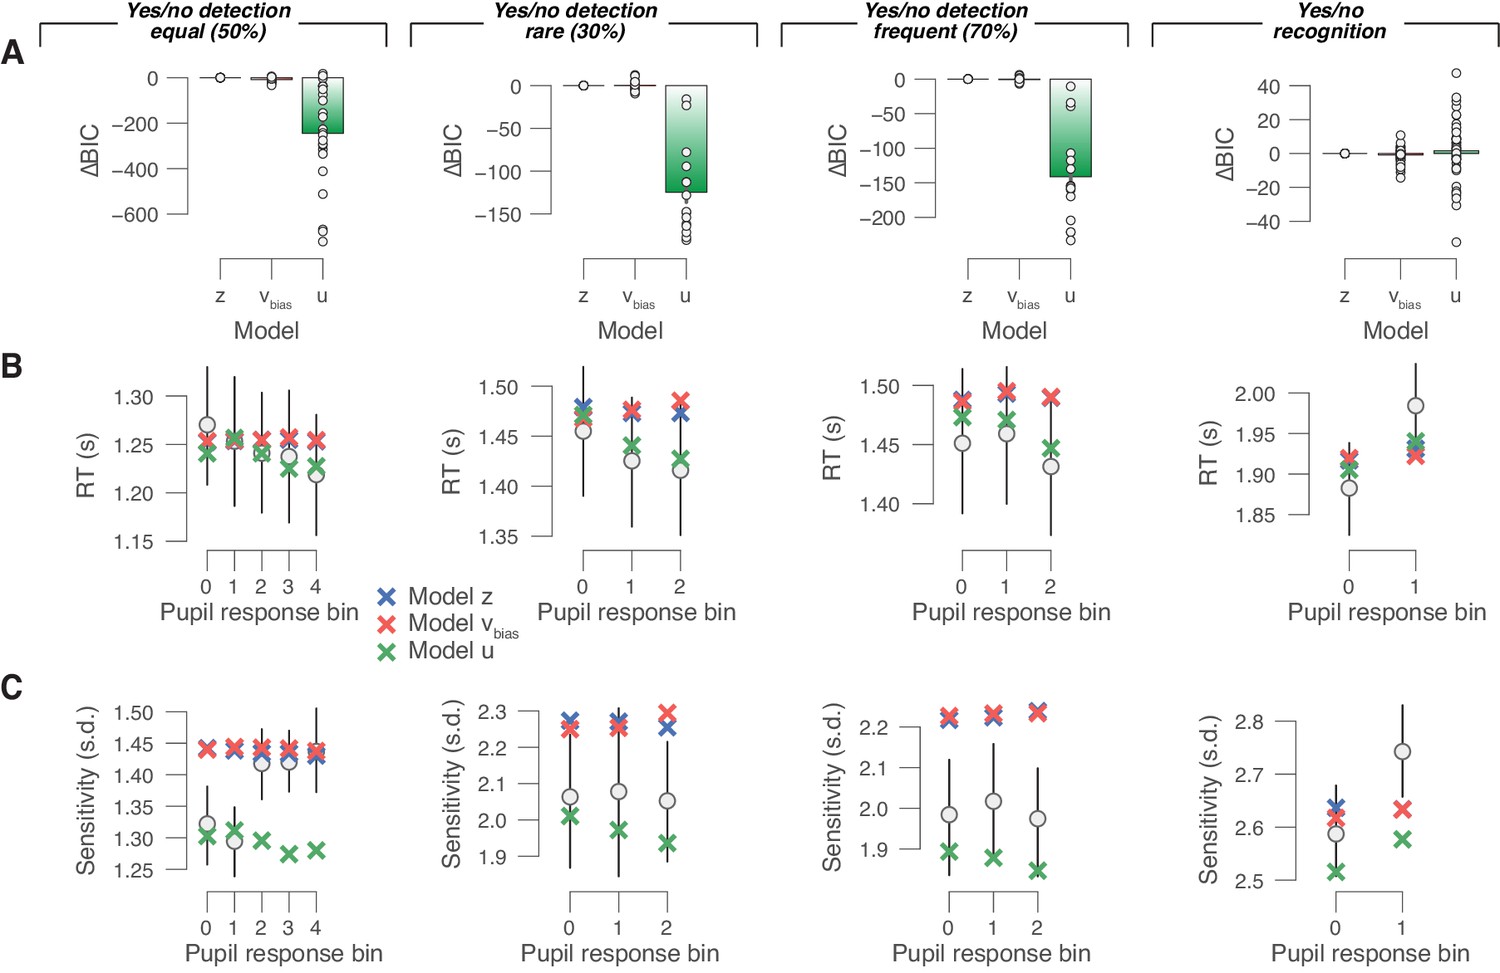
Drift diffusion model fit and comparisons.
(A) Group average RT distributions, separately for yes and no choices. Black lines show the ‘vanilla model’ fit (the boundary separation, drift rate, non-decision time, starting point and drift bias parameters were fixed across pupil bins). (B) For the go/no-go data sets, we compared the Bayesian Information Criterion (BIC; see 'Materials and methods') between: (i) the starting point model, with all parameters except drift varying with pupil bins; and (ii) the drift bias model, with all parameters except starting point varying with pupil bins. The BIC for the starting point model was used as a baseline for each dataset. Lower BIC values indicate a model that is better able to explain the data, taking into account the model complexity; a BIC of 10 is generally taken as a threshold for considering one model to be a sufficiently better fit. Data points are for individual subjects. (C) For each forced-choice yes/no data set (from left to right), we compared the Deviance Information Criterion (DIC; see 'Materials and methods') between the ‘full model’ (all parameters varying with pupil bins; see 'Materials and methods') and two alternative models: (i) the starting point model, with fixed drift bias, and starting point varying with pupil bins (otherwise identical to the full model); (ii) the drift bias model, with fixed starting point and drift bias varying with pupil bins (otherwise identical to the full model). The DIC for the starting point model was used as a baseline for each dataset. Lower DIC values indicate a model that is better able to explain the data, taking into account the model complexity; a DIC of 10 is generally taken as a threshold for considering one model to be a sufficiently better fit. The DIC is computed at the group-level, hence the absence of data points for individual subjects.
Figure 4—figure supplement 2
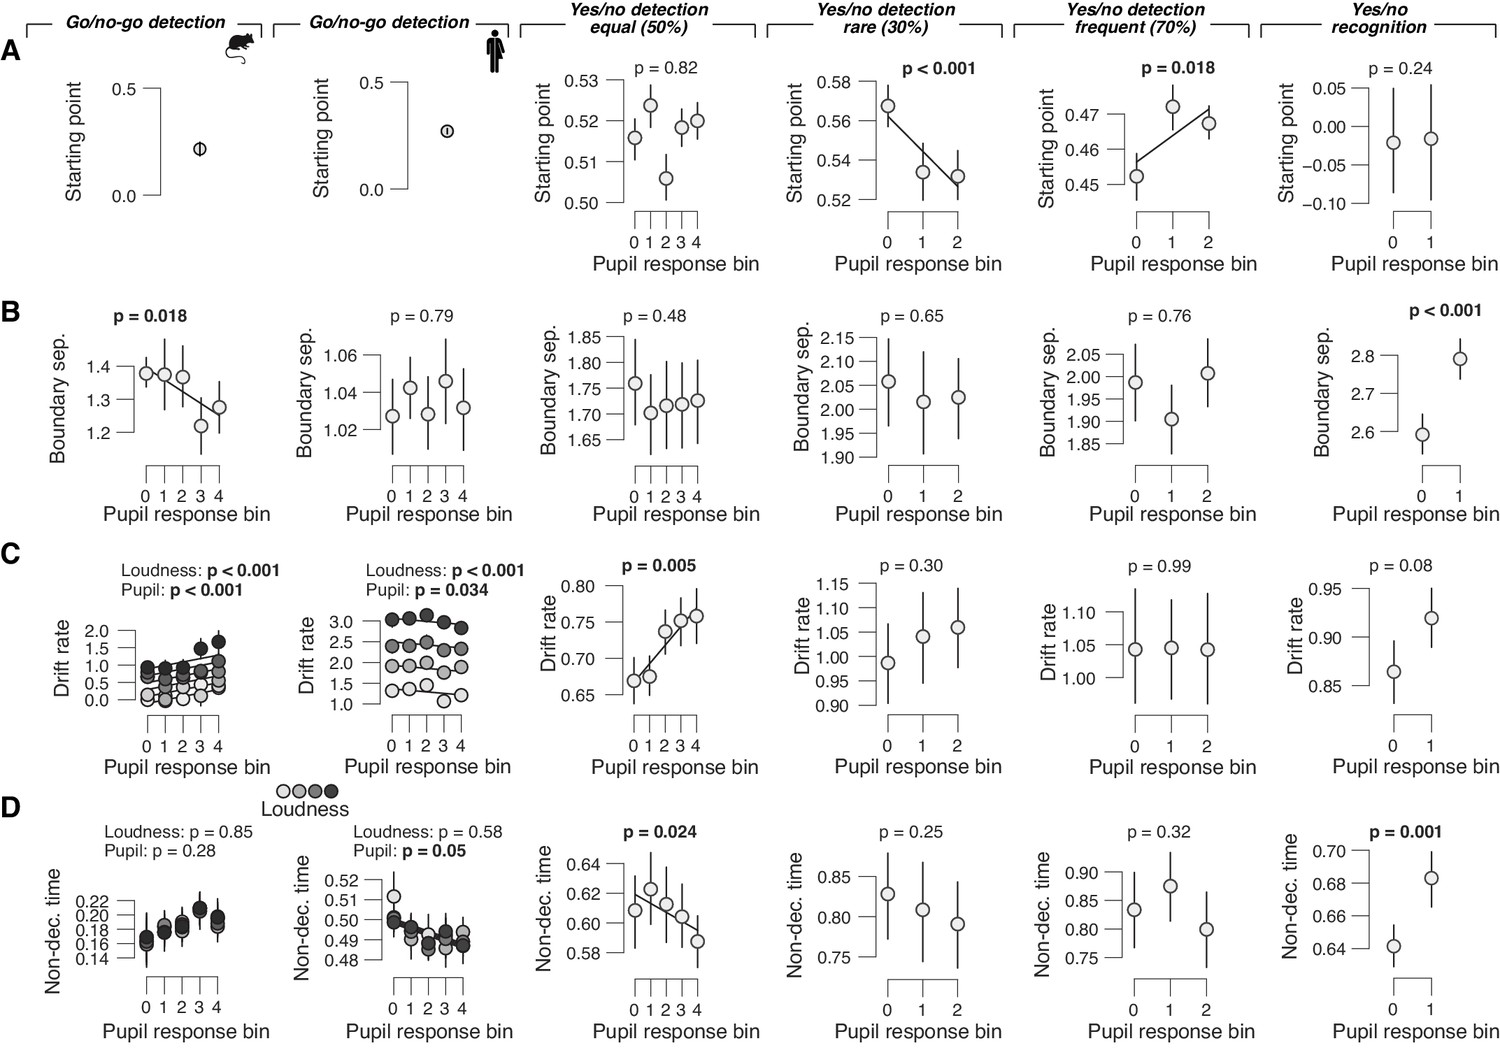
Remaining drift diffusion model parameters as function of pupil response bin.
(A) Relationship between starting point and task-evoked pupil response, separately for each data set (left to right). Group averages are shown (N = 5, N = 20, N = 24, N = 15, N = 15 and N = 54); error bars represent s.e.m. Solid lines are linear or quadratic fits to binned data (linear fits are shown where first-order fit was superior to constant fit; quadratic fits are shown where second-order fit was superior to first-order fit). p-values were obtained by mixed linear modeling (predictors ‘loudness’ [signal loudness] and ‘pupil’ [pupil bin]) or paired-sample t-tests for the picture recognition data set. (B) As panel (A), but for boundary separation. (C) As panel (A), but for drift rate. In the go/no-go data sets, drift rate additionally varied with signal loudness. (D) As panel (A), but for non-decision time. In the go/no-go data sets, non-decision time additionally varied with signal loudness.
Figure 4—figure supplement 3
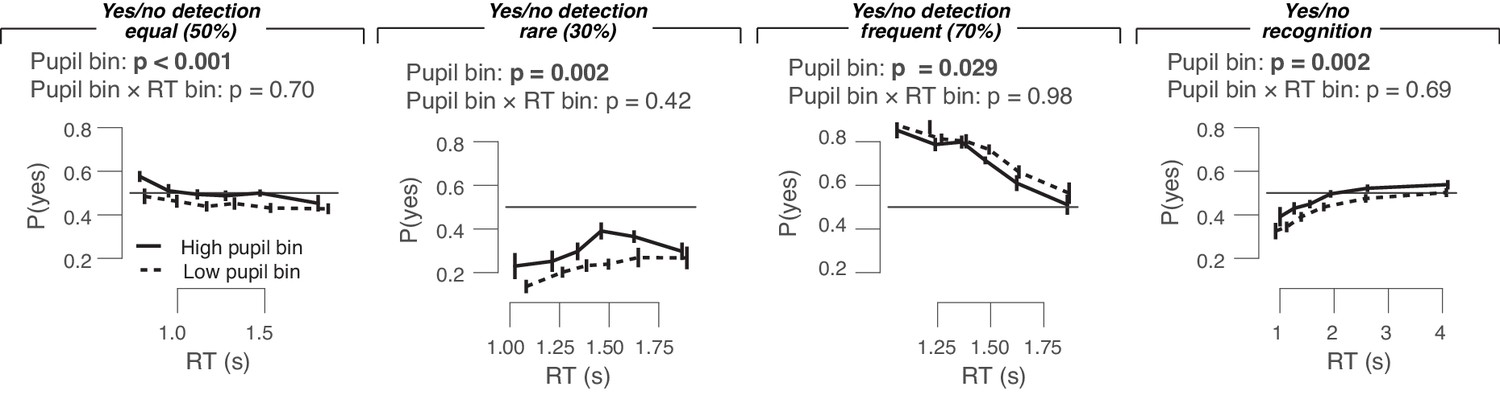
Empirical conditional response functions in the four yes/no data sets (left to right), separately for highest and lowest pupil bin.
Conditional response functions were generated by dividing RT distributions into five quantiles and computing the fraction of yes choices in each quantile. We could not perform the same analysis for the go/no-go data because of the absence of RTs for no-go trials. Repeated measures ANOVA was performed to test the effect of the pupil response bin and RT bin factors on the outcome variable fraction of yes choices .
Figure 5
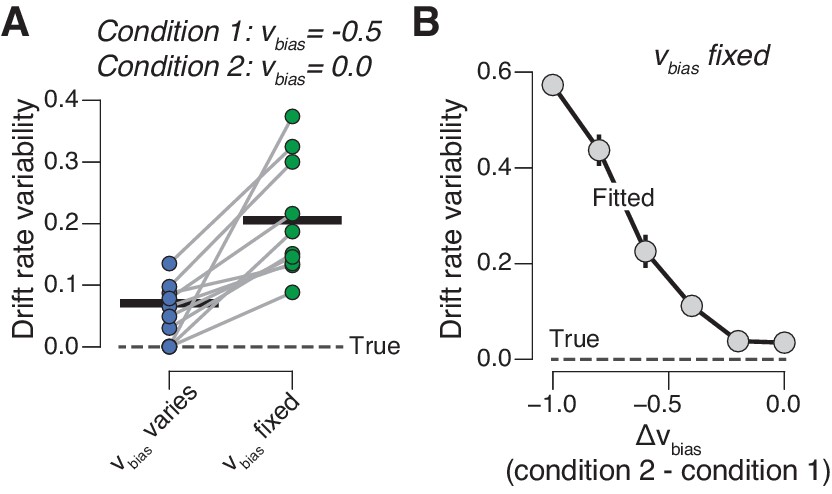
Untracked changes in drift bias account for drift rate variability.
(A) Recovered drift rate variability for models with fixed or varying drift bias. The model was fit to simulated RT distributions (N = 10) from two conditions that differed according to drift bias (see 'Materials and methods'). The dashed line represents true (simulated) drift rate variability. (B) Recovered drift rate variability for a model with fixed drift bias, for conditions that differed according to varying levels of drift bias (see 'Materials and methods').
Figure 6 with 1 supplement
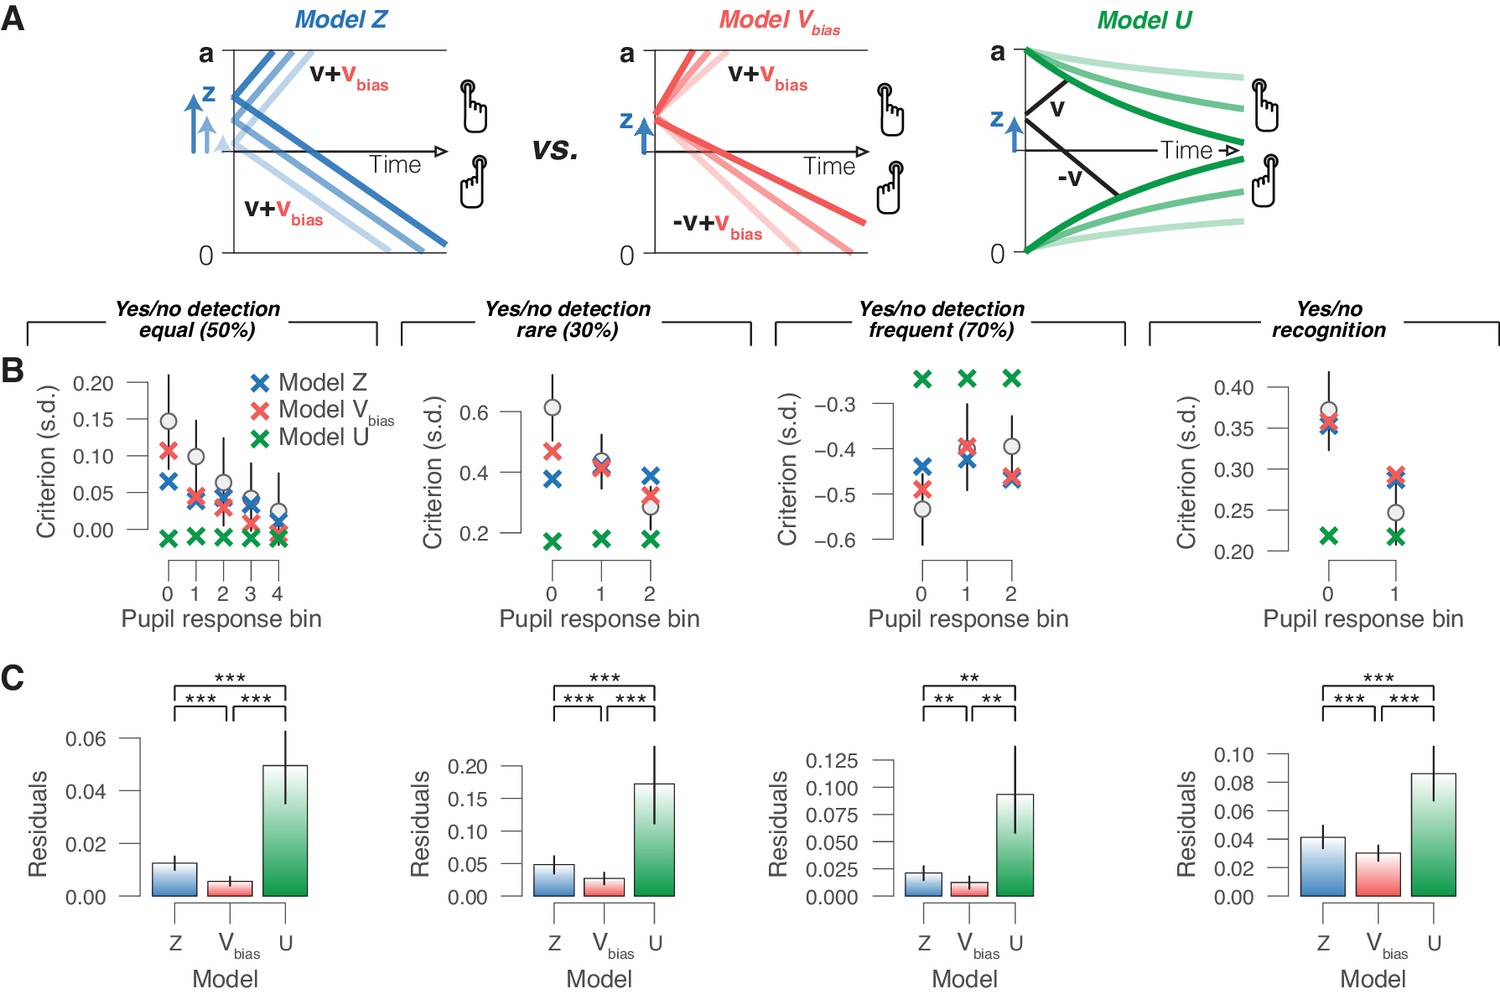
Phasic arousal reduces overt choice bias by reducing a bias in evidence accumulation.
(A) Schematic of three alternative models. (B) Relationship between choice bias and task-evoked pupil response, separately for each yes/no data set (left to right). ‘X’ symbols are predictions from the three alternative models in panel (A) (see 'Materials and methods'). (C) Residuals between empirical data and model predictions (see 'Materials and methods'). Statistical difference was assessed by paired-sample t-tests. In panels (B) and (C), data are group averages (N = 24, N = 15, N = 15 and N = 54); error bars are s.e.m.
Figure 6—figure supplement 1
Comparison between fits of models with or without varying urgency.
(A) For each forced-choice yes/no data set (from left to right), we compared the BIC values for three different models (see main text; see 'Materials and methods'). The BIC for the starting point model was used as a baseline for each dataset. Lower BIC values indicate a model that is better able to explain the data, taking into account the model complexity; a BIC of 10 is generally taken as a threshold for considering one model to be a sufficiently better fit. Data points are for individual subjects. The urgency model provided the best fit. We reasoned, however, that the best overall model in terms of BIC does not necessarily best explain the behavioral correlates of pupil-linked phasic arousal. To investigate this, we refitted the urgency model, and now let urgency vary with a number of randomly defined (within subject) bins. This ‘random’ urgency model again outperformed the starting point and drift bias models (all mean BIC across subjects < −10). This suggest that the urgency model’s goodness of fit is due to the powerful effect that the urgency has on the overall RT distribution (irrespective of pupil). Specifically, it can cut off the long tail in the RT distribution of the DDM, which agrees with the overall empirical RT distributions of the yes/no detection datasets (Figure 4—figure supplement 1A). Indeed, the urgency model did accurately predict mean RT and sensitivity in each pupil bin [panels (B) and (C)], which probably resulted in the best goodness of fit in terms of BIC. (B) Residuals between empirical mean RT and model predictions (see 'Materials and methods'). Statistical difference was assessed by paired-sample t-tests. (C) As panel (B), but for sensitivity (d′). For panels (A–C), the data shown are group averages (N = 24, N = 15, N = 15 and N = 54); error bars are s.e.m.
Author response image 1
Behavioral correlates of stimulus-locked pupil responses in yes/no tasks.
(A) Task-evoked pupil response (solid line) and response derivative (dashed line) aligned to stimulus onset in the yes/no detection datasets with equal, rare, and frequent signals and the yes/no recognition dataset, respectively. Grey window, interval for task-evoked pupil response measures (range, 0.23-0.5 s); black bar, significant pupil derivative; stats, cluster-corrected one-sample t-test. (B) Relationship between RT and task-evoked pupil response. Linear fits were plotted if first-order fit was superior to constant fit; quadratic fits were not superior to first-order fits. Stats, mixed linear modeling (detection data sets), or paired-samples t-test (recognition data set). (C) As B, but for perceptual sensitivity. (D) As B, but for choice bias. All panels: group average (N = 24; N = 15; N = 15; N = 54); shading or error bars, s.e.m.
Author response image 2
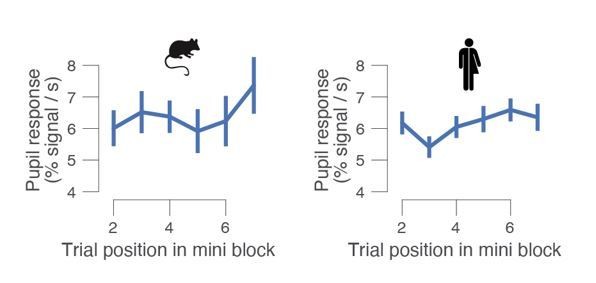
Task-evoked pupil response for mice (left) and human (right) subjects, separately for trial within a mini block.
In the mouse data set, pupil responses did not systematically vary with trial number within a mini block: one-way repeated measures ANOVA F5,20 = 2.177, p = 0.098. For humans, they did: one-way repeated measures ANOVA F5,95 = 3.638, p = 0.005. Group average (N = 5; N = 20); error bars, s.e.m.
Additional files
Download links
A two-part list of links to download the article, or parts of the article, in various formats.
Downloads (link to download the article as PDF)
Open citations (links to open the citations from this article in various online reference manager services)
Cite this article (links to download the citations from this article in formats compatible with various reference manager tools)
Pupil-linked phasic arousal predicts a reduction of choice bias across species and decision domains
eLife 9:e54014.
https://doi.org/10.7554/eLife.54014


