Trends in snakebite deaths in India from 2000 to 2019 in a nationally representative mortality study
- Wilson Suraweera

- David Warrell
- Romulus Whitaker
- Geetha Menon
- Rashmi Rodrigues
- Sze Hang Fu
- Kapila Piyasena
- Patrick Brown
- Prabhat Jha
- Centre for Global Health Research, Unity Health Toronto, and Dalla Lana School of Public Health, University of Toronto, Canada
- Nuffield Department of Clinical Medicine, University of Oxford, United Kingdom
- Centre for Herpetology/Madras Crocodile Bank, Vadanemmeli Village, India
- Indian Council of Medical Research, Ansari Nagar, India
- Department of Community Health, St. John's Medical College, St. John's National Academy of Health Sciences, India
- Department of Statistical Sciences, University of Toronto, Canada
Figures
Figure 1
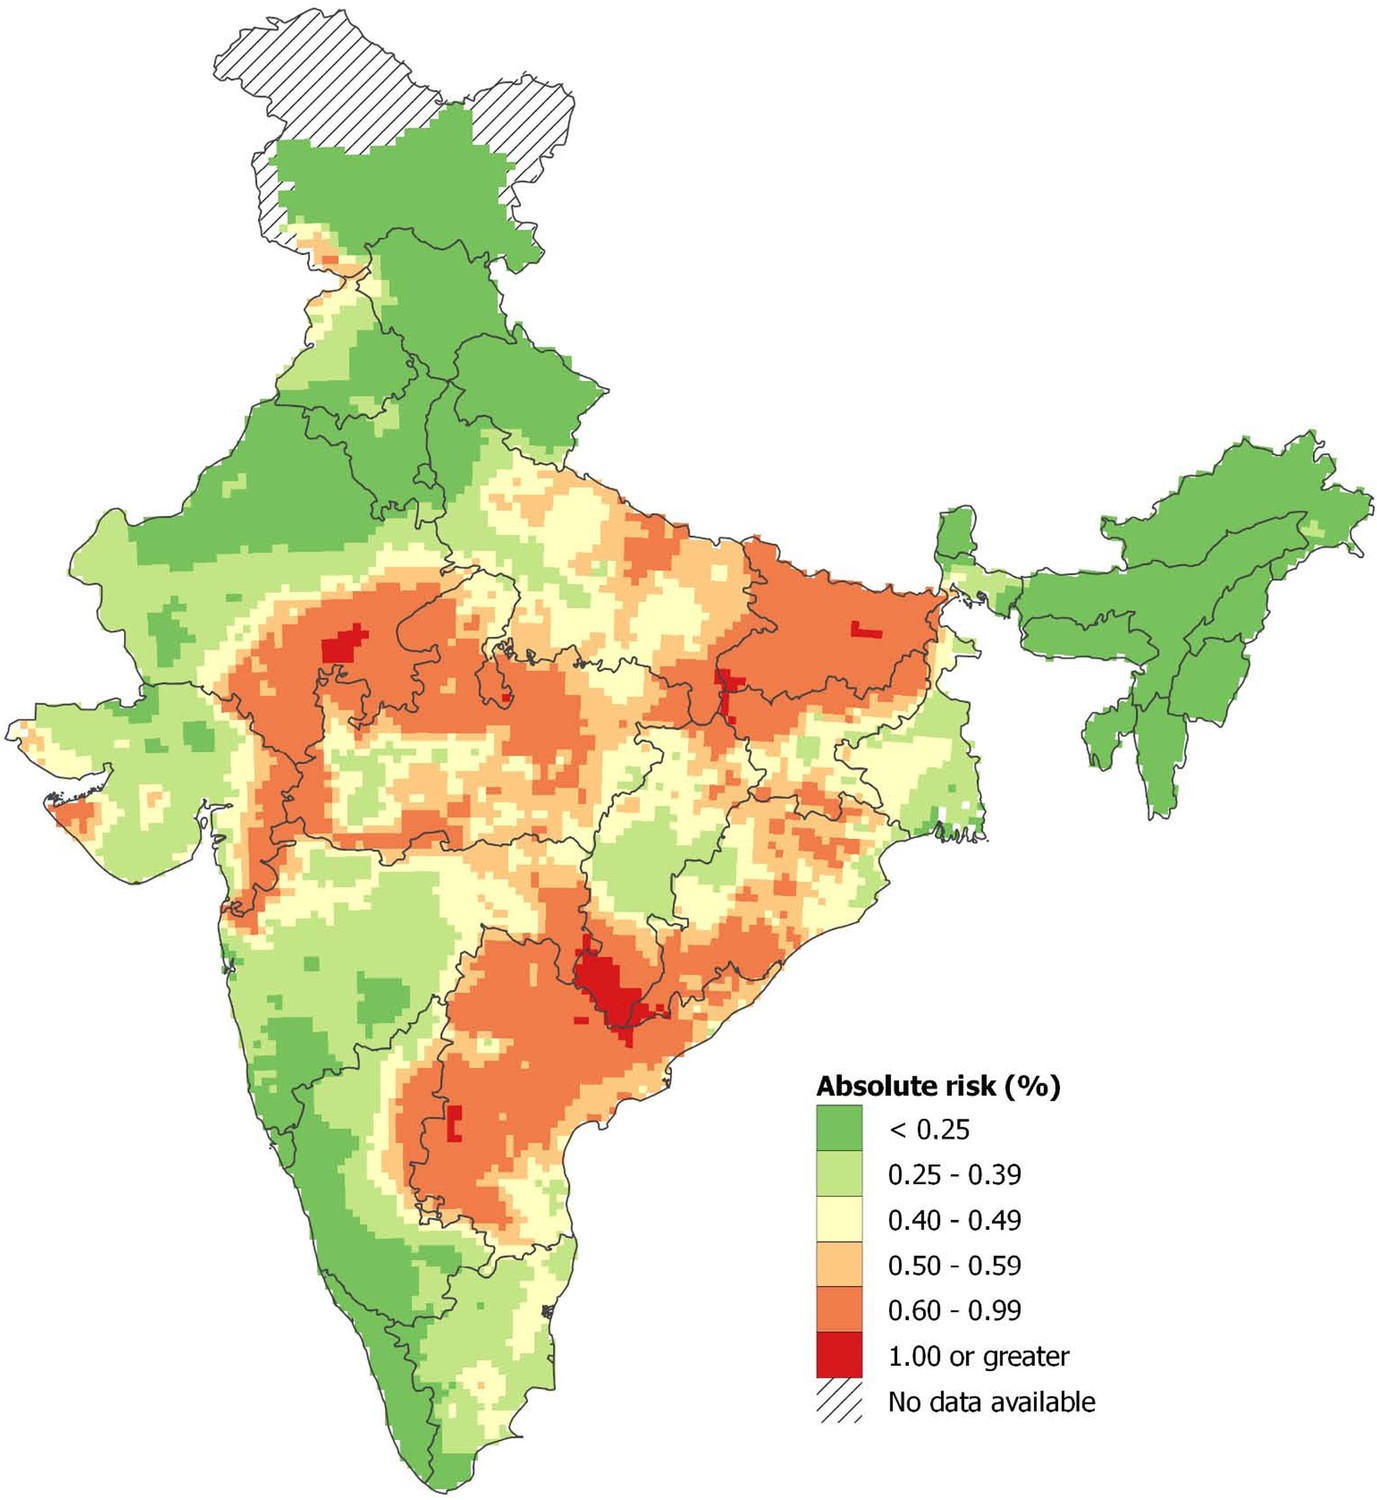
Spatial distribution of snakebite mortality risk in India for 2004-13.
Note: About 0.33% of the Indian population lived in areas with an absolute risk of 1% or greater of dying from snakebite before age 70 years, and 21% lived in areas with absolute risk of 0.6% or higher. Population estimates used the Gridded Population of the World version 4 for year 2015 (Center for International Earth Science Information Network - CIESIN - Columbia University, 2015). Further details of statistical method and stochastic uncertainties of spatial mortality risk pertaining to these estimates are explained in Appendix 3.
Figure 2
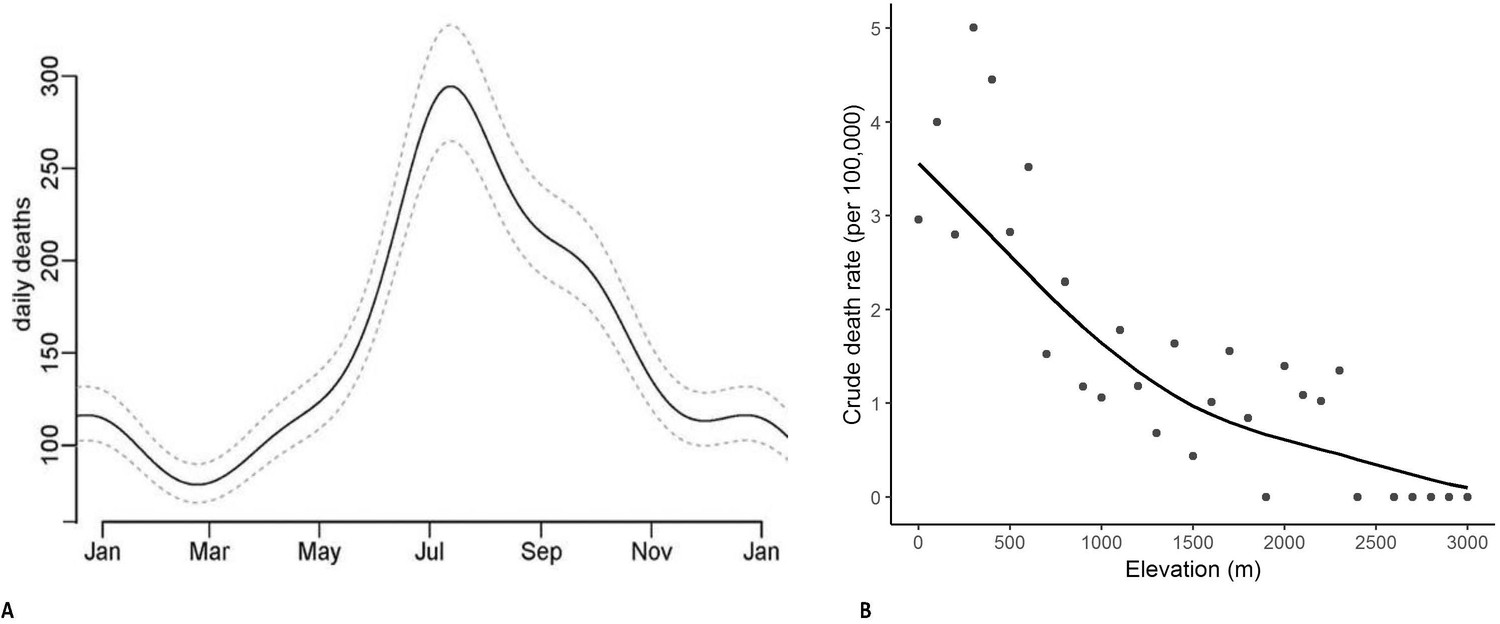
Predicted daily snakebite deaths from analysis of seasonality observed in 2001-2014 (Panel A) and snakebite crude death rates by altitude in meters in 2004-2013 (Panel B).
Notes: The daily snakebite totals are a composite of all study years from 2001 to 2014. The crude death rates by elevation use the RGI’s Sample Registration System population as denominators, and hence are generally lower than the overall rates we apply to the whole of India (using the United Nations death totals, which has the benefit of taking into account undercounts in the SRS data [Menon et al., 2019]). However, the relationship of crude death rates with elevation is unaffected by this procedure.
Figure 3
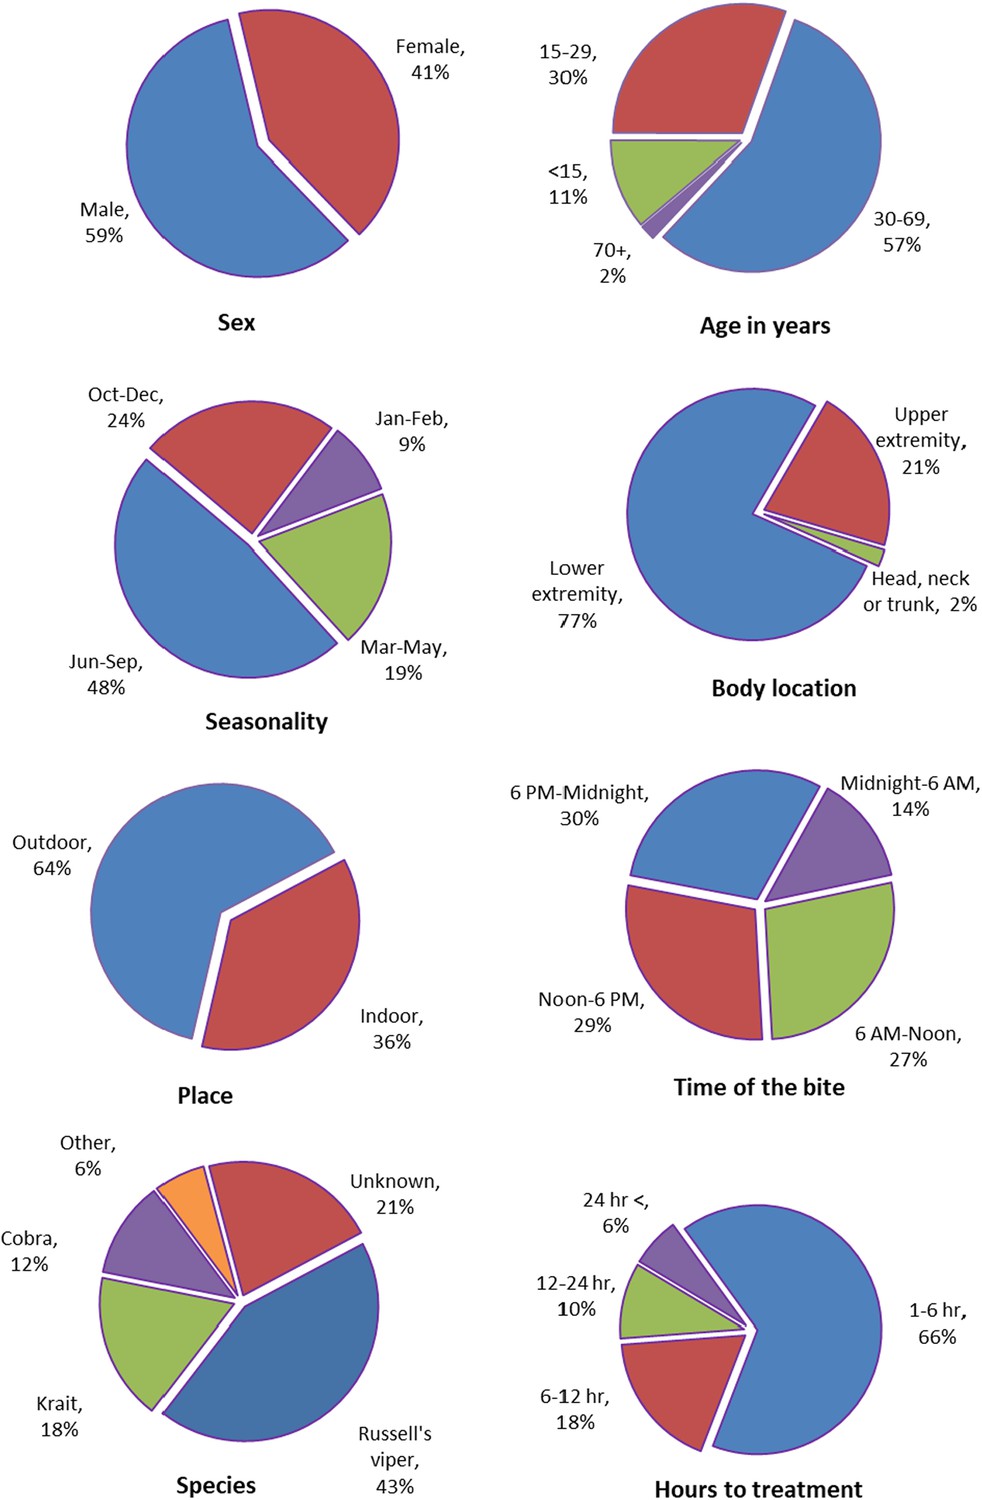
Characteristics of snakebites from analysis of 88,000 snakebite events in the published literature.
Appendix 1—figure 1
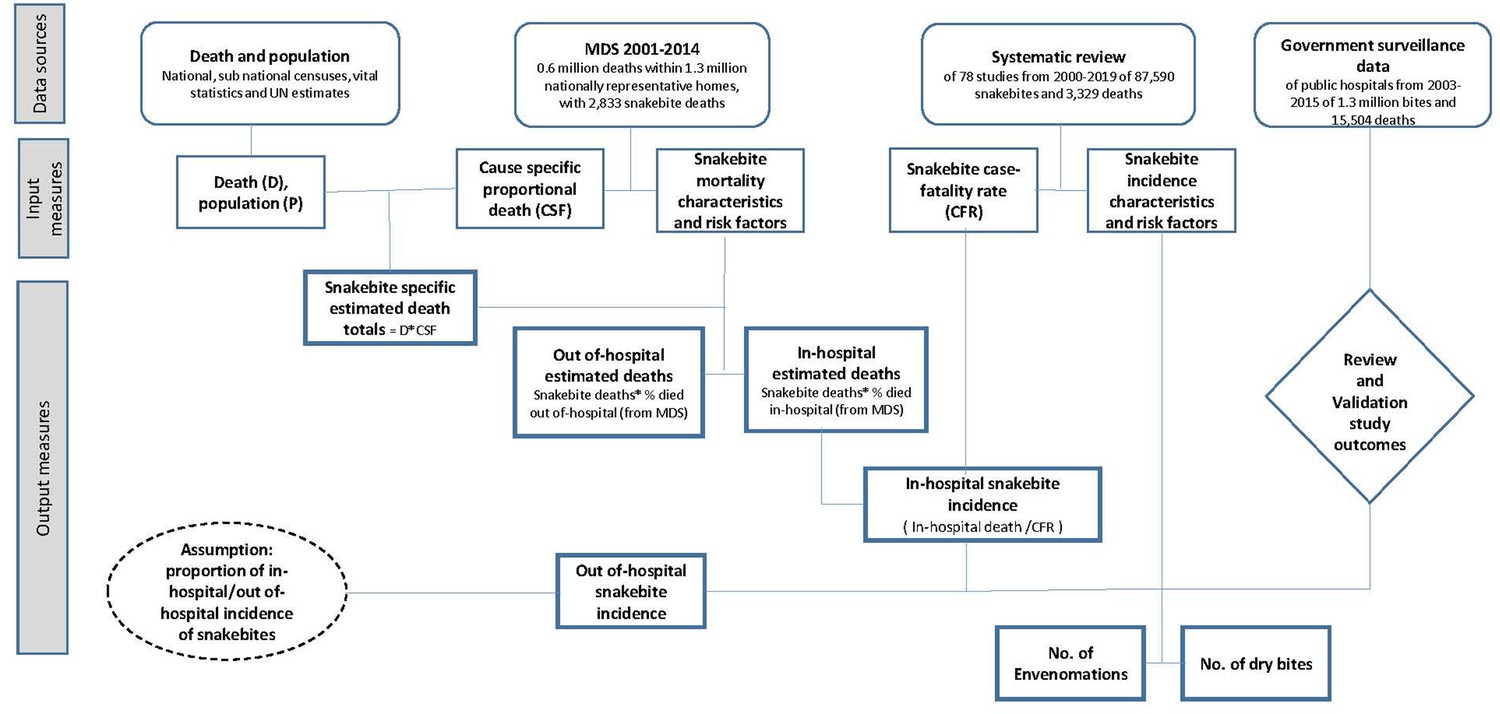
The conceptual overview of role of data sources, input measures and study outcomes.
Appendix 1—figure 2
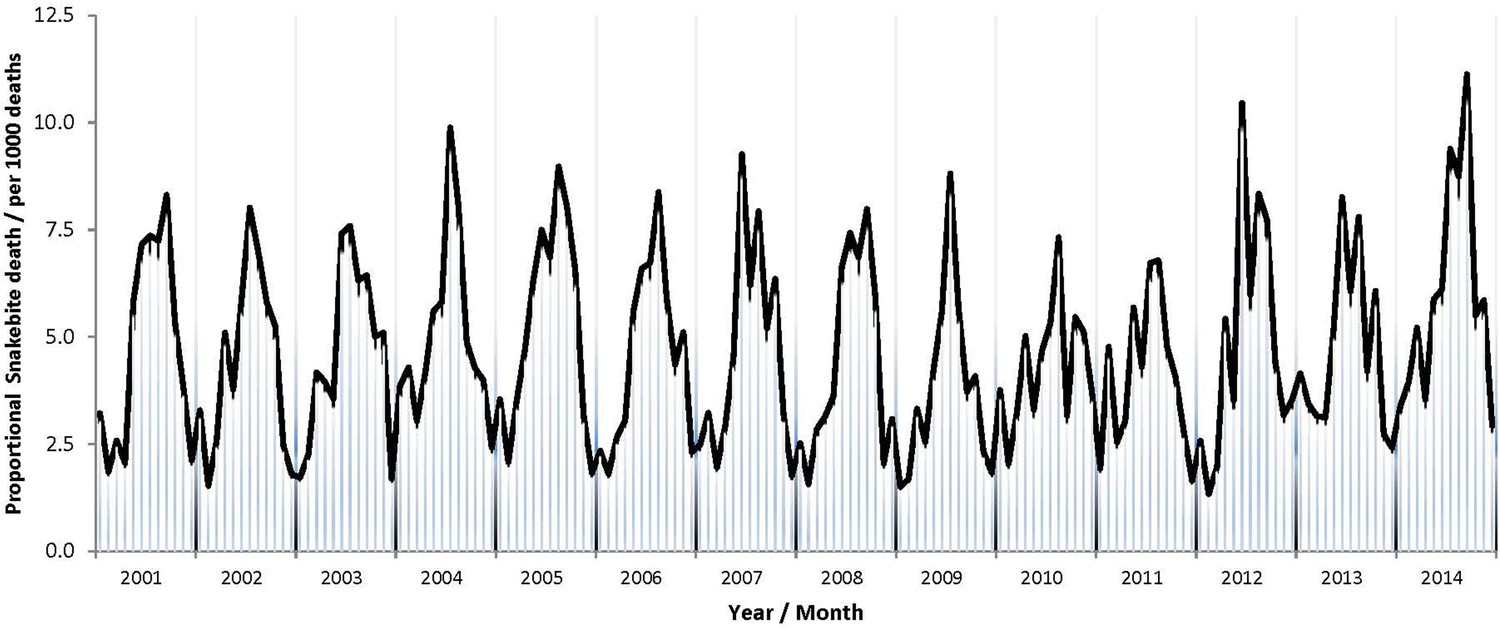
Observed seasonality of snakebite deaths in study data in 2001-2014.
Note: Proportional snakebite mortality (monthly snakebite deaths to all causes deaths) reported from the 2001 to 2014 rounds of RGI-MDS.
Appendix 2—figure 1
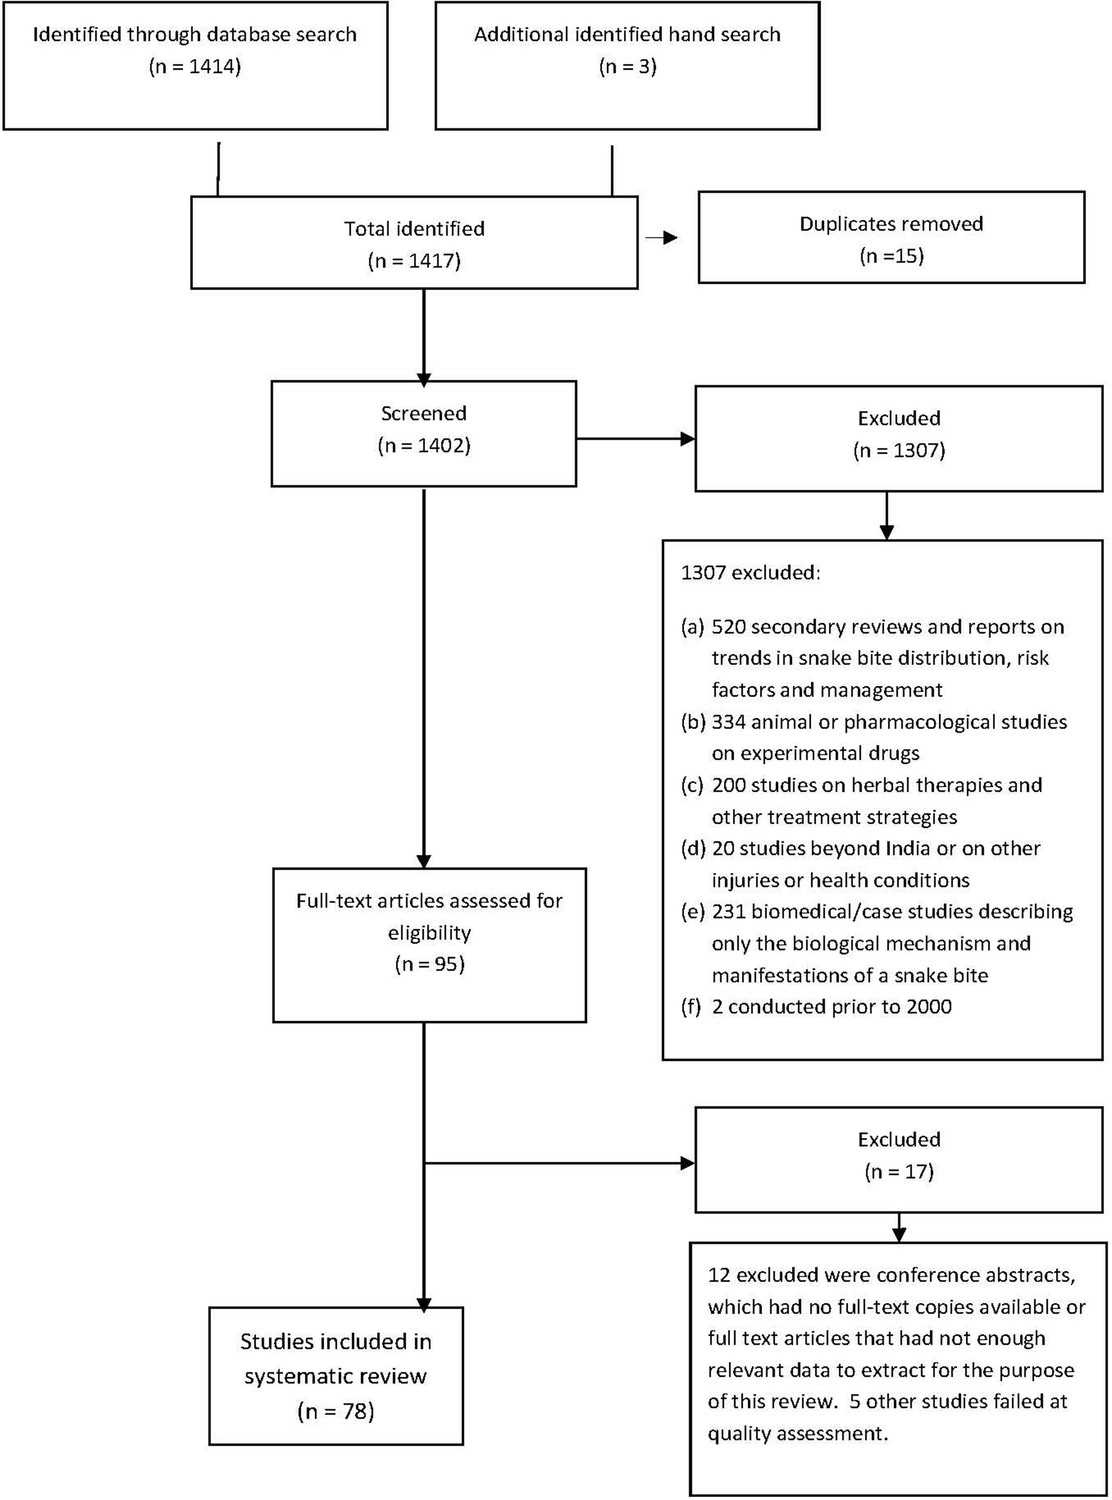
Study selection, inclusion and exclusion details.
Appendix 3—figure 1

Locations of geocoded sampling units from the Sample Registration System (SRS) in 2004–13, excluding sampling units for islands.
Appendix 3—figure 2
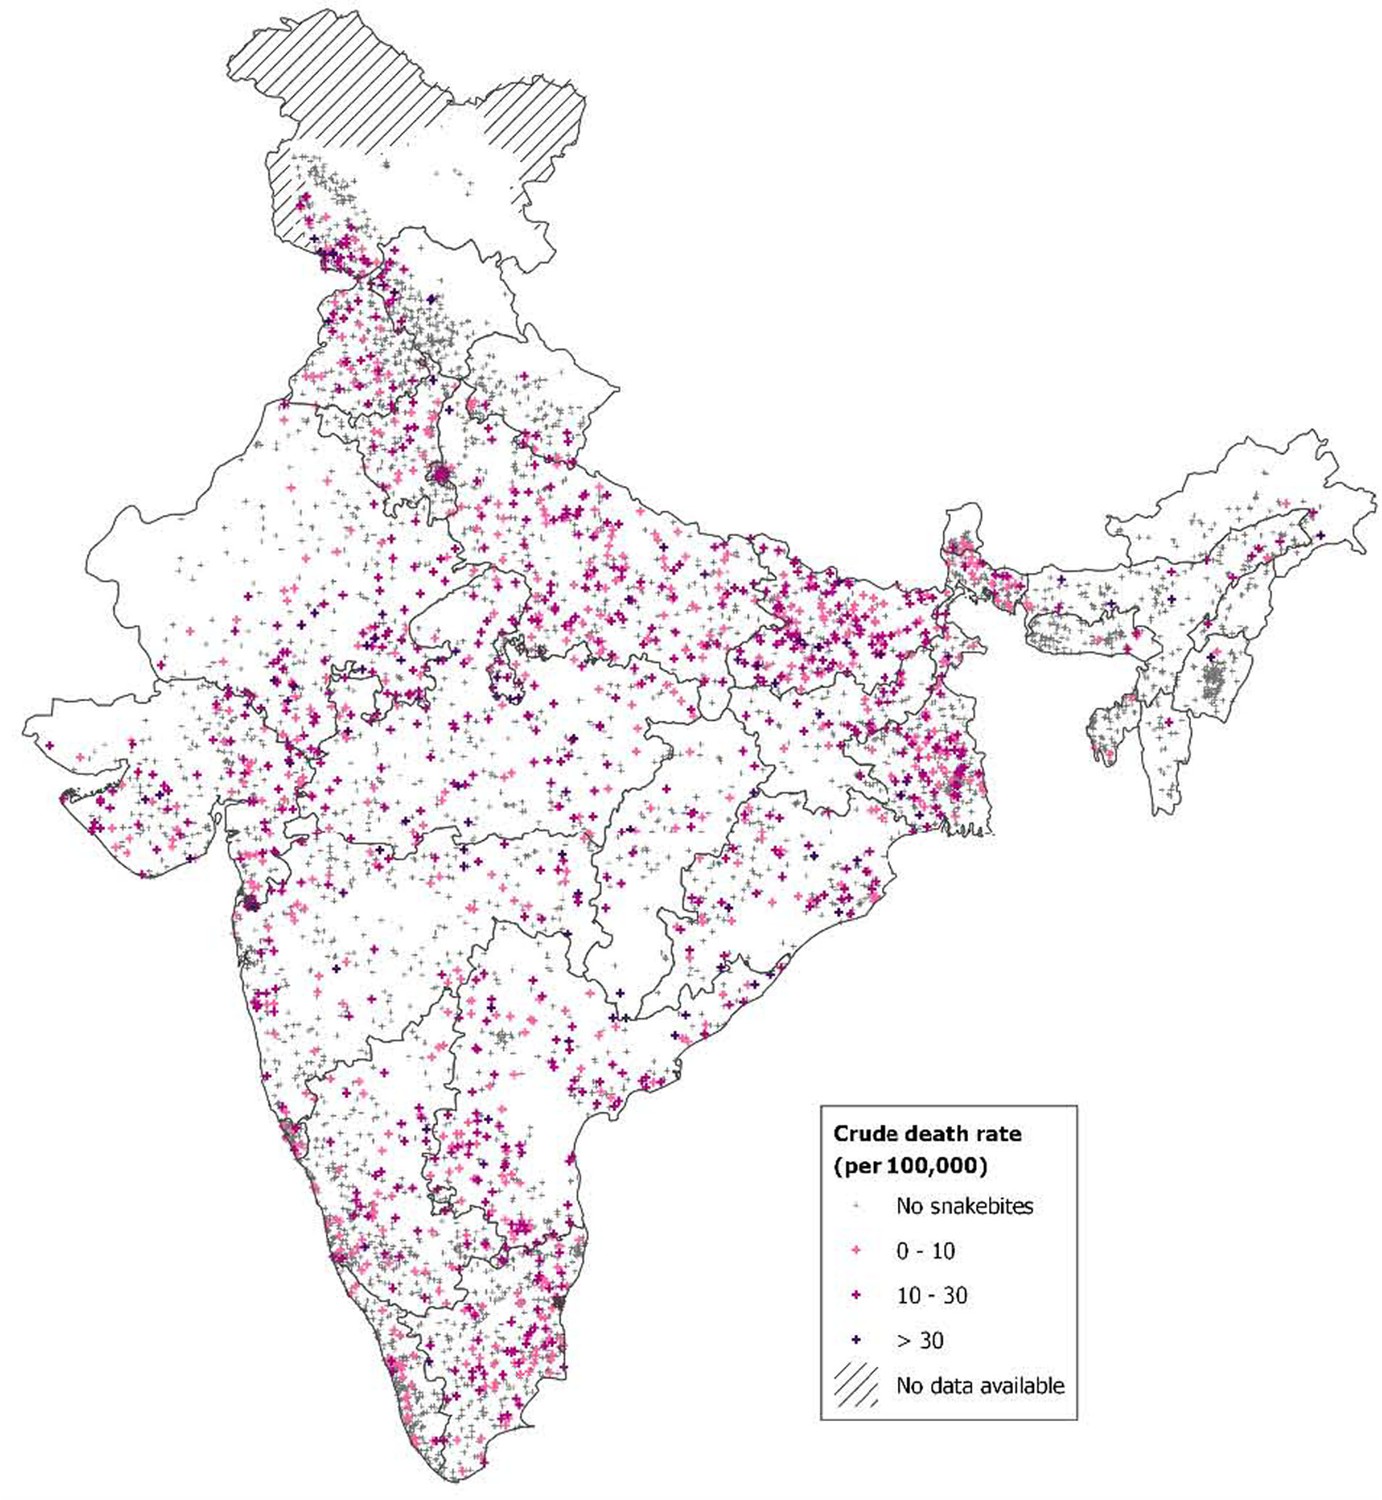
Snakebite crude rates in 2004–13.
Appendix 3—figure 3
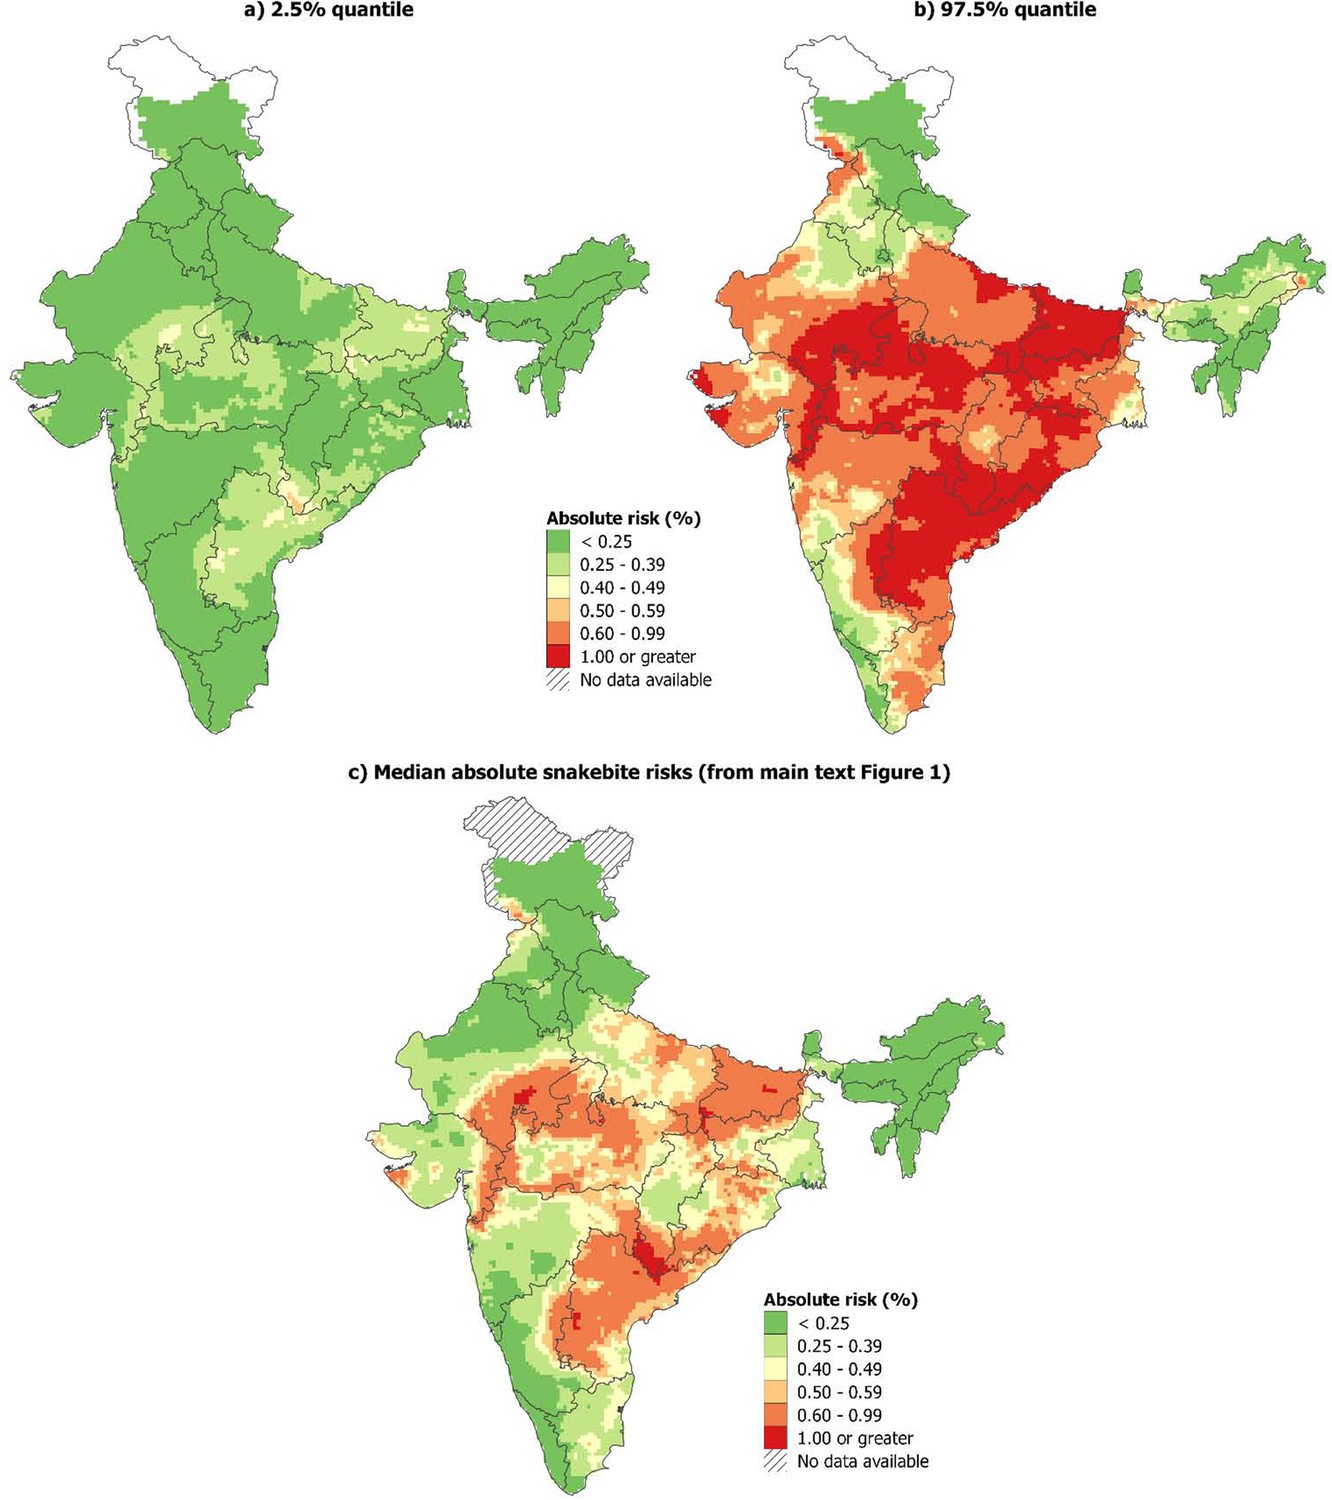
95% credible intervals of the absolute risks and median absolute risks of snakebite deaths in India, 2004-13.
(a-b) 95% credible interval of the absolute risk estimates, (c) median absolute snakebite risks (from main text Figure 1).
Appendix 3—figure 4

Non-linear effects of year estimated using second order random walk.
Tables
Table 1
Snakebite deaths in the Million Death Study, age-standardized and age-specific mortality rates and risks in India from 2001-2014.
| Year | Study deaths from snakebite/all causes | Standardized death rate /100,000 (all ages) and age-specific rates /100,000* | Snakebite mortality risk† | Estimated national deaths (000)‡ | |||
|---|---|---|---|---|---|---|---|
| All ages | 0-14 | 15-29 | 30-69 | ||||
| 2001 | 199 /41826 | 5.3 | 5.4 | 3.6 | 5.9 | 0.40% | 55.0 |
| 2002 | 183 /41740 | 5.2 | 5.2 | 3.5 | 5.8 | 0.39% | 55.3 |
| 2003 | 179 /38798 | 5.1 | 5.0 | 3.4 | 5.8 | 0.38% | 55.8 |
| 2004 | 190 /37380 | 5.0 | 4.6 | 3.5 | 5.7 | 0.38% | 55.6 |
| 2005 | 244 /46755 | 4.9 | 4.8 | 3.4 | 6.4 | 0.40% | 60.8 |
| 2006 | 214 /47471 | 5.3 | 4.7 | 3.2 | 6.7 | 0.40% | 62.7 |
| 2007 | 225 /48536 | 5.3 | 4.5 | 3.0 | 6.4 | 0.39% | 61.0 |
| 2008 | 215 /47673 | 5.1 | 4.2 | 2.8 | 5.9 | 0.36% | 57.4 |
| 2009 | 183 /47873 | 4.7 | 3.9 | 2.6 | 5.3 | 0.33% | 53.8 |
| 2010 | 200 /45719 | 4.3 | 3.9 | 2.6 | 5.0 | 0.32% | 52.4 |
| 2011 | 185 /46099 | 4.2 | 4.0 | 2.7 | 5.1 | 0.33% | 54.9 |
| 2012 | 227 /46635 | 4.3 | 4.3 | 2.8 | 5.4 | 0.36% | 59.2 |
| 2013 | 214 /45331 | 4.6 | 4.4 | 3.0 | 5.8 | 0.38% | 62.3 |
| 2014 | 175 /29647 | 4.7 | 4.2 | 3.0 | 5.9 | 0.37% | 61.2 |
| 2001-2014 | 2833 /611483 | 4.8 | 4.5 | 3.1 | 5.8 | 0.37% | 807.5 |
| Plausible range (Lower, Upper)§ | (4.4, 5.0) | (4.1, 4.7) | (2.8, 3.2) | (5.3, 6.0) | (0.34%, 0.38%) | (738.2, 833.4) | |
-
* Death rates were standardized to the Indian population in census year 2001 to take into account minor changes in the age distribution over time.
† The probability of dying due to snakebite before reaching age 70 years in the hypothetical absence of other competing causes of death. This was calculated by summing the 5-yearly standardized death rates from ages 0 to 69 years.
-
‡ Total death estimates at all ages were calculated by applying the MDS sample weighted proportion of deaths from snakebites, using weighted 3-yearly moving average, to the United Nations Population Division death totals.
§ Plausible ranges: The inherent variation in these estimates is not from the underlying demographic estimates but in the determination of primary causes of death. Therefore, we used plausible ranges based on independent cause assignment by two physicians and subsequent agreement on ICD-10 codes (X20 or X29). The lower bound was based on immediate agreement of both physicians and upper bound based on either of two physicians coding snakebite deaths.
Table 2
Estimated snakebite deaths in thousands by age and sex from 2000 to 2019 in India.
| Age range | Male (LL, UL) | Female (LL, UL) | Both (LL, UL) |
|---|---|---|---|
| 0-14 years | 149 (134, 154) | 176 (160, 180) | 325 (294, 334) |
| 15-29 years | 109 (102, 111) | 88 (82, 89) | 197 (184, 199) |
| 30-69 years | 290 (269, 303) | 253 (232, 260) | 543 (501, 564) |
| 70 years or above | 54 (45, 60) | 48 (44, 50) | 102 (89, 110) |
| All Ages | 602 (551, 626) | 565 (518, 578) | 1,167 (1068, 1204) |
-
Total deaths for 2001-2014 MDS study period were 807,500 (Table 1). Deaths for 2000-2019 were calculated by extrapolating these annual deaths. The extrapolated annual deaths in thousands for outside the study period were 54.0 for 2000, 62.3 for 2015, 62.0 for 2016, 61.4 for 2017, 60.3 for 2018 and 59.8 for 2019.
Lower limit (LL) and Upper limit (UL) are lower and upper uncertainty bounds for estimates. The major uncertainty in our analyses, however, is not the demographic totals, but the cause of death classification. Hence, the lower bound was based on immediate agreement of both physicians on the ICD-10 code for snakebite and upper bound based on either of two physicians coding as snakebite death.
Table 3
Snakebite death rates by state in India for 2001-2014.
| Study deaths in MDS | Annual average standardized death rate /100,000 | Estimated deaths for 2001-14 (000) | ||||||
|---|---|---|---|---|---|---|---|---|
| State | 2001-2004 | 2005-2009 | 2010-2014 | Trend | ||||
| Higher burden states | 1726 | 5.9 | 6.1 | 6.2 |  | 557.4 | ||
| Andhra Pradesh | 271 | 8.5 | 7.3 | 5.6 |  | 82.9 | ||
| Bihar | 321 | 5.6 | 7.6 | 8.9 |  | 101.9 | ||
| Odisha | 191 | 7.5 | 7.2 | 5.9 |  | 40.3 | ||
| Madhya Pradesh | 195 | 6.7 | 7.7 | 6.0 |  | 67.8 | ||
| Uttar Pradesh | 322 | 5.2 | 5.9 | 6.0 |  | 153.6 | ||
| Rajasthan | 192 | 4.9 | 6.7 | 5.0 |  | 52.1 | ||
| Gujarat | 176 | 4.1 | 4.8 | 5.1 |  | 38.8 | ||
| Jharkhand | 58 | 4.9 | 2.0 | 7.1 |  | 20.1 | ||
| Lower burden states | 1107 | 3.7 | 3.1 | 2.1 |  | 249.9 | ||
| Chhattisgarh | 42 | 6.0 | 6.5 | 2.5 |  | 16.8 | ||
| Jammu & Kashmir | 64 | 5.3 | 7.0 | 0.9 |  | 7.0 | ||
| Tamil Nadu | 176 | 6.1 | 3.4 | 3.0 |  | 42.1 | ||
| Karnataka | 137 | 5.6 | 3.3 | 2.9 |  | 33.0 | ||
| Maharashtra | 147 | 4.2 | 3.7 | 2.6 |  | 56.0 | ||
| West Bengal | 188 | 4.1 | 3.3 | 2.9 |  | 42.7 | ||
| Punjab | 67 | 2.9 | 3.1 | 4.0 |  | 14.5 | ||
| Haryana | 45 | 2.9 | 3.3 | 1.8 |  | 9.5 | ||
| Assam | 27 | 2.8 | 0.7 | 2.1 |  | 7.3 | ||
| Northeastern states | 37 | 2.3 | 0.9 | 0.7 |  | 2.4 | ||
| Kerala | 43 | 1.8 | 1.3 | 0.5 |  | 6.5 | ||
| All other states | 134 | 4.3 | 3.9 | 3.2 |  | 12.2 | ||
| All India | 2833 | 5.1 | 4.9 | 4.5 |  | 807.5 | ||
-
States are in descending order of annual average death rates for the study period of 2001-2014. We included only the states with populations over 10 million. Andhra Pradesh included Telangana. The Northeastern states include Arunachal Pradesh‚ Manipur‚ Meghalaya‚ Mizoram‚ Nagaland‚ Sikkim and Tripura.
Table 4
Government hospital reports of snakebites and deaths, compared to MDS death totals by state for 2003-2015.
| Government reporting* | MDS estimates | |||||
|---|---|---|---|---|---|---|
| State | No. of bites (000) | No. of deaths (000) | % died in hospital | Total no. of deaths (000) | No. died in hospital (000) | % Government coverage |
| (1) | (2) | (3) | (4) | (5) | (6)=(4)*(5) | (7)=(3)/(6) |
| Higher burden states† | 530.0 | 6.9 | 19% | 539.6 | 94.6 | 7% |
| Andhra Pradesh | 251.3 | 1.4 | 16% | 74.1 | 11.6 | 12% |
| Bihar | 20.9 | 0.1 | 16% | 105.4 | 17.0 | 1% |
| Odisha | 76.2 | 1.8 | 29% | 36.9 | 10.9 | 17% |
| Madhya Pradesh | 28.3 | 1.1 | 22% | 64.4 | 14.1 | 8% |
| Uttar Pradesh | 27.8 | 0.6 | 13% | 150.7 | 20.2 | 3% |
| Rajasthan | 71.3 | 1.0 | 16% | 49.6 | 7.8 | 13% |
| Gujarat | 45.7 | 0.8 | 27% | 38.6 | 10.5 | 7% |
| Jharkhand | 8.5 | 0.1 | 12% | 20.0 | 2.5 | 6% |
| Percentage to national | 41% | 45% | 71% | 61% | ||
| Lower burden states | 772.2 | 8.6 | 28% | 219.8 | 59.6 | 14% |
| Chhattisgarh | 16.7 | 0.3 | 17% | 14.3 | 2.4 | 13% |
| Jammu & Kashmir | 18.4 | 0.0 | 26% | 5.9 | 1.5 | 2% |
| Tamil Nadu | 106.6 | 0.5 | 28% | 36.0 | 10.0 | 5% |
| Karnataka | 89.2 | 1.6 | 21% | 28.1 | 6.0 | 26% |
| Maharashtra | 178.7 | 1.2 | 25% | 49.0 | 12.5 | 10% |
| West Bengal | 208.9 | 3.4 | 41% | 38.9 | 15.9 | 22% |
| Punjab | 9.1 | 0.2 | 10% | 14.2 | 1.4 | 13% |
| Haryana | 14.3 | 0.1 | 16% | 8.5 | 1.3 | 11% |
| Assam | 3.6 | 0.1 | 32% | 6.6 | 2.1 | 3% |
| Northeastern states | 11.1 | 0.1 | 25% | 1.8 | 0.4 | 11% |
| Kerala | 37.9 | 0.2 | 27% | 5.2 | 3.5 | 6% |
| All other states | 77.8 | 0.8 | 24% | 11.1 | 2.7 | 32% |
| Percentage to national | 59% | 55% | 29% | 39% | ||
| India | 1302.2 | 15.5 | 22% | 759.4 | 154.2 | 10% |
-
* Government statistics are as published by the Ministry of Health and Family Welfare, Government of India (Government of India, 2015).
† Higher burden states are those where the snakebite death rate at all ages is above 5/100,000 deaths for the entire study period of 2001-14 as listed in Table 3. In cases of number less than 100 deaths, they are listed as 0.0 in thousands.
Appendix 1—table 1
Snakebite deaths in the present study and mortality estimates by age and gender in 2000-2014.
| Age group/Year | 2001 | 2002 | 2003 | 2004 | 2005 | 2006 | 2007 | 2008 | 2009 | 2010 | 2011 | 2012 | 2013 | 2014 | 2001-14 |
|---|---|---|---|---|---|---|---|---|---|---|---|---|---|---|---|
| All ages | |||||||||||||||
| Study deaths* | |||||||||||||||
| Total | 199 | 183 | 179 | 190 | 244 | 214 | 225 | 215 | 183 | 200 | 185 | 227 | 214 | 175 | 2833 |
| Male | 120 | 106 | 103 | 110 | 130 | 123 | 115 | 119 | 92 | 115 | 98 | 130 | 113 | 105 | 1579 |
| Female | 79 | 77 | 76 | 80 | 114 | 91 | 110 | 96 | 91 | 85 | 87 | 97 | 101 | 70 | 1254 |
| Rural | 190 | 177 | 172 | 174 | 223 | 207 | 207 | 205 | 172 | 183 | 170 | 210 | 206 | 156 | 2652 |
| Urban | 9 | 6 | 7 | 16 | 21 | 7 | 18 | 10 | 11 | 17 | 15 | 17 | 8 | 19 | 181 |
| In hospital | 40 | 46 | 40 | 32 | 48 | 37 | 49 | 57 | 52 | 38 | 36 | 50 | 52 | 52 | 629 |
| Out of hospital | 159 | 137 | 139 | 158 | 196 | 177 | 176 | 158 | 131 | 162 | 149 | 177 | 162 | 123 | 2204 |
| Estimated deaths (000) † | |||||||||||||||
| Total | 55.0 | 55.3 | 55.8 | 55.6 | 60.8 | 62.7 | 61.0 | 57.4 | 53.8 | 52.4 | 54.9 | 59.2 | 62.3 | 61.2 | 807.5 |
| Male | 29.5 | 29.4 | 29.5 | 28.7 | 31.4 | 32.4 | 31.5 | 29.5 | 27.6 | 26.9 | 28.2 | 30.6 | 32.1 | 31.1 | 418.5 |
| Female | 25.5 | 25.9 | 26.3 | 26.9 | 29.4 | 30.3 | 29.5 | 27.9 | 26.2 | 25.6 | 26.6 | 28.6 | 30.2 | 30.1 | 389.0 |
| Standardized death rate ‡ | |||||||||||||||
| Male | 5.4 | 5.2 | 5.2 | 4.9 | 5.3 | 5.4 | 5.1 | 4.7 | 4.3 | 4.2 | 4.3 | 4.5 | 4.7 | 4.5 | 4.8 |
| Female | 4.9 | 4.9 | 4.9 | 4.9 | 5.2 | 5.3 | 5.0 | 4.7 | 4.3 | 4.2 | 4.4 | 4.6 | 4.9 | 4.8 | 4.8 |
| Probability of dying (%) § | |||||||||||||||
| Male | 0.40 | 0.40 | 0.39 | 0.37 | 0.41 | 0.42 | 0.40 | 0.36 | 0.33 | 0.31 | 0.32 | 0.34 | 0.36 | 0.35 | 0.37 |
| Female | 0.37 | 0.37 | 0.38 | 0.38 | 0.39 | 0.39 | 0.37 | 0.35 | 0.34 | 0.34 | 0.36 | 0.38 | 0.40 | 0.40 | 0.37 |
| Children age under 15 years | |||||||||||||||
| Study deaths | |||||||||||||||
| Male | 45 | 33 | 24 | 38 | 35 | 39 | 32 | 41 | 24 | 27 | 28 | 25 | 22 | 12 | 425 |
| Female | 29 | 20 | 15 | 30 | 40 | 27 | 33 | 25 | 26 | 29 | 25 | 31 | 28 | 14 | 372 |
| Estimated deaths (000) | |||||||||||||||
| Male | 10.8 | 10.4 | 10.0 | 8.7 | 9.2 | 9.3 | 9.1 | 8.5 | 7.8 | 7.3 | 7.0 | 6.7 | 6.3 | 5.4 | 116.4 |
| Female | 7.9 | 8.3 | 8.7 | 8.5 | 8.6 | 8.4 | 7.8 | 7.3 | 7.0 | 7.3 | 8.2 | 9.3 | 10.1 | 10.1 | 117.8 |
| Age-specific death rate | |||||||||||||||
| Male | 5.6 | 5.4 | 5.1 | 4.4 | 4.7 | 4.7 | 4.6 | 4.3 | 3.9 | 3.7 | 3.5 | 3.4 | 3.2 | 2.8 | 4.2 |
| Female | 4.5 | 4.7 | 5.0 | 4.8 | 4.9 | 4.7 | 4.4 | 4.1 | 3.9 | 4.1 | 4.6 | 5.3 | 5.8 | 5.8 | 4.8 |
| Ages 15-29 years | |||||||||||||||
| Study deaths | |||||||||||||||
| Male | 22 | 30 | 28 | 31 | 32 | 22 | 26 | 20 | 17 | 26 | 23 | 30 | 32 | 18 | 357 |
| Female | 19 | 24 | 19 | 10 | 22 | 19 | 21 | 18 | 21 | 18 | 20 | 21 | 19 | 12 | 263 |
| Estimated deaths (000) | |||||||||||||||
| Male | 5.6 | 5.7 | 5.7 | 6.0 | 6.2 | 5.9 | 5.3 | 4.6 | 4.0 | 3.9 | 4.5 | 5.4 | 6.3 | 6.5 | 75.5 |
| Female | 4.8 | 4.8 | 4.8 | 5.1 | 4.6 | 4.4 | 4.4 | 4.6 | 4.8 | 4.9 | 4.8 | 4.5 | 4.1 | 3.8 | 64.4 |
| Age-specific death rate | |||||||||||||||
| Male | 3.7 | 3.6 | 3.6 | 3.7 | 3.7 | 3.5 | 3.1 | 2.6 | 2.3 | 2.2 | 2.5 | 3.0 | 3.4 | 3.6 | 3.2 |
| Female | 3.4 | 3.3 | 3.3 | 3.4 | 3.0 | 2.8 | 2.8 | 2.9 | 3.0 | 3.0 | 2.9 | 2.7 | 2.5 | 2.3 | 2.9 |
| Ages 30-69 years | |||||||||||||||
| Study deaths | |||||||||||||||
| Male | 49 | 38 | 45 | 38 | 56 | 55 | 54 | 48 | 44 | 46 | 40 | 65 | 53 | 65 | 696 |
| Female | 28 | 32 | 35 | 35 | 40 | 39 | 51 | 47 | 37 | 34 | 35 | 39 | 49 | 35 | 536 |
| Estimated deaths (000) | |||||||||||||||
| Male | 11.6 | 11.8 | 12.0 | 12.0 | 14.3 | 15.4 | 15.2 | 14.2 | 13.1 | 12.5 | 13.1 | 14.6 | 16.2 | 17.0 | 193.0 |
| Female | 10.7 | 10.9 | 11.1 | 11.4 | 12.8 | 13.5 | 13.2 | 12.4 | 11.6 | 11.3 | 11.8 | 12.8 | 13.8 | 14.0 | 171.2 |
| Age-specific death rate | |||||||||||||||
| Male | 6.0 | 5.9 | 5.9 | 5.7 | 6.6 | 7.0 | 6.7 | 6.1 | 5.5 | 5.1 | 5.3 | 5.7 | 6.1 | 6.3 | 6.0 |
| Female | 5.8 | 5.7 | 5.7 | 5.6 | 6.2 | 6.4 | 6.1 | 5.6 | 5.1 | 4.8 | 4.9 | 5.2 | 5.4 | 5.4 | 5.6 |
| Age 70 years or above) ¶ | |||||||||||||||
| Study deaths | |||||||||||||||
| Male | 4 | 5 | 6 | 3 | 7 | 7 | 3 | 10 | 7 | 16 | 7 | 10 | 6 | 10 | 101 |
| Female | 3 | 1 | 7 | 5 | 12 | 6 | 5 | 6 | 7 | 4 | 7 | 6 | 5 | 9 | 83 |
-
Notes:
* Study deaths were from 2001 to 2014 MDS study rounds.
-
† Estimated deaths were adjusted to United Nations Population Prospects estimated India deaths (United Nations, 2019).
‡ Annual death rates per 100,000 were standardized to 2001 census year population.
-
§ The probability of dying from snakebite before age 70 years in the hypothetical absence of other causes.
¶ Annual deaths above age 70 years were too few to quantify for death rates or totals, but total death estimates for the whole study period in thousands were 33.5 for males and 35.6 for females.
Appendix 1—table 2
Expected snakebite prevalence in 2015.
| In- hospital case-fatality rate/100 bites | Out-of-hospital to in-hospital hypothetical ratio K = I(h')/I(h) | Hypothetical % who sought hospital treatment 1/(k+1) | Expected no. of snakebites in 000 | No. of envenomations in 000 | No. of dry bites in 000 | ||
|---|---|---|---|---|---|---|---|
| In-hospital | Out-of- hospital | Total | |||||
| (1) | (2) | (3) | (4) | (5) | (6) | (7) | (8) |
| 3.2 | 1.5 | 40% | 442.2 | 663.4 | 1,105.6 | 773.9 | 331.7 |
| 3.2 | 2.0 | 33% | 442.2 | 884.5 | 1,326.7 | 928.7 | 398.0 |
| 3.2 | 3.0 | 25% | 442.2 | 1326.8 | 1,769.0 | 1238.3 | 530.7 |
-
Notes:
1. We calculated in-hospital case-fatality rates (CFR) (Column 1) from a regression analysis of 66 relevant studies in the systematic literature review (Appendix 2—table 1). We excluded the Government’s annual health statistics reporting from public hospitals as case-fatality rates calculated from these data were implausibly low and inconsistent. We used an ordinary least square regression to calculate the combined CFR, treating the number of snakebite deaths as the outcome variable and snakebite prevalence as the explanatory variable while excluding outliers. The in-hospital snakebite case-fatality rate (per 100 bites) is:
-
where D(h) represents the number of in-hospital snakebite deaths and I(h) represents the in-hospital snakebite prevalence. The CFR was 3.2% and 95% CI were (2.5, 3.8) (Appendix 2—table 1).
-
2. The MDS study estimates 62,300 snakebite deaths in 2015, of which 22.7% or 14,200 died in hospitals. Inverting formula 1 with the CFR of 3.2 to solve for I(h) yields 442,200 in-hospital snakebite prevalence in 2015 (Column 4).
3. To estimate out-of-hospital prevalence of snakebites (Column 5), we used a hypothetical relationship between in-hospital and out-of-hospital prevalence. If the out-of-hospital to in-hospital prevalence proportion is ‘K’, then we can express the out-of-hospital snakebite prevalence I(h’) as:
-
K is an unknown parameter but can also be expressed by 1/(k+1) to represent the proportion of prevalent snakebite cases that would have sought in-hospital treatment. Given the estimated I(h), we determined I(h’) by varying the K values. We applied 1.5, 2.0, and 3.0 as plausible K values (Column 2), corresponding to 40%, 33.3% and 25% of cases who sought treatment (Column 3).
-
4. The sum of I(h) and I(h’) or Columns 4 and 5 is the national snakebite prevalence (Column 6).
5. Among 44 studies, an average of 70% of patients received antivenom after a diagnosis of systematic envenomation (Appendix 2—table 1). We applied this percentage to obtain the expected number of envenomations in India (Column 7). The remainder were “dry bites” without envenomation (Column 8).
Appendix 2—table 1
Case-fatality and summary of public health related snakebite characteristics.
(Summary of 78 snakebite studies from 2000 to 2019 included in the systematic review).
| Source of study | ||||||
|---|---|---|---|---|---|---|
| Variable | Autopsy | Community survey | EMS† | Hospital | All studies combined | Variable range ** |
| Summary of study outcomes | ||||||
| No. of studies | 7 | 4 | 1 | 66 | 78 | |
| No. of snake bites | 1938 | 1405 | 27509 | 56738 | 87590 | |
| No. of snake bite deaths | 1938 | 131 | 359 | 901 | 3329 | |
| Case-fatality (per 100 bites)* | ||||||
| Crude estimate | n.a. | 9.3 | 1.3 | 1.6 | 3.8 | (1.3, 9.3) |
| Regression estimate | n.a. | 12.2 | 1.2 | 3.2 | ||
| Summary characteristics of snakebites (n = no. of studies) | ||||||
| Age (in years) (n = 43) | ||||||
| <15 | 14% | 10% | 11% | 11% | 11.1% | (9.6, 13.8) |
| 15–29 | 24% | 30% | 30% | 32% | 30.4% | (24.0, 32.0) |
| 30–69 | 60% | 58% | 57% | 55% | 56.5% | (54.6, 59.8) |
| 70+ | 2% | 2% | 2% | 2% | 1.9% | (1.7, 2.4) |
| Sex (n = 66) | ||||||
| Male | 70% | 62% | 56% | 61% | 58.5% | (56.0, 70.2) |
| Female | 30% | 38% | 44% | 39% | 41.5% | (29.8, 44.0) |
| Season (n = 19) | ||||||
| Summer (March-May) | 18% | n.a. | 19% | 17% | 19.1% | (17.3, 19.5) |
| Monsoon (Jun-Sep) | 51% | n.a. | 47% | 53% | 47.9% | (46.8, 52.8) |
| Post Monsoon (Oct-Dec) | 21% | n.a. | 25% | 21% | 24.1% | (21.1, 24.9) |
| Winter (Jan-Feb) | 10% | n.a. | 9% | 8.8% | 8.9% | (8.8, 9.5) |
| Place bite happened (n = 16) | ||||||
| Indoor | 37% | 16% | n.a. | 38% | 36.4% | (15.9, 38.0) |
| Outdoor | 63% | 84% | n.a. | 62% | 63.6% | (62.0, 84.1) |
| Body location (n = 40) | ||||||
| Lower extremity | 66% | 82% | n.a. | 77% | 76.7% | (66.3, 81.9) |
| Upper extremity | 31% | 16% | n.a. | 21% | 21.2% | (16.2, 30.9) |
| Head, neck or trunk | 3% | 2% | n.a. | 2% | 2.1% | (1.9, 2.8) |
| Snake species identified (n = 33) | ||||||
| Russell's viper | 71% | n.a. | n.a. | 42% | 43.2% | (42.2, 71.0) |
| Krait | 9% | n.a. | n.a. | 18% | 17.7% | (9.0, 18.0) |
| Cobra | 14% | n.a. | n.a. | 12% | 11.7% | (11.6, 14) |
| Hump nose viper | n.a. | n.a. | n.a. | 4% | 4.0% | (4.2, 4.2) |
| Saw-scaled viper | n.a. | n.a. | n.a. | 2% | 1.7% | (1.8, 1.8) |
| Water snake | n.a. | n.a. | n.a. | 0.4% | 0.3% | (0.4, 0.4) |
| Unknown | 6% | n.a. | n.a. | 22% | 21.3% | (6.1, 21.9) |
| Time of the bite (n = 18) | ||||||
| 12am-6am | 6% | n.a. | 13% | 23% | 13.6% | (5.6, 22.8) |
| 6am-Noon | 35% | n.a. | 28% | 23% | 27.4% | (23.3, 35.2) |
| Noon-6pm | 39% | n.a. | 29% | 25% | 28.9% | (24.9, 38.9) |
| 6pm-12am | 20% | n.a. | 30% | 29% | 30.1% | (20.4, 30.2) |
| Hours to treatment (n = 19)†† | ||||||
| <6 hr | n.a. | n.a. | 100%‡ | 66% | 65.9% | (23.6, 100) |
| 6–12 hr | n.a. | n.a. | 0% | 18% | 17.9% | (2.7, 36.3) |
| 12–24 hr | n.a. | n.a. | 0% | 10% | 9.8% | (4.1, 33.3) |
| >24 hr | n.a. | n.a. | 0% | 6% | 6.4% | (0.7, 31.9) |
| Number treated with antivenom (n = 44)§ †† | ||||||
| Treated | n.a. | n.a. | n.a. | 70% | 69.7% | (13.3, 100) |
| Survived by antivenom (n = 19)¶ †† | ||||||
| Failed | n.a. | n.a. | n.a. | 6% | 5.6% | (0, 34.6) |
| Survived | n.a. | n.a. | n.a. | 94% | 94.4% | (65.4, 100) |
-
Notes:
* Crude case fatality rates are the aggregated number of deaths divided by snakebites. Case-fatality regression estimate was calculated after refining the row data for outliers. After careful assessment of all 66 hospital studies, only 11727 snakebite events followed by 487 deaths from 44 studies were considered for regression estimate (3.17, 95% Cl (2.54, 3.79)).
-
† EMS - ‘108 call’ GVK Emergency Ambulance Services in India (Gimkala et al., 2016). EMS data is for 2014 covering 12 states in India (Andhra Pradesh, Chhattisgarh, Dadra and Nagar Haveli, Daman and Diu, Goa, Gujarat, Himachal Pradesh, Karnataka, Meghalaya, Tamil Nadu, Telangana, Uttarakhand). Out of 359 EMS deaths, 168 died before reaching hospital and the remainder died after 48 hr follow up in hospitals.
‡ Time from EMS service call to transport to hospital.
-
§ Patients who received antivenom at hospital after diagnosis of systematic envenoming.
¶ Survived by antivenom was calculated by dividing the deaths or survivors by number treated with antivenom. n.a. - Not available or not relevant.
-
** Variable range (minimum, maximum) observed in study groups. When available for only one study group, range within the observed studies in that group.
†† Pooled estimates for ‘Hours to treatment’, ‘Number treated with antivenom’ and ‘Survived by antivenom’ were from hospital studies only.
Appendix 2—table 2
Systematic review summary of state coverage by years of 78 studies.
| No. of studies | Total no. of snakebites | Total no. of snakebite deaths | Sources of studies | Publication year/number of studies | ||||||||||||||||||||||
|---|---|---|---|---|---|---|---|---|---|---|---|---|---|---|---|---|---|---|---|---|---|---|---|---|---|---|
| State | Autopsy | Community survey | EMS | Hospital | 1999 | 2002 | 2004 | 2005 | 2006 | 2007 | 2008 | 2009 | 2010 | 2011 | 2012 | 2013 | 2014 | 2015 | 2016 | 2017 | 2018 | 2019 | ||||
| 1 | Andhra Pradesh | 4 | 6283 | 1457 | 1 | 1 | 1 | 1 | . | . | . | . | . | 1 | . | . | . | . | . | . | 1 | 1 | 1 | . | . | . |
| 2 | Bihar | 3 | 1171 | 29 | 1 | 2 | 1 | 2 | ||||||||||||||||||
| 3 | Chandigarh | 4 | 297 | 6 | . | . | . | 4 | . | . | . | 1 | . | . | . | 1 | 1 | . | 1 | . | . | . | . | . | . | . |
| 4 | Chhattisgarh | 1 | 2084 | 52 | . | . | 1 | . | . | . | . | . | . | . | . | . | . | . | . | . | . | . | 1 | . | . | . |
| 5 | Dadra and Nagar Haveli | 1 | 384 | 1 | . | . | 1 | . | . | . | . | . | . | . | . | . | . | . | . | . | . | . | 1 | . | . | . |
| 6 | Daman and Diu | 1 | 12 | . | . | 1 | . | . | . | . | . | . | . | . | . | . | . | . | . | . | . | 1 | . | . | . | |
| 7 | Goa | 1 | 244 | . | . | 1 | . | . | . | . | . | . | . | . | . | . | . | . | . | . | . | 1 | . | . | . | |
| 8 | Gujarat | 1 | 3628 | 91 | . | . | 1 | . | . | . | . | . | . | . | . | . | . | . | . | . | . | . | 1 | . | . | . |
| 9 | Haryana | 1 | 17 | . | . | . | 1 | . | . | . | . | . | . | . | . | . | . | . | . | 1 | . | . | . | . | . | |
| 10 | Himachal Pradesh | 4 | 1442 | 28 | . | . | 1 | 3 | . | . | . | . | . | . | . | . | . | . | . | . | 2 | 1 | 1 | . | . | . |
| 11 | Jammu and Kashmir | 1 | 10 | . | . | . | 1 | . | . | . | . | . | . | . | . | . | 1 | . | . | . | . | . | . | . | . | |
| 12 | Jharkhand | 1 | 356 | 19 | . | . | . | 1 | . | . | . | . | . | . | . | . | . | . | . | . | . | 1 | . | . | . | . |
| 13 | Karnataka | 20 | 5281 | 139 | 1 | 1 | 18 | 1 | 2 | 1 | 4 | 4 | 1 | 3 | 1 | 1 | 1 | |||||||||
| 14 | Kerala | 5 | 3169 | 131 | . | . | . | 5 | . | . | . | . | . | . | . | . | . | . | . | . | . | 3 | . | 1 | 1 | . |
| 15 | Maharashtra | 18 | 4884 | 432 | 2 | 16 | 1 | 1 | 1 | 1 | 1 | 1 | 2 | 3 | 2 | 1 | 1 | 2 | 1 | |||||||
| 16 | Meghalaya | 1 | 13 | . | . | 1 | . | . | . | . | . | . | . | . | . | . | . | . | . | . | . | 1 | . | . | . | |
| 17 | New Delhi | 1 | 62 | . | . | . | . | 1 | . | . | . | 1 | . | . | . | . | . | . | . | . | . | . | . | . | . | . |
| 18 | Odisha | 2 | 101 | 33 | . | . | . | 2 | . | . | . | . | . | . | . | . | . | . | . | . | . | 1 | . | . | . | 1 |
| 19 | Pondicherry | 1 | 50 | 9 | . | . | . | 1 | . | . | . | . | 1 | . | . | . | . | . | . | . | . | . | . | . | . | . |
| 20 | Tamil Nadu | 7 | 51,198 | 371 | 2 | 1 | 4 | 3 | 1 | 1 | 1 | 1 | ||||||||||||||
| 21 | Telangana | 1 | 3956 | 92 | . | . | 1 | . | . | . | . | . | . | . | . | . | . | . | . | . | . | . | 1 | . | . | . |
| 22 | Uttar Pradesh | 4 | 249 | 90 | 1 | . | . | 3 | . | . | . | . | . | . | . | . | . | . | 1 | 1 | . | 1 | 1 | . | . | . |
| 23 | Uttarakhand | 1 | 329 | 4 | . | . | 1 | . | . | . | . | . | . | . | . | . | . | . | . | . | . | . | 1 | . | . | . |
| 24 | West Bengal | 6 | 2370 | 345 | 2 | 4 | 1 | 1 | 1 | 1 | 1 | 1 | ||||||||||||||
| Total | 90 | 87,590 | 3329 | 7 | 4 | 12 | 67 | 1 | 1 | 1 | 4 | 2 | 1 | 4 | 3 | 1 | 4 | 8 | 9 | 9 | 13 | 15 | 4 | 4 | 6 | |
-
Note:
The 78 studies we reviewed were published over 20 year’s period and data are corresponding to 1999–2019 from 24 different states. Except in a few studies, data of individual studies were confined to a single state. Therefore, possibility of overlapping of study data within states would be minimal and we verified the areas when several studies were conducted in the same year within the same state. One study from 1999 was included because no other studies were found around the year of 2000.
Appendix 3—table 1
Parameter estimates for covariates in the geostatistical Bayesian Poisson model.
| Relative risk of snakebite mortality | |||
|---|---|---|---|
| 0.5 quantile | 0.025 quantile | 0.975 quantile | |
| (Intercept) | 1.011 | 0.456 | 1.705 |
| Urban vs rural | 0.280 | 0.229 | 0.338 |
| Female illiteracy in rural areas | 1.427 | 1.276 | 1.596 |
| Altitude (below 400 m) | 1.905 | 0.812 | 4.392 |
| Altitude (above 400 m) | 0.508 | 0.305 | 0.824 |
| Temperature (below 20°C) | 4.774 | 1.658 | 15.764 |
| Temperature (above 20°C) | 1.170 | 0.502 | 2.641 |
| range/1000 (ϕ/1000) | 442.001 | 244.373 | 847.835 |
| sd of spatial random effect (σ) | 0.587 | 0.442 | 0.796 |
| sd of random walk two for year | 0.003 | 0.001 | 0.007 |
| sd of sampling unit effect (τ) | 0.556 | 0.466 | 0.655 |
Additional files
Download links
A two-part list of links to download the article, or parts of the article, in various formats.
Downloads (link to download the article as PDF)
Open citations (links to open the citations from this article in various online reference manager services)
Cite this article (links to download the citations from this article in formats compatible with various reference manager tools)
Trends in snakebite deaths in India from 2000 to 2019 in a nationally representative mortality study
eLife 9:e54076.
https://doi.org/10.7554/eLife.54076


