Fibrillar Aβ triggers microglial proteome alterations and dysfunction in Alzheimer mouse models
- German Center for Neurodegenerative Diseases (DZNE), Germany
- Graduate School of Systemic Neuroscience, Ludwig-Maximilians-University, Germany
- Department of Cellular Neurology, Hertie-Institute for Clinical Brain Research, University of Tübingen, Germany
- Faculty of Chemistry, Technical University of Munich, Germany
- Institute for Stroke and Dementia Research (ISD), University Hospital, LMU, Germany
- Munich Cluster for Systems Neurology (SyNergy), Germany
- Neuroproteomics, School of Medicine, Klinikum Rechts der Isar, Technical University, Germany
- Department of Molecular Drug Design and Target Validation, Fraunhofer Institute for Cell Therapy and Immunology, Germany
- Laboratory for Proteolytic Neuroscience, RIKEN Center for Brain Science Institute, Japan
- Department of Neurocognitive Science, Nagoya City University Graduate School of Medical Science, Japan
- Center for Neuropathology and Prion Research, Ludwig-Maximilians-Universität München, Germany
- Biomedical Center (BMC), Ludwig-Maximilians Universität München, Germany
Figures
Figure 1 with 2 supplements
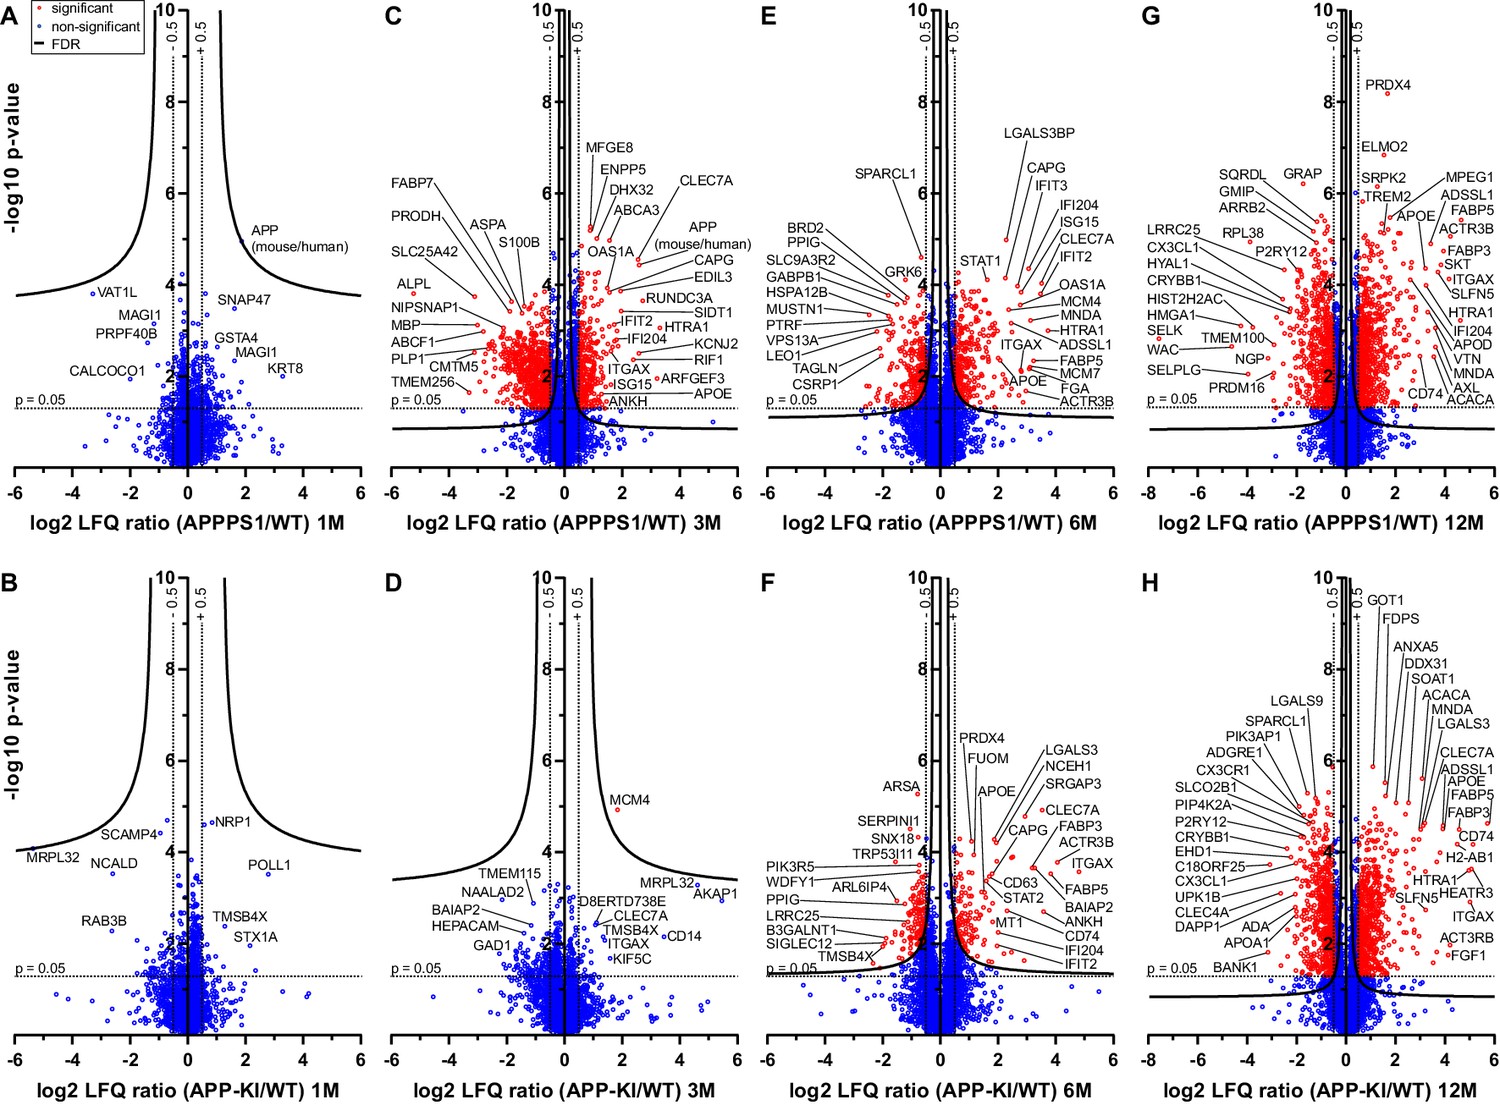
Quantitative proteomics of acutely isolated microglia.
Volcano plots of APPPS1 and APP-KI versus WT microglia at 1 (A and B), 3 (C and D), 6 (E and F) and 12 (G and H) months of age. The minus log10 transformed p-value is plotted against the log2 transformed LFQ ratios (log2 fold changes). A permutation-based FDR estimation was applied which is visualized as hyperbolic curves. Proteins with a log2 LFQ ratio lower than −0.5 or higher than +0.5 with a p-value less than 0.05 which remain significantly changed after FDR correction (FDR = 0.05, s0 = 0.1) are indicated as red circles. Non-significantly changed proteins are indicated as blue circles. Some selected proteins are marked with their gene names.
-
Figure 1—source data 1
Quality control of microglial isolation using MACS.
FACS analysis of the CD11b-enriched (A) and CD11b-depleted fraction (B). Propidium Iodide (PI) was used to analyze cell viability (PI negative fraction).
- https://cdn.elifesciences.org/articles/54083/elife-54083-fig1-data1-v1.pdf
Figure 1—figure supplement 1
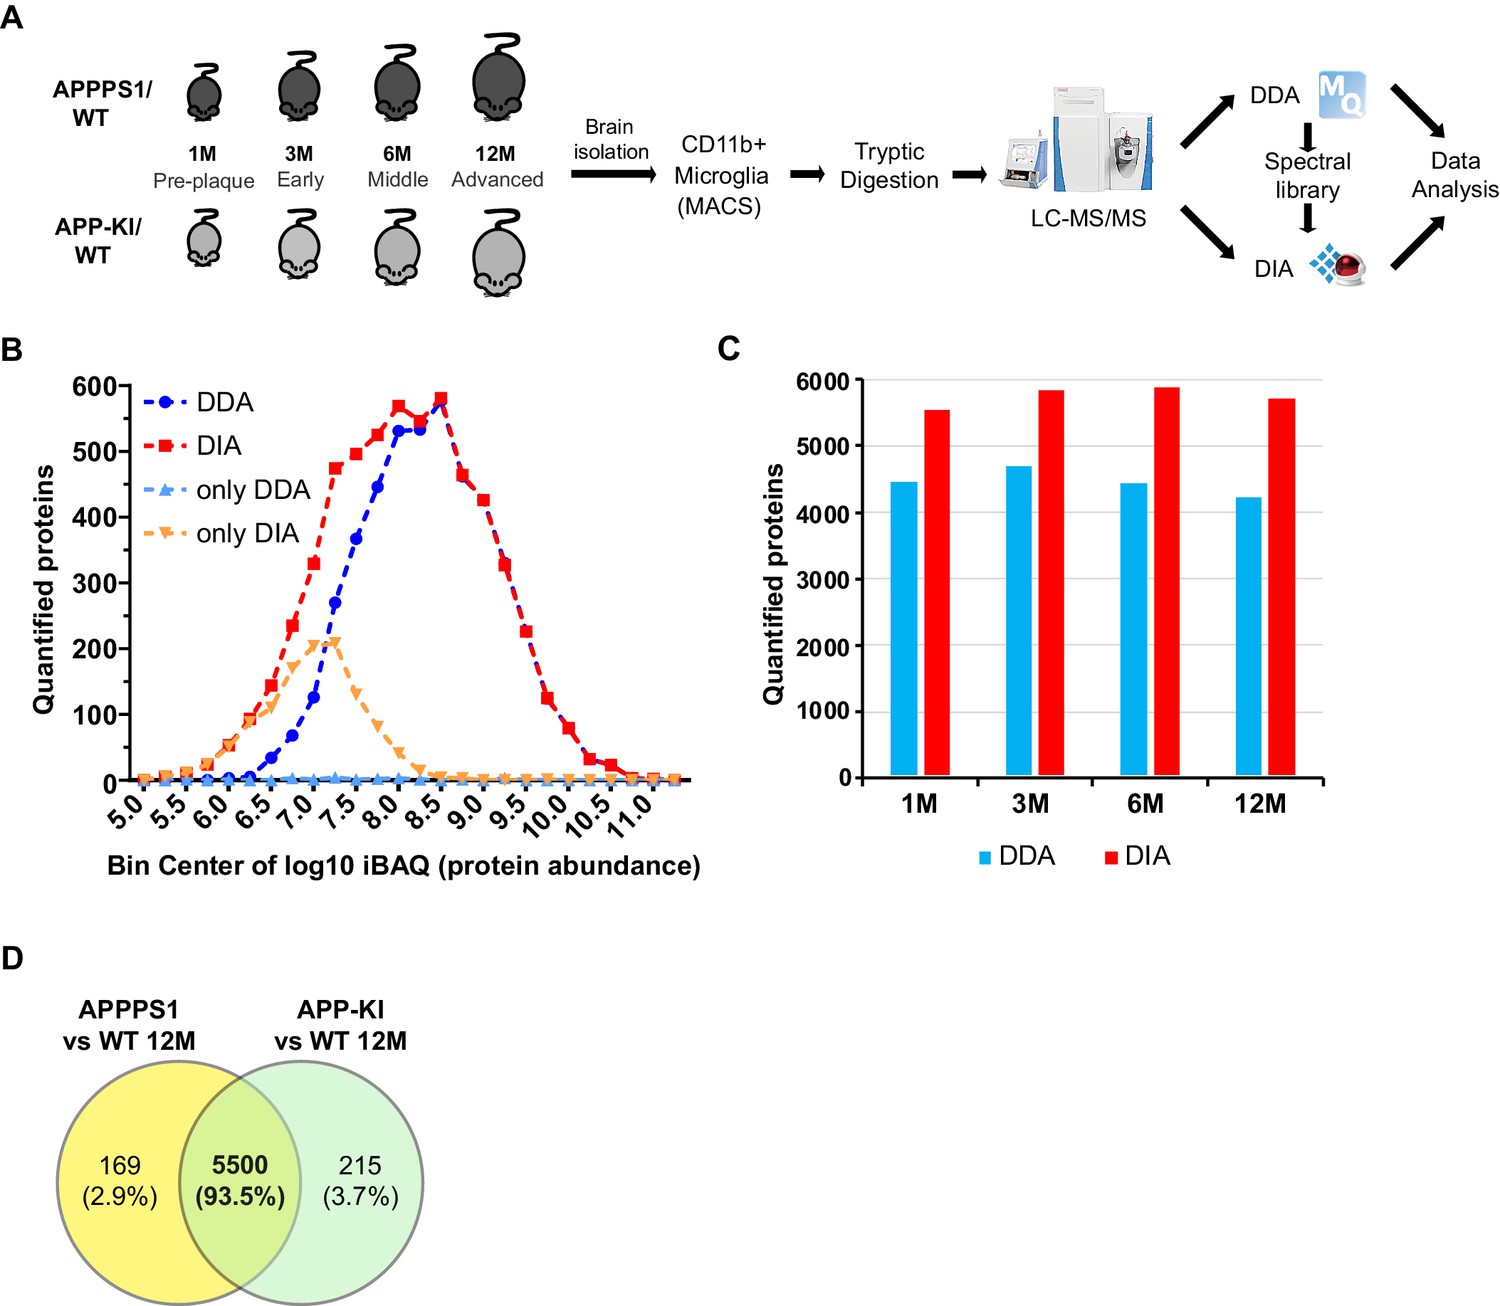
Improvement of the data acquisition method for quantitative proteomics of microglia.
(A) Workflow of the proteomic analysis. Microglia were acutely isolated using the CD11b MACS system. Protein lysates were subjected to tryptic digestion followed by quantitative LC-MS/MS analysis. APPPS1 microglia samples were first measured using DDA to generate a spectral library required for DIA analysis. Afterwards, both APPPS1 and APPKI microglia were measured using DIA and data was subjected to further bioinformatics analysis. (B) Distribution of quantified proteins with DDA and DIA in APPPS1 microglia. The number of quantified proteins is plotted against the log10 transformed iBAQ (intensity based absolute quantification) values with a bin size of 0.25. The iBAQ values are an estimate of the relative molar abundance of a protein within the sample. The number of consistently quantified proteins per bin for DDA and DIA are indicated in blue and red, respectively. Proteins that were only quantified with DDA or DIA are colored in light blue and orange, respectively. The single values are connected with dashed lines for better visibility. Please note that DIA provides additional quantifications for low abundant proteins. Hereby, DIA extends the dynamic range for protein quantification by almost one order of magnitude. (C) Number of relatively quantified proteins between APPPS1 and WT microglia at 1, 3, 6, and 12 months with DDA (blue) and DIA (red). Only proteins that were consistently quantified in all APPPS1 and WT samples per age group were counted. Please note that DIA provides between 24% and 35% additional quantifications per age group. (D) The comparison of relatively quantified proteins of APPPS1 and APP-KI versus WT at 12 months shows a large overlap of 93.5% indicating a consistent quantification.
Figure 1—figure supplement 2
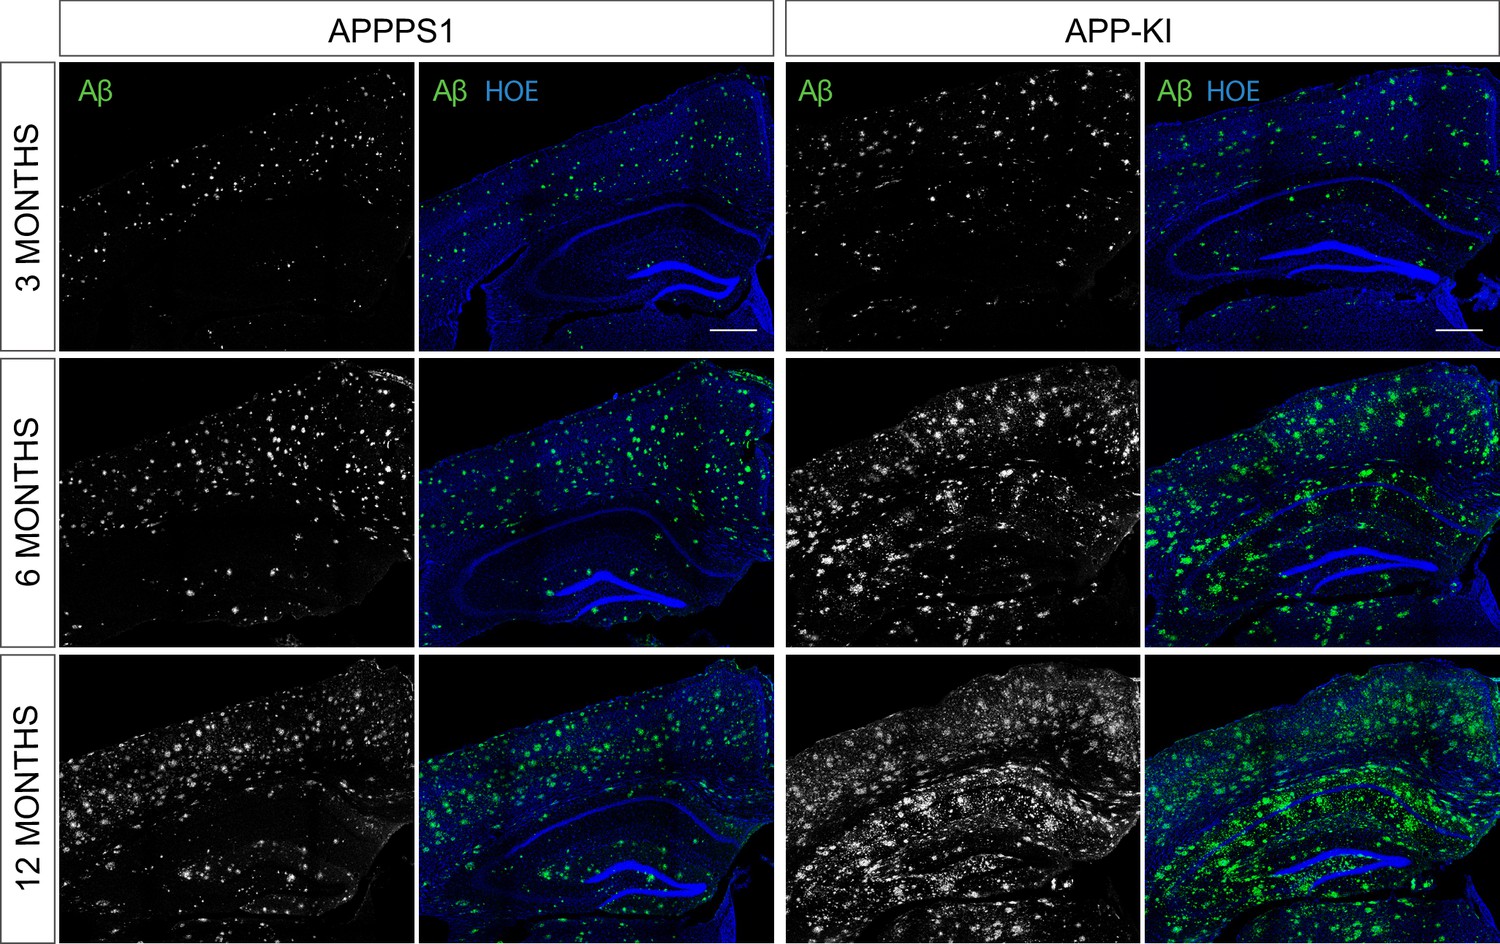
Αβ pathology in 3, 6 and 12 month old APPPS1 and APP-KI mice.
Immunohistochemical analysis of Αβ load (NAB228, green) in APPPS1 and APP-KI mice. Hoechst (HOE, blue) was used for nuclear staining. Scale bar: 400 µm.
Figure 2 with 2 supplements
APPPS1 microglia display earlier proteomic changes compared to APP-KI microglia.
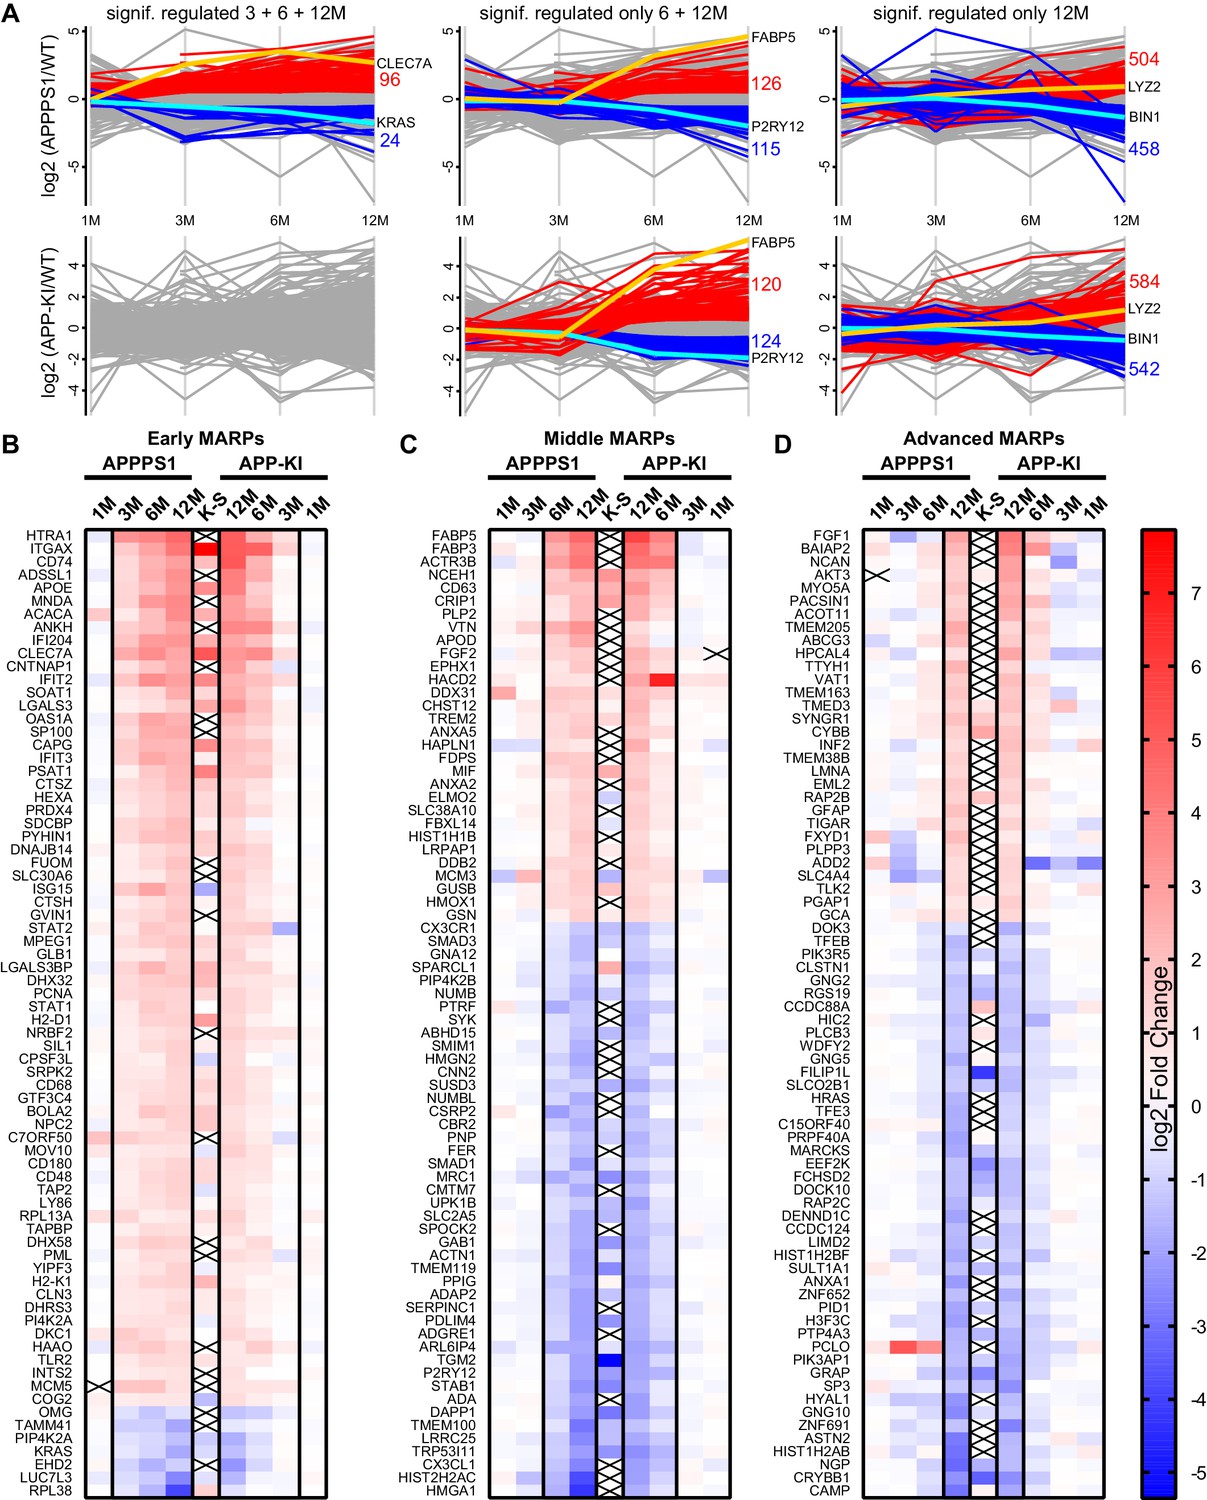
(A) Profile plots of APPPS1 and APP-KI versus WT microglia at 1, 3, 6, and 12 months of age. Lines connect the average log2 fold changes of each protein at the different time points. Regulated proteins were grouped according to three profiles: significantly increased or decreased after FDR correction (log2 fold change >0.5 or<−0.5; p<0.05; FDR significant) at 3, 6, and 12 months or only at 6 and 12 or 12 months. Proteins that fulfill these criteria are indicated as red and blue lines for increased and decreased abundance, respectively. Selected up- or down-regulated proteins are indicated in orange and cyan. Heatmaps show the log2 fold changes of the top 74 up- or down-regulated proteins for early (B), middle (C) and advanced (D) MARPs and are compared to the log2 fold changes of transcripts from single cell transcriptome study (Keren-Shaul et al., 2017), indicated with K-S. Crosses indicate missing values.
-
Figure 2—source data 1
Early, middle, and advanced MARPs.
Protein groups are represented by the UniProt accession number.
- https://cdn.elifesciences.org/articles/54083/elife-54083-fig2-data1-v1.xlsx
Figure 2—figure supplement 1
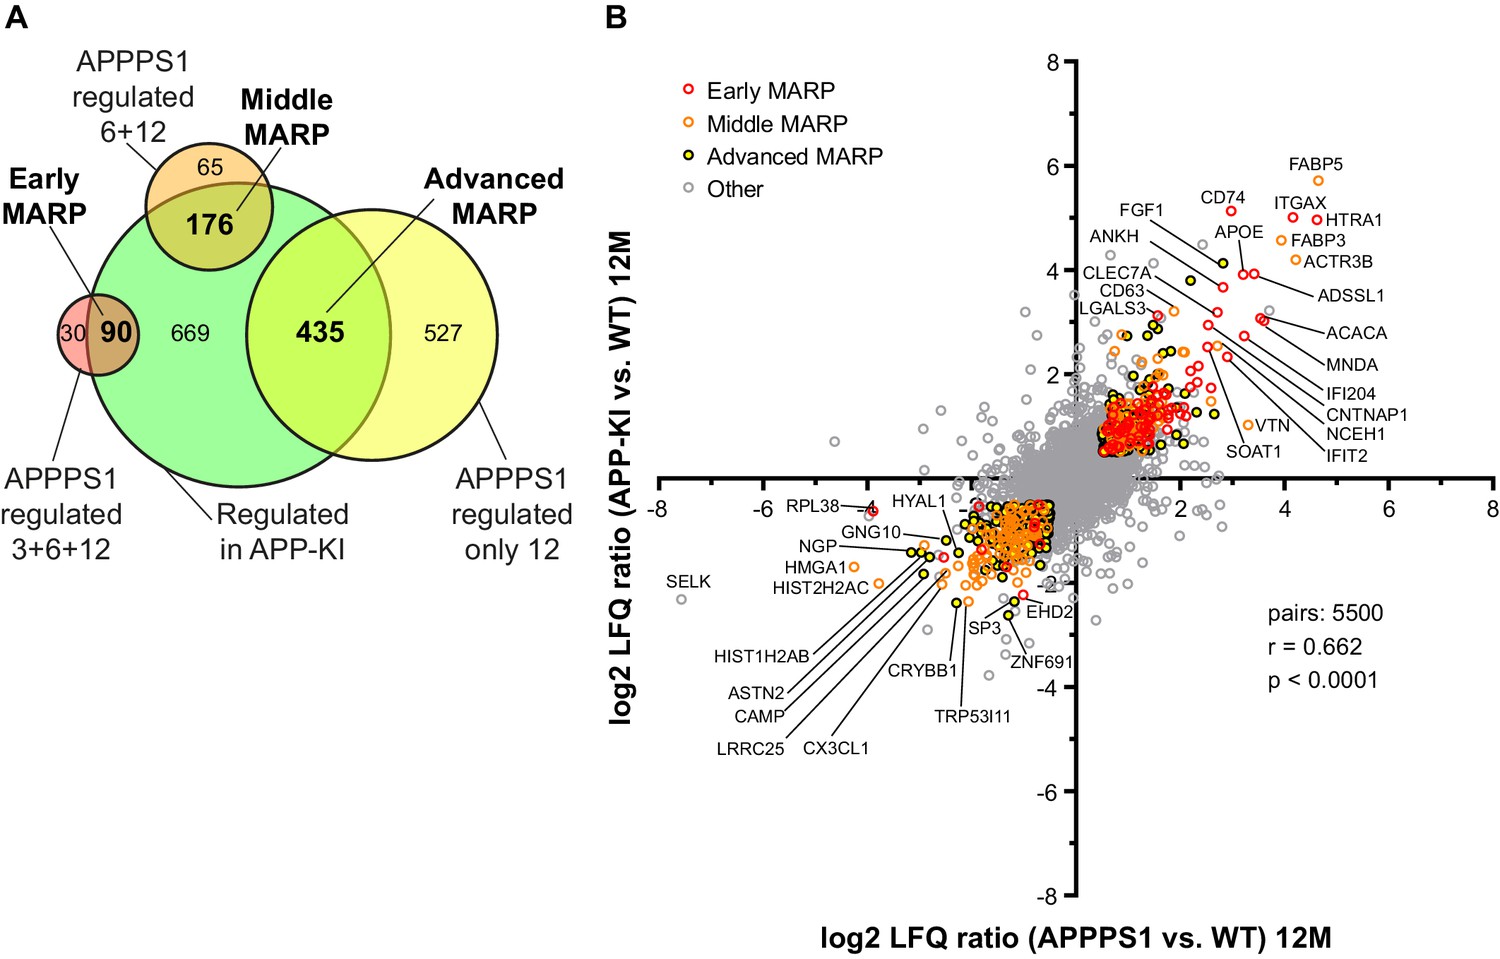
Comparison of the early, middle and advanced MARPs in APPPS1 and APP-KI mice.
(A) A Venn diagram illustrates the classification of regulated proteins into early, middle and advanced MARPs. Proteins that were regulated at 3, 6, and 12 months in APPPS1 mice as well as at 6 and 12, or only at 12 months in APP-KI mice were annotated as early MARPs. Proteins that were regulated at 6 and 12 months in APPPS1 as well as at 6 and 12, or only at 12 months in APP-KI mice were annotated as middle MARPs. Proteins that were regulated at 12 months in APPPS1 and APP-KI mice were annotated as advanced MARPs. (B) Correlation plot of log2 protein fold changes detected at 12 months for APPPS1 and APP-KI versus WT. The plot shows a significant correlation of proteomic changes at 12 months. Early, middle, and advanced MARPs are indicated in red, orange, and black circles, respectively. Selected proteins are annotated with their gene names.
Figure 2—figure supplement 2
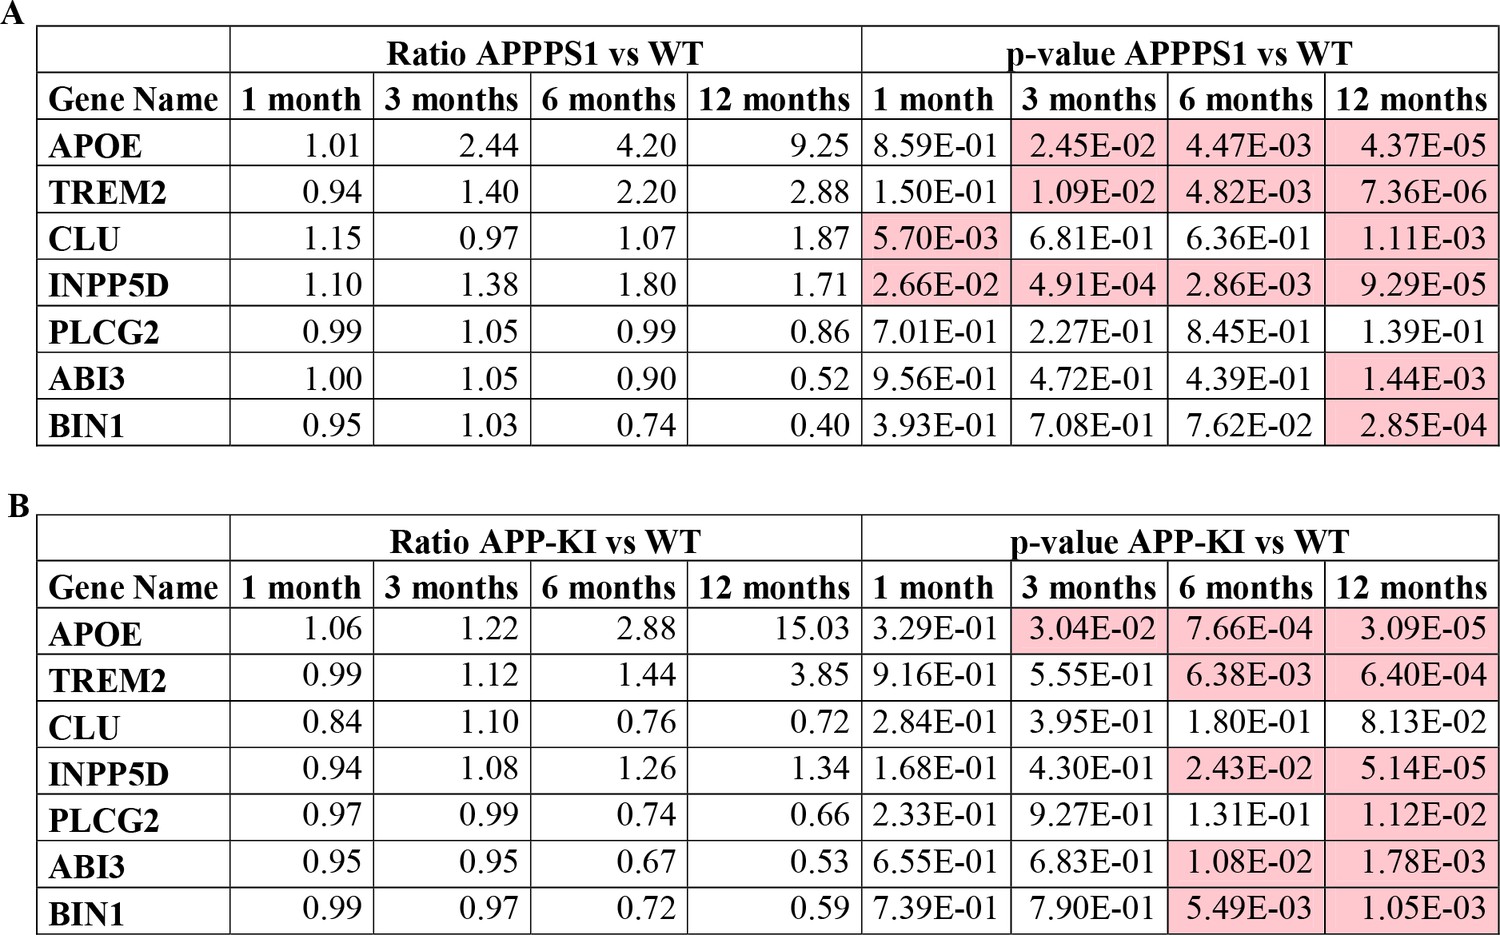
Relative quantification of proteins from seven AD risk genes in APPPS1.
LFQ ratios and p-values of AD risk genes found regulated in APPPS1 (A) and APP-KI (B) microglia are presented. p-values less than 0.05 are indicated in red.
Figure 3 with 1 supplement
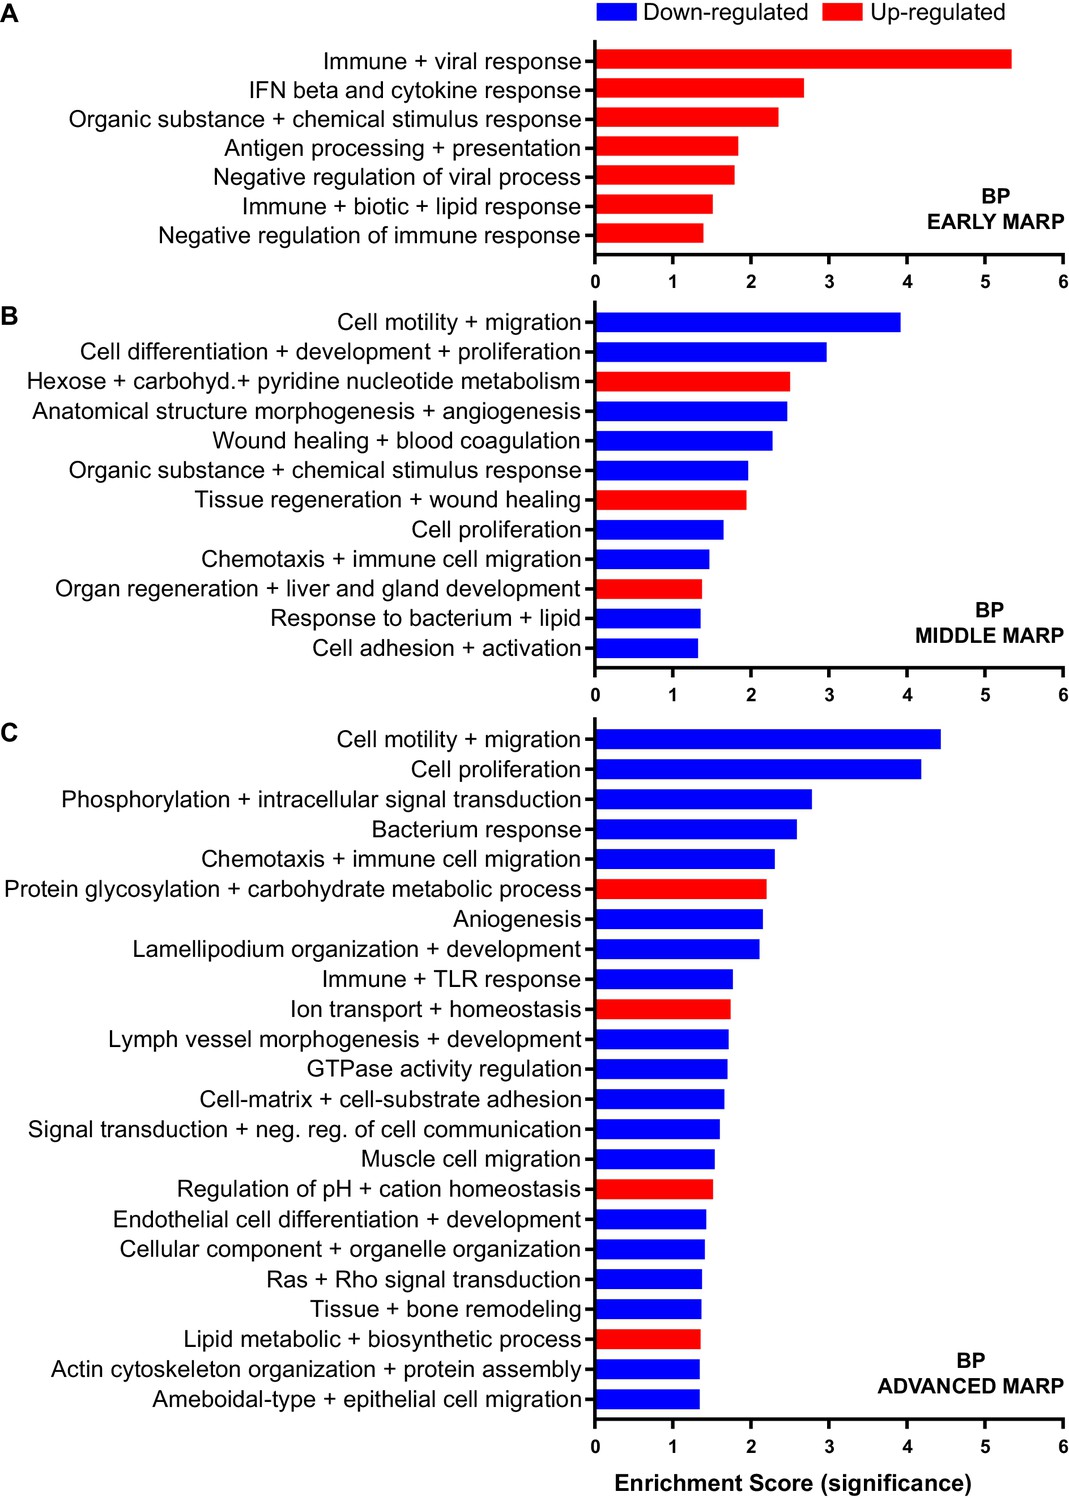
Gene ontology enrichment cluster analysis for biological process (BP) of MARPs.
Bar graphs show the clustering of early MARPs (A), middle MARPs (B) and advanced MARPs (C) for BP. Up- and down-regulated proteins were analyzed separately using the web-based software tool DAVID 6.8 with all consistently quantified proteins (5500) as an individual background. Significantly enriched clusters (Enrichment Score >1.301) for up-and down-regulated proteins are indicated in red and blue, respectively.
Figure 3—figure supplement 1
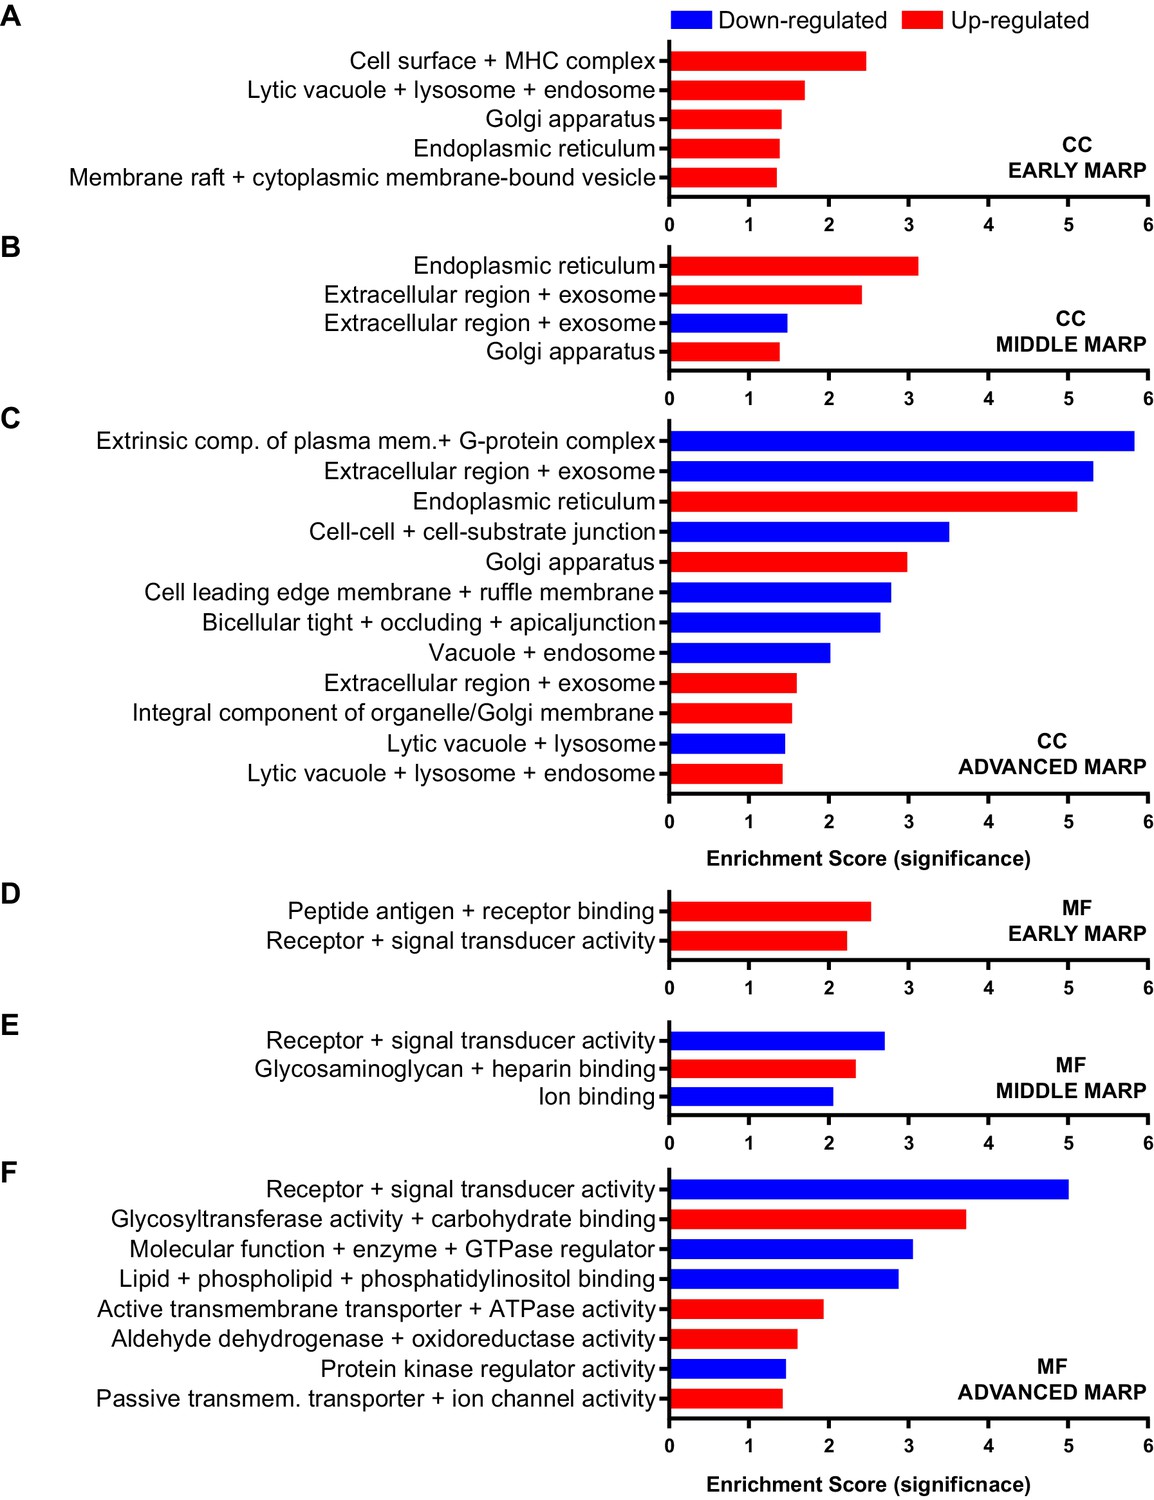
Gene ontology enrichment cluster analysis for cellular component (CC) and molecular function (MF) of MARPs.
The bar graphs show the clustering of early MARPs (A, D), middle MARPs (B, E) and advanced MARPs (C, F) for CC and MF. Up- and down-regulated proteins were analyzed separately using the web-based software tool DAVID 6.8 using all consistently quantified proteins (5500) as an individual background. Significantly enriched clusters (Enrichment Score >1.301) for up- and down-regulated proteins are indicated in red and blue, respectively.
Figure 4
Comparison of quantified and regulated proteins of APPPS1 and APP-KI mice at 12 months with single cell transcriptomics and biochemical validation of regulated proteins.
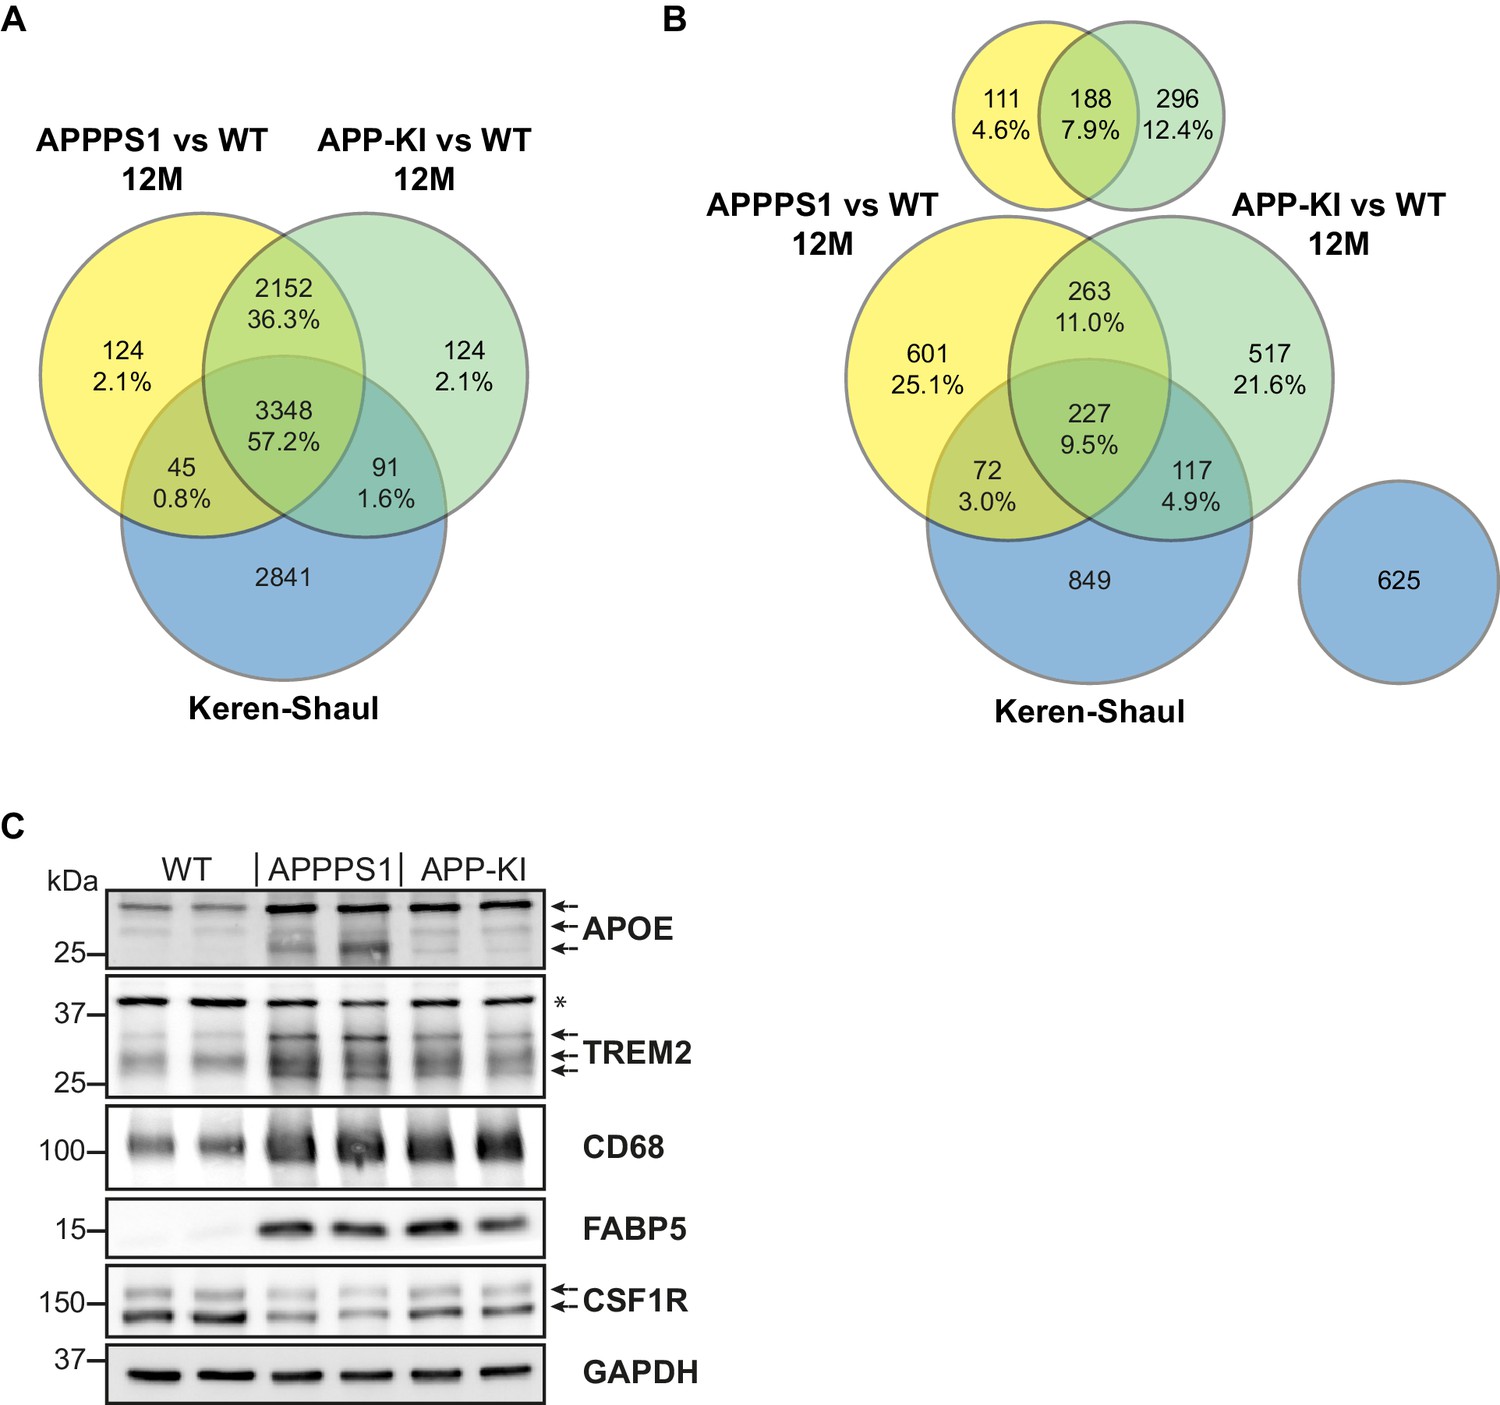
(A) The comparison of relatively quantified proteins of APPPS1 (yellow) and APP-KI (green) mice versus WT at 12 months shows a modest overlap with a single cell transcriptomics study (blue) (Keren-Shaul et al., 2017). An amount of 3348 proteins (57.2% of all quantified proteins) and their related transcripts were quantified in all three data sets. (B) The Venn diagram shows the overlap of significantly regulated proteins in APPPS1 (yellow) and APP-KI (green) mice versus WT at 12 months with unidirectionally regulated microglial transcripts (blue) (Keren-Shaul et al., 2017). Signatures which are specific either for the proteome or transcriptome dataset are separately depicted at the top or right, respectively. The indicated percentage values are based on all relatively quantified proteins. (C) Biochemical validation of proteomic data was performed using western blot analysis of microglial lysates from 12 month old mice. This analysis revealed an increased abundance of the up-regulated MARPs APOE, TREM2, CD68 and FABP5 as well as a decreased abundance of the down-regulated MARP CSF1R in APPPS1 and APP-KI compared to WT microglia. Arrows indicate antibody-detected specific bands and asterisk indicates unspecific bands.
Figure 5 with 2 supplements
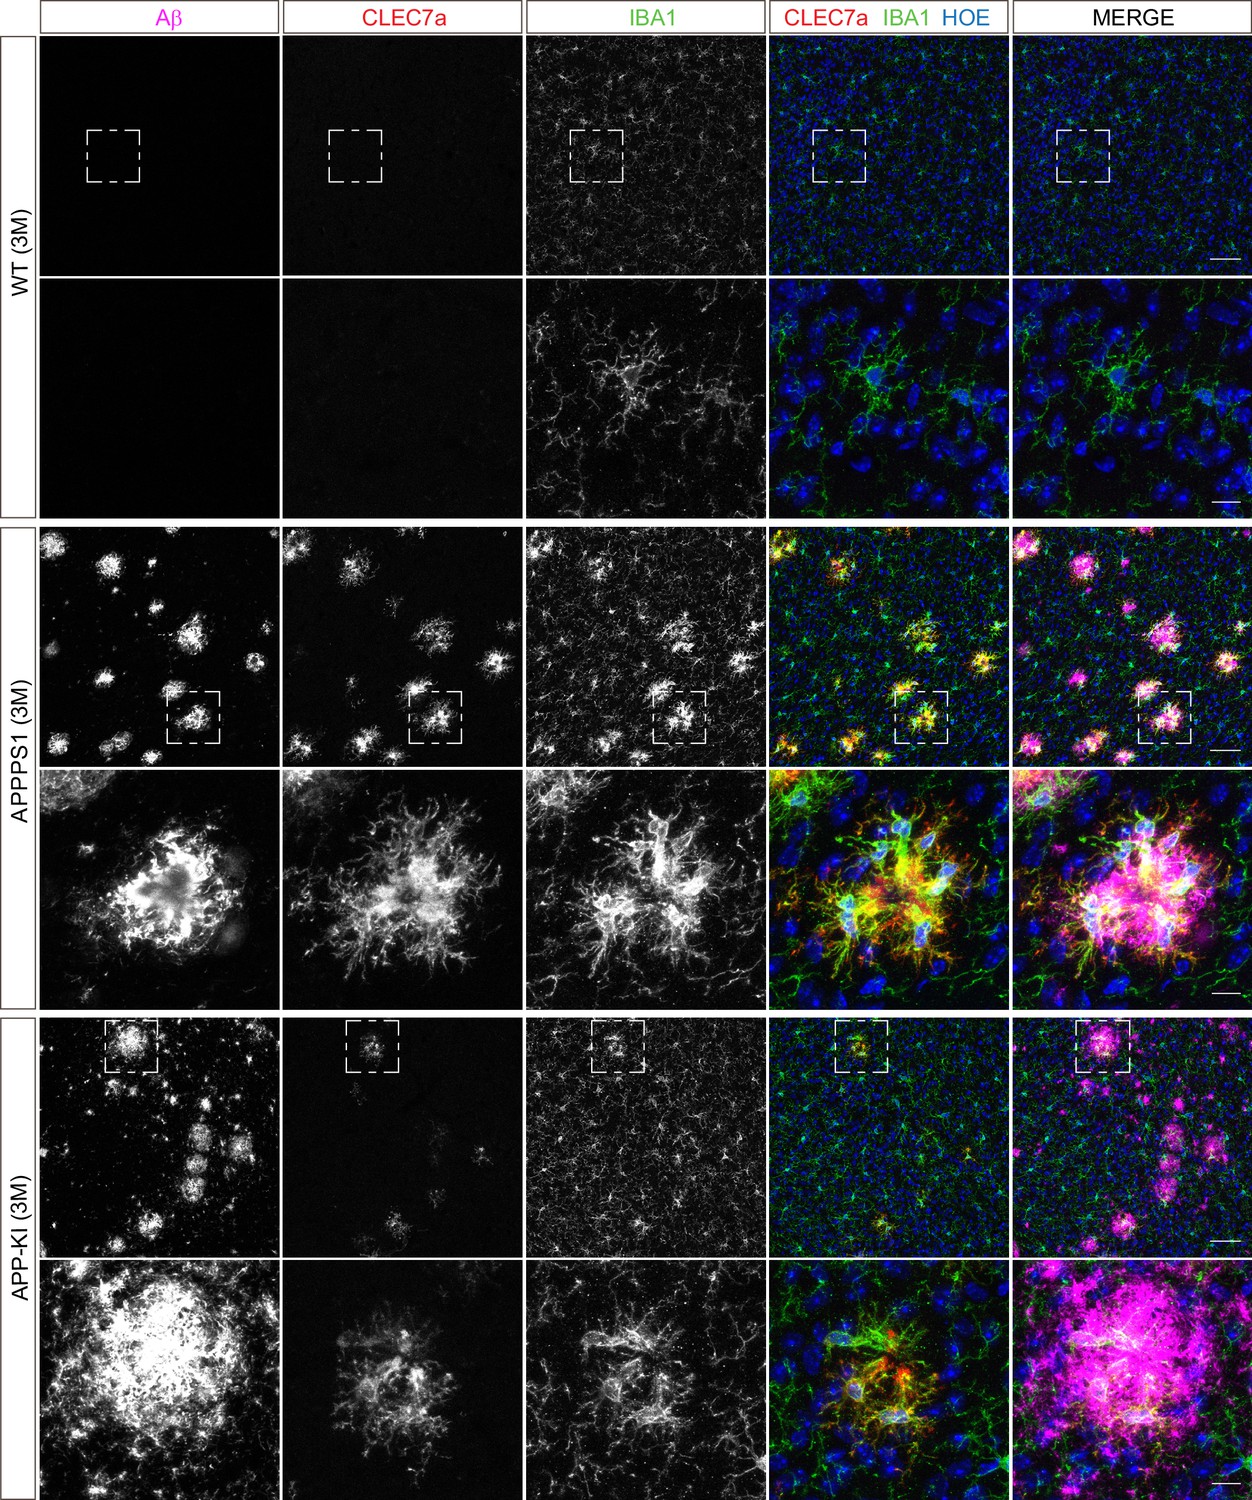
Microglial CLEC7a is prominently up-regulated in 3 month old APPPS1 mice.
Immunohistochemical analysis of CLEC7a (red) reveals an increased abundance of this early MARP in IBA1 positive (green) APPPS1 microglia surrounding Aβ plaques (magenta) that is less prominent in APP-KI microglia. CLEC7a is barely detected in WT microglia. Hoechst (HOE, blue) was used for nuclear staining. Boxed regions in upper panels (scale bar: 50 µm) are shown with a higher magnification in lower panels (scale bar: 10 µm).
Figure 5—figure supplement 1
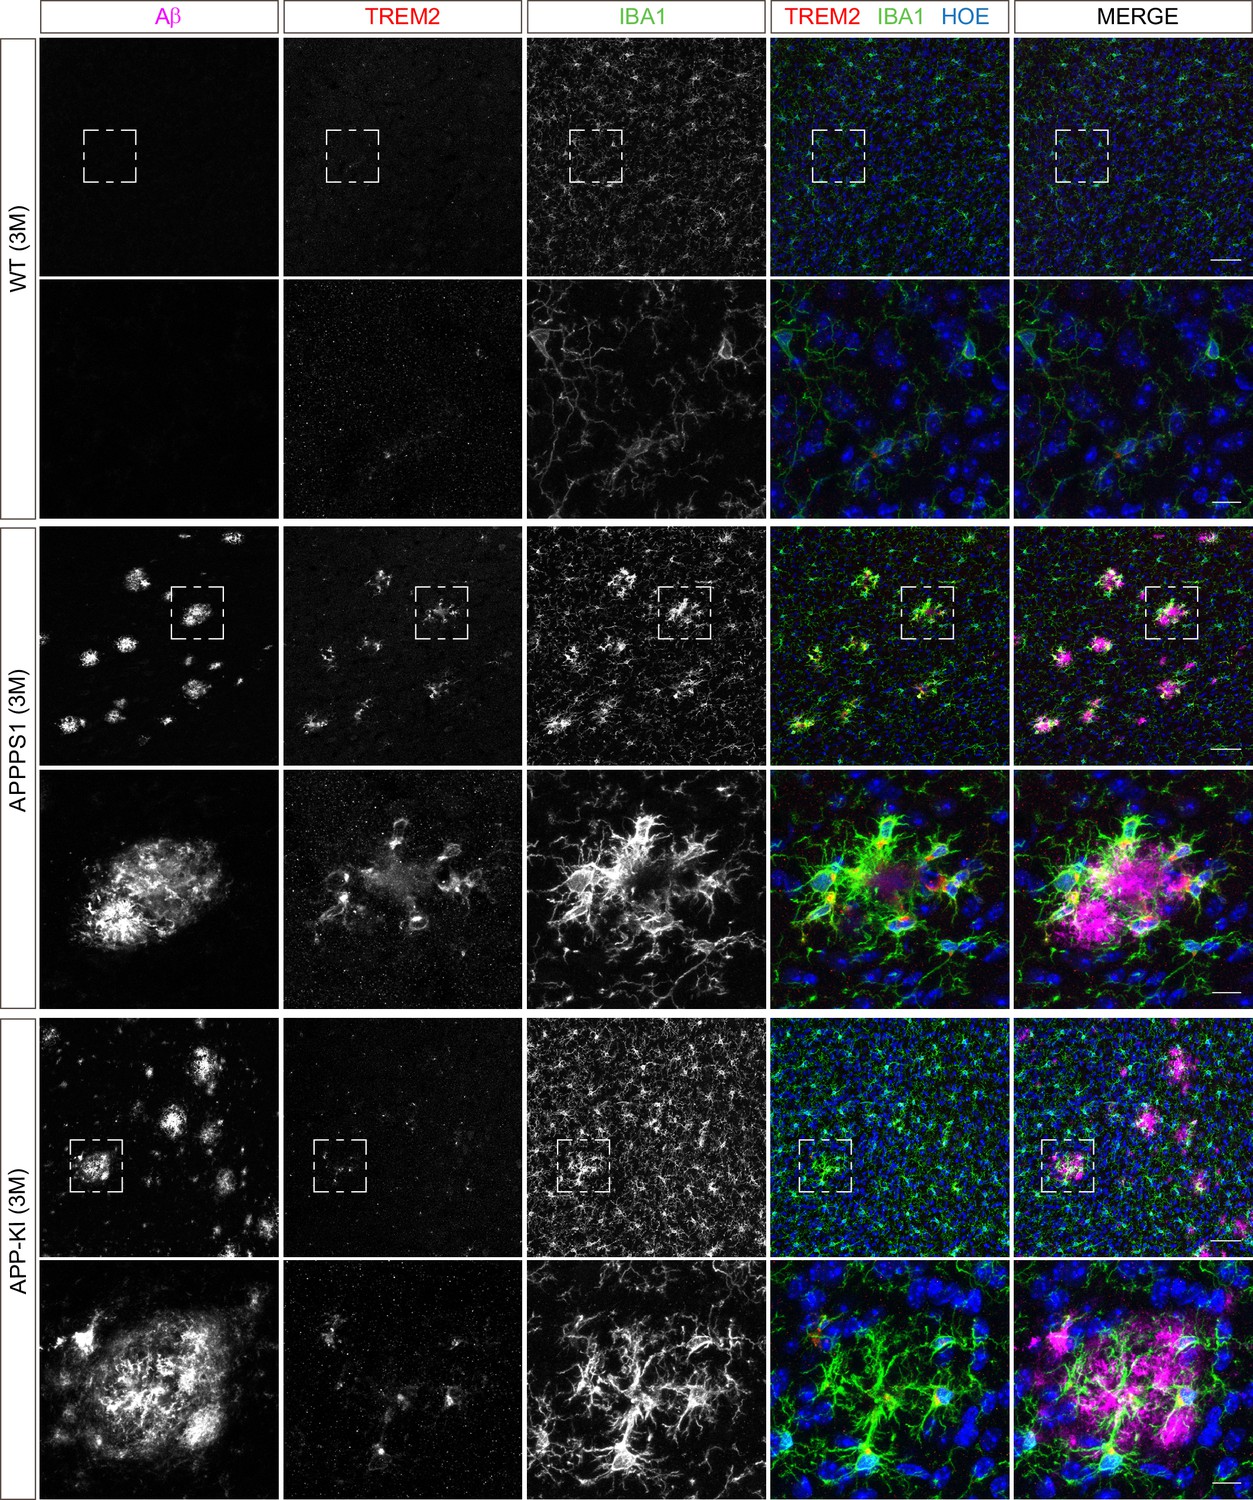
Microglial TREM2 is prominently up-regulated in 3 month old APPPS1 mice.
Immunohistochemical analysis of TREM2 (red) reveals an increased abundance in IBA1 positive (green) APPPS1 microglia surrounding Aβ plaques (magenta) that is less prominent in APP-KI microglia. Hoechst (HOE, blue) was used for nuclear staining. Boxed regions in upper panels (scale bar: 50 µm) are shown with a higher magnification in lower panels (scale bar: 10 µm).
Figure 5—figure supplement 2

Microglial APOE is prominently up-regulated in 3 month old APPPS1 mice.
Immunohistochemical analysis of APOE (red) reveals an up-regulation in IBA1 positive (green) APPPS1 microglia surrounding Aβ plaques (magenta) that is less prominent in APP-KI microglia. APOE could not be detected in WT microglia. Hoechst (HOE, blue) was used for nuclear staining. Of note, astrocytic APOE immunoreactivity was also detected, particularly in the WT, reflecting its physiological expression. Yellow arrows indicate APOE positive microglia. Boxed regions in upper panels (scale bar: 50 µm) are shown with a higher magnification in lower panels (scale bar: 10 µm).
Figure 6
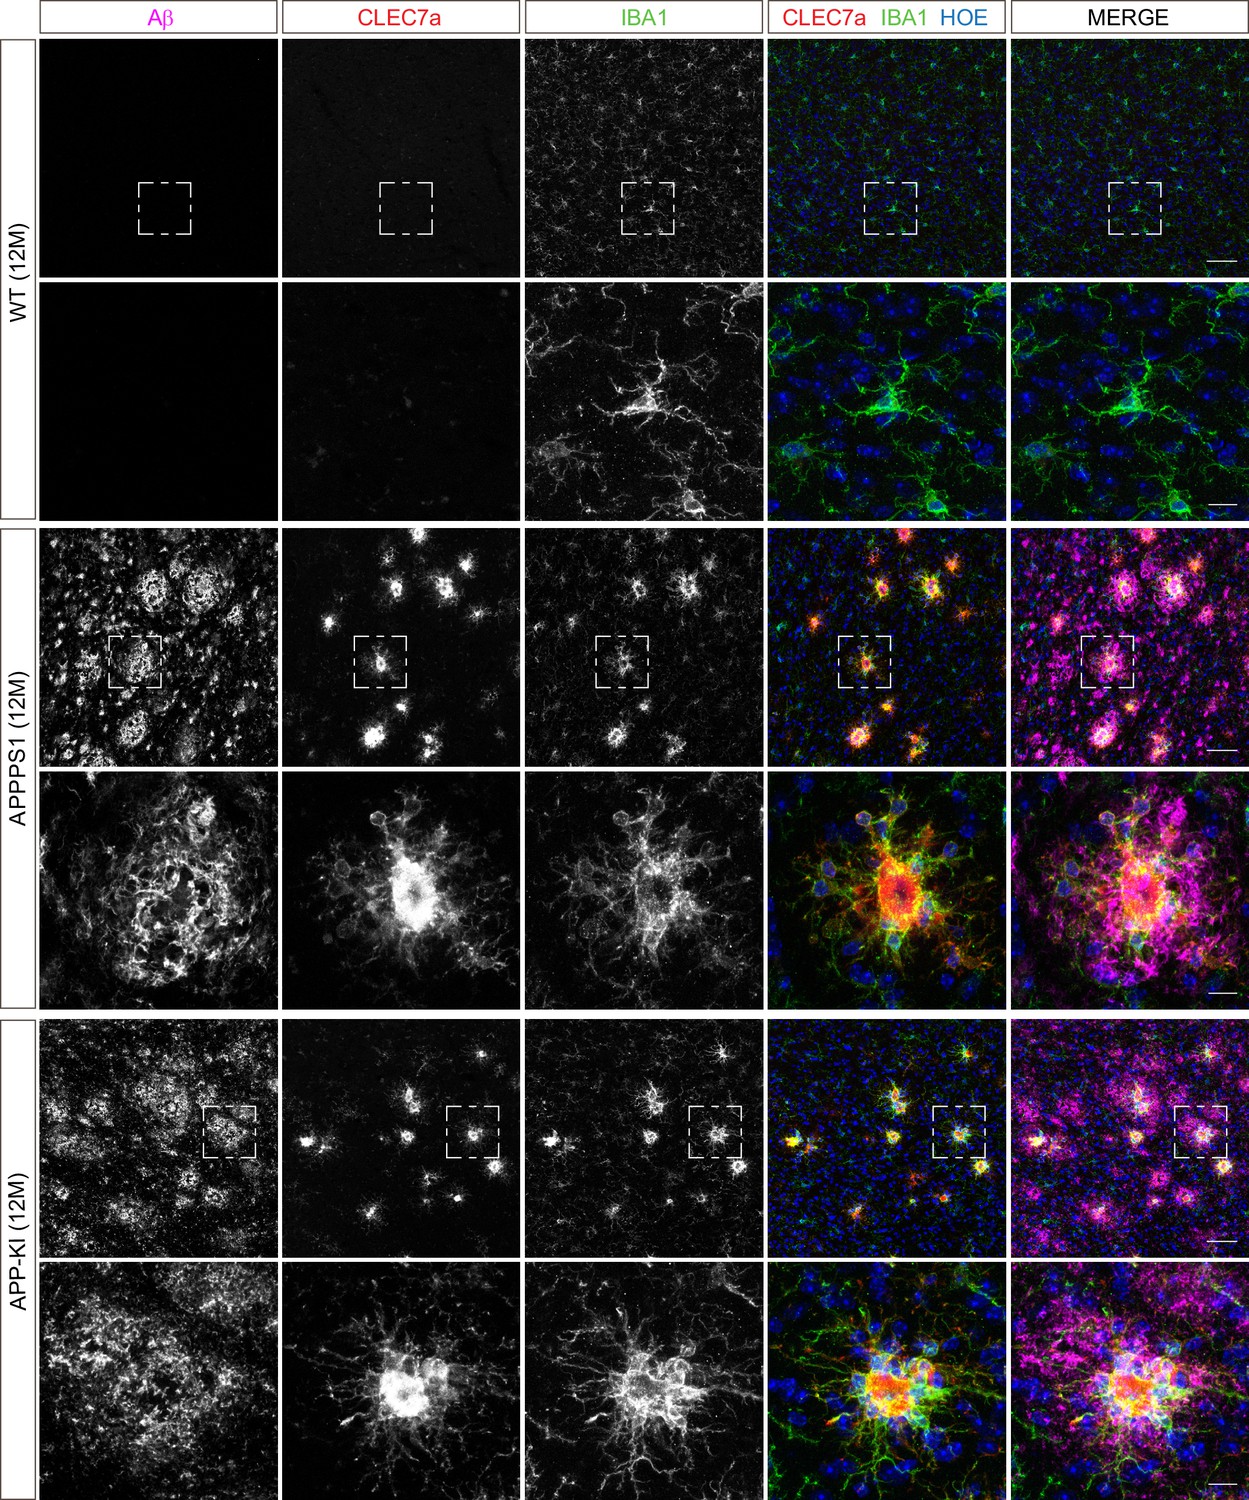
Microglial CLEC7a is increased in both AD mouse models at 12 months of age.
Immunohistochemical analysis shows an up-regulation of CLEC7a (red) in IBA1 positive (green) APPPS1 and APP-KI microglia surrounding Aβ plaques (magenta), compared to WT where CLEC7a is barely detected. Hoechst (HOE, blue) was used for nuclear staining. Boxed regions in upper panels (scale bar: 50 µm) are shown with a higher magnification in lower panels (scale bar: 10 µm).
Figure 7
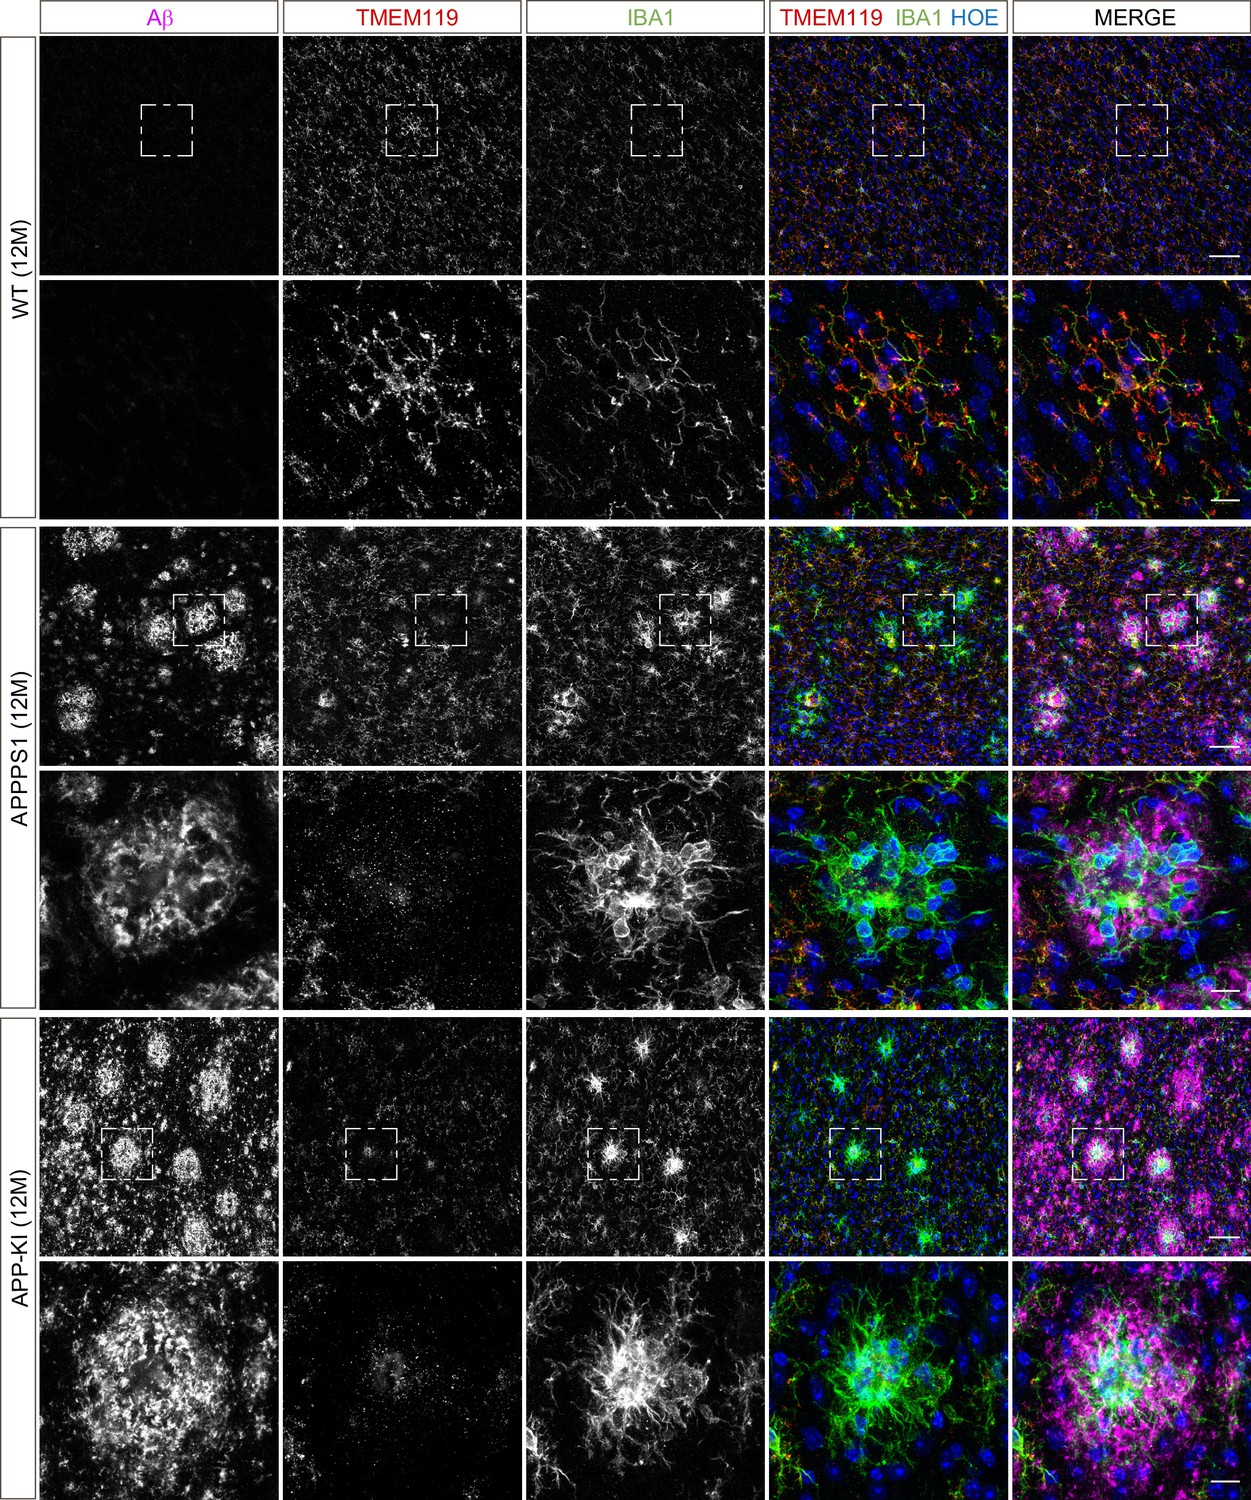
Microglial TMEM119 is down-regulated in both AD mouse models at 12 months of age.
Immunohistochemical analysis of TMEM119 (red) shows a broad coverage signal of this homeostatic marker in IBA1 positive (green) WT microglia. In the APPPS1 and APP-KI mice, TMEM119 signal is reduced in IBA1 positive microglia surrounding Aβ plaques (magenta). Of note, increased TMEM119 signal was often found in the core of amyloid plaques in APPPS1 and APP-KI mice. Hoechst (HOE, blue) was used for nuclear staining. Boxed regions in upper panels (scale bar: 50 µm) are shown with a higher magnification in lower panels (scale bar: 10 µm) and illustrate reduced levels of TMEM119 in plaque associated microglia.
Figure 8 with 1 supplement
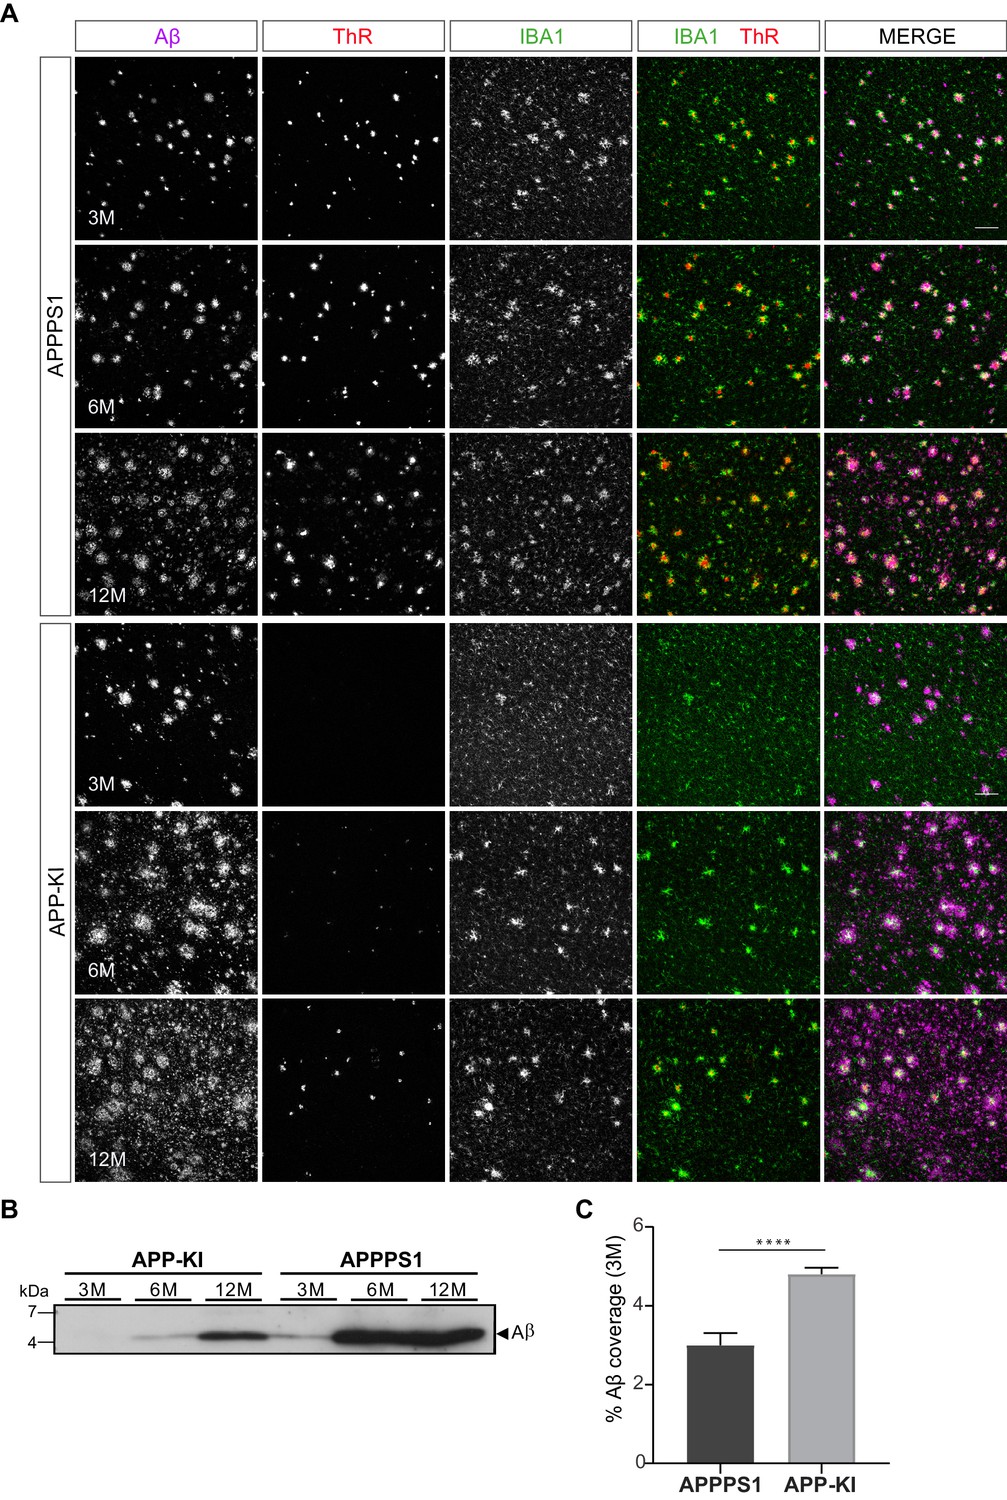
APPPS1 Aβ plaques display a higher content of fibrillar Aβ compared to the APP-KI plaques.
(A) Immunohistochemical analysis showing total Aβ (magenta), fibrillar Αβ (ThR, red) and microglia (IBA1, green) in both mouse models at 3, 6 and 12 months of age. Scale bar: 100 µm B). Western blot analysis of insoluble Αβ at 3, 6 and 12 months of age confirms increased levels of fibrillar Αβ in APPPS1 compared to the APP-KI mice. (C). Quantification reveals increased total Αβ coverage in 3 month old APP-KI compared to the APPPS1 mice. Values are expressed as percentages of area covered by total Αβ and calculated as the mean (± SD) from N = 4 mice (****p<0.0001, unpaired two-tailed Student’s T-test).
Figure 8—figure supplement 1
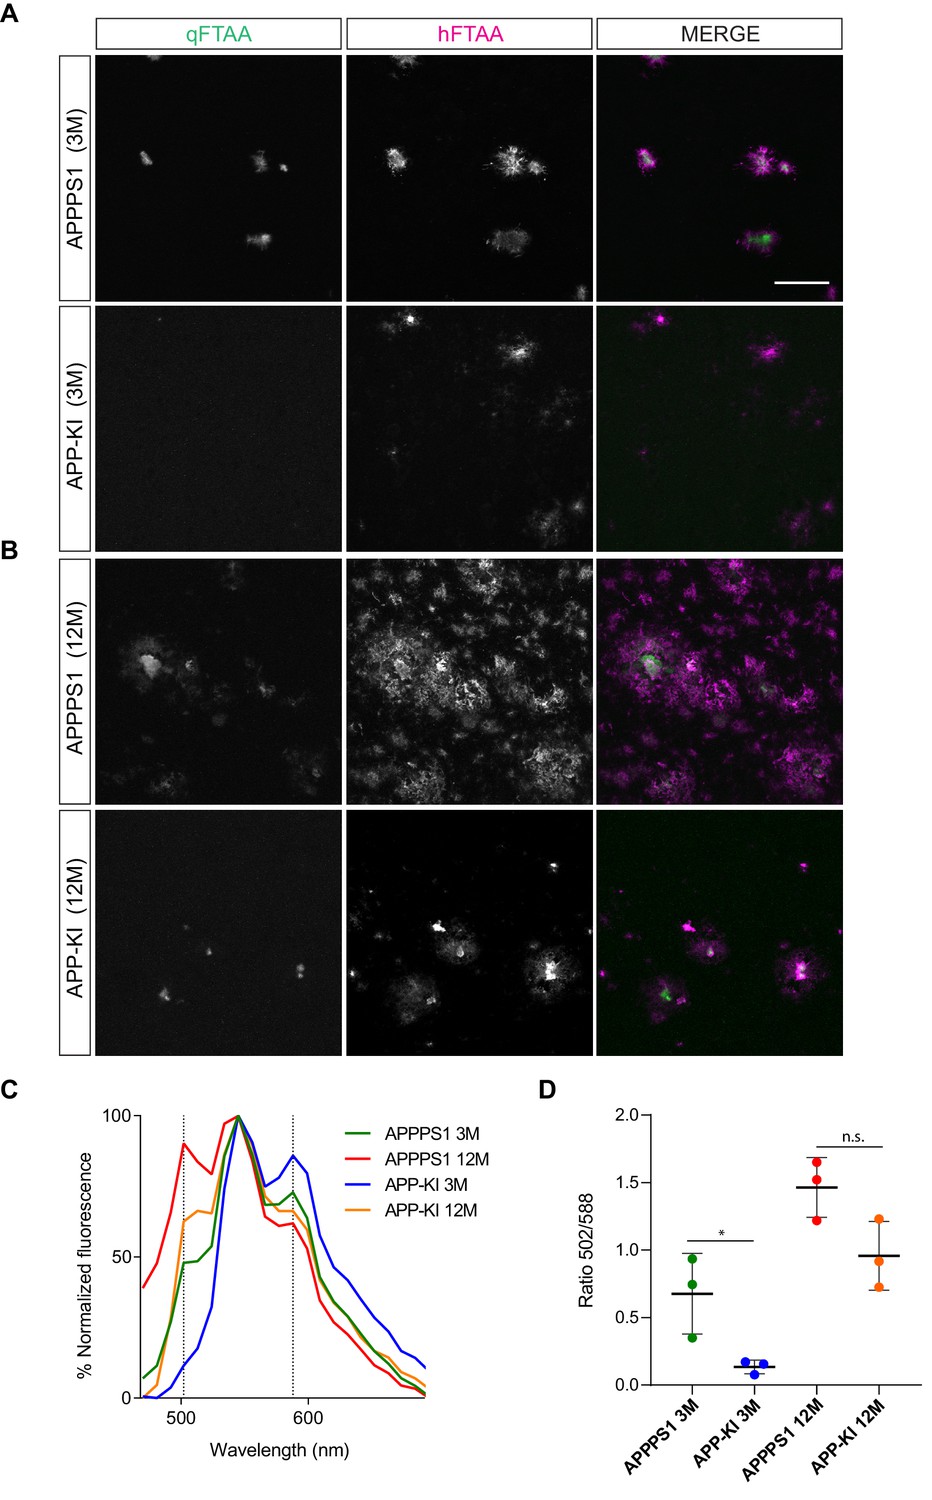
Amyloid plaque spectral characteristics show differences between 3 month old APPPS1 and APP-KI mice.
Representative images of LCOs (qFTAA in green and hFTAA in magenta) in 3 (A) and 12 month old (B) APPPS1 and APP-KI mice. Scale bar: 50 µm. (C) Mean LCOs fluorescence spectra of plaque cores in both mouse models at 3 and 12 months. (D) Quantification of the mean ratio of the fluorescence intensity at 502 nm and 588 nm (fluorescence emission peaks of qFTAA and hFTAA, respectively). Individual values from N = 3 mice per age and genotype ± SD are represented (*p<0.05; unpaired two-tailed Student’s T-test; n.s.: not significant).
Figure 9 with 1 supplement

Fibrillar Aβ triggers higher microglial recruitment in 3 month old APPPS1 mice and correlates with a phagocytic impairment.
(A) IBA1 positive (green) microglia polarize towards the fibrillar Aβ core (ThR, red, white arrow), rather than to the surrounding plaque halo (magenta) in 3 month old APPPS1 and APP-KI mice. Hoechst (HOE, blue) was used for nuclear staining. Yellow arrows indicate intracellular fibrillar Aβ within APPPS1 microglia. Scale bar: 10 µm. (B) Quantification of IBA1 positive cells recruited to amyloid plaques in 3 month old APPPS1 and APP-KI mice. Microglial numbers are normalized to the plaque area. (C) Quantification of plaque size in 3 month old APPPS1 and APP-KI mice. (D) Immunohistochemical analysis of IBA1 (green) and CD68 (red) positive microglial cells recruited to Aβ plaques (magenta) in 3 month old APPPS1 and APP-KI mice. Hoechst (HOE, blue) was used for nuclear staining. Scale bar: 20 µm. (E) Quantification of CD68 coverage per single plaque in 3 month old APPPS1 and APP-KI mice. CD68 coverage is normalized to the plaque area. (F) Quantification of CD68 coverage per microglia in 3 month old APPPS1 and APP-KI mice. CD68 coverage is normalized to the number of IBA1 positive cells recruited to amyloid plaque. (G) Immunohistochemical analysis of microglia (IBA1, green) associated to dystrophic neurites (APP, red) in 3 month old APPPS1 and APP-KI mice. Aβ plaque was visualized using an antibody against Aβ (magenta) and Hoechst (HOE, blue) was used for nuclear staining. Scale bar: 10 µm. (H) Quantification of area covered by dystrophic neurites in 3 month old APPPS1 and APP-KI mice. (I) Quantification of IBA1 positive cells associated to dystrophic neurites in 3 month old APPPS1 and APP-KI mice. Number of microglia quantified per single plaque are normalized to its corresponding dystrophic neurite area. Values in (B, C), (H), and (I), are expressed as the mean of N = 5 (APPPS1) and N = 4 (APP-KI) mice ± SD and in (E and F) as the mean of N = 3 mice per genotype ± SD (*p<0.05; **p<0.01, unpaired two-tailed Student’s T-test; n.s.: not significant). (J). Mean Fluorescence Intensity (MFI) of E. coli-pHrodo signal within the CD11b positive cells in 3 and 6 month old APPPS1, APP-KI and WT mice. CytoD was used to inhibit phagocytosis and serves as a negative control. a.u.: arbitrary units. (K). Percentage of CD11b and E. coli-pHrodo double positive cells from the total CD11b positive population. In (J and K), values for the 3 month old group are expressed as the mean of N = 3 mice per genotype ± SD and for the 6 month old group as the mean of N = 2 mice per genotype ± SD (***p<0.001, Two-way ANOVA, Dunnett’s multiple comparison test; n.s.: not significant).
-
Figure 9—source data 1
Phagocytosis is impaired earlier in APPPS1 compared to APP-KI microglia.
(A) Histograms represent the fluorescence intensity of uptaken E. coli-pHrodo green particles within the CD11b positive population for every genotype and time point (3 and 6 months). Dashed lines indicate the mean fluorescence intensity (MFI) calculated with the geometric mean for each condition. (B) FACS analysis representing the percentage of CD11b and E. coli-pHrodo positive cells out of the whole CD11b positive population for every genotype.
- https://cdn.elifesciences.org/articles/54083/elife-54083-fig9-data1-v1.pdf
Figure 9—figure supplement 1
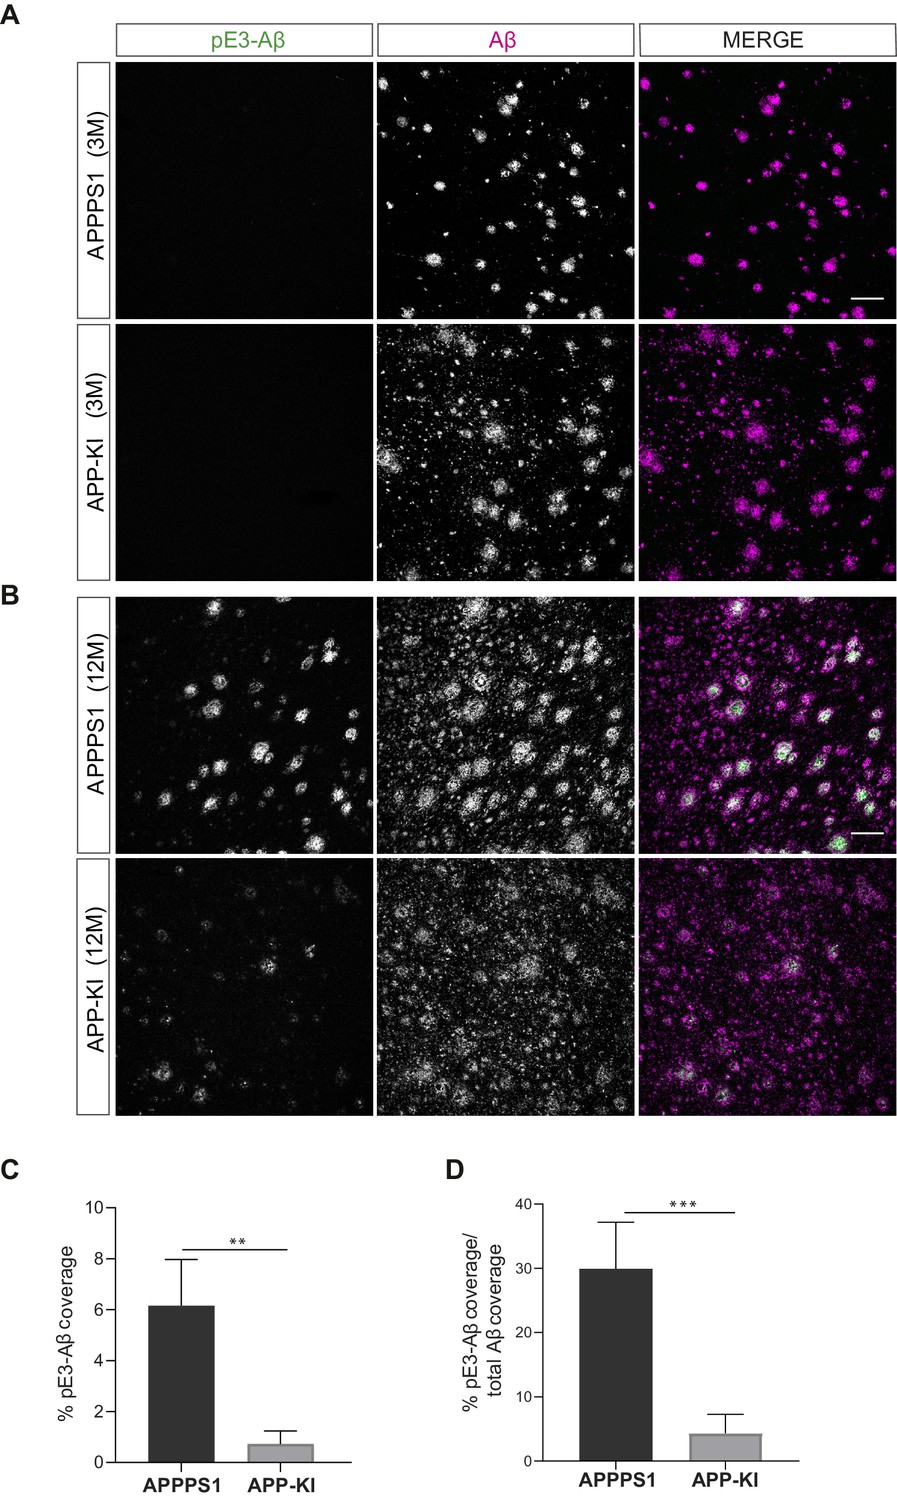
pE3-Aβ does not correlate with early microglial changes in 3 month old APPPS1 mice.
Immunohistochemical analysis of pE3-Aβ (green) compared to the total Aβ area (magenta) in 3 (A) and 12 (B) month old APPPS1 and APP-KI mice. Scale bar: 100 µm. Quantification of pE3-Aβ coverage in 12 month old APPPS1 and APP-KI mice. Values are expressed as percentages of area covered by pE3-Aβ (C) or as percentages of area covered by pE3-Aβ from the total Aβ coverage (D). Values in (C) and (D) are expressed as the mean ± SD from N = 4 mice (**p<0.01, ***p<0.001, unpaired two-tailed Student’s T-test).
Author response image 1
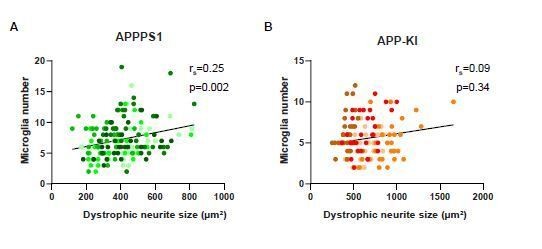
Low correlation between dystrophic neurite size and microglia recruitment.
Correlation and linear regression analysis of dystrophic neurite size and microglia recruitment per plaque in APPPS1 (A) and APP-KI (B) mice. rs indicates the Spearman’s rank correlation coefficient, p<0.05: significant, p≥ 0.05: non significant. Different colors represent biological replicates (APPPS1: N=5 mice, APP-KI: N=4 mice) and the same color is used to show technical replicates.
Tables
Key resources table
| Reagent type (species) or resource | Designation | Source or reference | Identifiers | Additional information |
|---|---|---|---|---|
| Genetic reagent (Mus musculus) | APPPS1 | doi: 10.1038/sj.embor.7400784 | RRID:MGI:5313568 | Heterozygous (C57BL/6 background) |
| Genetic reagent (Mus musculus) | APPNL-G-F (APP-KI) | doi: 10.1038/nn.3697 | RRID:MGI:6160916 | Homozygous (C57BL/6 background) |
| Antibody | Anti-IBA1 (rabbit polyclonal) | Wako | Cat#:019–19741, RRID:AB_839504 | IHC (1:500) |
| Antibody | Anti-IBA1(goat polyclonal) | Abcam | Cat#:ab5076, RRID:AB_2224402 | IHC (1:500) |
| Antibody | Anti-Amyloid beta NAB228 (mouse monoclonal) | Santa Cruz | Cat#:sc-32277, RRID:AB_626670 | IHC (1:2000) |
| Antibody | Anti-CD68 (rat monoclonal) | Bio-Rad | Cat#:MCA1957G, RRID:AB_324217 | IHC (1:500) WB (1:1000) |
| Antibody | Anti-TREM2 (sheep polyclonal) | R and D Systems | Cat#:AF1729, RRID:AB_354956 | IHC (1:50) |
| Antibody | Anti-Amyloid Y188 (rabbit monoclonal) | Abcam | Cat#:1565–1, RRID:AB_562042 | IHC (1:2000) |
| Antibody | Anti-CLEC7a (rat monoclonal) | Invivogen | Cat#:mabg-mdect, RRID:AB_2753143 | IHC (1:50) |
| Antibody | Anti-TMEM119 (rabbit monoclonal) | Abcam | Cat#:ab209064, RRID:AB_2800343 | IHC (1:200) |
| Antibody | Anti-APOE HJ6.3 (mouse monoclonal) | doi: 10.1084/jem.20121274 | IHC (Biotinylated, 1:100) | |
| Antibody | Anti-Amyloid beta 3552 (rabbit polyclonal) | doi:10.1523/JNEUROSCI.05.2006 | IHC (1:5000), WB (1:2000) | |
| Antibody | Anti-pE3-Amyloid beta J8 (mouse monoclonal) | doi:10.3390/molecules23040924 | IHC (1:500) | |
| Antibody | Anti-TREM2 5F4 (rat monoclonal) | doi: 10.15252/emmm.201606370 | WB (1:10) | |
| Antibody | Anti-APOE (goat polyclonal) | Millipore | Cat#:AB947, RRID:AB_2258475 | WB (1:1000) |
| Antibody | Anti-CSF1R (rabbit polyclonal) | Cell Signaling | Cat#:3152, RRID:AB_2085233 | WB (1:1000) |
| Antibody | Anti-FABP5 (goat polyclonal) | R and DSystems | Cat#:AF1476, RRID:AB_2293656 | WB (1:400) |
| Antibody | Anti-GAPDH (mouse monoclonal) | Abcam | Cat#:ab8245, RRID:AB_2107448 | WB (1:2000) |
| Antibody | Anti-CD11b-APC-Cy7 (rat monoclonal) | BDBiosciences | Cat#:557657, RRID:AB_396772 | FACS (1:200) |
Additional files
-
Supplementary file 1
Comparison of proteomic results of APPPS1 microglia using DDA and DIA including the average peptide IDs, protein IDs, protein quantifications calculated for all samples, numbers of relatively quantified proteins from 1, 3, 6, and 12 months as well as their averages.
- https://cdn.elifesciences.org/articles/54083/elife-54083-supp1-v1.docx
-
Supplementary file 2
Quantitative proteomic data analysis of APPPS1 (A) and APP-KI (B) versus WT microglia at 1, 3, 6, and 12 months using DIA.
The table shows the number of consistently quantified proteins as well as proteins with a significant up- or down-regulation with and without FDR correction. A log2 fold change >0.5 or<−0.5 and a p-value of less than 0.05 were applied as regulation thresholds. The amount of up-and down-regulated proteins with FDR correction is shown as percentage from the total number of quantified proteins.
- https://cdn.elifesciences.org/articles/54083/elife-54083-supp2-v1.docx
-
Supplementary file 3
Mice sex and biological replicates for the proteomic analysis of microglia.
- https://cdn.elifesciences.org/articles/54083/elife-54083-supp3-v1.docx
-
Supplementary file 4
Optimized mass to charge (m/z) window distribution for Sequential Window Acquisition of all theoretical Mass Spectra (SWATH‐MS) based on DIA.
- https://cdn.elifesciences.org/articles/54083/elife-54083-supp4-v1.docx
-
Supplementary file 5
Mice sex and biological and technical replicates analyzed by immunohistochemistry.
- https://cdn.elifesciences.org/articles/54083/elife-54083-supp5-v1.docx
-
Supplementary file 6
Self-programmed macros from ImageJ software used for quantification of the total Aβ coverage (A) and pE3-Aβ coverage (B).
Explanation of functions is delineated in green.
- https://cdn.elifesciences.org/articles/54083/elife-54083-supp6-v1.docx
-
Supplementary file 7
Mice sex and biological and technical replicates analyzed by FACS.
- https://cdn.elifesciences.org/articles/54083/elife-54083-supp7-v1.docx
-
Transparent reporting form
- https://cdn.elifesciences.org/articles/54083/elife-54083-transrepform-v1.docx
Download links
A two-part list of links to download the article, or parts of the article, in various formats.
Downloads (link to download the article as PDF)
Open citations (links to open the citations from this article in various online reference manager services)
Cite this article (links to download the citations from this article in formats compatible with various reference manager tools)
Fibrillar Aβ triggers microglial proteome alterations and dysfunction in Alzheimer mouse models
eLife 9:e54083.
https://doi.org/10.7554/eLife.54083


